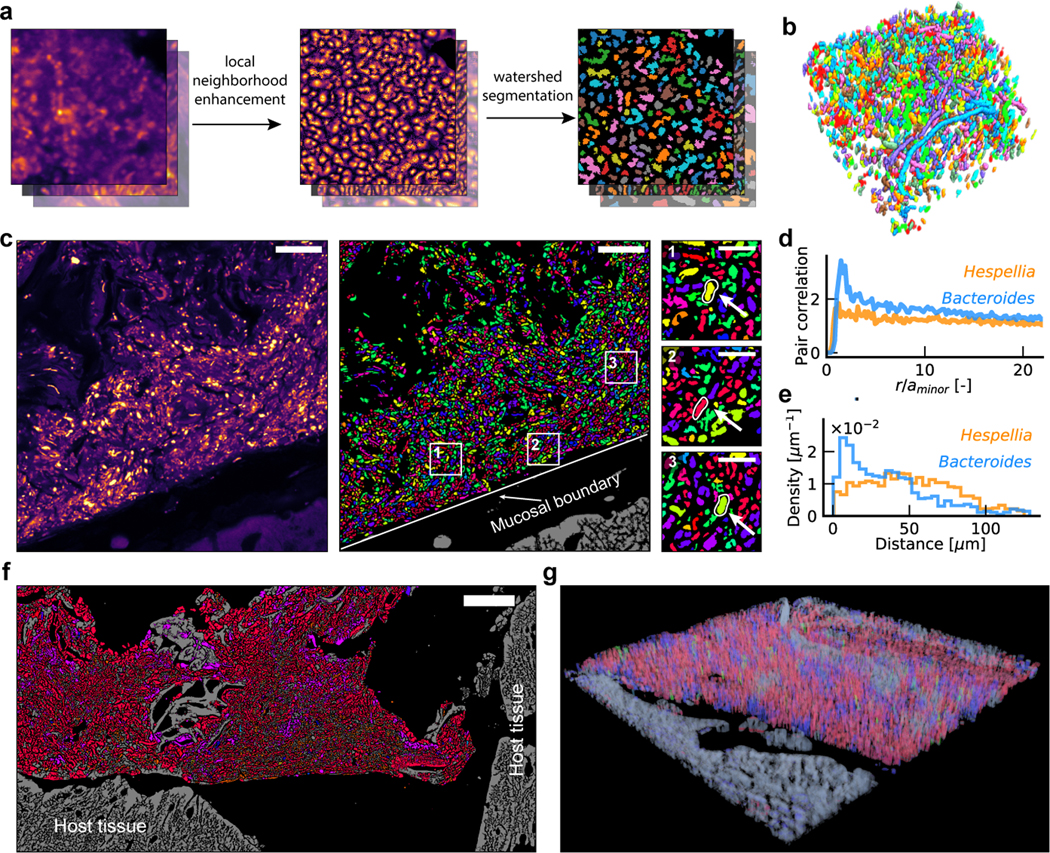
Figure 2. Algorithm for single-cell segmentation.

a, Key steps for image analysis. The contrast for denoised images is enhanced using LNE. Watershed seed masks are generated based on the LNE image, and segmentation is performed using watershed. b, An example of a volumetric segmentation of a human oral biofilm. Different colors correspond to different cells. c, Example segmented and identified images of a mouse colon section, with a few taxa highlighted in enlarged views. Scalebar: 25 μm. The segmentation and identification was repeated for 28 (ciprofloxacin) and 30 (healthy control) fields of view with similar results. d, Pair correlation function shows that Bacteroides cells are likely to form clusters at short ranges, while Hespellia cells exhibit random spatial distribution. e, Histogram of distances to the mucosal barrier reveals that Bacteroides cells are enriched near the mucosal boundary, while Hespellia cells are more evenly distributed away from the mucosal boundary. f, A tile scan of the edge of a fecal pellet from a ciprofloxacin treated mice, covering an area of approximately 266 μm × 546 μm. g, A volumetric rendering of a z-stack collected from a ciprofloxacin treated mice, demonstrating HiPR-FISH compatibility with 3D characterization of tissue samples.
