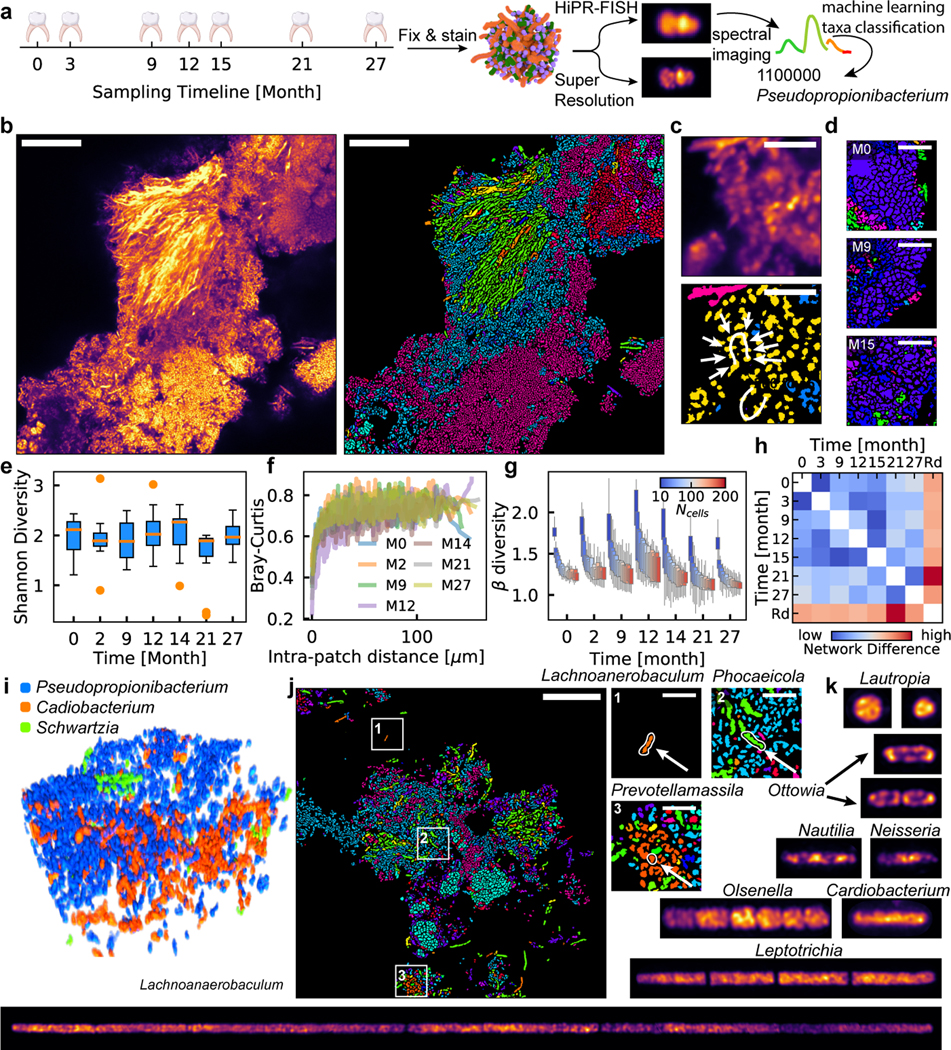
Figure 4. Biogeography of human oral biofilms.

a, Experimental workflow. b, Example FOV of a human oral microbiome. Scalebar: 25 μm. c, Corncob structure formed by cells from the genus of Streptococcus observed in human oral plaque biofilms (upper: denoised, lower: identified). Scalebar: 5 μm. (b) and (c) show example images selected from 12 FOVs. d, Example FOV of Lautropia observed at three timepoints, showing pleomorphic coccoid cluster morphology. Scalebar: 5 μm. Examples selected from 88 FOVs. e, Oral shannon diversity measured using HiPR-FISH remains stable over 27 months. f, Bray-Curtis dissimilarity between patches with the same number of cells increases with intra-patch distance and remains higher than those in the mouse gut at long length-scales. g, Beta diversity of patches of cells in a human oral microbiome shows similar trends across timepoints. n=88 FOVs. In (e) and (g), the center lines show the median value, the bounds of the boxes correspond to 25th and 75th percentile, and the whiskers extend to 1.5 interquartile range. h, Spatial association networks between different timepoints are more similar to each other than to random networks with the same spatial and compositional makeup, suggesting that the human oral microbiome spatial organization is longitudinally stable. i, An example volume of a new consortium composed of Pseudopropionibacterium, Cardiobacterium, and Schwartzia in a healthy oral microbiome. j, Cells from genera that were not targeted in previous studies were detected, including Lachnoanaerobaculum, Phocaeicola, and Prevotellamassila. Scalebar: 25 μm. Example selected from 12 FOVs. k, Super-resolution imaging reveals different ribosomal organization across diverse oral taxa. Raw images are computationally straightened. All image widths are 1.6 μm except for Lachnoanaerobaculum, which has a width of 3.2 μm.
