Abstract
Central venous stenosis is often undiagnosed in patients with hemodialysis vascular access, partly due to imaging difficulties. Noninvasive, point-of-care detection could rely on detecting regions of turbulent blood flow caused by blood velocity changes. Here we present flexible microphone arrays for time-correlated measures of blood flow sounds and a new signal processing approach to calculate time correlation between spectral features. Continuous wavelet transform was used to produce an auditory spectral flux analytic signal, which was thresholded to identify systolic start and end phases. Microphone arrays were tested on pulsatile flow phantoms with blood flow rates of 850–1,200 mL/min and simulated stenosis from 10–85%. Measured results showed an inversion in the time onset of systolic spectral content for sites proximal and distal to stenosis for hemodynamically significant stenoses (+22 ms for stenosis<50% and −20 to −38 ms for stenosis>50%). Equivalent blood velocity increases were calculated as 142–155 cm/s in stenotic phantoms, which are within the physiologic range as measured by ultrasound.
I. Introduction
Central venous stenosis, a narrowing of the veins in the chest, is most commonly seen in patients on hemodialysis due to increased blood flow in arteriovenous shunts. This condition can cause enlargement or damage of an affected limb and can lead to loss of vascular access if not detected and treated before occlusion occurs [1]. Detection of central venous stenosis is difficult because patients can have this condition for years before becoming symptomatic and requiring rapid intervention. As a result, central venous stenosis remains undiagnosed for nearly 3 years on average, because routine screening for this condition is not performed [2].
Vascular stenosis is most commonly detected using imaging such as contrast angiography and Doppler ultrasound. One method using Doppler ultrasound relies on measuring blood velocity, which increases in the region of stenosis because blood is incompressible. Standard assessments include measuring peak systolic blood velocity and systolic-diastolic velocity differences to predict the presence of significant stenosis [3]. Unfortunately, ultrasound most often cannot be used to detect central venous stenosis (particularly in the subclavian vein) because imaging is blocked by skeletal bones. Options for point-of-care surveillance of central venous stenosis are therefore limited to physical examination [4].
Auscultation of blood flow sounds (bruits) by stethoscope can often detect subclavian or cephalic stenosis over the shoulder or under the clavicle. Auscultation, however, requires a sensitive ear, expertise, and does not provide quantitative values needed to detect changing stenosis over time. Prior work in digital analysis of bruits (phonoangiography) has established that spectral analysis can estimate stenosis severity and assist in point-of-care screening and surgical follow-up [5]–[7]. Because central stenoses are often long and non-focal, analysis of bruits from multiple locations are needed to identify stenotic regions. Multi-site recordings, additionally, may be analyzed for time- and spectral correlation, permitting blood velocity estimation and more precise stenosis detection.
Here, we present a new technique to detect changes in blood velocity using phonoangiography (Fig. 1). Section II describes microphone arrays which were developed to support high time and spatial resolution needed for accurate quantification of degree of stenosis (DOS) based on velocity shifts. Section II also introduces a new spectral-temporal signal processing technique used to automatically detect time correlation of spectral features between adjacent recording sites. Finally, Section IV presents stenosis classification and blood velocity estimation based on in vitro testing under controlled physiologic conditions.
Figure 1.
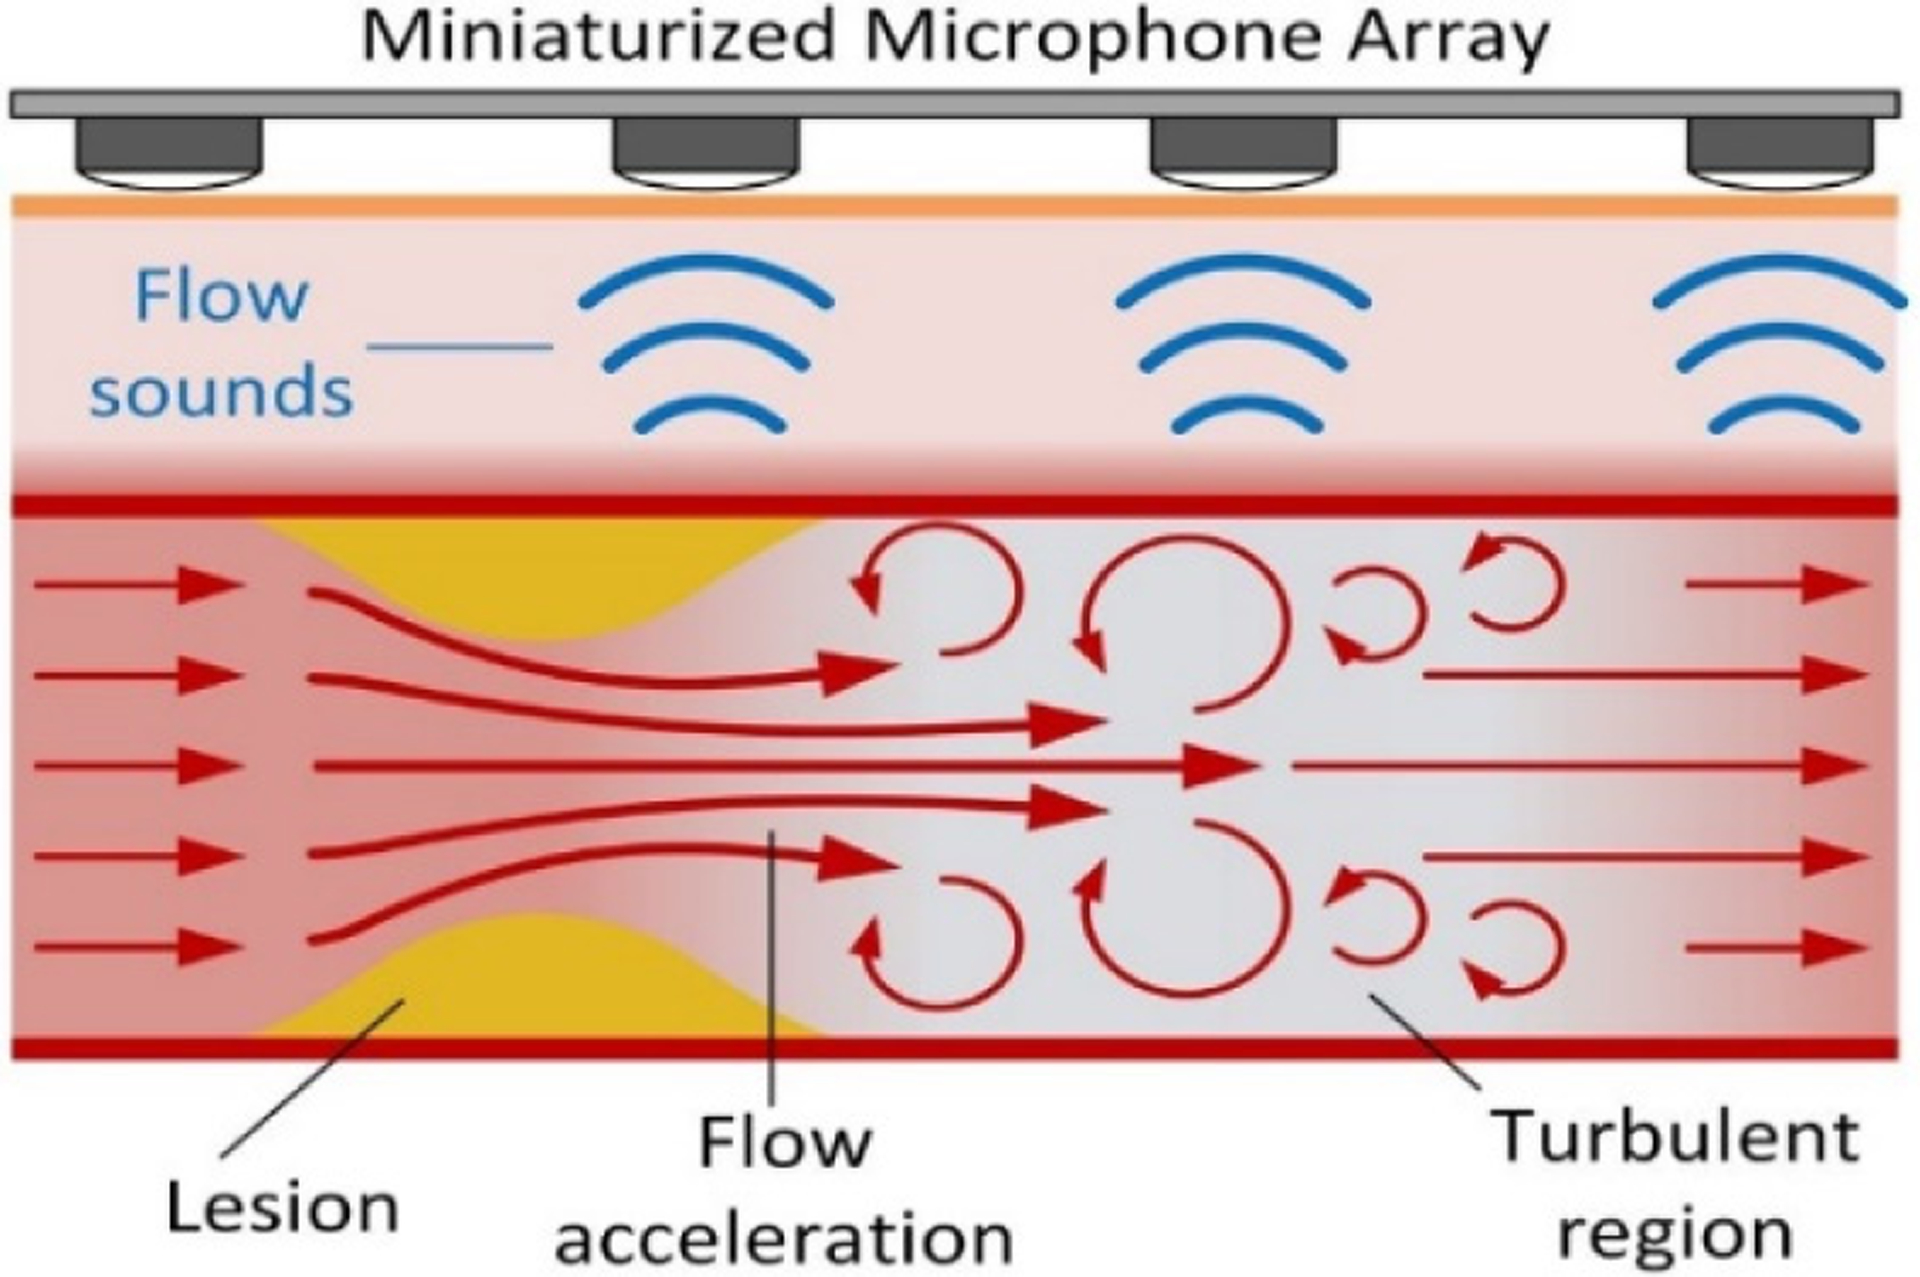
Central venous stenosis may be detected and quantified using flexible microphone arrays capable of detecting regions of turbulent blood flow produced in the region distal to stenosis.
II. Methodology
A. Flexible sensor construction
A prototype 5-channel microphone array was constructed using 28-μm silver ink metallized polyvinylidene fluoride (PVDF) film (Measurement Specialties) with a microphone diaphragm size of 2 mm (Fig. 2A). Films were cut into required size using a laser cutter (Versa LASER, Models VLS 2.30 and VLS 3.50) and was sandwiched between two identical printed circuit boards with annular electrical contacts surrounding drilled holes to electrically contact each side of the film separately [6]. Dual-layer flexible circuit boards were fabricated using 100-μm polyimide substrates finished in electroless nickel immersion gold. Sensor assembly used silver epoxy to attach PVDF films to flexible printed circuits; sensors were sandwiched between circuit boards to contact both sides. After assembly, microphones were finished by coating one side in 0.15-mm thick silicone rubber (Ecoflex 00–10) and the other side with 0.1-mm thick silicone gel (Dow Corning Sylgard 527) to improve acoustic matching to tissue [6]. Although 5-channel arrays were developed for in vitro testing, larger arrays could be used clinically to cover wider regions.
Figure 2.
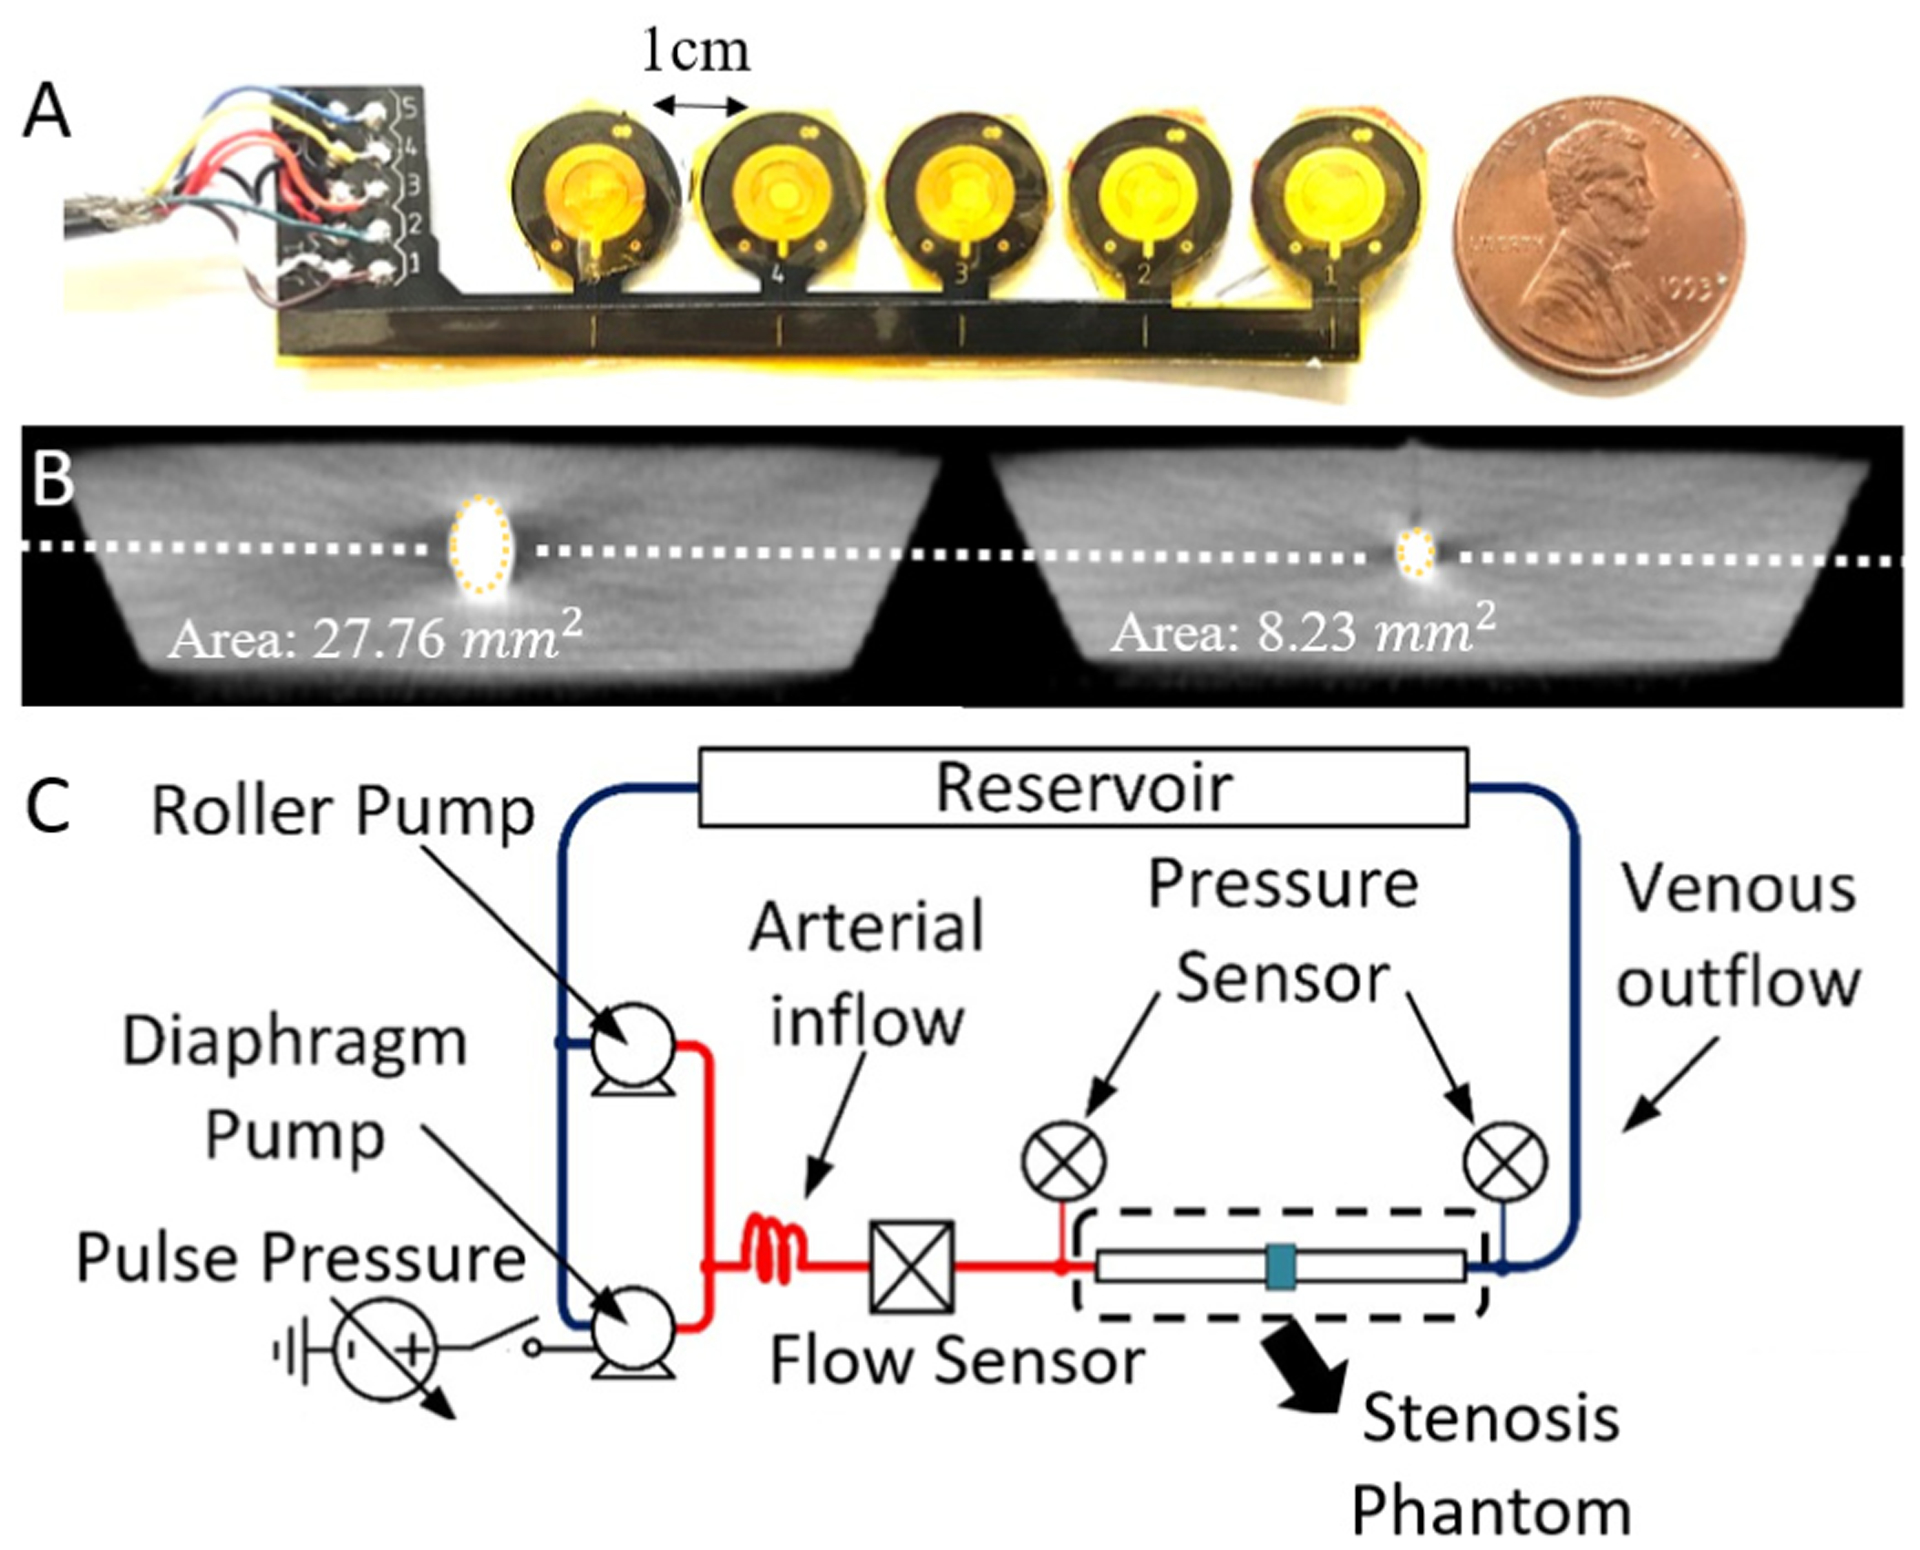
5-channel flexible microphone arrays used polyimide flexible circuit boards and 2-mm PVDF microphones (A). Vascular phantoms with varying DOS cast in tissue-mimicking silicone and DOS was confirmed by CT scan (B). Phantoms were tested over physiologic patterns of blood flow using a pulsatile pumping system (C).
B. In vitro vascular flow phantom
The in vitro stenosis phantom was prepared with a 6 mm silicone tube (McMaster-Carr) with a band tied around the tube to produce an abrupt narrowing before casting in tissue-mimicking silicone rubber (Ecoflex 00–10). The vessel was molded to a depth of 6 mm to simulate typical cephalic vein depth at the shoulder. After casting, DOS was confirmed using CT imaging of the vascular phantom (Fig. 2B). The phantom was connected to a computer-controlled pulsatile pump (Cole Parmer MasterFlex L/S and Shurflo 4008) to simulate blood flows from 850–1200 mL/min at systolic pressure of 90–180 mmHg (Fig. 2C). During testing, the microphone arrays were placed on top of the phantom with the sites aligned along the path of blood flow. A data acquisition system sampled each channel simultaneously at 10 kHz.
C. Signal processing
After bruits were recorded from the sensor, they were first processed using a custom filter based on sub-band frequency domain linear prediction [8]. This filter basically enhanced the systole segment of a pulse while reducing inter-systole disturbances. In this work we modeled spectral acceleration in the time domain using the Auditory Spectral Flux (ASF) signal derived from the coefficients of continuous wavelet transform (CWT) using the Morlet wavelet. ASF was calculated as:
| (1) |
Where W[k,n] is the continuous wavelet transform obtained over K total scales [9] (Fig. 3).
Figure 3.
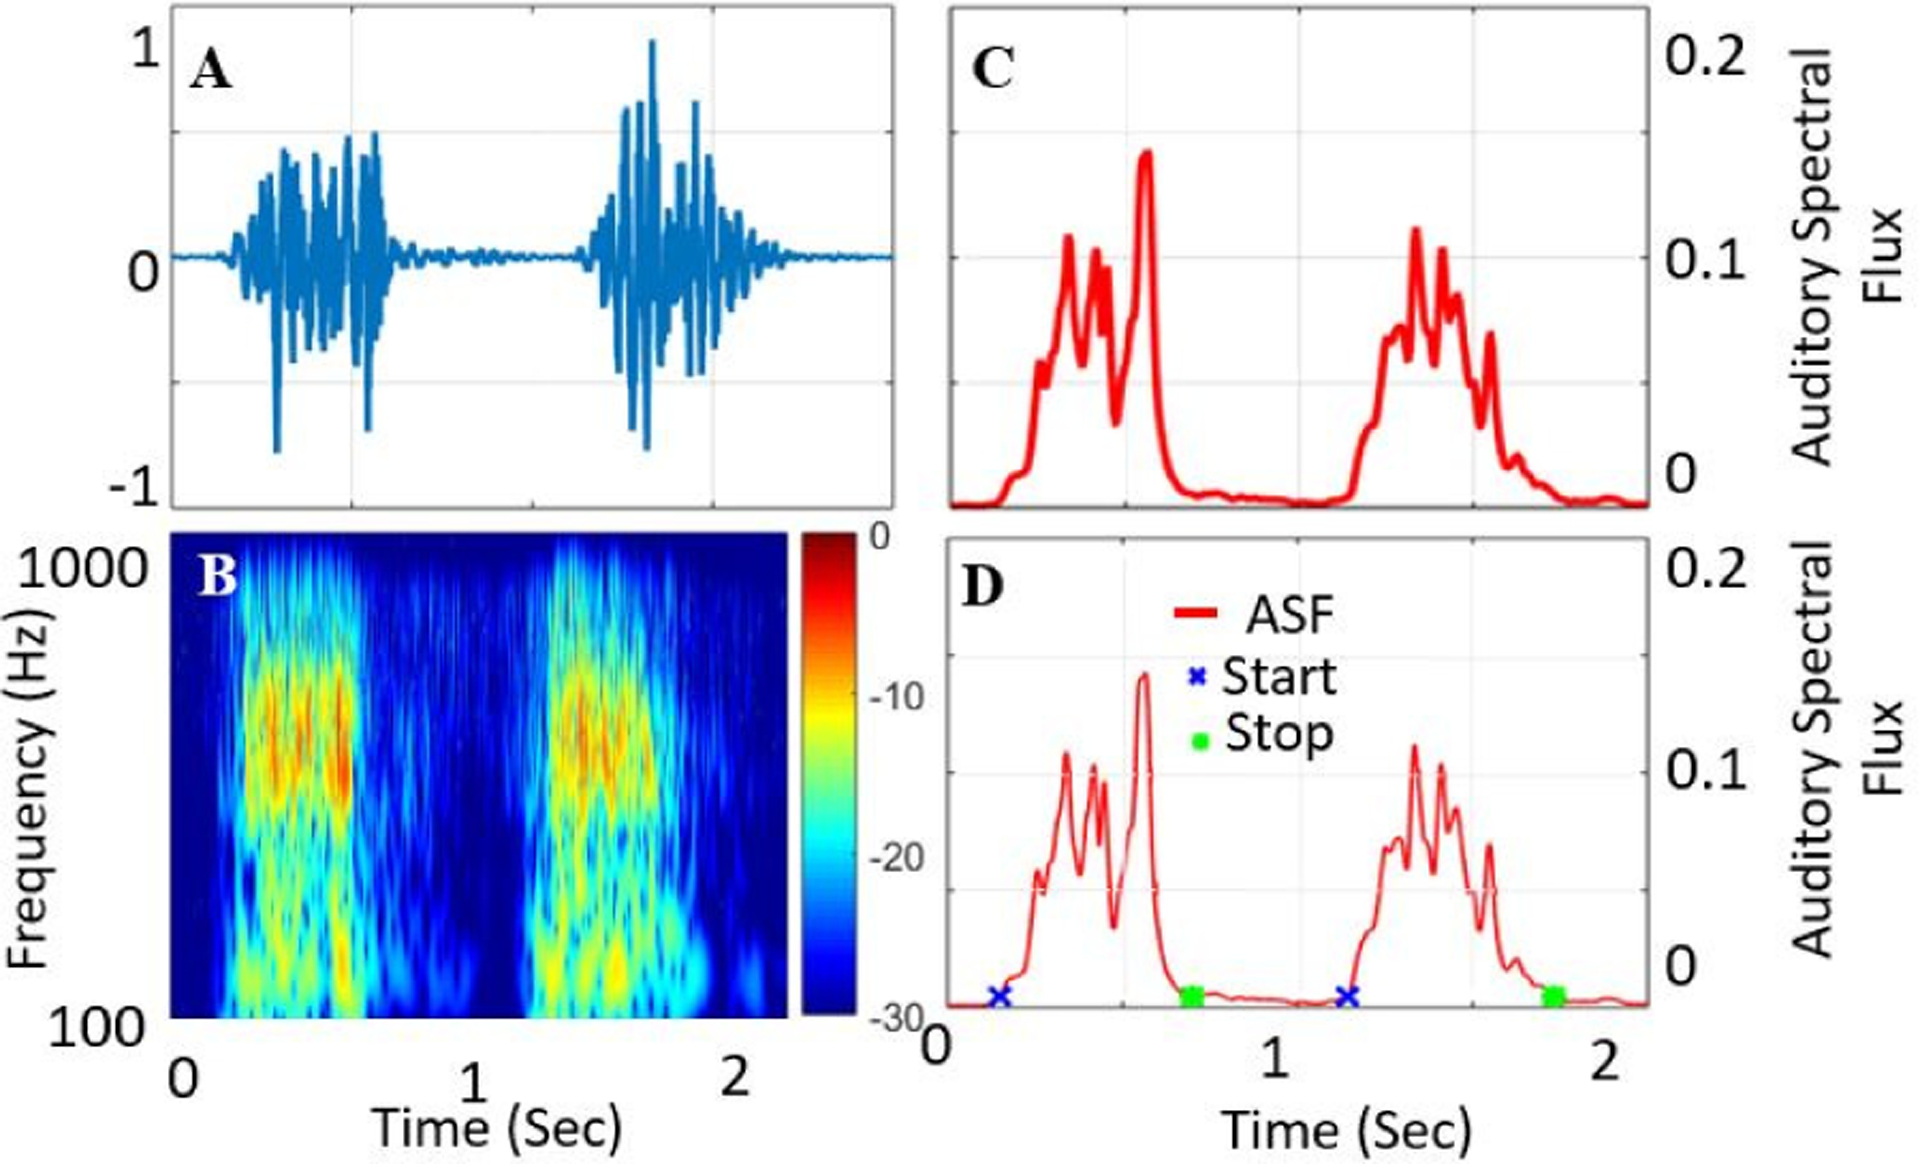
Time-domain blood sound (A) and CWT spectral domain (B). The analytic signal Auditory Spectral Flux was extracted using CWT coefficients (C) and systolic start/end times were calculated by thresholding (D).
ASF approximates a spectral first derivative of the signal and so estimates the temporal-spectral envelope of the signal since it indicates regions of high flux between coefficients of the CWT. Although it appears similar to the Hilbert envelope, ASF is calculated directly from CWT coefficients and not by inverse reconstruction, therefore it is not an analytic signal.
Thresholding of ASF was performed to identify systolic and diastolic phases. Identification of these phases is essential for blood velocity calculation, because flow acceleration only occurs on the high-pressure systolic pulse. Threshold selection was performed at varying percentages of the ASF RMS value. Optimization required a tradeoff between rejecting ASF spurs in the diastolic period (higher threshold) and maximizing systolic pulse width for improved velocity accuracy (lower threshold). A threshold of 25% of ASF RMS was chosen to balance these tradeoffs (Fig. 4).
Figure 4.
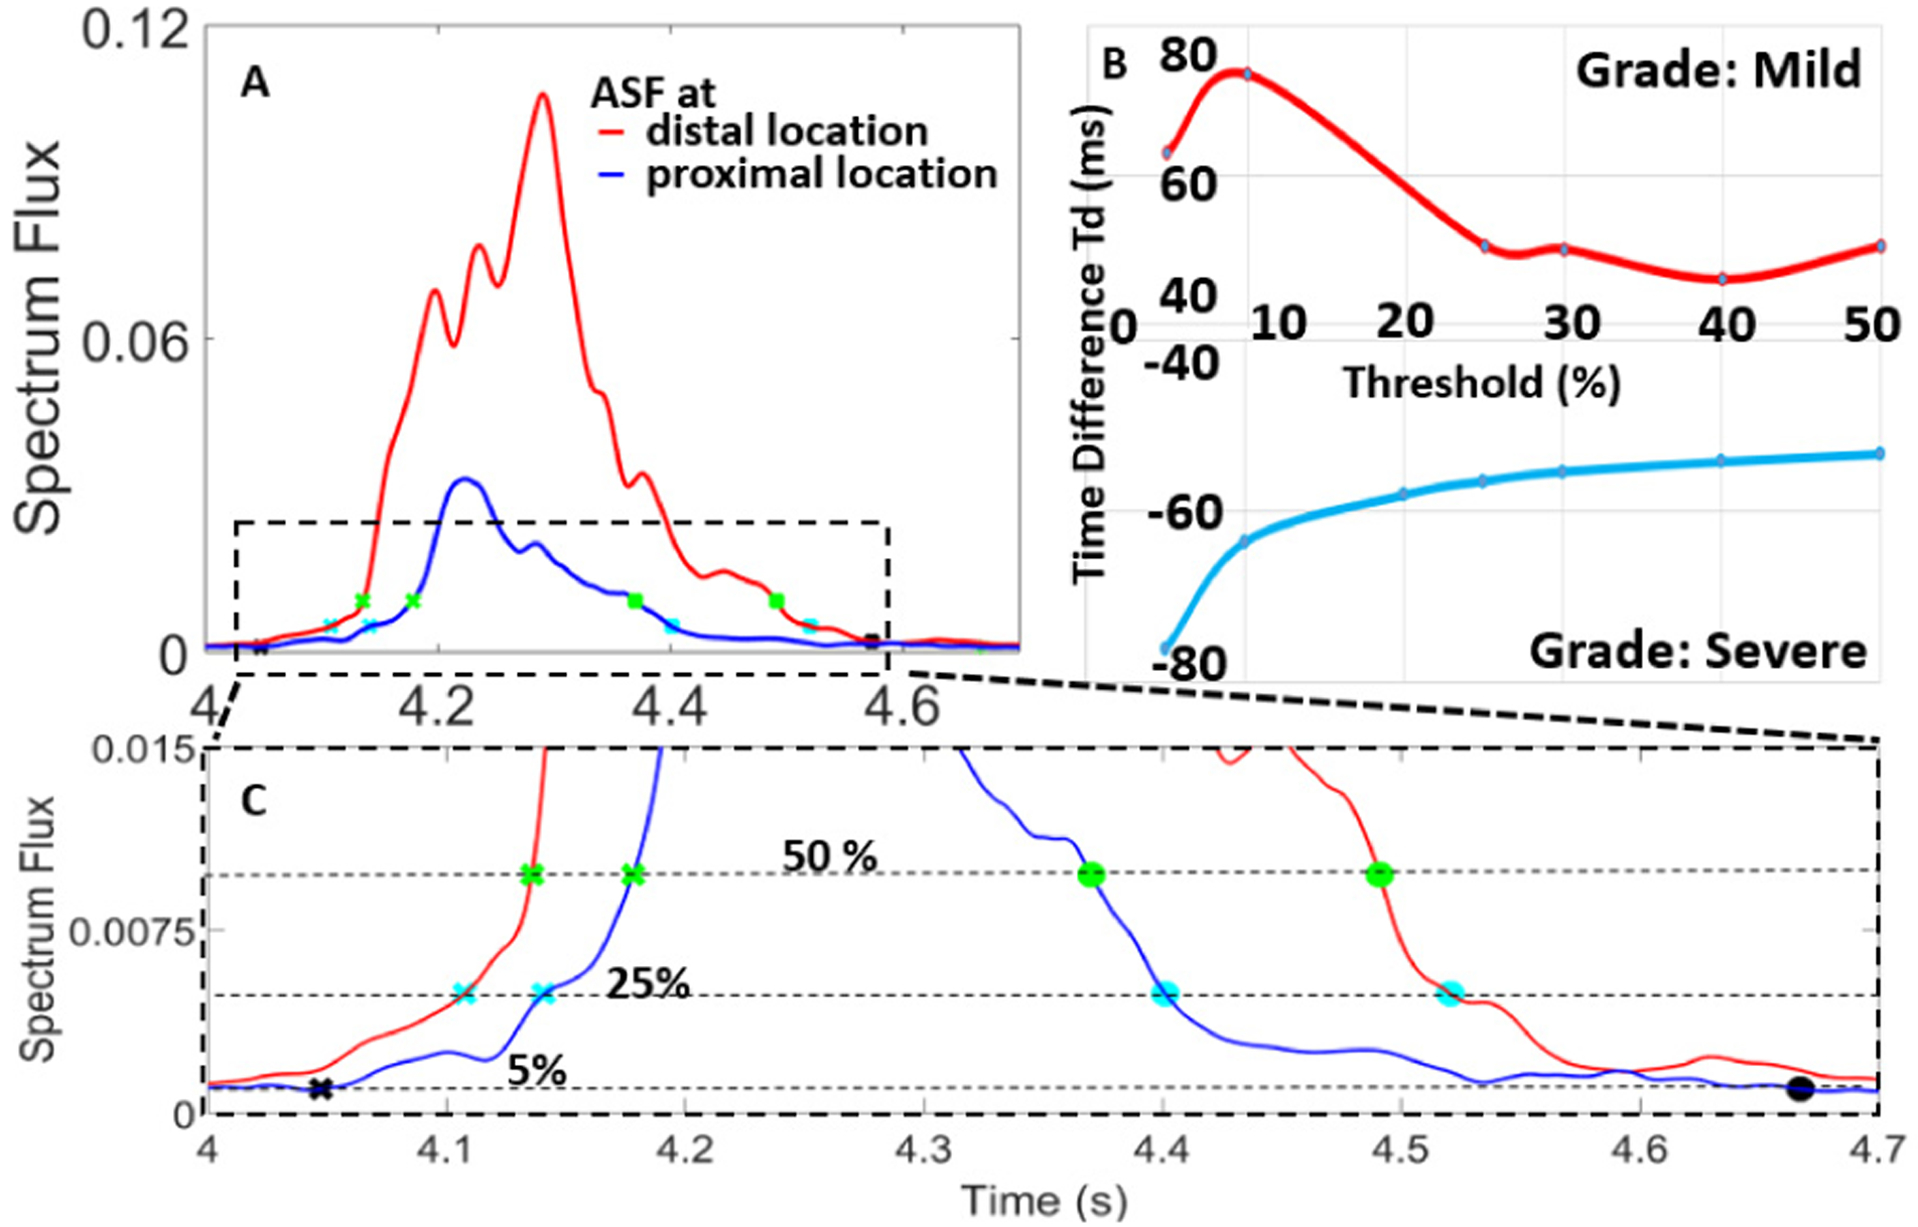
ASF onset detection through multiple threshold points (A). Performance of Td showed a saturation at 25% of ASF RMS value (B). At threshold 5% onset is missed while at threshold 50%, pulse width is underestimated (C).
The 25% of ASF RMS threshold was calculated for each recording to detect onset and end of the systole. This level was chosen empirically from data recordings to provide reliable pulse detection. The pulse width was calculated as the difference between the start and end of the pulse. This width was used for filtering to reduce the chances of faulty cross-point detection and other artifacts in two stages. In the first stage, longest width was calculated from all the pulses while in the second stage 40% of that width was chosen as the minimum width criteria and 1 second was chosen as the maximum based on established systolic segmentation approaches [10].
D. Temporal-spectral feature extraction
In our previous work we have demonstrated that site-to-site spectral differences can be compared to automatically estimate stenosis location [11]. In this work, we focus not on stenosis localization, but classification. For brevity, we only present features from locations taken 1 cm proximal to stenosis and 2 cm distal. These locations were selected because of the presence of turbulent flow as described in previous studies [12], [13].
Time differences between ASF threshold crossing, Td, were calculated as the difference between cross-point at proximal location (Tproximal) and cross-point at distal location (Tdistal), i.e. Td = Tproximal – Tdistal (Fig. 5).
Figure 5.
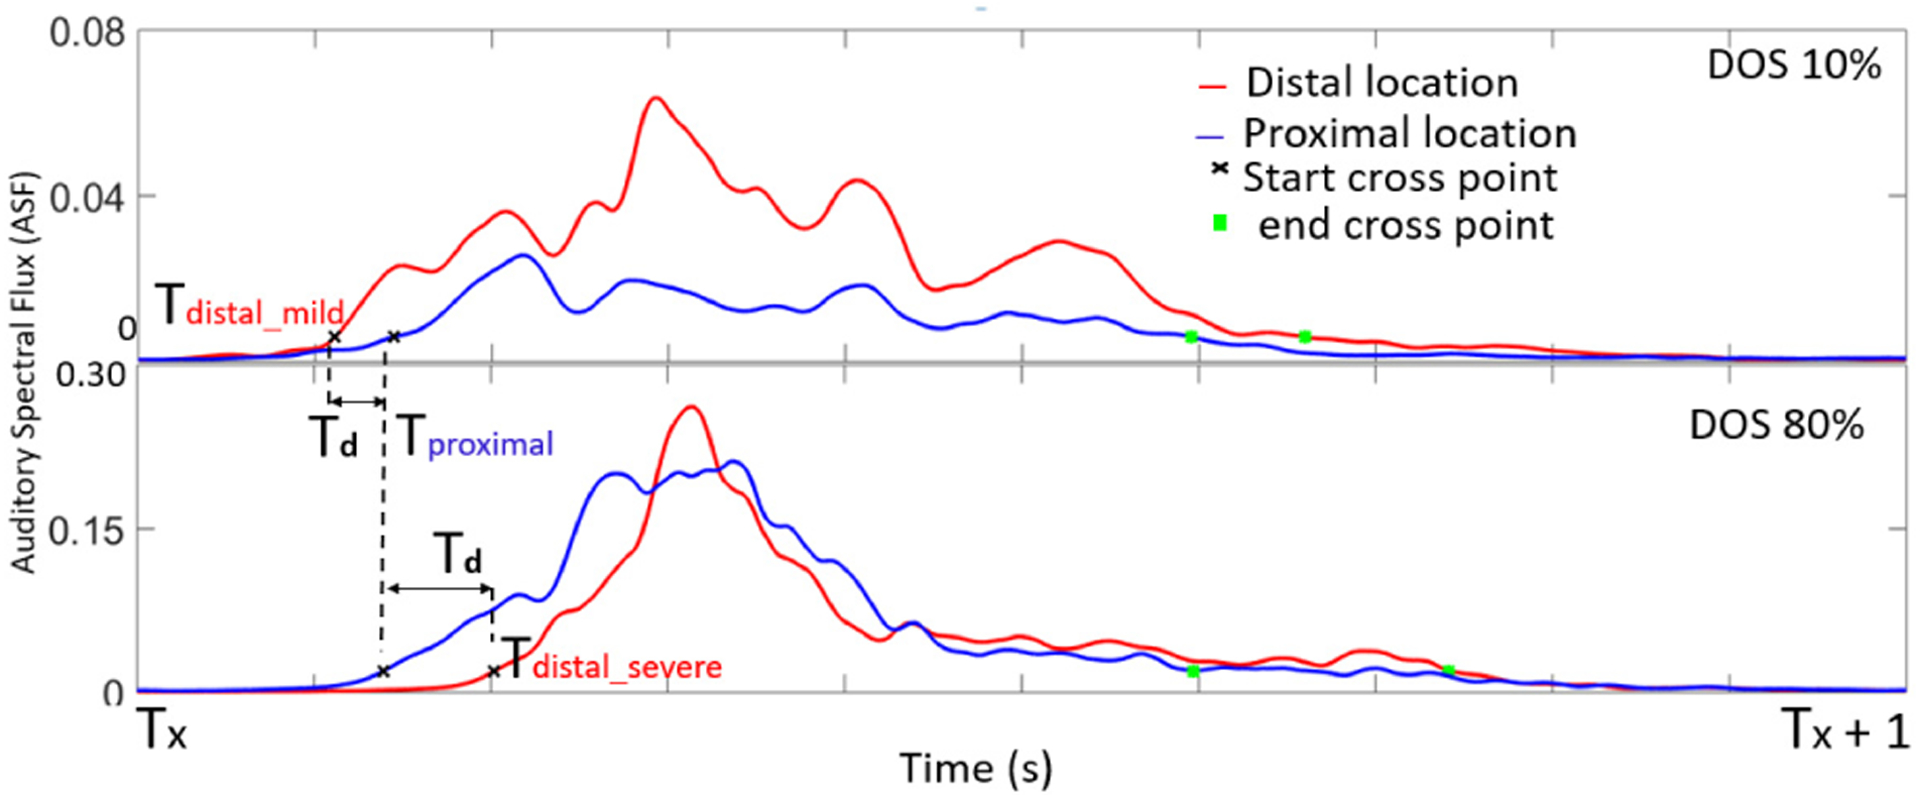
ASF calculated at proximal and distal locations showed an inversion in Td. At moderate and severe DOS, Td became negative, suggesting flow velocity increase.
Td was measured over the range of all the physiological flow rates and it was relatively intolerant to flow rate (Fig. 6). This suggested that DOS and blood velocity change could be calculated independent of flow rate, which varies between patients.
Figure 6.
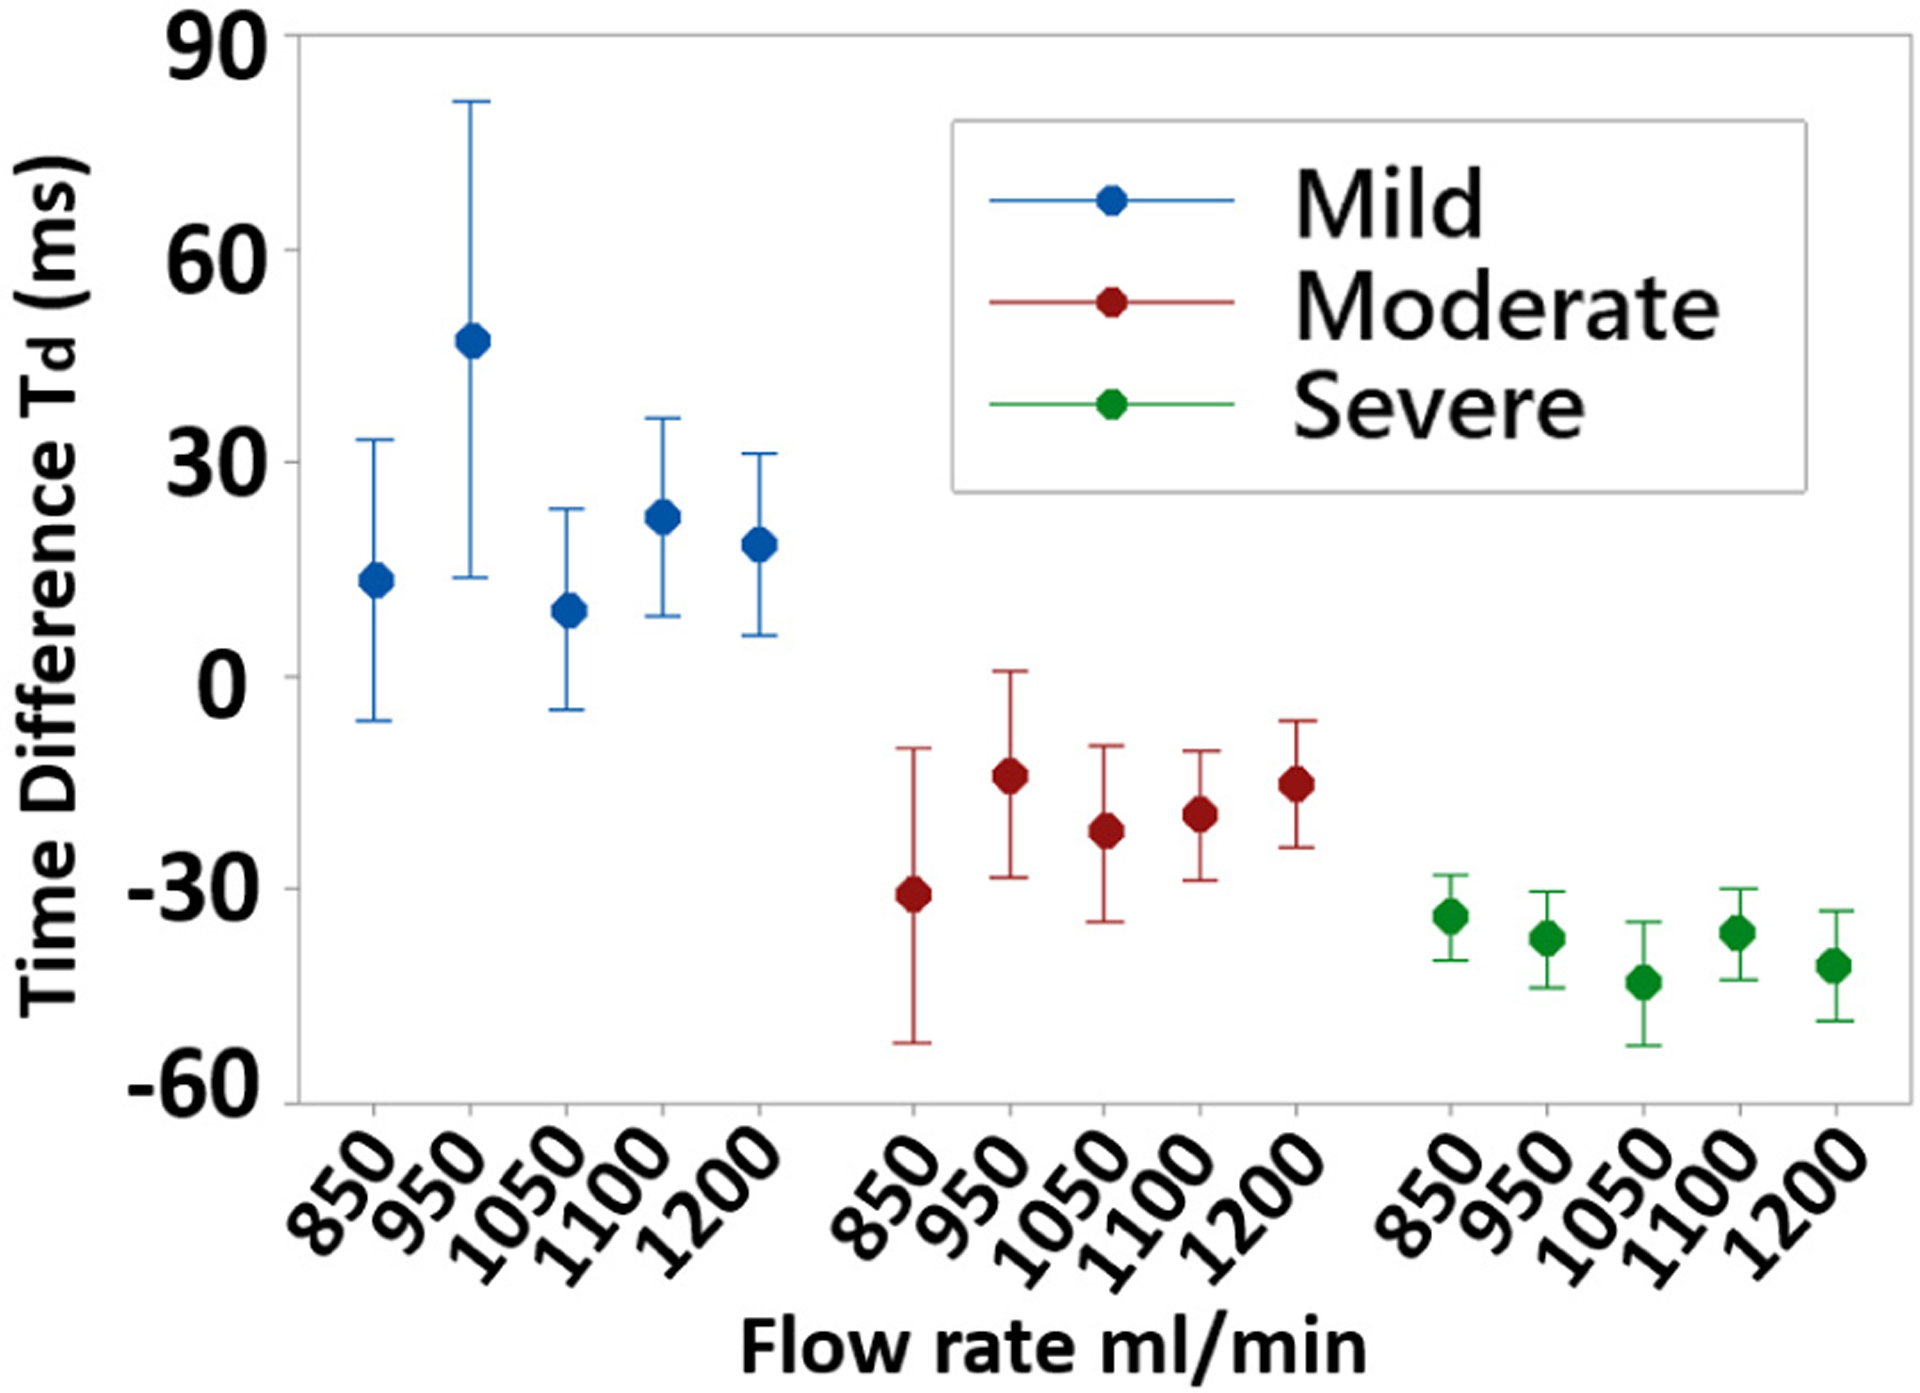
Td over the range of flow rates and DOS grade. Td dependence on flow was low, suggesting that DOS can be assessed independent of patient-variable flow rates.
Stenosis classification based on Td was performed by grouping tested phantoms into 3 grades of DOS: mild (DOS < 40%), moderate (40%<D0S<60%) and severe (DOS > 60%). Time differences were unique between all groups (p<0.001, n=50, balanced ANOVA) and showed a monotonic behavior (Fig. 7) depending on DOS. For hemodynamically significant stenoses (moderate and severe classes), an inversion in Td was seen, such that distal sites showed systolic ASF increase before proximal sites.
Figure 7.
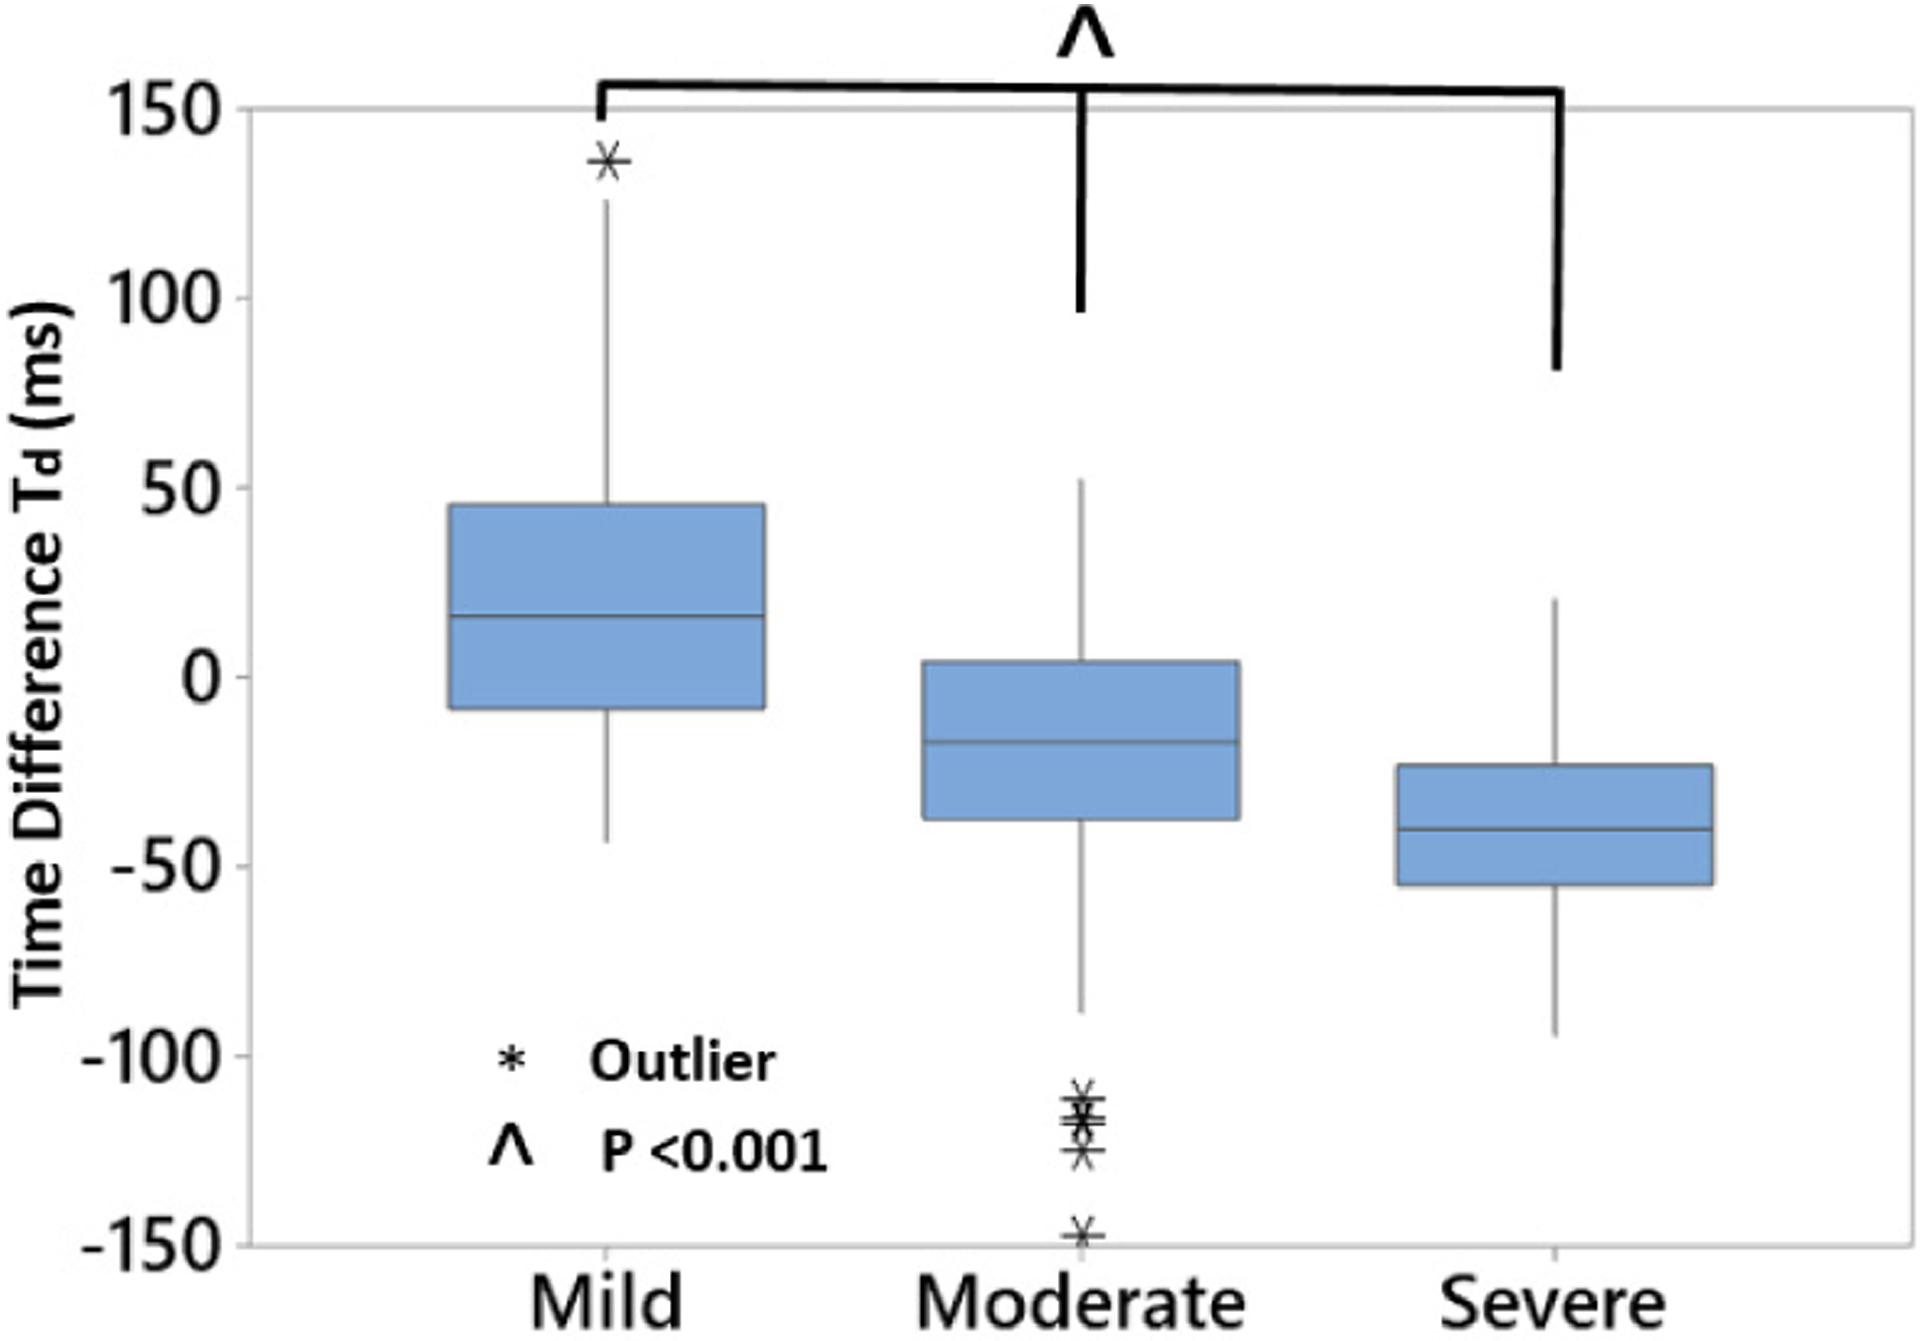
Td demonstrated a monotonic relation to degree of stenosis (p<0.001, n=50). For hemodynamically significant stenoses (DOS>50%), Td became negative, suggesting flow velocity increase causing increased spectral flux at locations downstream of stenosis.
To quantify the flow acceleration, velocity increase was calculated as the distance between the recording sites (3 cm) divided by the Td (Fig. 8). Over all ranges of flow and DOS, mean calculated velocity increase was 142 and 155 cm/s from mild to moderate and severe DOS. This result was within the expected physiological range for blood velocity in 6-mm caliber vessels [14], [15].
Figure 8.
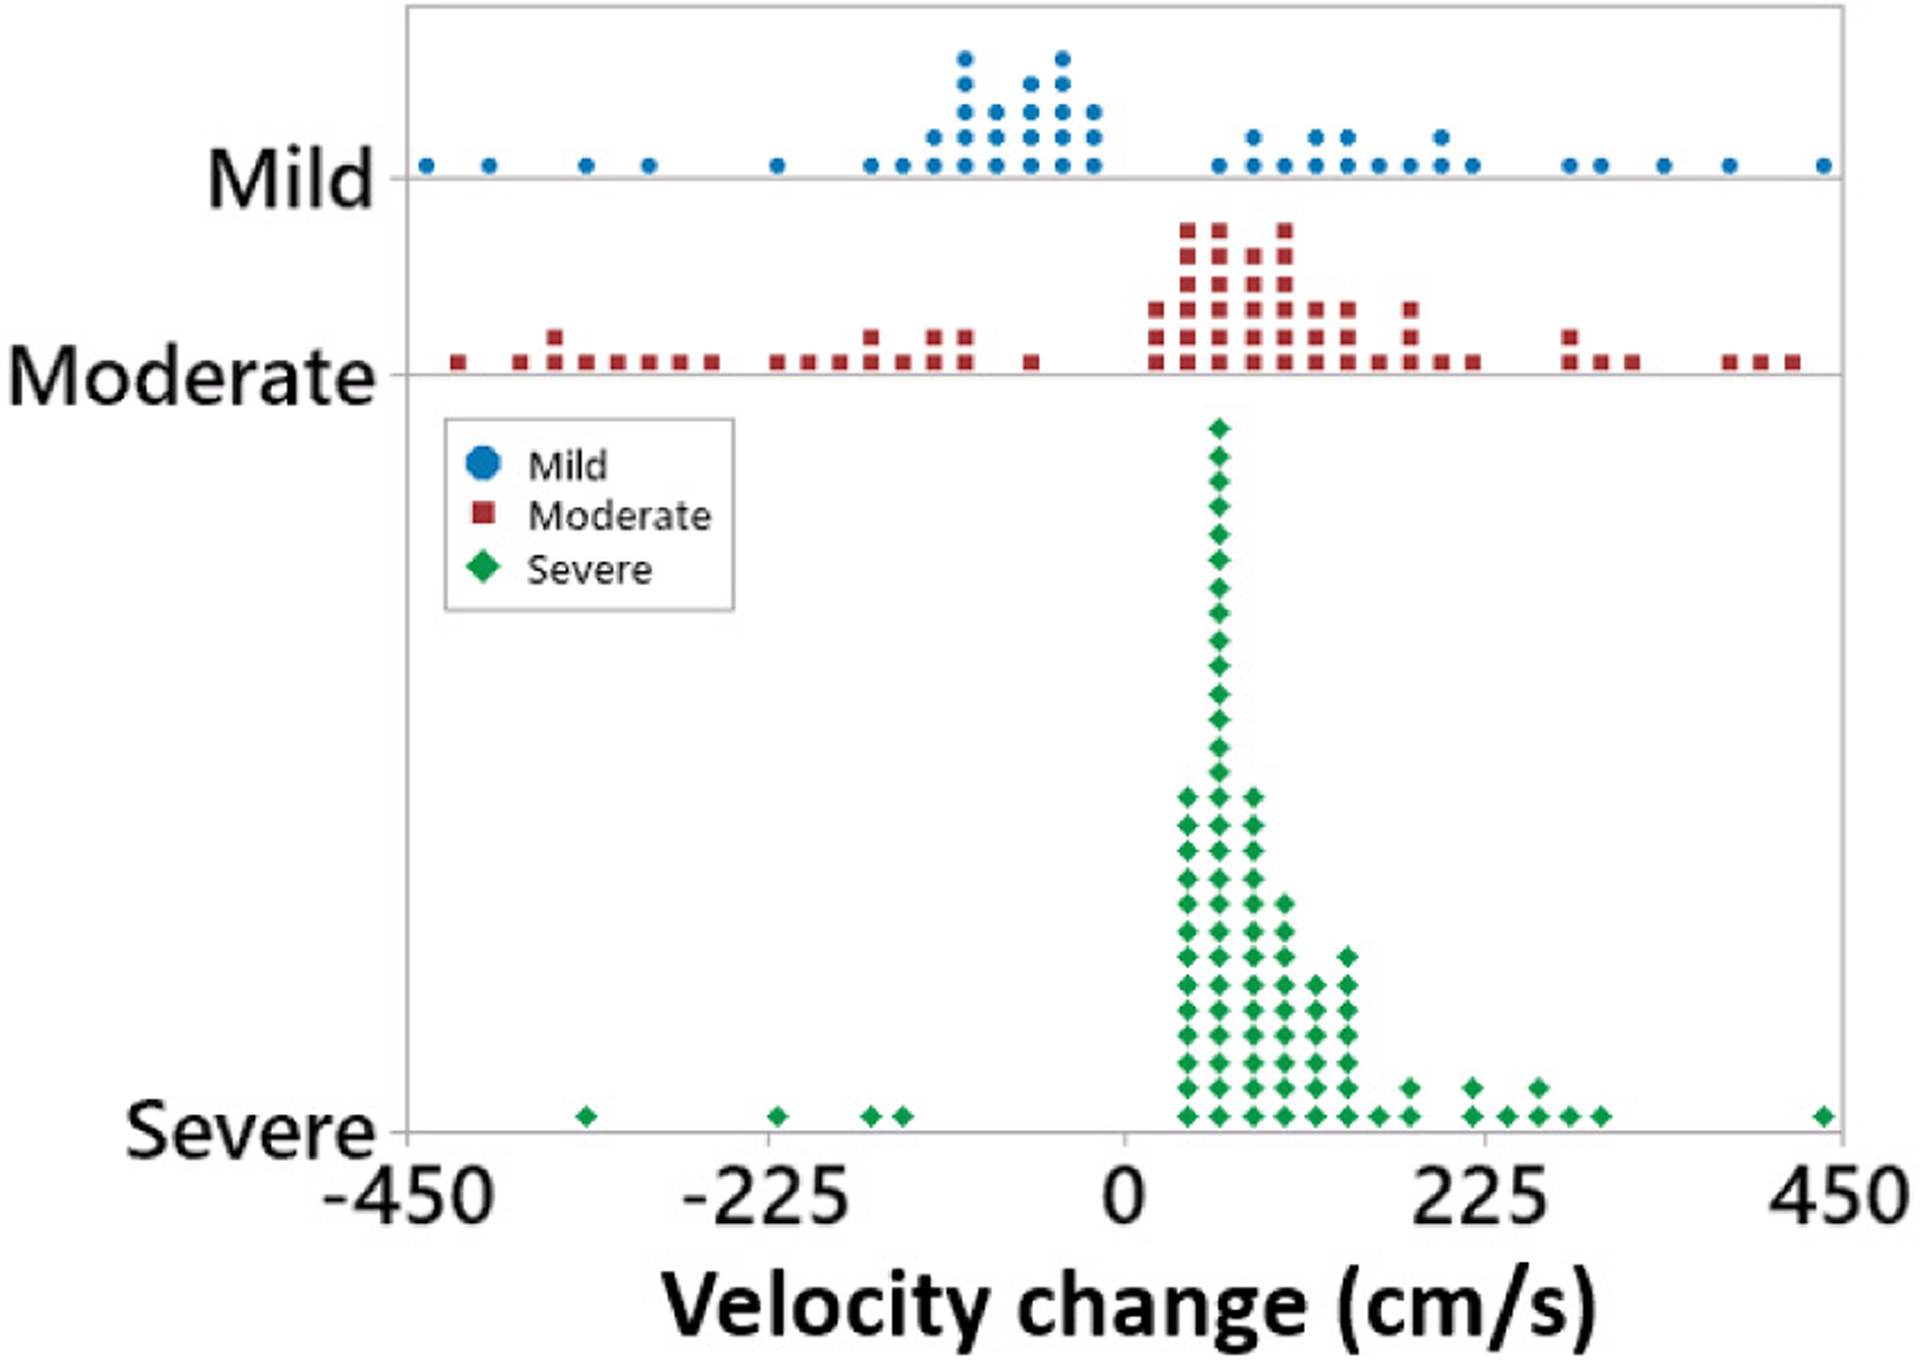
For stenosis<40% (mild), flow velocity decreased along the vascular phantom. For stenotic phantoms with D0S>40%, an average increase of 142 and 155 cm/s was calculated from blood flow sounds.
III. Results and Discussion
Although spectral properties of blood sounds have been correlated to stenosis, combined temporal-spectral analysis of blood flow sounds has not been widely studied. In our analysis, we found that the time difference Td in the onset of ASF in each systolic pulse became inverted in the presence of hemodynamically significant stenosis. This suggests that a simple threshold of Td< 0 ms could be adopted as a screening criterion for significant stenosis in clinical monitoring.
Further, we observed a monotonic decrease in Td with increasing DOS, suggesting that a physical effect causes this phenomenon. Velocity calculation using Td showed a less clear trend, partly due to the calculation method. Because Td was inverted to estimate velocity, small values of Td (which are the most subject to experimental error) are mapped onto large velocities. Further, when Td was near zero, random errors occasionally flipped the sign of Td. Due to this limitation, phantoms showed occasional inversion of estimated velocity between sequential pulse segments. Nevertheless, the average blood flow velocity increase in our study (142–155 cm/s) is within the accepted range for stenotic blood flow [14], [15]. While this study did not confirm blood velocity using a reference technique, so we can only hypothesize that the relation between Td and stenosis is due to blood velocity increase.
IV. Conclusion
Arterial stenosis generates turbulence in blood flow which produces sounds that can be recorded through a multichannel array microphone. Blood sounds can be recorded proximal and distal to stenosis. Analytical signal like ASF can be used to measure onset of these blood flow pulses and estimate hemodynamic blood flow velocity. We developed a signal processing technique to calculate ASF and extract blood flow velocity through the time difference between the pulses proximal and distal to stenosis. This blood flow velocity can be used to differentiate degree of stenosis in mild, moderate and severe grade. Future work will include comparing the velocity measurement with Doppler ultrasound to clinically validate the algorithm.
Acknowledgments
This work was supported in part by RX001968-01 from US Dept. of Veterans Affairs Rehabilitation Research and Development Service. The contents do not represent the views of the US Government.
References
- [1].Geerts W, “Central venous catheter-related thrombosis.,” Hematol. Am. Soc. Hematol. Educ. Progr, no. 1, pp. 306–11, December. 2014. [DOI] [PubMed] [Google Scholar]
- [2].Adwaney A, Lim C, Blakey S, Duncan N, and Ashby DR, “Central Venous Stenosis, Access Outcome and Survival in Patients undergoing Maintenance Hemodialysis.,” Clin. J. Am. Soc. Nephrol, vol. 14, no. 3, pp. 378–384, March. 2019. [DOI] [PMC free article] [PubMed] [Google Scholar]
- [3].Nalesso F et al. , “Standardized Protocol for Hemodialysis Vascular Access Assessment: The Role of Ultrasound and ColorDoppler,” BloodPurif., vol. 45, no. 1–3, pp. 260–269, 2018. [DOI] [PubMed] [Google Scholar]
- [4].Salman L and Beathard G, “Interventional Nephrology: Physical Examination as a Tool for Surveillance for the Hemodialysis Arteriovenous Access,” Clin. J. Am. Soc. Nephrol, vol. 8, no. 7, pp. 1220–1227, July. 2013. [DOI] [PubMed] [Google Scholar]
- [5].Mansy HA, Hoxie SJ, Patel NH, and Sandler RH, “Computerised analysis of auscultatory sounds associated with vascular patency of haemodialysis access.,” Med. Biol. Eng. Comput, vol. 43, no. 1, pp. 56–62, January. 2005. [DOI] [PubMed] [Google Scholar]
- [6].Panda B, Chin S, Mandal S, and Majerus S, “Skin-Coupled PVDF Microphones for Noninvasive Vascular Blood Sound Monitoring,” IEEE Sig. Proc. Med. Biol. Symp, 2018, pp. 1–4. [DOI] [PMC free article] [PubMed] [Google Scholar]
- [7].Hsien-Yi Wang H-Y, Cho-Han Wu C-H, Chien-Yue Chen C-Y, and Bor-Shyh Lin B-S, “Novel Noninvasive Approach for Detecting Arteriovenous Fistula Stenosis,” IEEE Trans. Biomed. Eng, vol. 61, no. 6, pp. 1851–1857, June. 2014. [DOI] [PubMed] [Google Scholar]
- [8].Majerus SJA, Knauss T, Mandal S, Vince G, and Damaser MS, “Bruit-enhancing phonoangiogram filter using sub-band autoregressive linear predictive coding,” Proc. Intl. Conf. IEEE Eng. Med. Biol Soc. (EMBC), 2018, pp. 1416–1419. [DOI] [PMC free article] [PubMed] [Google Scholar]
- [9].Chin S, Panda B, Damaser MS, and Majerus SJA, “Stenosis Characterization and Identification for Dialysis Vascular Access,” IEEE Sig. Proc. Med. Biol. Symp, 2018, pp. 1–4. [DOI] [PMC free article] [PubMed] [Google Scholar]
- [10].Lázaro J, Gil E, Bailón R, Mincholé A, and Laguna P, “Deriving respiration from photoplethysmographic pulse width,” Med. Biol. Eng. Comput, vol. 51, no. 1–2, pp. 233–242, 2013. [DOI] [PubMed] [Google Scholar]
- [11].Panda B, Mandal S, and Majerus SJA, “Flexible, Skin Coupled Microphone Array for Point of Care Vascular Access Monitoring,” IEEE Trans. Biomed. Circuits Syst, pp. 1–1, 2019. [DOI] [PMC free article] [PubMed] [Google Scholar]
- [12].Gaupp S, Wang Y, V How T, and Fish PJ, “Characterization of vortices using pulsed-wave Doppler ultrasound,” Inst. Mech. Eng. PartH J. Eng. Med, vol. 214, no. 6, pp. 677–684, June. 2000. [DOI] [PubMed] [Google Scholar]
- [13].Gårdhagen R, Turbulent Flow in Constricted Blood Vessels Quantification of Wall Shear Stress Using Large Eddy Simulation. PhD dissertation, Linköping University, Sweden, 2013. [Google Scholar]
- [14].Lal BK, Hobson RW, Tofighi B, Kapadia I, Cuadra S, and Jamil Z, “Duplex ultrasound velocity criteria for the stented carotid artery,” J. Vasc. Surg, vol. 47, no. 1, pp. 63–73, January. 2008. [DOI] [PubMed] [Google Scholar]
- [15].Fleischer AC, “Ultrasound: The Core Curriculum,” Am. J. Roentgenol, vol. 179, no. 3, pp. 684–684, September. 2002. [Google Scholar]


