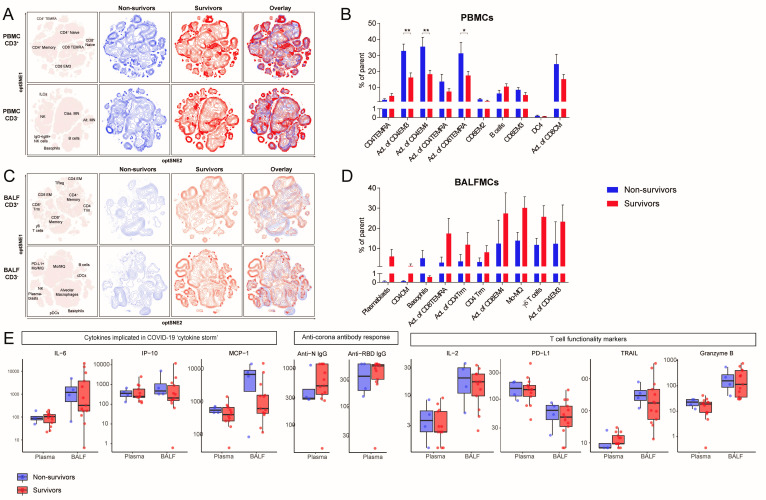
Figure 5.
Contrasting patterns of T cell activation in BALF and peripheral blood between survivors and non-survivors. Samples were stratified based on ICU mortality (n=4 non-survivors (blue) vs n=13 survivors (red)). Only one samples per patient was included in each group N. (A, C) Immune cell population from PBMCs (A) and BALFMCs (C) were clustered using omiq unsupervised clustering and presented as optSNE plots. (B, D) The 10 populations with biggest relative differences (sorted from left to right) are depicted for PBMC (B) and BALFMC (D). Cytokine and antibody levels in plasma and BALF, as measured using Luminex and ELISA, respectively, were compared in fatal and non-fatal COVID-19 cases and presented in box plots as median±IQR (E) BALFMC, bronchoalveolar lavage fluid mononuclear cells; cDC, conventional DC; CM, central memory T cells; DC, dendritic cell; EM, effector memory T cells; ICU, intensive care unit; ILC, innate lymphoid cells; MN, monocyte; Mo/MQ, monocyte-like macrophage; NK, natural killer cells; PBMC, peripheral blood mononuclear cells; pDC, plasmacytoid DC; TEMRA, RA+ effoctor memory T cells; Treg, regulatory T cells; Trm, tissue-resident memory T cell. Statistical significance was tested with multiple testing correction using two-way analysis of variance (ANOVA) (B, D) or Mann-Whitney U test (E). *p<0.05, **p<0.01, ***p<0.001, ****p<0.0001.

