Abstract
The development of diffuse optical tomography (DOT) instrumentation for neuroimaging of humans is challenging due to the large size and the geometry of the head and the desire to distinguish signals at different depths. One approach to this problem is to use dense imaging arrays that incorporate measurements at different source–detector distances. We previously developed a high-density DOT system that is able to obtain retinotopic measurements in agreement with functional magnetic resonance imaging and positron emission tomography. Further extension of high-density DOT neuroimaging necessitates a thorough study of the measurement and imaging sensitivity that incorporates the complex geometry of the head—including the head curvature and layered tissue structure. We present numerical simulations using a finite element model of the adult head to study the sensitivity of the measured signal as a function of the imaging array and data sampling strategy. Specifically, we quantify the imaging sensitivity available within the brain (including depths beyond superficial cortical gyri) as a function of increasing the maximum source–detector separation included in the data. Through the use of depth related sensitivity analysis, it is shown that for a rectangular grid [with 1.3 cm first nearest neighbor (NN) spacing], second NN measurements are sufficient to record absorption changes along the surface of the brain’s cortical gyri (brain tissue depth <5 mm). The use of fourth and fifth NN measurements would permit imaging down into the cortical sulci (brain tissue depth >15 mm).
OCIS codes: 110.6955, 100.6950, 170.2655, 170.3660
1. Introduction
Noninvasive neuroimaging has led to a revolution in contemporary neuroscience, allowing the functional mapping of the human brain on a scale that was previously accessible only through invasive studies of animals [1]. There is wide-scale and promising potential for clinical neuroimaging to provide longitudinal diagnostic and prognostic information about brain function. However, while the majority of research studies in healthy adults are conducted with functional magnetic resonance imaging (fMRI), its high cost, fixed scanner locations, and inability to comprehensively assess altered brain metabolism limit translation to a bedside clinical tool. Diffuse optical tomography (DOT) is a novel and emerging noninvasive neuroimaging methodology that is uniquely suited to this setting, as it is a mobile system utilizing a small, flexible imaging cap [2]. Additionally, DOT can measure absolute changes in oxygenated (ΔHbO2), deoxygenated (ΔHbR), and total hemoglobin (ΔHbT), providing more comprehensive images of the brain’s hemodynamics [3].
DOT methods are an advancement beyond previous optical neuroimaging techniques performed in topographic mode, often referred to as near infrared spectroscopy (NIRS) or diffuse optical imaging (DOI). With NIRS the reconstructed image is synthesized from measurements at a single source–detector pair separation and without overlapping measurements [4–6]. This topographic method limits the lateral spatial resolution and precludes depth discrimination, resulting in a mixture of signals from the brain and superficial tissues. DOT encapsulates a variety of technological improvements to resolution and depth sectioning. Time-resolved DOT systems can extract the time-of-flight of photons to obtain depth information [7–9]. However, system complexity has hampered the capability of these systems to provide practical neuroimaging. A promising alternative is the use of high-density arrays of optodes (near infrared sources and detectors). Theoretically, even with measurements solely of light intensity, the overlapping measurements should improve lateral spatial resolution while different source–detector combinations sample different depths within the tissue. In a recent study, we presented a new high-density DOT system with high contrast-to-noise and the ability to image brain responses in adult humans with greater detail than was previously accessible to optical imaging [10]. These advances in image quality were made possible through increased dynamic range, allowing the inclusion of light from multiple source–detector separations in the image reconstructions.
As this demonstration of the promise of DOT was confined to a small lateral region of the brain and only to the superficial cortex, a relatively simple model of light propagation for image reconstruction was sufficient. The head was assumed to be a hemisphere (8 cm radius) and consisted of only two layers (scalp/skull and brain). Many other optical studies use still simpler imaging strategies including semi-infinite models to estimate the sensitivity of different source–detector pair measurements [9,11]. However, as future DOT systems will cover larger regions of the head, taking into account the true contour of the head and perhaps internal layers will be crucial to accurate localization of brain activity [12]. In addition, continuous sampling of the cortical gray matter will require sensitivity and depth localization of changes deep into the sulcal folds.
In this work, we present numerical simulations using a finite element model (FEM) of the adult head to study the image quality as a function of the imaging array and data sampling strategy for high-density DOT systems. We simulate imaging for five hypothetical systems with different maximum source–detector distances ranging from 1.3 to 5.5 cm. In order to support the larger attenuation of light measured at these larger distances, the systems that have larger source–detector distances are assumed to have developments enabling higher sensitivity (lower noise floors). For each of these systems, we are interested in quantifying the sensitivity of both measured signals and reconstructed images to absorption changes within the brain (including depths beyond superficial cortical gyri). The analysis of the imaging depths of these hypothetical systems can then serve as a road map for guiding future DOT instrumentation development.
2. Methods
A. Hypothetical Instruments and Noise Models
In this specific part of the study we model five different DOT systems using the array of 24 sources and 28 detectors from Zeff et al. [10]. The difference between the systems is that they have different noise floors that allow us, within the same geometry, to select different numbers of measurements to be included in the reconstruction. First through fifth nearest neighbors (NN) source–detector separations were defined [Fig. 1(a)] based on source–detector separation. From the optode array, we selected different measurement combinations by increasing the maximum separation allowed (from first to fifth nearest neighbor: 1 NN–5 NN, respectively). So, for example, the 4 NN measurement combination includes light measurements taken from first, second, third, and fourth nearest neighbor separations. In doing so, we are effectively modeling five different DOT systems with different measurement noise floors (Fig. 1(b)). In each case, we model the signal-to-noise ratio (SNR) as a threshold, where included measurements are assumed to have light intensity with an SNR greater than 100, and those excluded (i.e., too distant) are given an SNR of 0 and excluded.
Fig. 1.
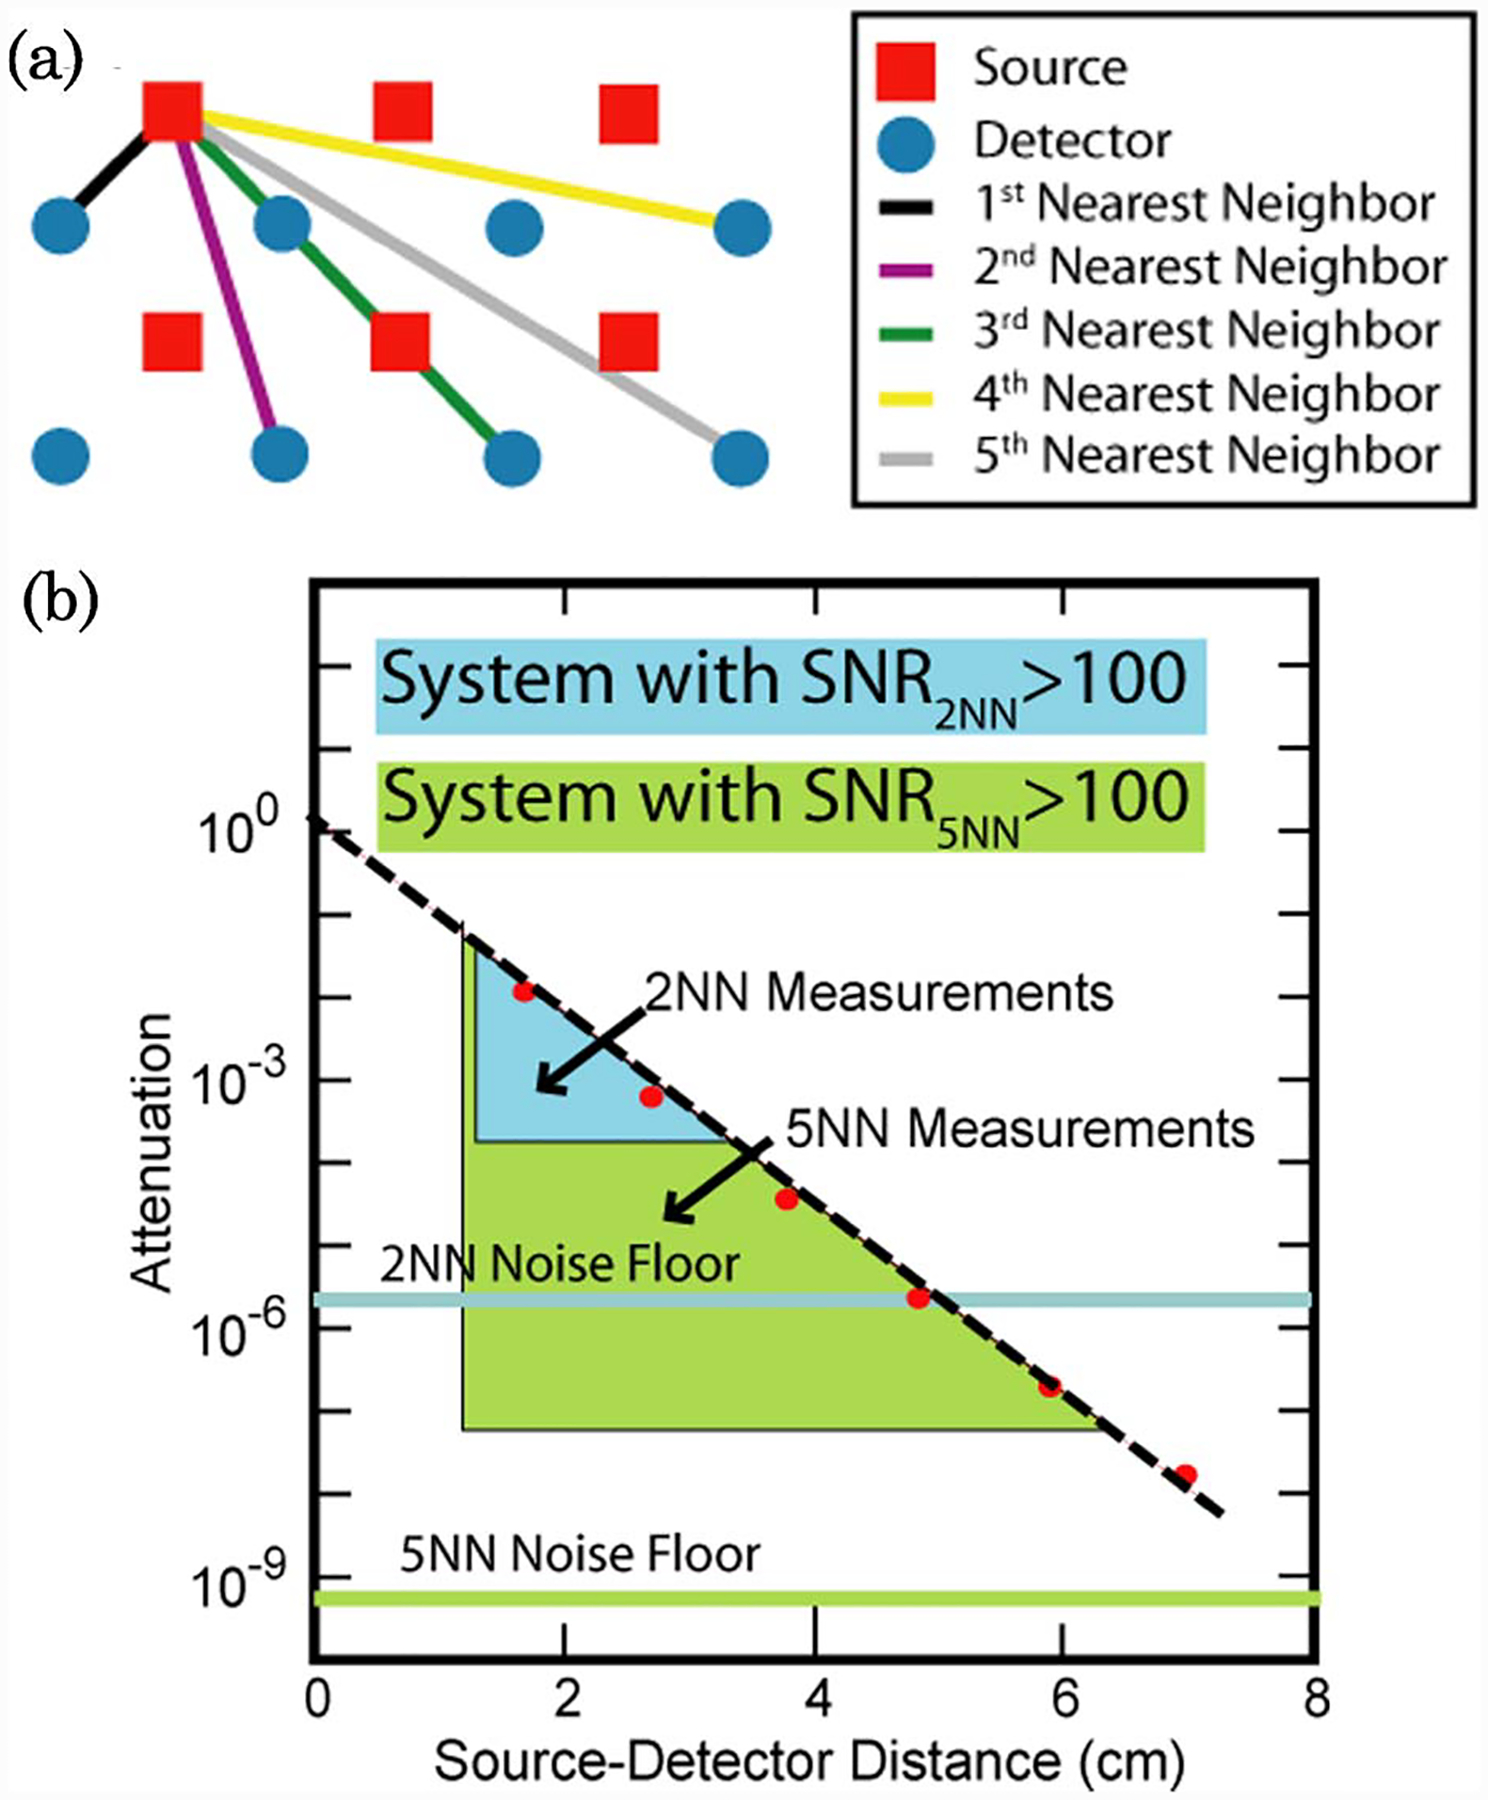
(Color online) Hypothetical DOT imaging systems and measurement configurations. (a) Definitions of first through fifth nearest neighbor measurements within the context of our imaging pad. (b) Measurement designs and noise floors necessary for 2NN and 5NN DOT systems. Red dots are simulated light level measurements in the absence of noise. Altering the instrument noise floor changes the amount of measurements that can be included with an SNR > 100.
This approach is based on our previous empirical measurements of SNR. With the system reported in Zeff et al. [10], our measurements have typical SNRs of 801, 218, 198, 81, and 66 for first through fifth NN pairs, respectively. Thus our SNR ceiling of 100 is actually a conservative estimate of our current system performance (used as a 1 NN to 3 NN system). We expect future systems to be able to deliver this performance at the fourth and fifth NN pairs. Furthermore, with filtering and block averaging, as is found with typical event-related activation studies, we can reduce our measured in vivo noise to 0.12%, 0.15%, 0.41%, and 1.42% for first through fourth NN pairs, respectively.
B. Forward Light Modeling
The numerical model used is a three-dimensional (3D) FEM representation of the adult head, shown in Fig. 2(a). The underlying geometry was created through the combination of manual segmentation of an MRI data set and other anatomical reference models using a commercial surface modeling tool. The meshing was carried out using I-DEAS (www.ugs.com), which is fully described elsewhere [13]. The mesh contains 88,492 nodes corresponding to 502,526 linear tetrahedral elements. Three different regions were considered: muscle/skin, bone, and brain, as shown in Figs. 2(b)–2(d). We used the physiological and optical parameters for different regions as determined by Torricelli et al. [14] (Table 1). The optode array was placed over the occipital cortex of the anatomic model (Fig. 3).
Fig. 2.
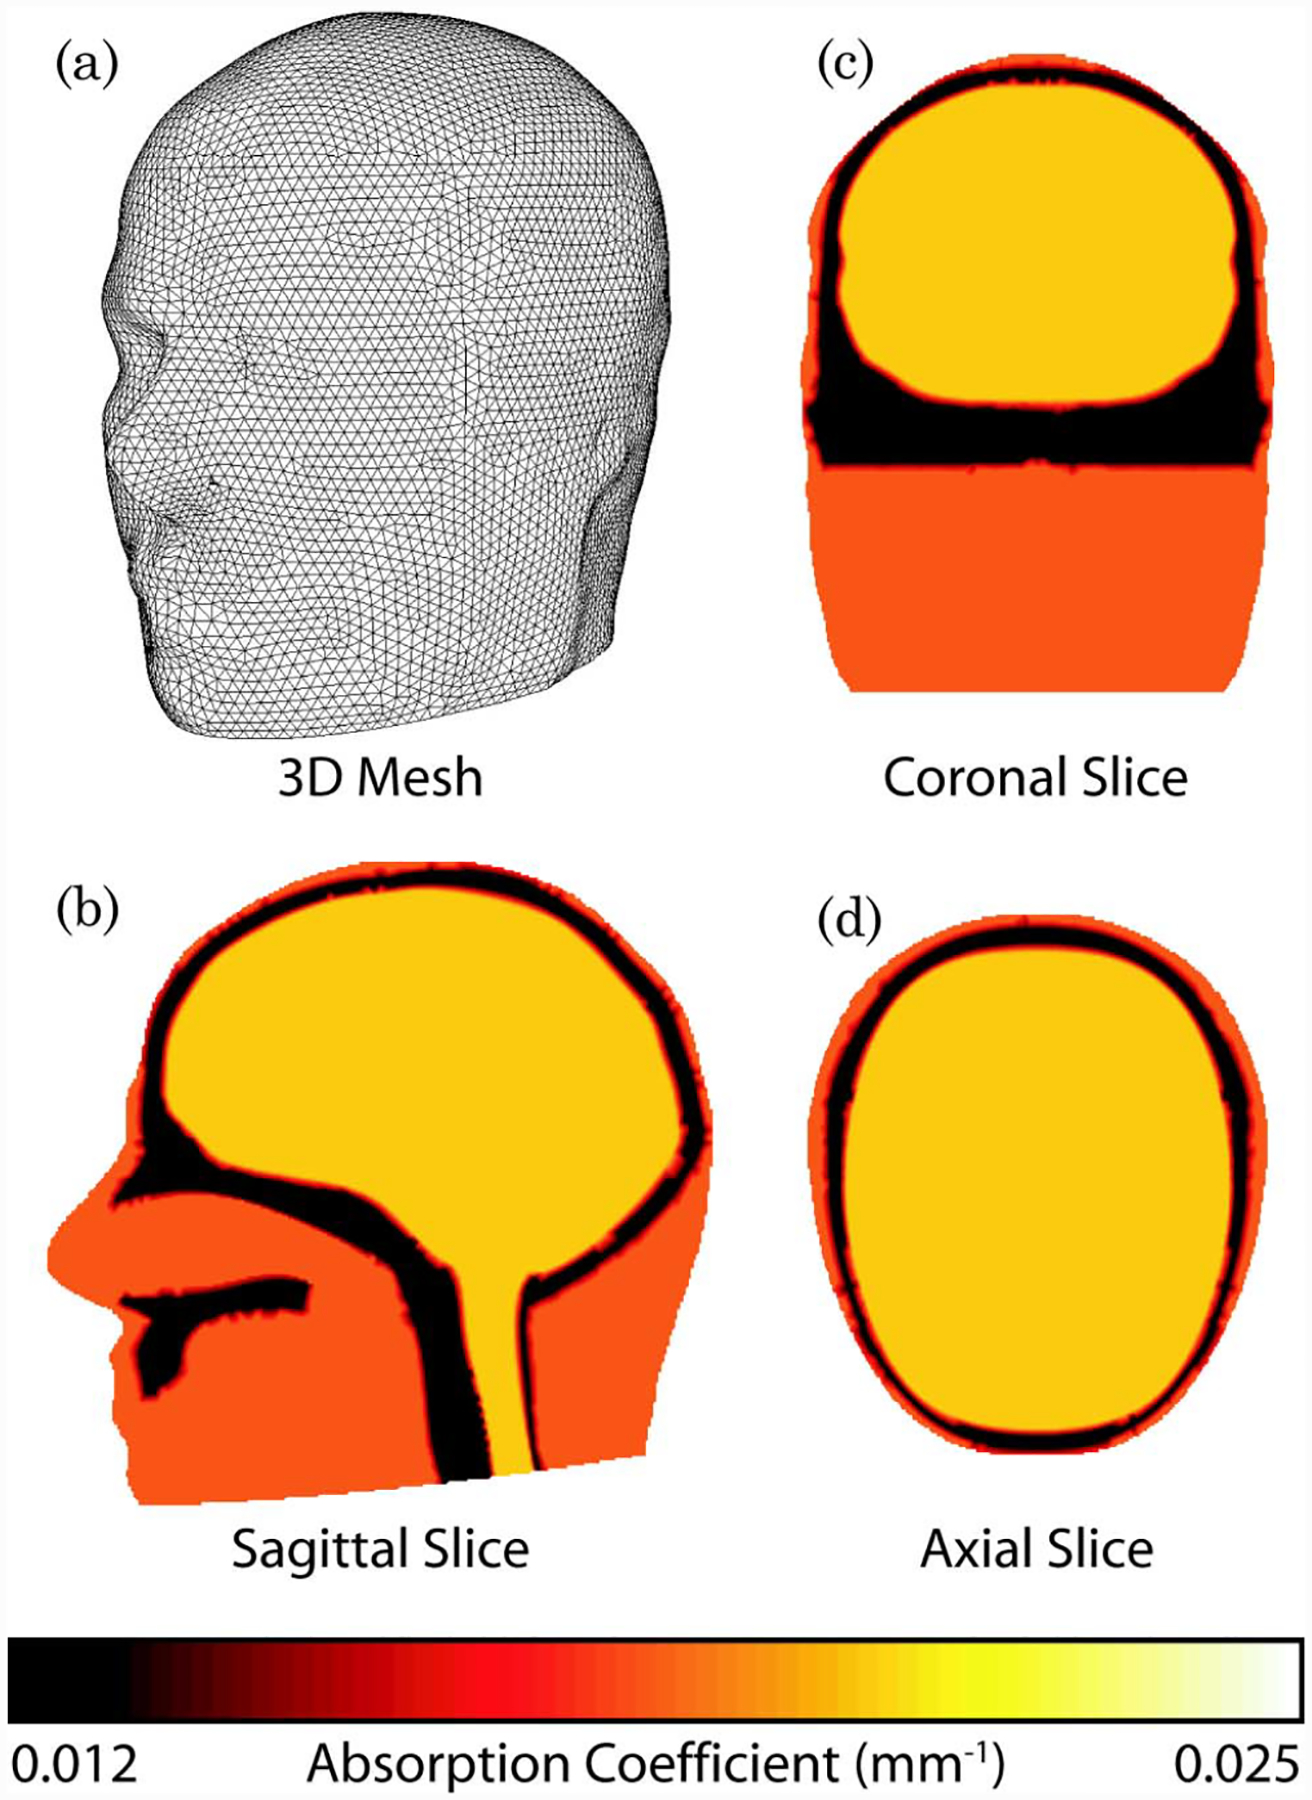
(Color online) Three dimensional (3D) model of the adult brain. (a) View of the FEM mesh. (b)–(d) Cross-sectional maps of absorption at 849 nm.
Table 1.
Physiological Parameters Used for Each Region of the 3D Model [14] and the Absorption and Reduced Scattering Coefficients at 849 nm
| HbT (μM) | SO2(%) | H2O(%) | Scatter Size | Scatter Amplitude | Absorption (mm−1) | Reduced Scatter (mm−1) | |
|---|---|---|---|---|---|---|---|
| Muscle | 70 | 80 | 50 | 0.14 | 2.82 | 0.018 | 0.222 |
| Bone | 49 | 80 | 15 | 1.4 | 1.47 | 0.012 | 1.78 |
| Brain | 76 | 71 | 78 | 0.54 | 0.76 | 0.021 | 0.6115 |
Fig. 3.
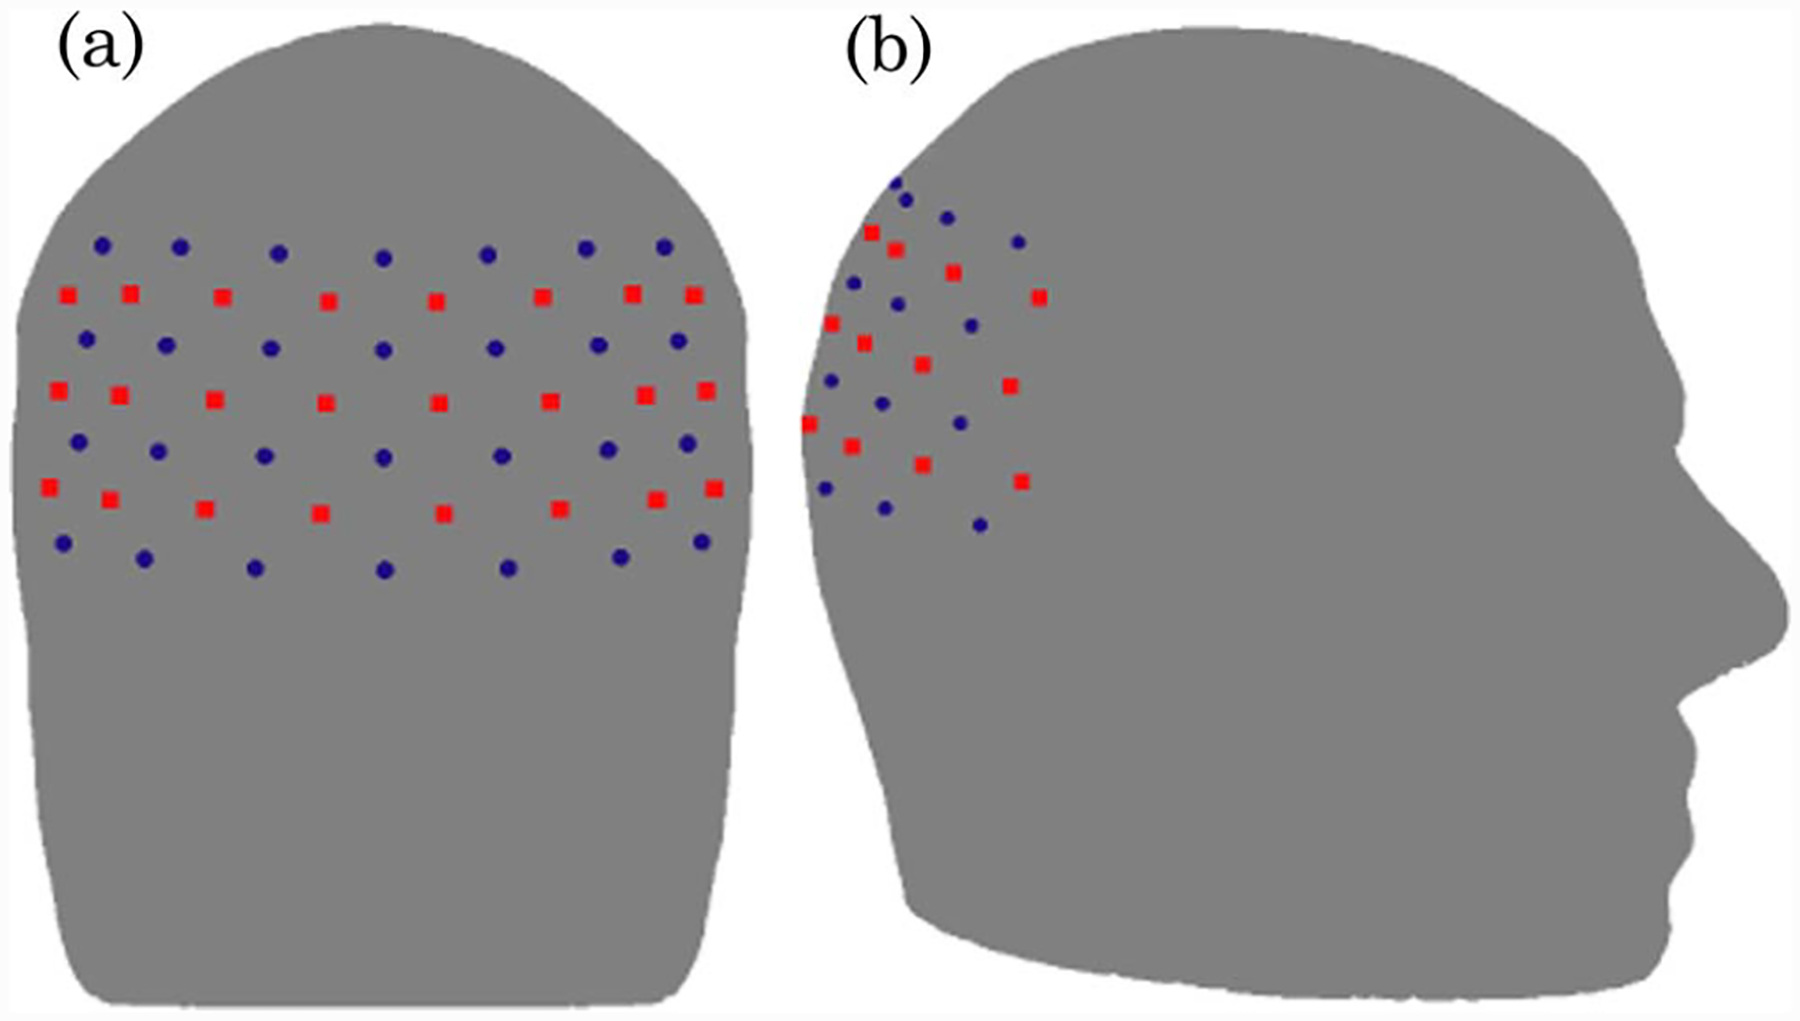
(Color online) (a) Back view and (b) side view schematic showing the placement of the imaging grid over the visual cortex of the adult head model with 24 sources (red squares) and 28 detectors (blue circles).
Using NIRFAST [15], light propagation within the head model was simulated for all five combinations. The details of the number of measurements and the maximum distance of source–detector pairs for each of these detection strategies are shown in Table 2. The Jacobian (also known as the sensitivity matrix) was calculated assuming continuous wave intensity data and considering only absorption related changes at 849 nm. The sensitivity due to each source–detector pair was calculated using the adjoint theorem [16].
Table 2.
Total Number for Measurements for 24 Sources and 28 Detectors Using Either 1st, 2nd 3rd, 4th, or 5th Nearest Neighbor Combinations, Together with the Maximum Distance of These Source–Detector Pairs
| 1 NN | 2 NN | 3 NN | 4 NN | 5 NN | |
|---|---|---|---|---|---|
| Number of measurements included | 84 | 212 | 260 | 348 | 396 |
| Maximum source/detector separation (mm) | 13 | 30 | 40 | 48 | 54 |
C. Inversion Methods
The goal of image reconstruction (the inverse problem) is the recovery of the optical property μa at each FEM node within the domain using measurements from the head surface. Using the generalized Moore–Penrose inverse model, the linearized image reconstruction can be stated as [17]
| (1) |
where δμa is the update for the optical properties, λ is the regularization factor (set in this work at 10−5 times the maximum of the diagonal of matrix JJT), δϕ is the difference between the measured and modeled data, and the spatial variant regularization L is set as
| (2) |
where β is set at 10−2 times the maximum of the diagonal of matrix JJT. Both λ and β values were chosen to match the values used typically in our previous human [10] and animal [18] DOT studies.
D. Measurement Depth Sensitivity Analysis
In order to calculate the total sensitivity for all measurements for a given detection strategy (1 NN–5 NN), individual source–detector sensitivities were summed and normalized, such that the total sensitivity becomes
| (3) |
where is the total normalized calculated sensitivity at node j of the model, and Ji,j is the sensitivity at node j, due to source–detector pair i, for a total number of measurements NM.
E. Imaging Depth Sensitivity Analysis: Flat Field
In order to provide a comprehensive view of the depth sensitivity after image reconstruction, we performed a flat field imaging test. A test image, δμa, was constructed with a uniform small change (0.01%) in absorption at each position throughout the imaging volume. Simulated data, δϕ, was calculated using
| (4) |
These simulated data were then used, together with Eq. (1), to reconstruct flat field images for each measurement strategy.
F. Imaging Depth Sensitivity Analysis: Focal Activations
In order to further analyze the depth sensitivity, we evaluated test images of focal activity at different depths. Simulated reference data were generated using the unperturbed model shown in Fig. 2 and Table 1. Then, we modeled a brain activation at varying depths using a small (0.5 cm radius) hemodynamic change consisting of a 3.8 μM rise in total hemoglobin and 3.76% change in oxygen saturation (final anomaly values of HbT = 79.8 μM, SO2 = 74.76% against background brain values as stated in Table 1). Differential intensity data were calculated based on changes at 849 nm. Consistent with our aforementioned current in vivo performance, 0.15% random noise was added to both the reference (unperturbed) and anomaly (perturbed) data. The noise added was calculated as a set of randomly distributed Gaussian noise, at each data point and data set. Assuming no knowledge of the background optical properties of the volume being imaged, the noise-added unperturbed data were used to calculate a global fit for background (unperturbed) absorption using methods discussed elsewhere [19]. Assuming a background reduced scattering coefficient of 1.0 mm−1, the calculated global value for the absorption coefficient using this method was found to be 8.7 × 10⁻³ mm−1. Using a Jacobian based on these global optical properties, images of baseline (temporal change) activity were reconstructed using the difference data (perturbed—unperturbed) as defined in Eq. (1).
3. Results
Using the heterogeneous 3D model of the adult head, the sensitivity matrix for different nearest neighbor source–detector combinations was calculated for intensity measurements and absorption-only changes at 849 nm (Fig. 4, where only the back portion of the axial view at midplane of the imaging grid is shown). As is evident from the normalized total sensitivity plot, the 1 NN measurement combination provides information only from superficial layers of the muscle and bone regions. For the 2 NN, 3 NN, and 4 NN measurement combinations, although the majority of the total sensitivity is still seen at the muscle and bone regions, the 1% sensitivity contour line shows limited depth sensitivity from the brain. The available depth of the measurement sensitivity increases further when using the 5 NN measurement combinations, with the 10% sensitivity contour well within the brain region and the 1% sensitivity deep within the brain.
Fig. 4.
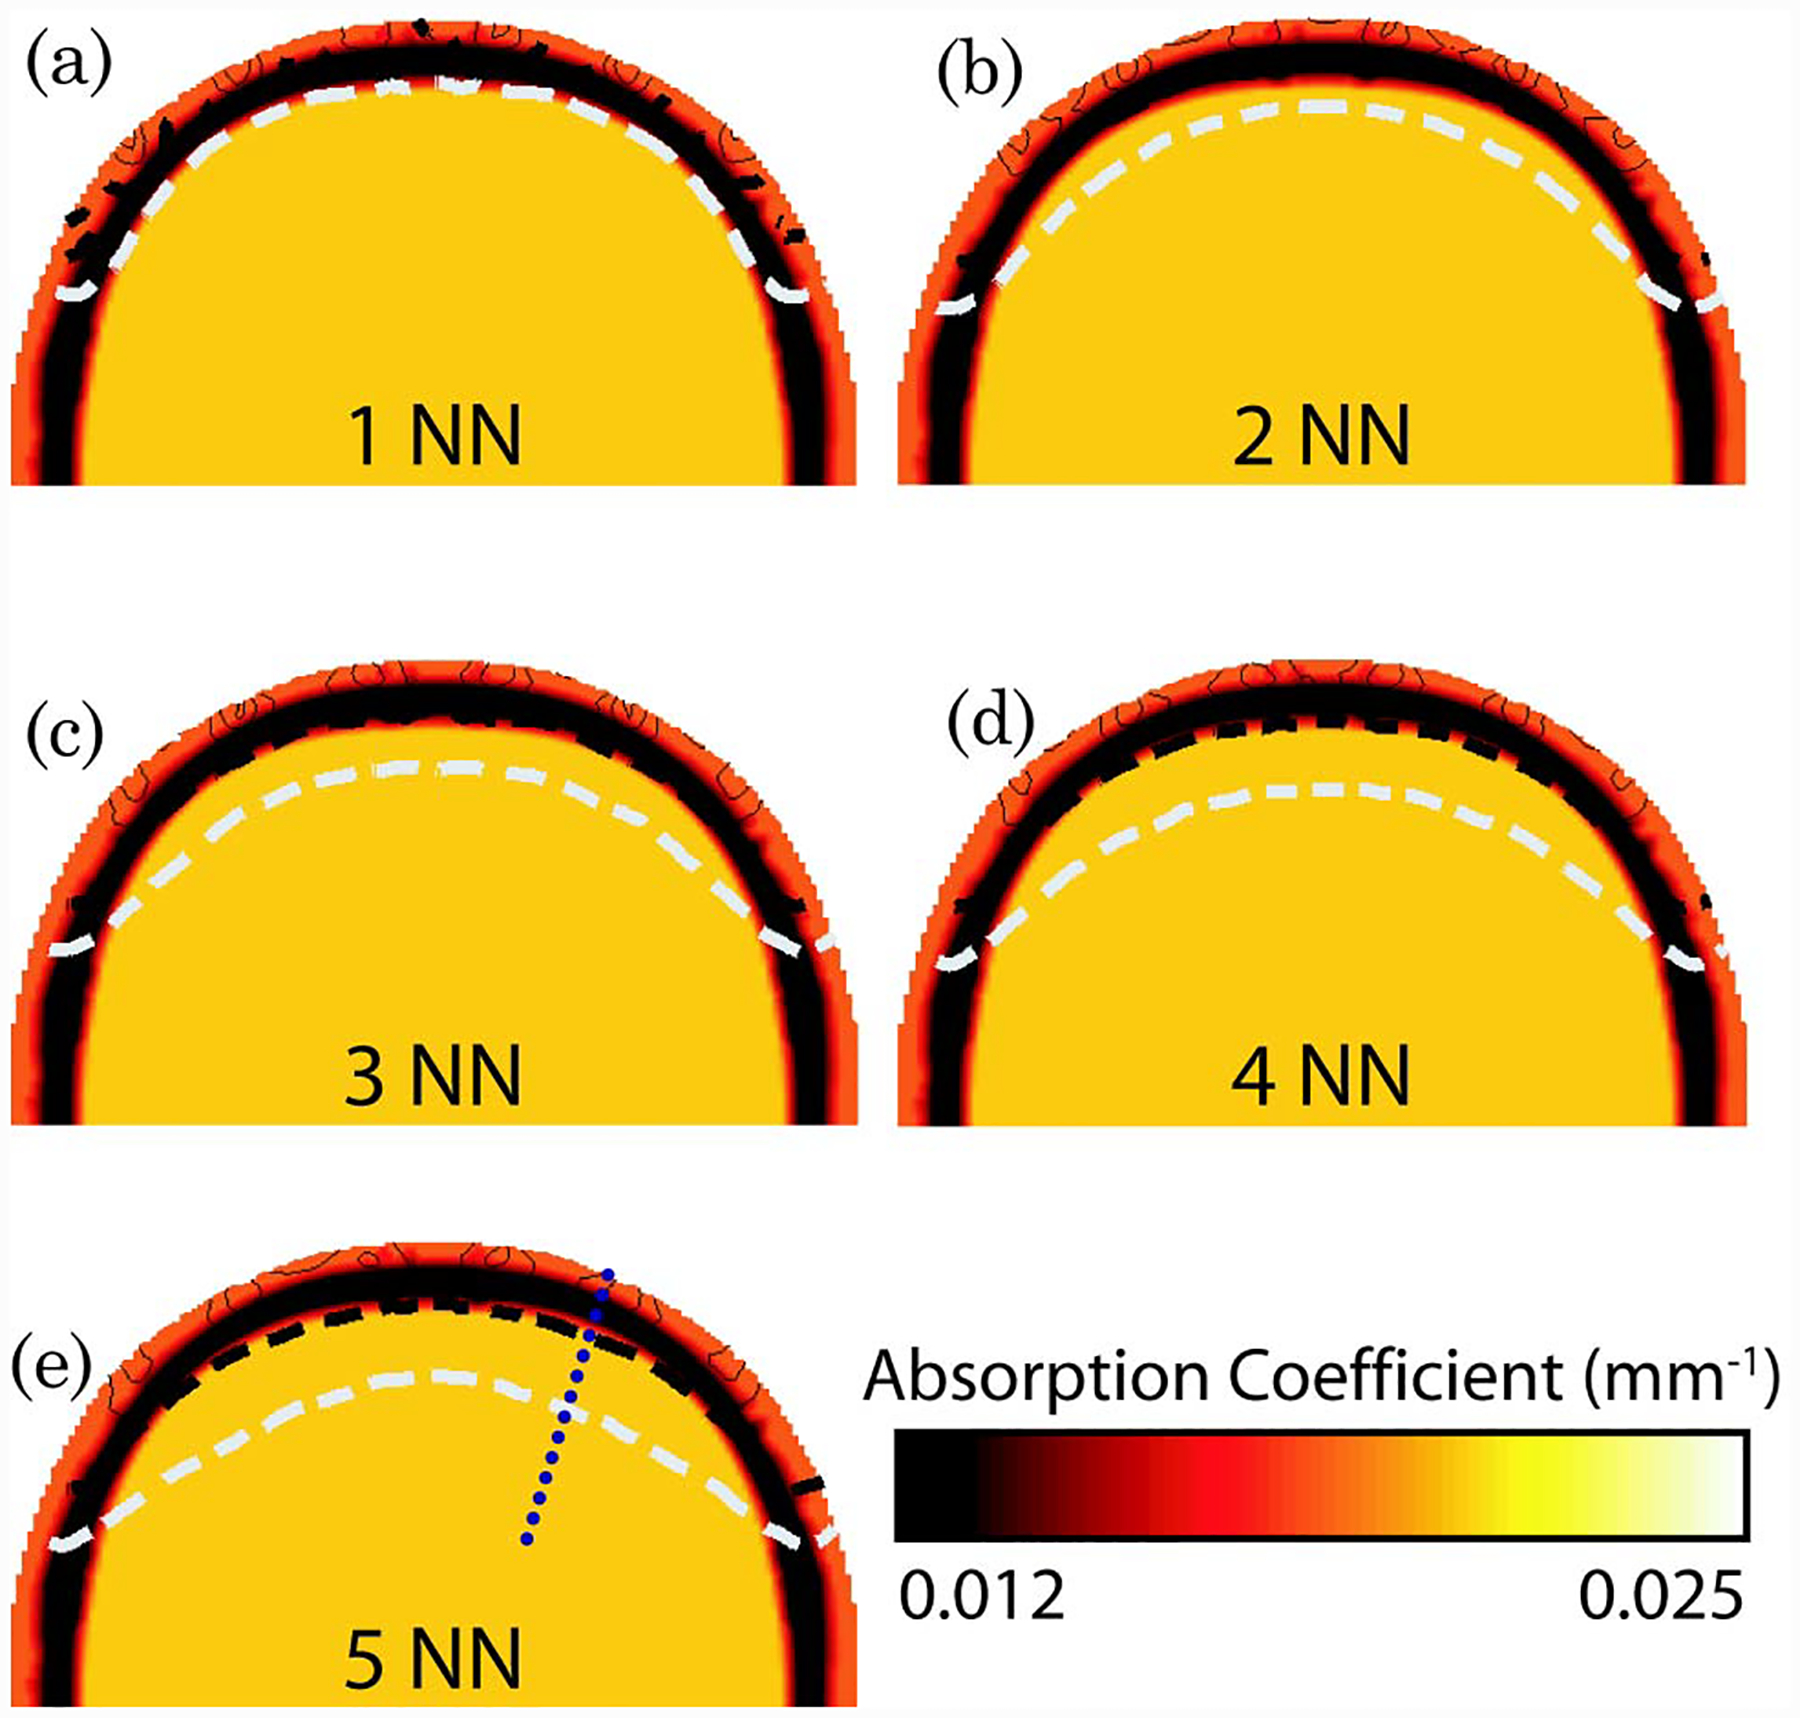
(Color online) Total normalized forward model sensitivity shown as contour lines on the back portion of the axial view of the 3D adult head model for each nearest neighbor (NN) set. The shades in each image represent the optical absorption properties at 849 nm, as shown in Fig. 2. Each contour line represents 10% of the total sensitivity with the dashed black line at 10% and dashed white line at 1% sensitivity.
Figure 5 shows a cross section of the flat-field image test along the dashed line shown in Figure 4(e). Although the total normalized sensitivity plots in Fig. 4 show superficial preference, the depth at which changes can be reconstructed is significantly deeper. Specifically, the normalized flat-field sensitivity is greater than 50% at 10 mm deep within the brain when using either 4 or 5 NN.
Fig. 5.
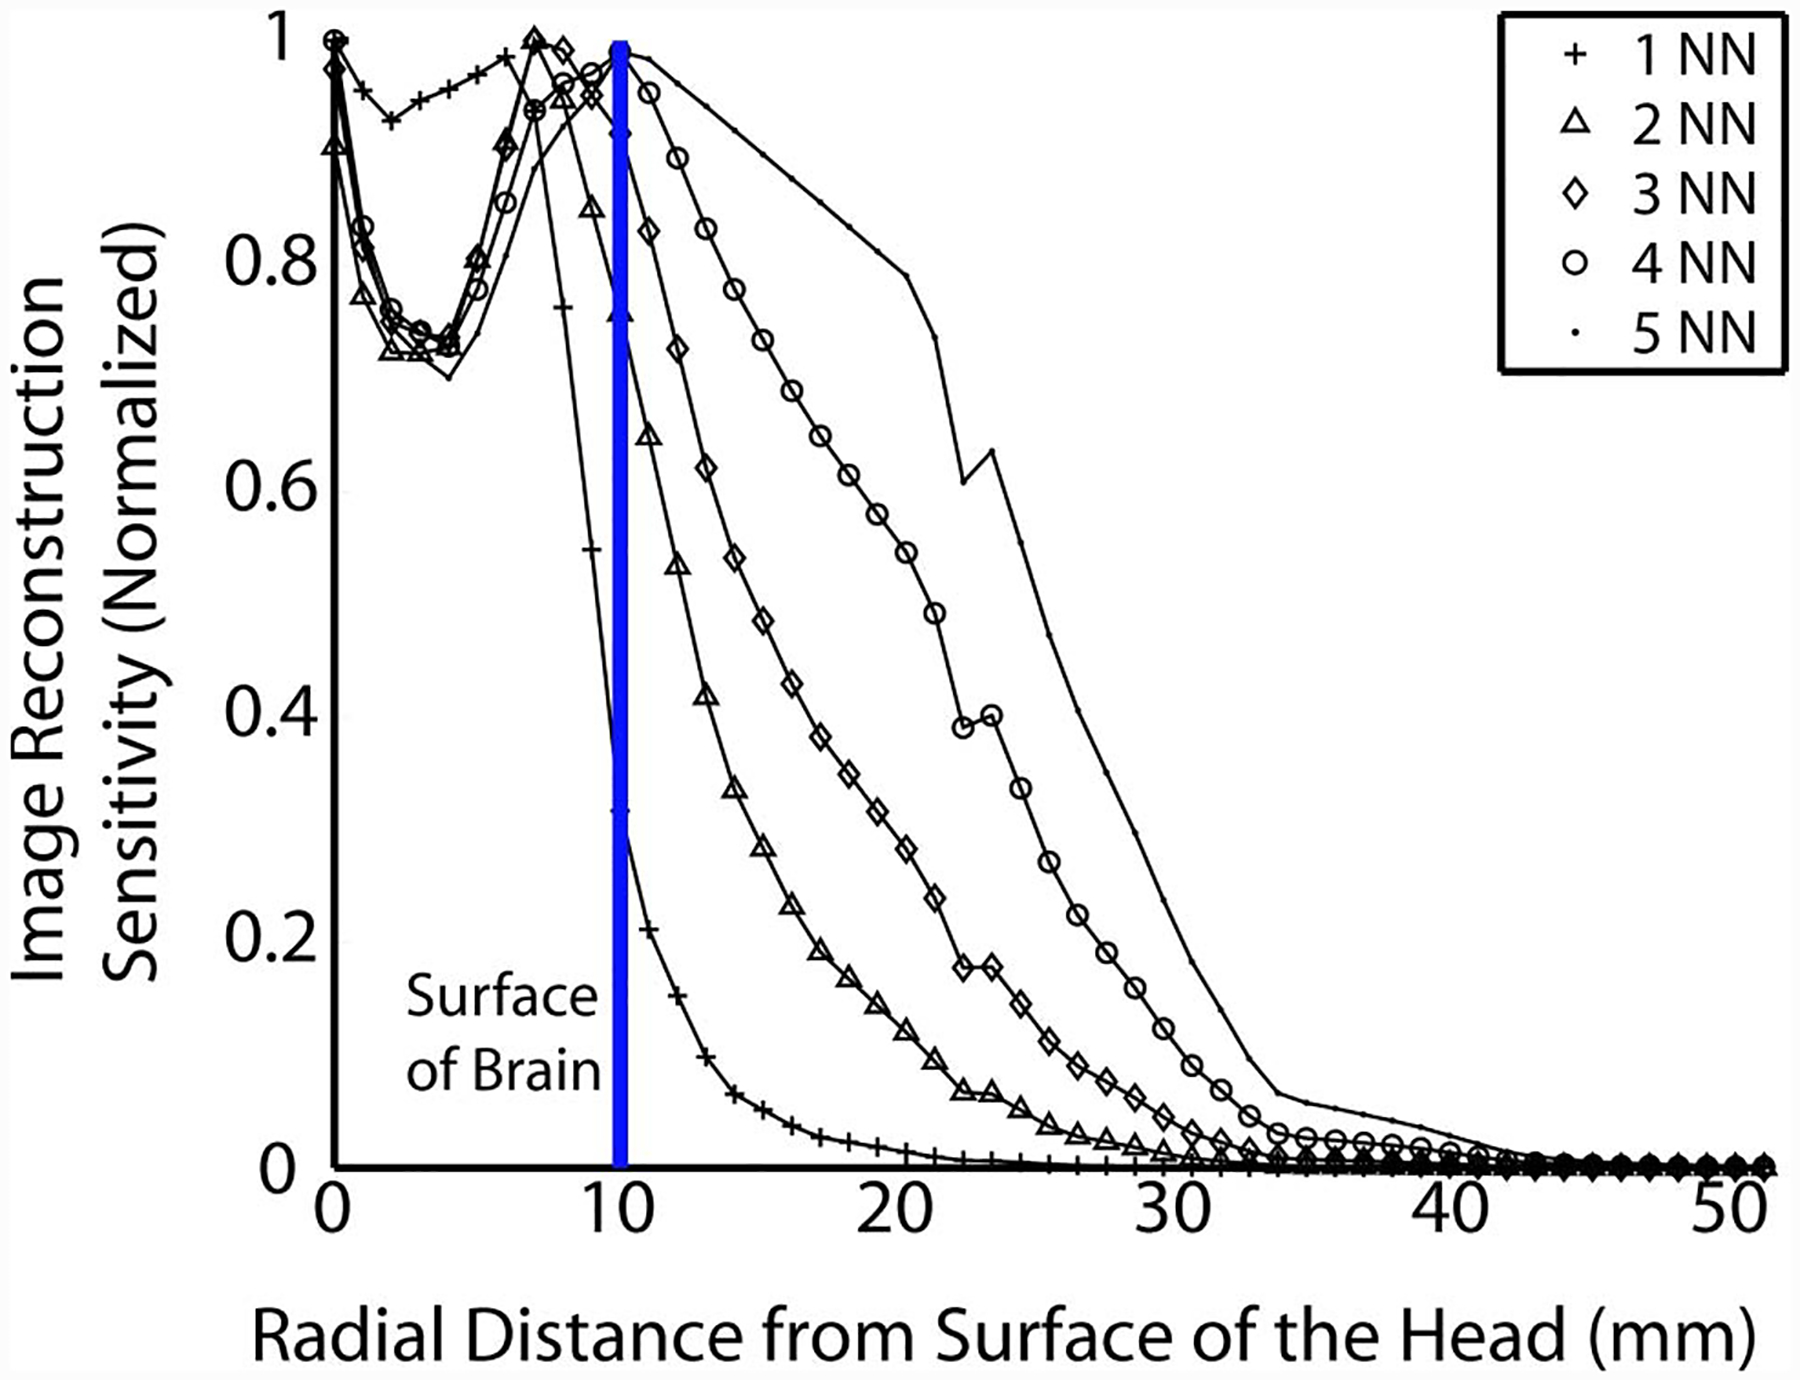
(Color online) Cross section (along the region depicted by the dashed line in Fig. 4(e)) of the flat-field image test for each nearest neighbor as a function of distance from surface of the head. The solid vertical line represents the surface of the brain.
In order to highlight the differences in increased sensitivity and depth recovery between the different data sampling strategies, images of temporal changes due to small focal hemodynamic changes were reconstructed (Fig. 6). The 1 NN measurement strategy is unable to reconstruct activations at any depth within the brain. Increasing the number of measurements used in the reconstruction from 2 NN to 5 NN increases the distance into the brain at which activations can be reconstructed. The 2 NN strategy is sufficient to image brain activity near the surface of the brain (corresponding to cortical gyri), while the 5 NN strategy can image to at least 20 mm deep within the brain, which allows measurement of activity within sulcal folds.
Fig. 6.
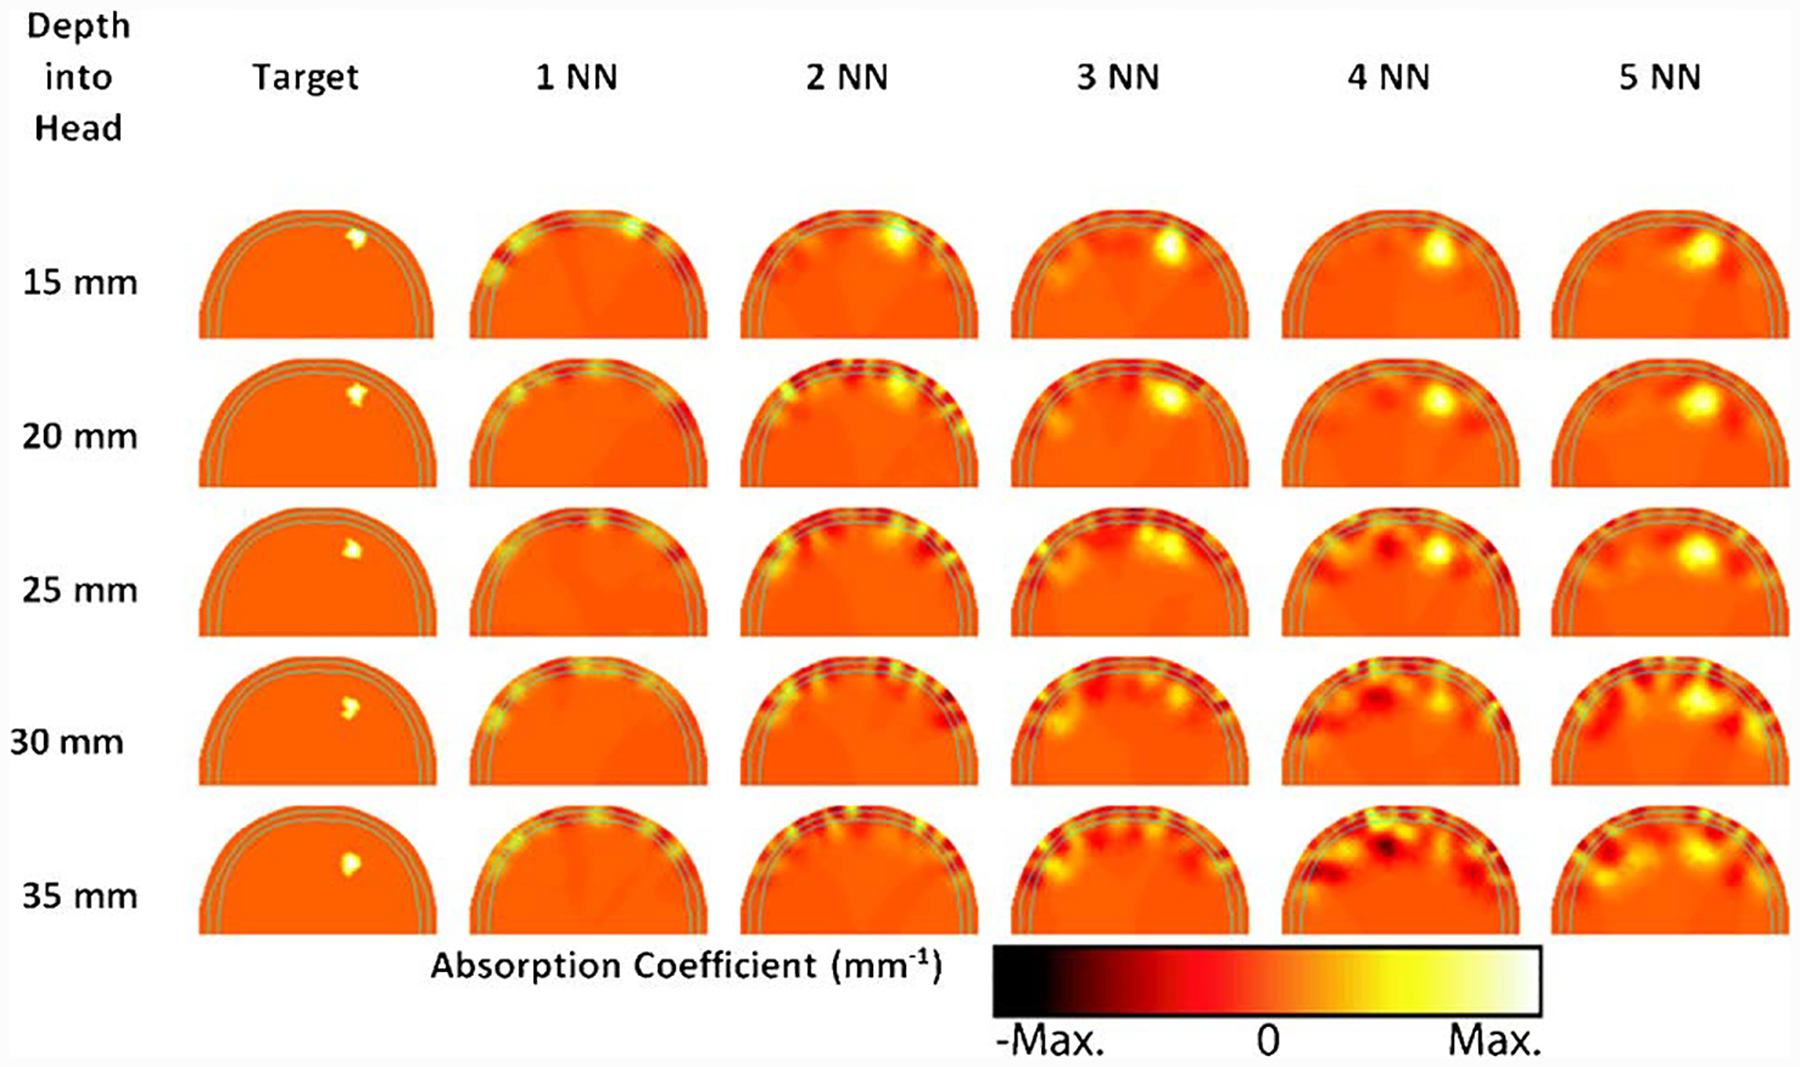
(Color online) Reconstructed baseline tomographic images of hemodynamic activation at different depths within the brain, using 1 NN through 5 NN measurement strategies. Images shown are absorption changes measured at 849 nm, with each pane scaled to its maximum value. Each row corresponds to an activation depth, and each column is a different measurement combination. Only the back portion of the axial view of the 3D adult head model is shown, with solid cyan lines representing the skull outline. The activation corresponds to a 3.8 μM rise in total hemoglobin and 3.76% change in oxygen saturation.
4. Discussion
In this paper, we presented a detailed anatomic model and evaluated the possible imaging sensitivities of different high-density DOT arrays. Not surprisingly, the addition of measurements with greater source–detector separations into the imaging problem increases the sensitivity as a function of depth in both the forward and inverse problems [20]. Here, we see that the depth sensitivity within the brain clearly increases between the 2 NN and 5 NN arrays (Figs. 4–6). In contrast to generic “rules of thumb” or simpler anatomically inaccurate semi-infinite models [18], this study uses realistic anatomy and provides more quantitative detail. For example, the total normalized sensitivity at the surface of the brain increases by a factor of 2 when extending from 2 NN to 5 NN data sampling. Alternatively, the depth of the 1% sensitivity line increases from 12 mm to 17 mm when extending from 2 NN to 5 NN data sampling. However, these estimates of measurement sensitivity neglect the capability of tomography to localize contrast and account for varying sensitivity profiles.
A better estimate of image sensitivity versus depth is obtained by evaluating images reconstructed from simulated data derived from test images. For comparison a very simple “rule of thumb” estimate is that measurements are sensitive to a depth equal to 1/3 the source–detector separation. Such an approach would predict a gain in imaging depth of 8 mm when increasing the maximum source–detector separation from 2 NN (30 mm separation) to 5 NN (54 mm separation) data sampling. Our flat-field imaging test shows an extension of 13 mm for the 50% sensitivity point (12 mm for 2 NN and 25 mm for 5 NN). Thus the full reconstruction estimate provides an increased depth compared to the rule of thumb. This increased depth is likely because the reconstruction includes the curvature of the head and the specifics of the high-density imaging array (more measurements are included with the 5 NN versus 2 NN array).
In order to cross validate the flat-field imaging test, images of small baseline hemodynamic changes were reconstructed using noise added simulated data and a model of “calculated bulk” optical properties. From the reconstructed images, it is clearly seen that although the 2 NN data sampling can recover a modest change at 5 mm deep within the brain, the ability to recover changes deteriorates dramatically for deeper regions. However, using 5 NN, changes at up to 20 mm deep within the brain are successfully recovered, despite some small reconstruction artifacts.
It has been shown previously that the addition of extra measurements and variation in measurement geometry can influence the amount of information that can be obtained from the volume under investigation [20,21]. However, most of such studies to date have only considered nonspecific, simple, and homogeneous models and have not included the depth-dependent or image recovery dependence of the problem. Although the use of a specific model, as in this study, does not account for variation of the tissue thickness or optical properties, it does demonstrate that the use of additional nearest neighbor measurements provides substantial depth related information in optical brain imaging. The variation of such parameters additionally becomes less influential, when the aim is differential imaging, whereby relative changes, rather than absolute values, are of interest.
There is some question in the optical neuroimaging community about whether one must model the clear cerebrospinal fluid (CSF) layer within the head. Much of this controversy stems from earlier publications that seemed to indicate that the diffusion approximation failed at reconstructing anomalies below a nonscattering layer [22]. However, subsequent papers suggested three reasons why this conclusion was incomplete. First, Ripoll et al. found that, if the surface of the nonscattering layer is rough (as that of the CSF is), then the effect of the layer is minimal [23]. Second, Pei et al. were able to reconstruct DOT images of objects below even a smooth nonscattering layer. They attribute their success to the use of differential measurements [24]. Third, Custo et al. showed that neglecting CSF can actually underestimate your system’s brain sensitivity [25], making our model conservative. Since our study is conducted with differential measurements in a geometry with a rough, thin nonscattering layer, we expect the effects of the CSF to be minimal.
The presented results are also applicable to other complementary optical imaging methods and techniques, such as diffuse correlation optical tomography, whereby the aims are to measure and reconstruct information regarding blood flow within a region of interest [26,27].
5. Conclusions
High-density DOT has shown promise as a method to create three-dimensional reconstructions of brain hemodynamics while maintaining portability, low cost, and low system complexity. Future increases in the dynamic range of such systems will allow the use of greater source–detector separations, useful for probing deeper within the brain. While sensitivity to deep brain structures such as the basal ganglia and hippocampus will most likely not be possible, a DOT system that would have sensitivity throughout the sulcal folds of the cortical convexity would be of immense use for both neuroscience research and clinical practice. Simplistic forward models have sufficed for localized imaging domains and studies of activations on the gyri. However, increased lateral coverage and depth penetration demand more accurate light modeling to quantify the imaging sensitivity and improve image reconstruction.
The results presented herein give an indication of the future of in vivo DOT reconstructions and provide a roadmap for how to obtain the desired sensitivity throughout the cortical folds. Our modeling predicts a dramatic increase in depth sensitivity attainable using the fifth nearest neighbor measurements. Forward model sensitivities, inverse problem updates, and simulated image reconstructions show that such a system would be able to image at depths greater than 20 mm within the brain. Such sensitivity would allow the measurement activations at the bottom of sulcal folds. These results motivate future technological developments and will serve as a basis for accurate in vivo image reconstructions.
Acknowledgments
This work was supported in part by National Institutes of Health grants K25-NS4339 and R21-EB7924 as well as the Engineering and Physical Sciences Research Council, UK.
References
- 1.Strangman G, Boas DA, and Sutton JP, “Noninvasive neuroimaging using near-infrared light,” Biol. Psychiat 52, 679–693 (2002). [DOI] [PubMed] [Google Scholar]
- 2.Obrig H and Villringer A, “Beyond the visible—imaging the human brain with light,” J. Cereb. Blood Flow Metab 23, 1–18 (2003). [DOI] [PubMed] [Google Scholar]
- 3.Srinivasan S, Pogue BW, Brooksby B, Jiang S, Dehghani H, Kogel C, Poplack SP, and Paulsen KD,“Near-infrared characterization of breast tumors in vivo using spectrally-constrained reconstruction,” Technol. Cancer Res. Treat 5, 513–526 (2005). [DOI] [PubMed] [Google Scholar]
- 4.Koizumi H, Yamamoto T, Maki A, Yamashita Y, Sato H, Kawaguchi H, and Ichikawa N, “Optical topography: practical problems and new applications,” Appl. Opt 42, 3054–3062 (2003). [DOI] [PubMed] [Google Scholar]
- 5.Suda M, Morimoto K, Obata A, Koizumi H, and Maki A, “Emotional responses to music: towards scientific perspectives on music therapy,” NeuroReport 19, 75–78 (2008). [DOI] [PubMed] [Google Scholar]
- 6.Fuchino Y, Nagao M, Katura T, Bando M, Naito M, Maki A, Nakamura K, Hayashi T, Koizumi H, and Yoro T, “High cognitive function of an ALS patient in the totally locked-in state,” Neurosci. Lett. Suppl 435, 85–89 (2008). [DOI] [PubMed] [Google Scholar]
- 7.Schmidt FEW, Fry ME, Hillman EMC, Hebden JC, and Delpy DT, “A 32-channel time-resolved instrument for medical optical tomography,” Rev. Sci. Instrum 71, 256–265 (2000). [Google Scholar]
- 8.Hebden JC, Gibson A, Austin T, Yusof R, Everdell N, Delpy DT, Arridge SR, Meek JH, and Wyatt JS, “Imaging changes in blood volume and oxygenation in the newborn infant brain using three-dimensional optical tomography,” Phys. Med. Biol 49, 1117–1130 (2004). [DOI] [PubMed] [Google Scholar]
- 9.Selb J, Stott JJ, Franceschini MA, Sorensen AG, and Boas DA, “Improved sensitivity to cerebral hemodynamics during brain activation with a time-gated optical system: analytical model and experimental validation,” J. Biomed. Opt 10, 011013 (2005). [DOI] [PubMed] [Google Scholar]
- 10.Zeff BW, White BR, Dehghani H, Schlaggar BL, and Culver JP, “Retinotopic mapping of adult human visual cortex with high-density diffuse optical tomography,” Proc. Natl. Acad. Sci. USA 104, 12169–12174 (July 17 2007). [DOI] [PMC free article] [PubMed] [Google Scholar]
- 11.Patterson MS, Chance MS, Chance B, and Wilson BC, “Time resolved reflectance and transmittance for the noninvasive measurement of tissue optical properties,” Appl. Opt 28, 2331–2336 (1989). [DOI] [PubMed] [Google Scholar]
- 12.Gibson A, Riley J, Schweiger M, Hebden JC, Arridge SR, and Delpy DT, “A method for generating patient specific finite element meshes for head modelling,” Phys. Med. Biol 48, 481–495 (2003). [DOI] [PubMed] [Google Scholar]
- 13.Tizzard A, Horesh L, Yerworth RJ, Holder DS, and Bayford RH, “Generating accurate finite element meshes for the forward model of the human head in EIT,” Phys. Meas 26, S251–S261 (2005). [DOI] [PubMed] [Google Scholar]
- 14.Torricelli A, Pifferi A, Taroni A, Giambattistelli E, and Cubeddu R, “In vivo optical characterization of human tissues from 610 to 1010 nm by time-resolved reflectance spectroscopy,” Phys. Med. Biol 46, 2227–2237 (2001). [DOI] [PubMed] [Google Scholar]
- 15.Dehghani H, Eames ME, Yalavarthy PK, Davis SC, Srinivasan S, Carpenter CM, Pogue BW, and Paulsen KD, “Near infrared optical tomography using NIRFAST: algorithm for numerical model and image reconstruction algorithms,” Commun. Numer. Methods Eng, doi: 10.1002/cnm.1162. [DOI] [PMC free article] [PubMed] [Google Scholar]
- 16.Arridge SR and Schweiger M, “Photon-measurement density functions. Part 2: Finite-element-method calculations,” Appl. Opt 34, 8026–8037 (1995). [DOI] [PubMed] [Google Scholar]
- 17.Penrose R, “A generalized inverse for matrices,” Proc. Cambridge Philos. Soc 51, 406–413 (1955). [Google Scholar]
- 18.Culver JP, Siegel AM, Stott JJ, and Boas DA, “Volumetric diffuse optical tomography of brain activity,” Opt. Lett 28, 2061–2063 (2003). [DOI] [PubMed] [Google Scholar]
- 19.Dehghani H, Pogue BW, Poplack SP, and Paulsen KD, “Multiwavelength three-dimensional near-infrared tomography of the breast: initial simulation, phantom, and clinical results,” Appl. Opt 42, 135–145 (2003). [DOI] [PubMed] [Google Scholar]
- 20.Culver JP, Ntziachristos V, Holboke MJ, and Yodh AG, “Optimization of optode arrangements for diffuse optical tomography: a singular-value analysis,” Appl. Opt 26, 701–703 (2001). [DOI] [PubMed] [Google Scholar]
- 21.Pogue BW, McBride T, Osterberg U, and Paulsen K, “Comparison of imaging geometries for diffuse optical tomography of tissue,” Opt. Express 4, 270–286 (1999). [DOI] [PubMed] [Google Scholar]
- 22.Dehghani H, Arridge SR, Schweiger M, and Delpy DT, “Optical tomography in the presence of void regions,” J. Opt. Soc. Am. A 17, 1659–1670 (2000). [DOI] [PubMed] [Google Scholar]
- 23.Ripoll J, Nieto-Vesperinas M, and Arridge SR, “Effect of roughness in nondiffusive regions within diffusive media,” J. Opt. Soc. Am. A 18, 940–947 (2001). [Google Scholar]
- 24.Pei YL, Graber HL, and Barbour RL, “Normalized-constraint algorithm for minimizing interparameter crosstalk in DC optical tomography,” Opt. Express 9, 97–109 (2001). [DOI] [PubMed] [Google Scholar]
- 25.Custo A, Wells WMI, Barnett AH, Hillman EMC, and Boas DA, “Effective scattering coefficient of the cerebral spinal fluid in adult head models for diffuse optical imaging,” Appl. Opt 45, 4747–4755 (2006). [DOI] [PubMed] [Google Scholar]
- 26.Durduran T, Yu GQ, Burnett MG, Detre JA, Greenberg JH, Wang JJ, Zhou C, and Yodh AG, “Diffuse optical measurement of blood flow, blood oxygenation, and metabolism in a human brain during sensorimotor cortex activation,” Opt. Lett 29, 1766–1768 (2004). [DOI] [PubMed] [Google Scholar]
- 27.Zhou C, Choe R, Shah N, Durduran T, Yu GQ, Durkin A, Hsiang D, Mehta R, Butler J, Cerussi A, Tromberg BJ, and Yodh AG, “Diffuse optical monitoring of blood flow and oxygenation in human breast cancer during early stages of neoad-juvant chemotherapy,” J. Biomed. Opt 12, 051903 (2007). [DOI] [PubMed] [Google Scholar]


