Abstract
The Michelson Interferometer for Global High-Resolution Thermospheric Imaging (MIGHTI) instrument on NASA’s Ionospheric Connection Explorer’s mission will measure neutral winds in the Earth’s thermosphere. We investigate how thermal changes to the instrument’s optical bench affect the relative position of the image recorded by the camera. The thermal shift is measured by fitting the image of a series of reference notches and determining their current position on the camera with subpixel precision. Analyzing ground-based calibration data, we find that the image position is not affected within the uncertainty of the analysis for the applied thermal changes. We also address the question of the analysis uncertainty with signal-to-noise ratio.
Keywords: interferometry, data processing, thermal effects, optical devices
1. Introduction
The Ionospheric Connection Explorer (ICON) mission is led by UC Berkeley and funded by NASA. ICON carries a payload of four instruments and was launched on a Pegasus-XL rocket into a circular, low-earth orbit with an altitude of 575 km in October 2019. The goal of the ICON payload is to better understand the weather of the thermosphere/ionosphere region.1 One of the instruments onboard the ICON science payload is the Michelson Interferometer for Global High-resolution Thermospheric Imaging (MIGHTI) system, which is led by the U.S. Naval Research Laboratory. MIGHTI will measure the horizontal velocities of the neutral winds in the upper atmosphere. Studying these winds will be critical to meet the ICON science objectives.
The wind measurement is performed using observations of two sensors (MIGHTI-A or MTA and MIGHTI-B or MTB) from which the Doppler shift of the naturally occurring green (557.7 nm) and red (630.0 nm) atmospheric emission lines of oxygen in the thermosphere can be derived.
The two sensors are aligned with perpendicular fields of view, such that by combining and inverting the derived line-of-sight winds, a horizontal velocity vector profile can be obtained. The Doppler shift is determined by modulating the atmospheric signal with a Doppler Asymmetric Spatial Heterodyne interferometer, producing a Fizeau fringe pattern. The atmospheric wind is obtained by determining the phase shift of the resulting interferogram spanning an optical path difference (OPD) between ∼4.5 and 5.5 cm. The phase shift difference between a reference fringe pattern for the emission and the observed pattern provides a measure of the Doppler shift and therefore the atmospheric wind. Since phase is measured spatially on the CCD sensor, any image shifts on the focal plane array of the camera could be misinterpreted as atmospheric winds. Further details of the system and unique advantages it provides over similar satellite instruments can be found in publications by Harlander et al.2 and Englert et al.3
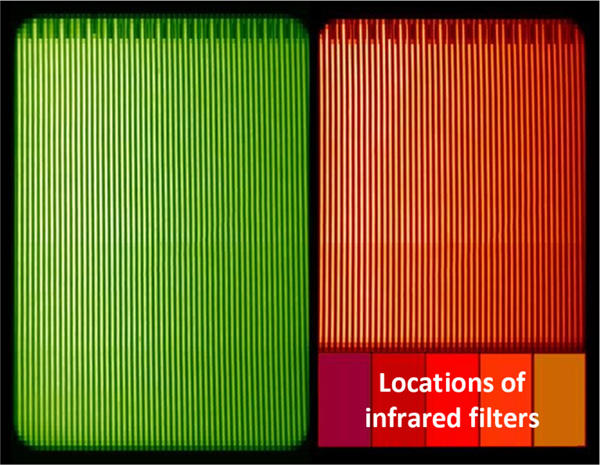
The MIGHTI system employs a variety of optical components to filter and separate the total atmospheric signal into three signals of interest—the green (557.7 nm) atmospheric emission line, the red (630.0 nm) atmospheric emission line, and the near-infrared atmospheric A-band. The A-band signal is used for determining atmospheric temperature4 and does not involve fringe analysis, so only the green and red line analyses will be discussed in this paper. Figure 1 shows a false-color representation of the corresponding sections of the camera image that is used by MIGHTI. In practice, this image will be binned vertically to reduce the effect of read noise and to reduce the data volume. The vertical dimension in Fig. 1 images the Earth’s limb between 90 and 300 km to obtain an altitude profile of the emissions, while the horizontal direction images the OPD. For quasi-monochromatic sources, as shown here, interference fringes are observed, the phase of which contains the Doppler shift information.5 Measuring the red and green line emissions allows the determination of neutral winds at altitudes between 90 and 300 km throughout the “day” and “night” parts of the orbit. The optics of the MIGHTI system have been discussed in detail by Englert et al.3 In this work, we focus primarily on the series of reference notches, which have been laser-cut into one of two echelle diffraction gratings that terminate the interferometer arms and which are imaged on the CCD (for further details on the construction and testing of these gratings, see Englert et al.6). The notch pattern can be seen in at the top of Fig. 1 and also in Fig. 2 which shows an image of the top portion of a binned, white-light image of a “notched” grating. The reference notches are visible on the recorded image whenever signal is present at their location. Measuring the relative location of this notch pattern on the focal plane array allows for the determination of any image shift caused by thermomechanical distortions of the MIGHTI optical bench. Without these reference notches, any shift of the image on the focal plane array could be misinterpreted as a phase change of the fringe pattern, which would propagate as an error to the velocity measurements. Ideally, the laser-cutting process used to make the notch pattern would create perfectly absorbing, dark areas on the grating, but in practice, roughly 20% of the incident signal still reflects from the notched areas. This signal could be from reflection off any remaining gold coating, off the metallic grating substrate, or a combination of both.
Fig. 1.
The three different camera portions of MIGHTI (colorized).3 The left (green) section is the fringe pattern corresponding to the 557.7 nm emission, the right (upper portion of red) section is the fringe pattern corresponding to 630.0 nm. The bottom right contains the infrared signal used to retrieve atmospheric temperature.3,4 The periodic notch pattern is also visible at the top of the image.
Fig. 2.
An example image of the notch pattern (lighter green, MIGHTI-A green side, colorized).
A second source of phase shifts that could be misinterpreted as a Doppler shift of the source signal is the thermal drift of the interferometer. To quantify this effect on orbit, and to allow for its subsequent correction, the MIGHTI instrument includes onboard calibration lamps, which provide a frequency standard. An in-depth discussion on the construction and characteristics of the calibration lamp unit can be found in Marr et al.7 Previous work by Marr et al.8 confirmed that the phase drift of spectrally isolated single lines from calibration lamps can be used to accurately determine the corresponding thermal drift (phase change) of atmospheric emission line interferograms. The emission from the calibration lamps is fed into the sensor beam path prior to the interferometer using a partially reflecting beamsplitter, producing a superimposed fringe pattern of different spatial frequency than that from the atmospheric emission. The calibration lamp signal uniformly illuminates the entire image, including the rows occupied by the notch patterns. Though the temperatures of the MIGHTI interferometer and the MIGHTI optical bench are maintained by proportional integral derivative-controlled sensor/heater systems, temperature variations are possible on orbit from sources such as sunlight–shadow transitions or spacecraft bus voltage changes that can temporarily imbalance the thermal control of the system.
On orbit, the image of the notched area of the grating will contain a signal that is the superposition of one or two fringe patterns, from atmospheric and/or calibration lamp emissions, and the notch pattern. To determine the location of the notches, a synthetic function, hypersampled to 1000 subpixels per pixel, is constructed using signal parameters, which are derived from a CCD row of fringes just below the notches and scaled accordingly. A Levenberg–Marquardt fitting algorithm determines the free parameters assigned to the fringe amplitude, fringe phase, fringe offset, and horizontal notch pattern shift. The determined notch pattern position is compared to a reference position and the difference in pixel units is converted into a corresponding fringe phase shift for the wavelength of interest. This fitting approach uses a synthetic function that can accurately replicate the signal both outside the notches and in each notch where the signal is only partially reflected. The approach and the relevant equations used for the fit algorithm are discussed further in Sec. 3.
The calibration lamps will be turned on for several days at the start of the ICON mission and then for one “calibration orbit” each day during normal operation, which will allow the characterization of orbital thermal effects. Instrumental thermal effects are driven by variations in the low-earth on-orbit thermal environment, which are expected to be both periodic from changes in solar illumination throughout the orbit and slowly varying from seasonal changes to the beta angle and solar flux throughout the mission lifetime.9 Though the primary illumination of the notch rows will be from the calibration lamps during each calibration orbit per day, the fitting approach is unchanged when determining drift of an image with only atmospheric signal or with both atmospheric and calibration emission lines, as explained below.
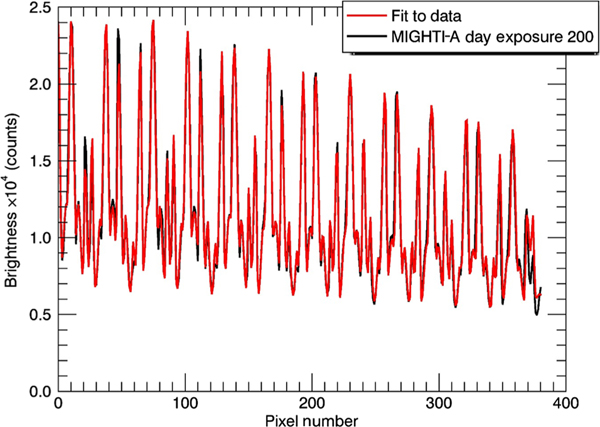
Owing to the brightness changes and stray light considerations between day and night, the red and green calibration lamps have different intensities and only one will be used as a thermal reference at any given time. Therefore, the green signal will be referred to as the night side and the red signal as the day, which follows the usage pattern of the calibration lamps. An example of the day calibration lamp signal in a notch row is provided in Fig. 3, along with the result of the fitting procedure. The day calibration lamp signal has an average value of 17,500 counts for a 30-s exposure and lies on the right side of the camera image [cf., Fig. 1], while the night data average lies near 1800 counts. The prelaunch calibration data shown here include simultaneous signals from both the green and the red calibration lamps and are from both MIGHTI sensors. The MIGHTI-A and MIGHTI-B sensors have slightly different characteristics based on their individual optical components and alignment but are functionally equivalent.
Fig. 3.
An example fit (red) to a single notch row (black) from MIGHTI-A, red side (day side).
This paper discusses the methodology used to determine the position of the image of the notches on the camera CCD focal plane array, the results from using this parameter fitting on a set of calibration data with varied bus voltage and temperature, the impact of an additional (simulated) atmospheric line, and the effect of lowering the signal-to-noise ratio (SNR) of the observation on the precision of the fit. We find that bus voltage changes that are representative of expected on-orbit changes, and which slightly affect the optical bench temperature, did not cause a measurable shift in the notch positions. We also show that the addition of a simulated second fringe pattern does not lower the accuracy of the fitting process in any statistically significant way, and that lowering the SNR below 15 (as defined in Sec. 4) results in the failure of the fitting routine to determine a drift within the required analysis uncertainty.
2. Observational Data
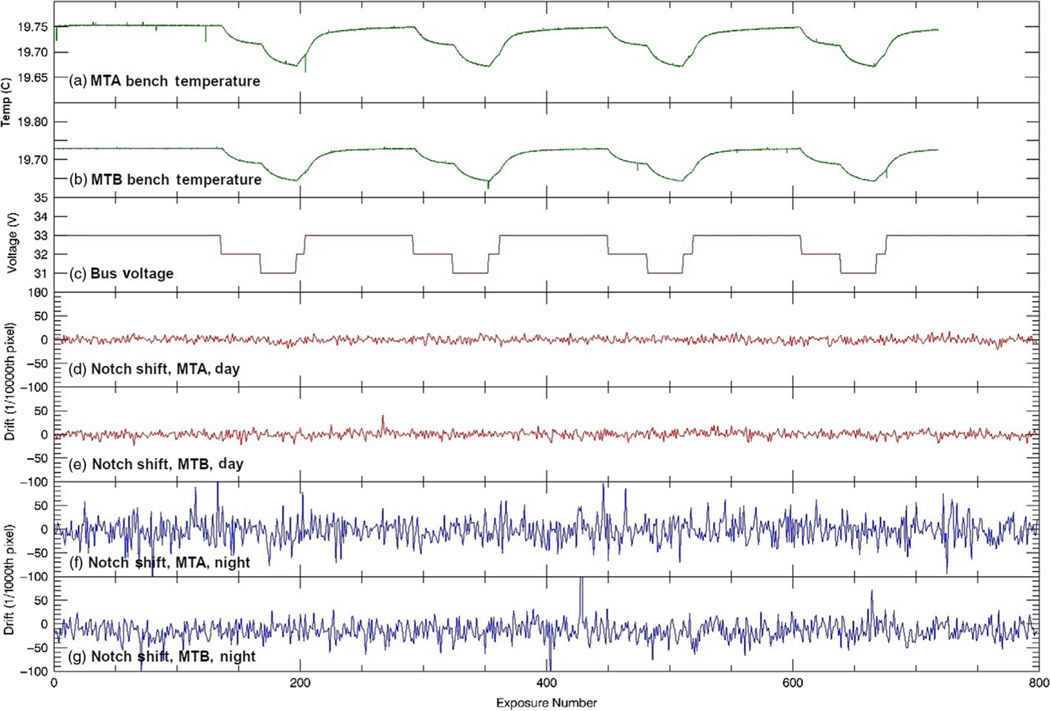
The data set used for this analysis was gathered on 27 January 2016 at the Space Dynamics Laboratory at Utah State University in Logan, Utah, over 9 h, with MIGHTI installed and operating within a thermal vacuum chamber. To induce a temperature change, the voltage supplied to MIGHTI’s bench heaters was dropped and then increased incrementally to simulate the effect of changes in solar array illumination during an orbit [see Fig. 6(c)]. Starting at an equilibrium of 33 V (nominal operating voltage), the voltage was decreased to 32 V for 20 min, to 31 V for 18 min, then up to 32 V for 5 min, and finally back to 33 V for 55 min during which the system nearly returns to equilibrium. This pattern was repeated four times to simulate four 98-min orbits. Images of 30-s exposures were taken continuously during this test, and the temperature of the optical bench and interferometer enclosure were recorded every second using the system thermocouples [Figs. 6(a) and 6(b)]. A set of control images was taken before any voltage changes were applied. This provides a sample size of 799 images per sensor, 665 of which are present in the voltage stepping zone. Every binned image is 1026 pixels wide and 128 pixels tall, though to avoid edge effects only 415 pixels on the night side and 381 pixels on the day side are used per row, as described in Englert et al.3 Unlike the rest of the data in the image, the notch rows are not corrected by the main analysis routine for flat-field variances, spikes, or potential edge effects because of the complex characteristics of the fringe signal within the notched area.
Fig. 6.
(a) and (b) Temperatures from the optical bench of MIGHTI-A and MIGHTI-B, respectively. (c) The voltage provided to both MIGHTI-A and MIGHTI-B. (d) and (e) The subpixel (1∕1000 pixel) drifts from the day side of MIGHTI-A and MIGHTI-B, respectively. (f) and (g) The subpixel drifts from the night side of MIGHTI-A and MIGHTI-B, respectively.
3. Methodology
The notch position fit is a multistep procedure that relies on four pieces of information—the shape of the notch pattern, the behavior of signal from inside of the notch pattern, the behavior of signal between the notches, and a fringe pattern without notches near the reference row. The equations that model the signal in counts are given below [Eqs. (1)–(3)]. Here, the range of x (pixel number) is determined by the size of the pixel window, that is, on which side (color) of the CCD is being analyzed. This paper improves upon on the analysis conducted by Englert et al.3 on the thermal drift of this data set by using a new method for fitting the signal inside and outside the notches. The drift continues to be calculated with a sampling rate of 1/1000th of a pixel in order to achieve subpixel precision.
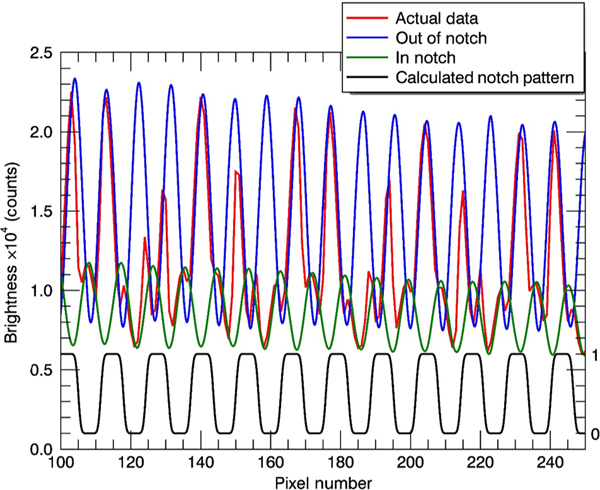
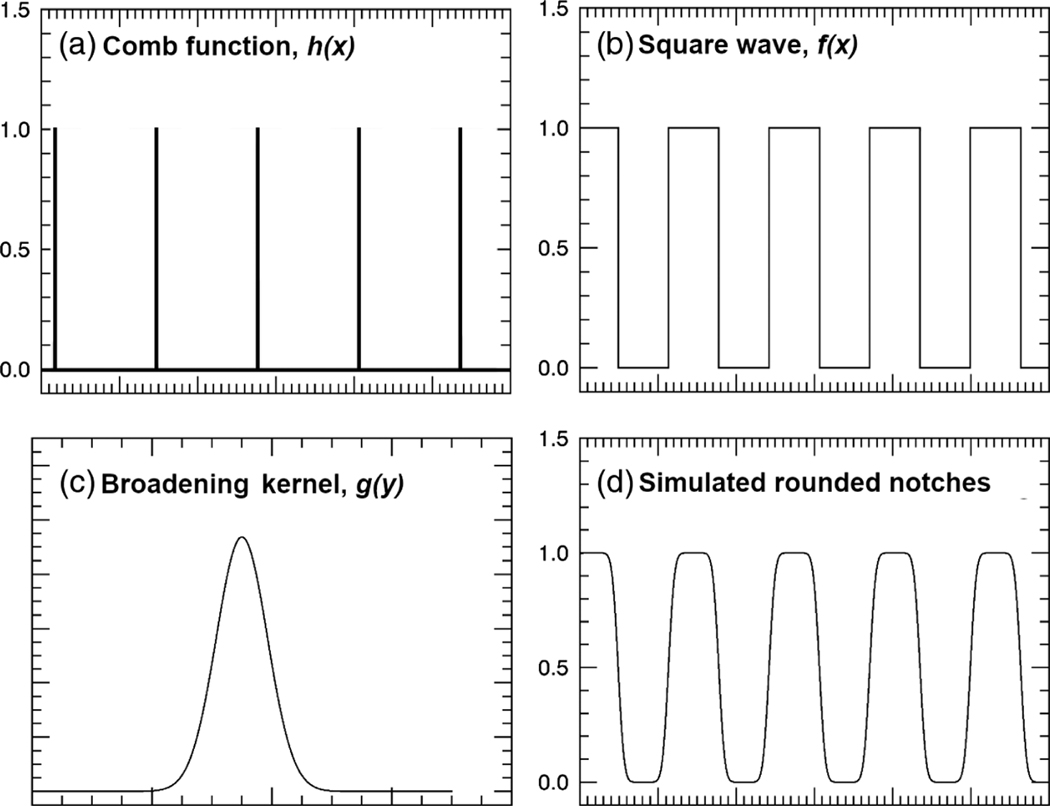
We represent the signal along a notch row through Eq. (1), which can be used (with different parameters) for both MIGHTI-A and MIGHTI-B and for both day and night data. Equation (1) has two parts, which represent the fringes in the areas outside the notches and the areas inside the notches, respectively. These two parts are shown in Fig. 4 (blue and green, respectively) along with the notch pattern itself (black) and the calibration data (being represented in red). Estimates of the fringe parameters that are used in Eq. (1), such as intensity and phase with OPD, can be obtained by analyzing the fringe pattern from a row just below the notched rows (a “no-notch” row). Since these rows do not have notches, they approximate the fringe pattern between the notches where the gratings have not been treated by the laser. Inside the notches, the fringe pattern has the same spatial frequency but a different phase, signal offset, and amplitude. The notches themselves are first modeled as a series of delta functions, or comb function, with a frequency equal to the spatial frequency of the notches, as given in Eq. (2). To create the square wave, the comb is convolved with a rectangle function with width equal to half the comb spacing. Lastly, the resulting square wave is convolved with a Gaussian broadening function, defined by Eq. (3), which creates the rounded edges of the notches due to the imperfect imaging optics and laser ablation process. This process is graphically demonstrated in Fig. 5.
| (1) |
| (2) |
| (3) |
where IDC is the brightness offset determined from the no-notch row, A is the calculated amplitude from the no-notch row, ϕ(x) is the calculated interferogram phase from the no-notch row, δϕ is the expected phase offset between the notch and no-notch row, x is the pixel position in subpixels, Nnotches is the number of notches in the pixel window, xsize is the width of the pixel window, σK is the width of the Gaussian broadening function used to simulate the rounded edges of the notches, y is the domain of the broadening function, and az are the parameters to be fit by the fitting routine. Of these fit parameters, ao is the most important as it represents the shift of the notch pattern on the camera.
Fig. 4.
Hypersampled representations of the out-of-notch (blue) and in-notch (green) portions of Eq. (1) compared to a notch row of MIGHTI-A, day (red). Also shown is the rounded notch pattern (right scale) in black.
Fig. 5.
(a) The delta function comb, h(x), representing the spatial notch frequency. (b) The constructed ideal square notch pattern, f(x), with 50% duty cycle. (c) The Gaussian broadening kernel, g(y), best representing the edges of the notches. (d) The rounded notch pattern used in the fitting routine, (f × g)(x).
The frequency of the square wave, Nnotches, and the amount of smoothing, σK, are the physical characteristics of the interferometer that should not change with bus voltage or temperature. Thus, they can be determined from the calibration data by allowing the fit routine to modify these values as parameters (along with az) over several exposures at constant temperature. The median of these values is then used as a constant for all future analyses. By fixing these values, we reduce the computational load and ensure that the other parameters can be determined more accurately, as the fit is exceedingly sensitive to small changes in Nnotches. In a short examination of parameter sensitivity, a change of 0.5% to Nnotches, which is an absolute increase of only 0.148 notches over the window, resulted in an increase of 50% for the fit uncertainty, χ2. These parameters will be confirmed in a similar manner during early on-orbit operations.
The fitting is performed with the IDL CURVEFIT function, version 8.4. The data are corrected for spikes and “hot pixels” before being run through the fit routine. Spikes are identified by comparing the data to an initial guess of the signal shape. For this reason, and due to the periodic nature of the signal, it is crucial to define initial parameter guesses relatively close to the expected final fit results, especially for the phase offset of the signal. Obtaining proper initial guesses is facilitated by performing a Fourier transform on a fringe pattern from the no-notch row. Unlike the notch rows, which have a variety of complex patterns and a complicated Fourier representation, the rows without notches display classic cosine waves with all the expected characteristics (offset, amplitude, and phase). Englert et al.3 has shown that the signal characteristics should be near identical between rows close in proximity, and any differences can be fitted for by the parameters. As seen in Eq. (1), these characteristics are implemented in the fit function multiplicatively, which eases processing power requirements and reduces run time while still allowing the routine to explore the full parameter space. The signal is also weighted to emphasize the middle pixels through a Hann function to avoid Fourier edge effects impacting the quality of the fit. The Fourier space characteristics are interpolated to 1000 subpixels per pixel allowing the resulting notch shift ao, as found in Eq. (2), to be calculated with subpixel resolution. The fitting routine is performed on all 799 images for each camera twice, once for day side (using the red line) and once for night side (using the green line), recording the values of both the uncertainty of the fit, χ2, and the notch pattern shift, ao.
To determine the effect of a second signal line on the effectiveness of the fitting procedure, which could occur in the case of atmospheric emissions during the day, a simulated line was constructed and added to the prelaunch calibration signal measurements. The wavelength of the calibration lamp creates roughly 42 fringes for day and 49 for night per image, as each side of the camera has different numbers of pixels, frequency, and magnifications. Through a Fourier transform, we construct a simulated line with 53 fringes for day and 73 for night, which correspond to the expected frequencies for the atmospheric emission lines. The simulated line is modeled after the prelaunch calibration data, which allows the simulated lines to incorporate any system irregularities, such as hot pixels or flat-field considerations. As ϕ(x) in Eq. (1) is the phase with OPD (or pixel number) from the no-notch row, which also has signal from both emission lines, it automatically includes both lines in the fit without any modification to the fitting routine. The two-line fit was shown to be effective for a variety of simulated line conditions. The amplitude and offset of the atmospheric signal were modulated between 0.5 and 1.5 times the calibration brightness to ensure that the drift could be found with a variety of strengths for atmospheric signals, as day-to-day and seasonal changes to atmospheric intensity are expected to be significant.
4. Results and Discussion
Examining the temperature data of the optical bench measured for both MIGHTI-A and MIGHTI-B, we see a temperature range of 19.65°C to 19.75°C, which demonstrates that changing the voltage to the heaters directly causes temperature variation in the optical bench. It should be noted that the optical bench did not return completely to thermal equilibrium during the orbital tests [Figs. 6(a) and 6(b)]. The first 137 images taken before the voltage changes were applied are used as a control for the subsequent orbit simulations and the first 10 images were used to find the number of notches per image and the width of the rounding kernel.
The fitting process proved to be successful and the drift was determined to be within 0.1 of a pixel for every image for both cameras except one on the MIGHTI-B night side (image 428) that was found to be corrupted by the CCD readout process. Several images that had large drifts (∼10% of a pixel width) had spikes in the signal from an unknown source, which prompted the addition of the spike removal process. This process replaces the spikes (observed to be 1- to 3-pixels wide at most) with the associated values from the expected line shape based on initial guess conditions. With the exception of these outliers, the standard deviation of the notch pattern position, night side for both sensors is 23.09 subpixels (0.02309 pixels). The day side with its brighter signal has a much lower standard deviation of 6.39 subpixels (0.00639 pixels). The addition of a second line did not markedly increase the standard deviation of the derived drift for either case. The spike removal process successfully brought the spike contaminated images into agreement with the uncertainties listed here.
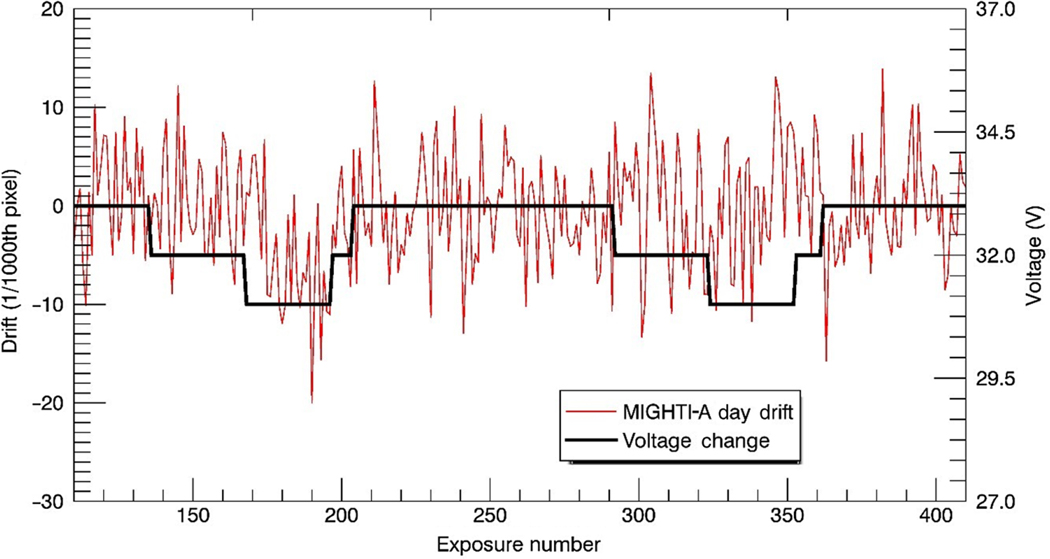
There was no systematic correlation found between the temperature changes and image drift for either sensor or day/night [Figs. 6(d)–6(g)]. There appears to be a potential response in MIGHTI-A day to the first voltage dip near image 200, but there is no response during subsequent voltage dips nor does the magnitude of the drift appear to correlate with any individual voltage increments. This apparent response is shown in Fig. 7, which displays the first two simulated orbits (220 images) of drift data. MIGHTI-B day, MIGHTI-B night, and MIGHTI-A night do not react systematically to any of the voltage steps, providing further evidence that the observed dip in MIGHTI-A day from the first simulated orbit is likely due to other causes.
Fig. 7.
A closer look at the response of MIGHTI-A day during simulated orbits 1 and 2.
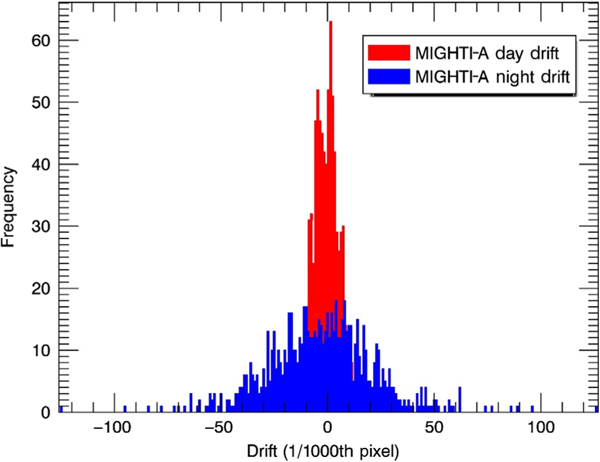
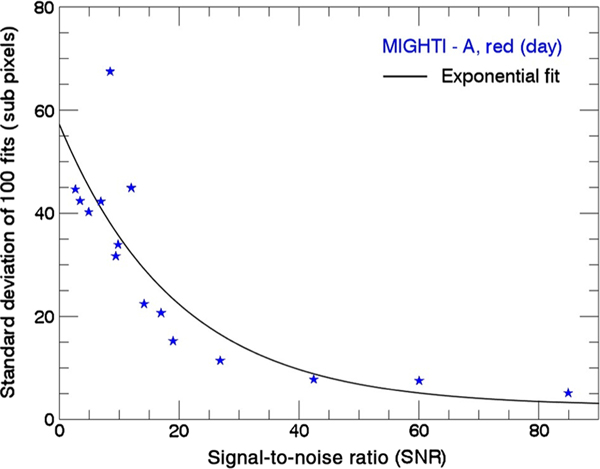
As expected from the lower signal at night, one result from the analysis of the calibration data was that the night side scenarios for both MIGHTI-A and MIGHTI-B displayed higher notch pattern drift uncertainty—approximately a factor of 3.6. This difference can be seen in Fig. 6, where Figs. 6(d)–6(g) are all displayed on the same y scale and in Fig. 8, which is a histogram of the MIGHTI-A data, day and night. The night data, shown as the blue histogram in Fig. 8, have much higher uncertainty than the day data, shown in red. The reason for this difference is the lower SNR present for the night data. Defining the SNR as the ratio of the fringe amplitude to the square root of the mean value of the signal (as expected from shot noise) in electrons, we see that the night data have an SNR of ∼20 compared to the day data’s SNR of 85. To study the effect of SNR on uncertainty, additional random noise was added to the single line calibration exposures resulting in SNRs ranging between 2.5 and 85. By fitting 100 images at each chosen SNR, we calculated the standard deviation of the resulting drifts. The results are plotted in Fig. 9. Note that below a SNR of 10, the fit routine could not consistently determine the notch position due to the noise and the displayed data points consist of only successful fits. We find that below an SNR of 15 the uncertainty of a single fit exceeds MIGHTI’s precision requirements when converted to wind speeds [see Eq. (4) below].
Fig. 8.
A histogram comparison of the subpixel drift of MIGHTI-A day and night.
Fig. 9.
The standard deviation of the subpixel drift of MIGHTI-A day with variety of diminished SNRs. The lower the SNR, the more noise has been added to the data. Also shown is an exponential fit to the data.
Converting from pixel drift to wind speed is crucial to understanding the impact of image drift on wind speed uncertainty. However, the pixel drift will affect both the atmospheric and calibration lines, and it is the difference between the two that determines the wind speed. This conversion is defined by the equation provided in Englert et al.5 and a modified version is given below as Eq. (4). To properly calculate the associated velocity uncertainty, the phase term, δthermal, must be converted from pixel space to phase space, so the left side of Eq. (4) includes a term of Nfringes∕Npixels · π∕180, where Nfringes is the difference in number of observed fringes (between atmosphere and calibration lines) in the window found through a Fourier transform and Npixels is the width of the pixel window, which is roughly 420 pixels for red and 450 pixels for green.
| (4) |
where Δd is the OPD, σ is the wavenumber, v is the atmospheric wind velocity, and c is the speed of light. The OPDs and the wavelengths of the MIGHTI sensors can be found in Englert et al.3 Calculating the expected worst case for the data in Fig. 8 at three standard deviations results in an uncertainty envelope for MIGHTI-A of 0.27 m∕s for day and 1.39 m∕s for night, with similar numbers for MIGHTI-B, which are all well within required instrument precision. If on-orbit temperature variations are greater than the expected 0.1°C, the uncertainty can be lowered further with a priori knowledge that the notch pattern position will be slowly drifting in time, with expected timescales of several minutes (see Fig. 6, where every exposure is about 30 s), as the changes to the thermal environment due to day–night or seasonal shifts are also expected to be slow. By averaging the calculated mechanical shifts in groups of five exposures or more, the uncertainty envelope can remain within the required instrument precision.
5. Conclusion
This analysis is a follow-up on the work in by Englert et al.3 with an improved analytic fitting function and a new signal to noise ratio analysis. The previous analysis of thermal image shifts in calibration data assumed perfectly square notches, which is not consistent with the observed rounded edges of the notches and the finite modulation transfer function of the imaging system. It is not known how much of the gold coating was removed from the notches during the laser ablation or if ablated pieces of gold from within the notches were deposited on nearby surfaces. By initially determining both the frequency of the notches and the rounding of the notch edges, we can more accurately represent the physical characteristics of the notches and reduce the time required for subsequent fits. Future work with similar systems could attempt to fit individual notches for unique curvature and edge characteristics, though this was not found to be necessary for the precision requirements of MIGHTI.
We have determined that the thermal variations of 0.1°C generated during the prelaunch testing do not result in an observable, systematic drift of the images as recorded by the MIGHTI system, and the uncertainty envelope of the expected drift has been found to be on the order of other sources of measurement uncertainties. Earlier results indicated a systematic and repeatable response in MIGHTI-B with the same data set, but this improved method for measuring thermal image shift did not corroborate that conclusion. Figure 6 shows the new results, which we believe capture the notch pattern shift more accurately and precisely. The results do not indicate any systematic response of the notch pattern position to the induced thermal changes. The new method does agree that for a 3-sigma uncertainty, the Doppler-speed uncertainty of these shifts is on the order of 1 to 2 m/s. Any image shifting greater than this should be identifiable and removed during analysis. However, this work supports the conclusion of Englert et al.3 that no significant image shifting is expected from the onboard thermal environment.
A second, artificial line constructed to match the expected atmospheric emissions was added to the calibration data and the fitting method was tested and found to be successful in fitting the more complex signal. The effect of additional noise on the signal was also tested, and the uncertainty envelope of the drift was shown to increase with increasing noise. A spike correction routine was implemented in the fitting routine and was found to increase fit precision through the replacement of the spikes with expected signal values.
The reported fitting approach shows the power of the classic Levenberg–Marquardt algorithm to fit multiparameter, periodic systems with measurement uncertainties. It also shows the value of the reference notch pattern, which allows for quantification and potential removal of this systematic error to increase the accuracy of and confirm the precision of all MIGHTI measurements. This is also the first time a simulated atmospheric line has been added to the calibration data in the notch rows and it has been shown that, despite the additional complexity, fitting can be performed with a high degree of precision.
Once MIGHTI is on orbit and collecting data, several full calibration orbits will be performed to confirm that the optical alignment has not shifted during launch and the camera is behaving as expected. This will provide an extended period of time wherein the average position of the notches and any periodic drift during an orbit can be determined. With this information, the fitting routine presented here can quantify any image drift, allowing the MIGHTI data to be corrected for this potential source of error, if needed.
Acknowledgments
We would like to thank Brian J. Harding and Michael H. Stevens for their valuable assistance on the drift fitting process, Charles M. Brown for his expertise on the physical characteristics of the notches, and Ian Miller and his team at LightMachinery Inc. for their work on the creation and documentation of the notch pattern. ICON and MIGHTI are supported by National Aeronautics and Space Administration Explorers Program through contracts NNG12FA45C and NNG12FA42I. We would like to acknowledge the Pathways Internship Program through the Naval Research Laboratory for the funding it provided to make this work possible.
Biography
Kenneth D. Marr works in the Space Science Division at the U.S. Naval Research Laboratory (NRL). He received his BS degree in physics from Principia College in Elsah, Illinois, in 1999, and his PhD in plasma physics from the Massachusetts Institute of Technology in 2010. He is the author of seven papers and coauthor of several journal articles and conference presentations. His current research interests include spectroscopy, atmospheric remote sensing, solar physics, and optical design.
Aidan S. Thayer is a fourth-year undergraduate at Case Western Reserve University, pursuing degrees in physics, math, and German language studies. He works with the U.S. NRL on school breaks through the Student Pathways program.
Christoph R. Englert received a graduate degree in physics from the Technical University of Munich/Germany and a doctorate degree in physics from the University of Bremen/Germany. He is the superintendent of the NRL Space Science Division. He is the coauthor of about 80 journal papers and technical reports and holds six patents. His current research interests include space-based atmospheric sensors and upper atmospheric research.
John M. Harlander is a professor of physics (emeritus) at St. Cloud State University and senior scientist at Space Systems Research Corporation. He holds a PhD in physics from the University of Wisconsin-Madison and a BA degree in music from the University of Wisconsin-Eau Claire. He is the coauthor of over 70 journal articles and technical reports and holds three patents. His primary research focus is in developing high-throughput spectrometers for atmospheric and astrophysical studies.
Footnotes
We declare that there are no conflicts of interest related to this article.
References
- 1.Immel TJ et al. , “The ionospheric connection explorer mission: mission 2. Goals and design,” Space Sci. Rev. 214, 13 (2018). [DOI] [PMC free article] [PubMed] [Google Scholar]
- 2.Harlander JM et al. , “Michelson Interferometer for Global High-Resolution Thermospheric Imaging (MIGHTI): monolithic interferometer design and test,” Space Sci. Rev. 212, 601–613 (2017). [DOI] [PMC free article] [PubMed] [Google Scholar]
- 3.Englert CR et al. , “Michelson Interferometer for Global High-Resolution Thermospheric Imaging (MIGHTI): instrument design and calibration,” Space Sci. Rev. 212, 553–584 (2017). [DOI] [PMC free article] [PubMed] [Google Scholar]
- 4.Stevens MH et al. , “Retrieval of lower thermospheric temperatures from O2 A band emission: the MIGHTI experiment on ICON,” Space Sci. Rev. 214, 4 (2018). [DOI] [PMC free article] [PubMed] [Google Scholar]
- 5.Englert CR, Babcock DD, and Harlander JM, “Doppler Asymmetric Spatial Heterodyne spectroscopy (DASH): concept and experimental demonstration,” Appl. Opt. 46, 7297–7307 (2007). [DOI] [PubMed] [Google Scholar]
- 6.Englert CR et al. , “High-efficiency Echelle gratings for MIGHTI, the spatial heterodyne interferometers for the ICON mission,” Appl. Opt. 56, 2090–2098 (2017). [DOI] [PubMed] [Google Scholar]
- 7.Marr KD et al. , “Calibration lamp design, characterization, and implementation for the Michelson Interferometer for Global High-Resolution Thermospheric Imaging instrument on the Ionospheric Connection satellite,” Opt. Eng. 58(5), 054104 (2019). [DOI] [PMC free article] [PubMed] [Google Scholar]
- 8.Marr KD et al. , “Thermal sensitivity of DASH interferometers: the role of thermal effects during the calibration of an Echelle DASH interferometer,” Appl. Opt. 52, 8082–8088 (2013). [DOI] [PubMed] [Google Scholar]
- 9.Justus CG et al. , “Simple thermal environment model (STEM) user’s guide,” NASA/TM—2001–211222; (2001). [Google Scholar]


