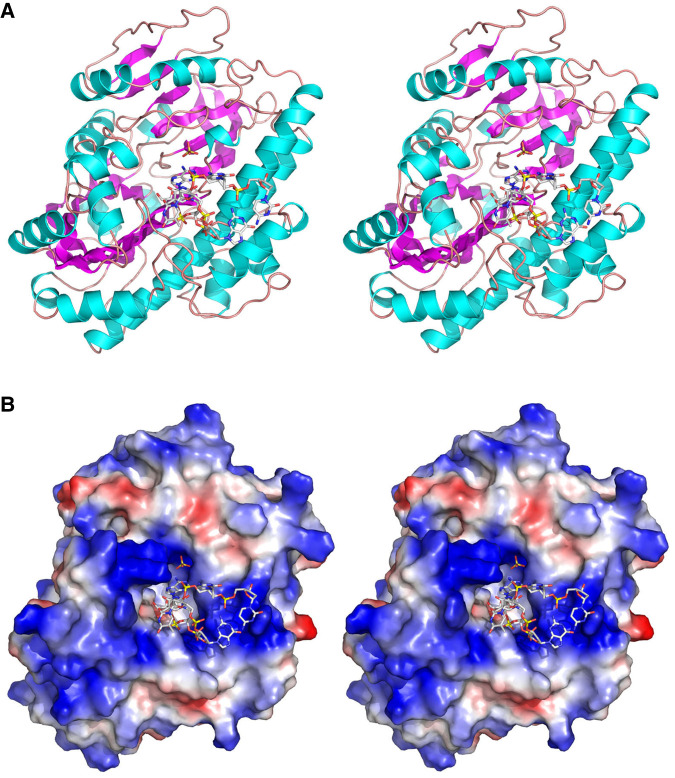
FIGURE 2.
Structure of RtcB in complex with 5′-OH oligonucleotide. (A) Stereo view of the RtcB fold, shown as a cartoon model with magenta β strands and cyan helices. The 5′-OH DNA oligonucleotide and sulfate are rendered as stick models. (B) Stereo view of a surface electrostatic model of RtcB (generated in Pymol) in the same orientation as in A, with the 5′-OH DNA and sulfate depicted as stick models.

