

Abstract
OBJECTIVE
Epidemiological studies have shown that mortality owing to the coronavirus disease 2019 (COVID-19) could be under-reported under different conditions. Excess mortality analysis is suggested as a useful tool in estimating the impact of the disease.
MATERIAL AND METHODS
Mortality data between January 01 and May 18, 2020, were analyzed to evaluate the excess mortality owing to COVID-19 in Istanbul, the city most affected by the pandemic in Turkey. The average weekly percentage changes in the number of deaths in 4 previous years were compared with those in the year 2020 using excess mortality analysis.
RESULTS
The number of deaths in Istanbul was significantly higher in 2020 (p=0.001), with a 10% weekly increase between the 10th and 15th weeks, which started to decrease until the 20th week. The excess mortality found during the study period was 4,084 deaths, higher than the officially reported COVID-19 mortality.
CONCLUSION
Our findings demonstrated that mortality owing to COVID-19 could be higher than the official figures reported by health authorities.
Keywords: Excess mortality, coronavirus disease 2019, pandemic, Turkey
INTRODUCTION
As of July 05, 2020, the World Health Organization (WHO) reported more than 11 million confirmed coronavirus disease 2019 (COVID-19) cases and over half a million deaths worldwide [1]. Turkey notified its first COVID-19 case on March 11, 2020, and has been considerably affected by the pandemic since then. By the end of the first week of July 2020, the Turkish Ministry of Health (MoH) had reported a total of 205, 758 confirmed COVID-19 cases and 5,225 deaths throughout the country [2].
These figures are vital in understanding the magnitude of the pandemic; however, they are not fully sufficient in revealing the disease impact. Although the WHO recommends the use of confirmed and probable case definitions for global surveillance of COVID-19, most countries use epidemiological measures that rely solely on polymerase chain reaction (PCR)-confirmed cases [3]. Hence, the figures are affected by the limited availability of laboratory testing and the sensitivity of PCR tests, which lead to an underestimation of the morbidity data [4, 5].
Evaluating weekly excess deaths owing to COVID-19 is suggested as an alternative method to overcome the shortcoming of the estimates mentioned earlier [5, 7]. Excess mortality is calculated by comparing the number of deaths in the epidemic period with that of the previous years for a specific population. Hence, excess mortality is basically the difference between the observed and the expected deaths that are attributed to the event of interest. This estimate provides 2 advantages. First, it takes into account the mortality among the undiagnosed, mainly false-negative cases, who are not notified within the surveillance system [7]. Excess mortality also provides a correction for patients who had died owing to causes other than COVID-19 without getting the medical attention they needed [5]. The healthcare-seeking behavior might have changed owing to the COVID-19 pandemic. Some patients with health conditions other than COVID-19 might be reluctant to consult healthcare for the fear of getting infected. The lockdown might have contributed to this problem even more; some fatalities might have resulted from not getting timely medical attention [5, 8]. In addition, in some regions, the health services could have been overwhelmed by COVID-19, and it is proposed that the additional mortality might have occurred because of the system disruption [9]. Hence, the calculation of excess deaths is a useful and objective way to understand the direct and the indirect burden of COVID-19 on the population of interest. A number of studies that evaluate excess deaths in different populations indicate considerable increases in all-cause mortality attributed to COVID-19 [5, 8–13]. By studying these examples, we can compare different prevention and control policies across diverse populations using an objective method [7, 11].
A method other than official reporting of confirmed cases is necessary owing to huge variations in under-reporting of COVID-19 deaths between countries [14]. Studies carried out by economists have shown that the number of excess deaths is usually greater than the number officially reported by governments [15]. A study from Italy has shown that estimated excess was 44,352 deaths for persons aged >60 years and 680 for those younger than 60 years. The official reported deaths owing to COVID-19 were 21,046 [16]. A British study that revealed the highest excess all-cause mortality compared with that reported in the previous year urges the use of excess all-cause mortality as an indicator of disease burden in COVID-19 [17].
The objective of this study was to investigate the excess mortality owing to COVID-19 by comparing the pandemic period with the previous 5 years for Istanbul. Istanbul was selected as the study area because the Turkish MoH announced that more than 50% of the cases were notified from Istanbul [18].
MATERIAL AND METHODS
Mortality data for the first 20 weeks of 2016–2020 were accessed from the electronic state statistics data provided by the Municipality of Istanbul [19]. Mortality data between January 01 and May 18, 2020, for a total of 20 weeks were analyzed. This study was approved by Ethics committee of Koç University (Approval No: 2020.276.IRB1.099).
Statistical Analysis
Mortality rates were considered dependent variables, and weeks were considered independent variables. Logarithmic transformation was applied to all dependent variables. A permutation test was performed to determine the number of joints. Grid search method was used to find the best possible fit for parameter estimates, and finally, parallelisms of trend data whose mean functions are represented by join-point regression were compared between the past 5 years. Segmented regression analysis was performed using the Join-point Regression Program, version 4.8.0 (Joinpoint Regression Program, Version 4.8.0.1 - April 2020; Statistical Methodology and Applications Branch, Surveillance Research Program, National Cancer Institute.) [20]. Average weekly percent change (APC) and 95% confidence intervals (CIs) were calculated for each segment to evaluate the direction and effect size of the trend. A p-value<0.05 was considered statistically significant.
RESULTS
Mortality data of Istanbul were analyzed for the first 20 weeks of the past 5 years. When an absolute number of deaths were compared between 2020 and 2019, an excess amount of mortality was observed starting from the 11th week (10–16 March). The difference in the number of deaths between 2020 and 2019 for the 11th, 12th, 13th, and 14th weeks was 93, 248, 293, and 804 deaths, respectively. The highest difference in the number of deaths between 2019 and 2020 was observed in the 15th week (7–13 April) as 813 deaths. The difference reduced in the following weeks. The difference in the number of deaths between 2020 and 2019 for the 16th, 17th, 18th, and 19th weeks was 666, 488, 287, and 296, respectively. The number of deaths on the 20th week of 2020 was 96 deaths higher than that in the previous year. The total difference in the number of deaths between the 11th and 20th weeks of 2020 and those of 2019 was 4,084. The number of cumulative weekly deaths by year is presented in Figure 1.
Figure 1.
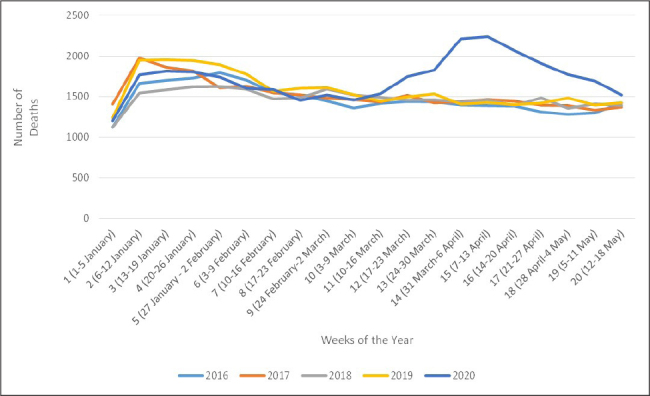
Number of cumulative weekly deaths by year in Istanbul, 2016–2020.
Results of segmented regression analyses for deaths in Istanbul are presented in Table 1. Different numbers of the segments were observed for weekly changes in Istanbul for the past 5 years. In 2016, the number of deaths had increased rapidly within the first 2 weeks of the year (APC=19.3, 95% CI=1.6–40.2) and slowly decreased until May 18 (APC=−1.2, 95% CI=−2.3 to −1.2) (Figure 2). In 2017, there were 3 significant segments. The number of deaths had increased rapidly within the first 2 weeks of the year (APC=14.2, 95% CI=6.9–22) and moderately decreased between the 3rd and 5th weeks (APC=−7.6 95% CI=−13.5 to −1.3) and slowly decreased between the 6th and 20th weeks (APC=−0.9, 95% CI=−1.2 to −0.6) (Figure 3). In 2018, the trends were very similar to those of 2016 (Figure 4). In 2019, there was a rapid increase in the first 2 weeks (APC=26.3, 95% CI=14.4–39.4), and then the number of deaths started decreasing rapidly between the 3rd and 6th weeks (APC=−7, 95% CI=−11.5 to −2.3), and the decrease continued with small changes until the 20th week (APC= −1.1, 95% CI=−1.6 to −0.5) (Figure 5). In 2020, the weekly decline rate was 21% (APC=21, 95% CI=9.4–33.8) for the 2 weeks, there was a significant decline between the 3rd and 10th weeks (APC=−3.9, 95% CI= −5.6 to −2.3), and this continued with 10% weekly increase between the 10th and 15th weeks (APC=10, 95% CI=6.5–13.5) and then started to decrease until the 20th week (APC=−7.7,95% CI=−9.8 to −5.6). When the APCs for the 4 previous years were compared with those of the year 2020, the number of deaths in İstanbul was significantly higher in 2020 (p=0.001).
Table 1.
Trend analysis for deaths in Istanbul for 2016–2020*
| Year | Number of segments | Weeks of segments | Dates of segments | ||
|---|---|---|---|---|---|
|
| |||||
| lower endpoint | Upper endpoint | APC (95% CI) | |||
| 2016 | 1 | 1–3 | January 01, 2016 | January 12, 2016 | 19.3 (1.6–40.2) |
| 2 | 3–20 | January 13, 2016 | May 18, 2016 | −1.2 (−2.3 to −1.2) | |
| 2017 | 1 | 1–3 | January 01, 2017 | January 12, 2017 | 14.2 (6.9–22) |
| 2 | 3–6 | January 13, 2017 | February 02, 2017 | −7.6 (−13.5 to −1.3) | |
| 3 | 6–20 | February 03, 2017 | May 18, 2017 | −0.9 (−1.2 to −0.6) | |
| 2018 | 1 | 1–3 | January 01, 2018 | January 12, 2018 | 17 (7.2–27.7) |
| 2 | 3–20 | January 13, 2018 | May 18, 2018 | −1 (−1.3 to −0.7) | |
| 2019 | 1 | 1–3 | January 01, 2019 | January 12, 2019 | 26.3 (14.4–39.4) |
| 2 | 3–7 | January 13, 2019 | February 09, 2019 | −7 (−11.5 to −2.3) | |
| 3 | 7–20 | February 10, 2019 | May 18, 2019 | −1.1 (−1.6 to −0.5) | |
| 2020 | 1 | 1–3 | January 01, 2020 | January 12, 2020 | 21 (9.4–33.8) |
| 2 | 3–10 | January 13, 2020 | March 02, 2020 | −3.9 (−5.6 to −2.3) | |
| 3 | 10–15 | March 03, 2020 | April 06, 2020 | 10 (6.5–13.5) | |
| 4 | 15–20 | April 07, 2020 | May 18, 2020 | −7.7 (−9.8 to −5.6) | |
APC: average weekly percentage change; CI: confidence interval
The segments, which encompass the dates after the notification of the first case (11 March 2020), are presented in bold.
Figure 2.
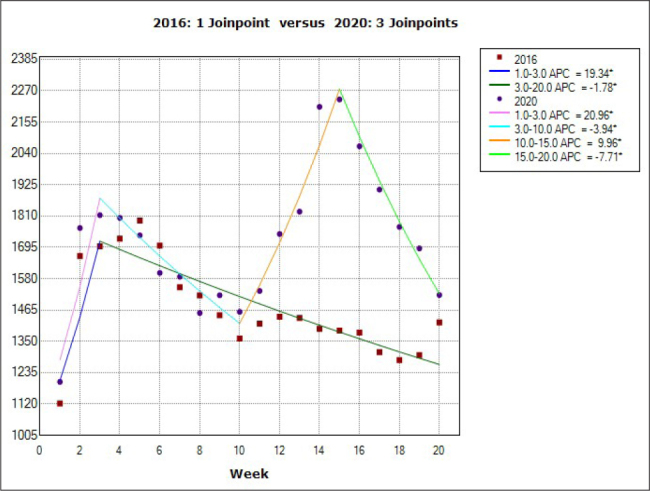
Comparison of the weekly case increase rates of 2016 with those of 2020 for the first 20 weeks of the year.
Figure 3.
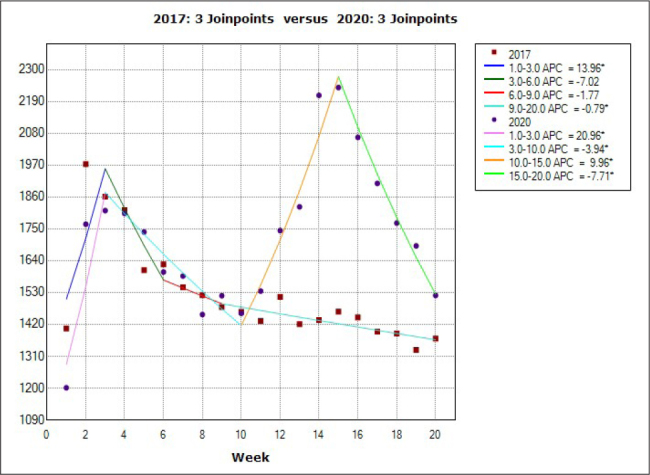
Comparison of the weekly case increase rates of 2017 and with those of 2020 for the first 20 weeks of the year.
Figure 4.
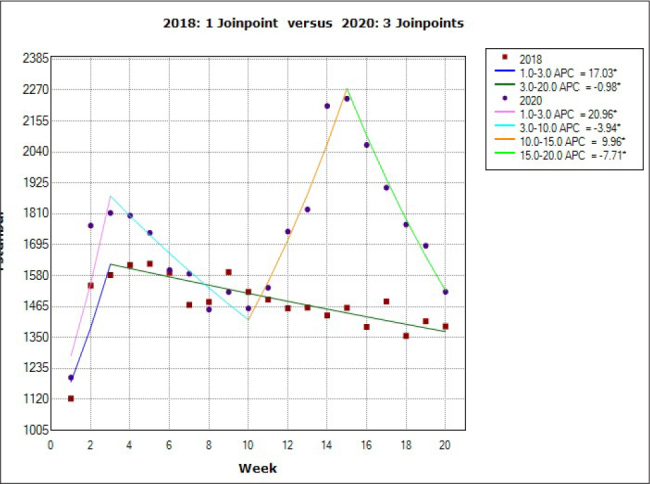
Comparison of the weekly case increase rates of 2018 and with those of 2020 for the first 20 weeks of the year.
Figure 5.
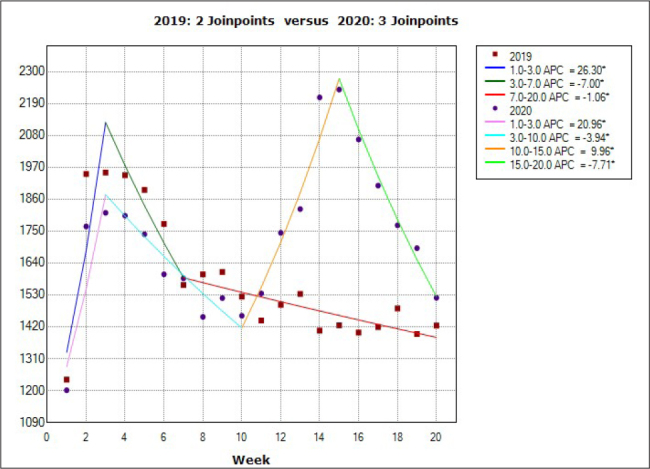
Comparison of the weekly case increase rates of 2019 and with those of 2020 for the first 20 weeks of the year.
DISCUSSION
Calculation of public health impact is crucial in the fight against a novel epidemic. Precise estimation of the severity of disease and mortality rate may change the management strategies. Therefore, accurate epidemiological data are of utmost importance. The results of this study showed a distinct increase in the number of deaths between the 10th and 15th weeks of 2020 compared with those of the previous 4 years in Istanbul. The total difference in the number of deaths between the 11th and 20th weeks (March 10–May 18) of 2020 and 2019 was 4,084.
According to the MoH report, between March 11 and July 05, 2020, there were 2,711 COVID-19 deaths in Istanbul [2]. The report explicitly declared that all COVID-19 cases were laboratory confirmed. In other words, COVID-19 cases with PCR-negative results were not included in mortality statistics. The WHO indicates that mortality owing to COVID-19 is defined as a death resulting from a clinically compatible illness in a probable or confirmed COVID-19 case [6]. COVID-19 should be recorded on all death certificates where the disease caused, assumed to have caused, or contributed to the fatality [6]. However, this is mostly not the case; if the decedent is PCR negative, COVID-19 does not appear on the death certificate [7]. In addition, because patients with comorbidities have an increased risk of mortality, there might be a tendency to notify the comorbidity as the cause of death, although the patient had died owing to COVID-19 [7].
The available severe acute respiratory syndrome coronavirus 2 PCR kits are of variable quality, sensitivity, and specificity. Obtaining specimens requires training and skill. There is no test that can detect the COVID-19 with 100% reliability [4]. A negative PCR test cannot eliminate the diagnosis of COVID-19, especially when typical clinical features were recorded. Therefore, the WHO has recommended the notification of PCR-negative probable cases [3]. Failing to comply with the guidelines of WHO might result in under-reporting of the COVID-19 morbidity and mortality. Moreover, the testing capacities of several countries were limited at the beginning of the pandemic. Contact tracing was not performed, and mild symptoms were easily mistaken for another infection. There were no standardized diagnostic strategies within countries. Differences in surveillance resulted in heterogeneous statistics [21]. The data on the sensitivity and specificity of the test applied in Turkey are not adequate. Therefore, it may be postulated that a reporting system based solely on PCR positivity will not be showing the real burden of the disease.
In many countries, excess mortality estimation has been used to calculate COVID-19 mortality burden [21]. Scientists urged policymakers to use weekly excess death statistics and compare them with the expected average deaths to understand the scale of the disease [7]. Excess mortality can indicate that some people have died from COVID-19 without being diagnosed, but it may also include people with unrelated health conditions who were afraid to visit the hospital during the pandemic and were not treated properly [8]. It may also reflect the deaths owing to other unrecognized events.
The European monitoring of excess mortality for public health action (EuroMOMO) network studied the all-cause mortality for 24 European countries in March-April 2020. Of all the excess mortality, 91% was attributable to the deaths of persons aged >65 years, where no excess deaths were found in children aged <14 years. Between the 1st and 18th week, the excess mortality was 185,287 (21). The EuroMOMO recommends the use of excess mortality analysis as a simple national mortality-monitoring system. These mortality data were very useful in assessing the impact and planning public health strategies.
The excess mortality found between March 10 and May 18, 2020, in Istanbul was 4,084, whereas the officially reported COVID-19 mortality, which included 3 more weeks, was 2,771 deaths. This means that there were at least 1,373 unexplained deaths between the 11th and 20th week of 2020 compared with those of the previous year. Excess mortality calculation does not reveal the cause of the deaths but gives a clue about a fatal incidence occurring at the given time. Elimination of other possible life-threatening conditions may give an idea about the real cause. The increased number of deaths during the peak of the pandemic may not be completely explained by the under-reporting of COVID-19 cases. However, excess mortality returning to normal death patterns in tandem with the decreased number of reported COVID-19 cases may indicate COVID-19 mortality.
To understand the impact of the pandemic, we need to further document excess mortality by sex and age groups [7]. We also need to explore the data at the regional and sub-regional levels because local factors might be important determinants of the pandemic. Comparing regional data can also provide a clue in understanding the impact of non-pharmaceutical interventions, which could prepare us for the upcoming waves [5, 7, 11]. Therefore, we suggest the implementation of a national system for monitoring excess mortality to evaluate the burden of the pandemic and its impact on the most affected subgroups. Such a monitoring system would be valuable and practical to assess the objective toll of all future disasters and not only the pandemic.
Excess mortality analysis may be a useful tool in estimating the impact of a disease with an unpredictable outcome. When working through different diagnostic methods and reporting systems, the only common denominator remains to be mortality statistics. Excess mortality in many countries during March-June 2020 clearly shows the need for better compliance with the WHO guidelines for coding and reporting COVID-19.
MAIN POINTS.
Excess mortality analysis is a useful tool in evaluating the burden of coronavirus disease 2019 (COVID-19) pandemic.
Excess mortality owing to COVID-19 in Istanbul could be higher than the official figures reported by the health authorities.
There is a need to implement a national system for monitoring excess mortality to evaluate the burden of the pandemic and its impact on the most affected subgroups.
Footnotes
Ethics Committee Approval: This study was approved by Ethics Committee of Koç University (Approval No: 2020.276.IRB1.099).
Peer-review: Externally peer-reviewed.
Author Contributions: Supervision – H.B., E.D.; Design – B.M., S.K., P.A., E.D.; Resources – E.D., H.B.; Materials – B.M., S.K., P.A.; Data Collection and/or Processing – B.M., F.Ç.U.K., O.İ.; Analysis and/or Interpretation – S.K., P.A., E.D.; Literature Search – P.A., F.Ç.U.K., O.İ.; Writing Manuscript – B.M., P.A., E.D.; Critical Review – S.K., F.Ç.U.K., O.İ., H.B.
Conflict of Interest: The authors have no conflict of interest to declare.
Financial Disclosure: The authors declared that this study has received no financial support.
REFERENCES
- 1.World Health Organization. Novel Coronavirus (2019-nCoV) : situation report, 167. World Health Organization; 2020. [Accessed 6th of July, 2020]. Available at: https://www.who.int/docs/default-source/coronaviruse/situation-reports/20200705-covid-19-sitrep-167.pdf?sfvrsn=17e7e3df_4. [Google Scholar]
- 2.Sağlık Bakanlığı COVID-19 Yeni Coronavirüs Hastalığı. Available at: https://covid19bilgi.saglik.gov.tr/tr/
- 3.World Health Organization. Global surveillance for COVID-19 caused by human infection with COVID-19 virus: Interim guidance 20 March 2020. 2020. Available at: https://apps.who.int/iris/bitstream/handle/10665/331506/WHO-2019-nCoV-SurveillanceGuidance-2020.6-eng.pdf?sequence=1&isAllowed=y.
- 4.Tahamtan A, Ardebili A. Real-time RT-PCR in COVID-19 detection: issues affecting the results. Expert Rev Mol Diagn. 2020;20:453–4. doi: 10.1080/14737159.2020.1757437. [DOI] [PMC free article] [PubMed] [Google Scholar]
- 5.Weinberger DM, Cohen T, Crawford FW, et al. Estimating the early death toll of COVID-19 in the United States. bioRxiv. 2020 doi: 10.1101/2020.04.15.20066431. 2020.04.15.20066431. [DOI] [Google Scholar]
- 6.World Health Organization. International Guidelines for Certification and Classification (Coding) Of Covid-19 As Cause Of Death. Based on ICD International Statistical Classification of Diseases. 2020. Available at: https://www.who.int/classifications/icd/Guidelines_Cause_of_Death_COVID-19.pdf?ua=1.
- 7.Leon DA, Shkolnikov VM, Smeeth L, Magnus P, Pechholdova M, Jarvis CI. COVID-19: a need for real-time monitoring of weekly excess deaths. Lancet. 2020;395:e81. doi: 10.1016/S0140-6736(20)30933-8. [DOI] [PMC free article] [PubMed] [Google Scholar]
- 8.Vandoros S. Excess mortality during the Covid-19 pandemic: Early evidence from England and Wales. Soc Sci Med. 2020;258:113101. doi: 10.1016/j.socscimed.2020.113101. [DOI] [PMC free article] [PubMed] [Google Scholar]
- 9.Magnani C, Azzolina D, Gallo E, Ferrante D, Gregori D. How large was the mortality increase directly and indirectly caused by the COVID-19 epidemic? An analysis on all-causes mortality data in Italy. Int J Environ Res Public Health. 2020;17:3452. doi: 10.3390/ijerph17103452. [DOI] [PMC free article] [PubMed] [Google Scholar]
- 10.Nogueira PJ, Nobre MA, Nicola PJ, Furtado C, Vaz Carneiro A. Excess mortality estimation during the COVID-19 pandemic: preliminary data from Portugal. Acta Med Port. 2020;33:376–83. doi: 10.20344/amp.13928. [DOI] [PubMed] [Google Scholar]
- 11.Gibertoni D, Adja KYC, Golinelli D, et al. Patterns of COVID-19 related excess mortality in the municipalities of northern Italy during the first wave of the pandemic. Health Place. 2021;67:102508. doi: 10.1101/2020.05.11.20097964. [DOI] [PMC free article] [PubMed] [Google Scholar]
- 12.Rivera R, Rosenbaum JE, Quispe W. Excess mortality in the united states during the first three months of the COVID-19 pandemic. Epidemiol Infect. 2020;148:e264. doi: 10.1101/2020.05.04.20090324. 2020. [DOI] [PMC free article] [PubMed] [Google Scholar]
- 13.New York City Department of Health and Mental Hygiene (DOHMH) COVID-19 Response Team. Preliminary Estimate of Excess Mortality During the COVID-19 Outbreak - New York City, March 11–May 2, 2020. MMWR Morb Mortal Wkly Rep. 2020;69:603–5. doi: 10.15585/mmwr.mm6919e5. [DOI] [PubMed] [Google Scholar]
- 14.What do official COVID19 death statistics tell us? 2020. Available at: https://www.onuraltindag.info/pt-tr/posts/excess_mortality_eng/
- 15.The Economist. Tracking Covid-19 excess deaths across countries. Available at: https://www.economist.com/graphic-detail/2020/07/15/tracking-covid-19-excess-deaths-across-countries.
- 16.Magnani C, Azzolina D, Gallo E, Ferrante D, Gregori D. How large was the mortality increase directly and indirectly caused by the COVID-19 epidemic? An analysis on all-causes mortality data in Italy. Int J Environ Res Public Health. 2020;17:3452. doi: 10.3390/ijerph17103452. [DOI] [PMC free article] [PubMed] [Google Scholar]
- 17.Sinnathamby MA, Whitaker H, Coughlan L, Bernal JL, Ramsay M, Andrews N. All-cause excess mortality observed by age group and regions in the first wave of the COVID-19 pandemic in England. Euro Surveill. 2020;25:2001239. doi: 10.2807/1560-7917.ES.2020.25.28.2001239. [DOI] [PMC free article] [PubMed] [Google Scholar]
- 18.Republic of Turkey Ministry of Health. COVID-19 Weekly Situation Report, 29/06/2020 - 05/07/2020, Turkey. 2020. Available at: https://dosyamerkez.saglik.gov.tr/Eklenti/37862,covid-19-weekly-situation-report-29062020---05072020pdf.pdf?0&_tag1=8C3F5C6E9B0E4630704978AA6BB8151EEE4AFC99.
- 19.İstanbul Büyükşehir Belediyesi Vefat Bilgisi Sorgulama Sistemi. Available at: https://www.turkiye.gov.tr/istanbul-buyuksehir-belediyesi-vefat-sorgulama.
- 20.Joinpoint Regression Program, Version 4801 - April 2020; Statistical Methodology and Applications Branch, Surveillance Research Program, National Cancer Institute.
- 21.Vestergaard LS, Nielsen J, Richter L, et al. Excess all-cause mortality during the COVID-19 pandemic in Europe - preliminary pooled estimates from the EuroMOMO network, March to April 2020. Euro Surveill. 2020;25:2001214. doi: 10.2807/1560-7917.ES.2020.25.26.2001214. [DOI] [PMC free article] [PubMed] [Google Scholar]