

Summary
Reverse genetics approaches have revolutionized plant biology and agriculture. Phenomics has the prospect of bridging plant phenotypes with genes, including transgenes, to transform agricultural fields. Genetically encoded fluorescent proteins (FPs) have revolutionized plant biology paradigms in gene expression, protein trafficking and plant physiology. While the first instance of plant canopy imaging of green fluorescent protein (GFP) was performed over 25 years ago, modern phenomics has largely ignored fluorescence as a transgene expression device despite the burgeoning FP colour palette available to plant biologists. Here, we show a new platform for stand‐off imaging of plant canopies expressing a wide variety of FP genes. The platform—the fluorescence‐inducing laser projector (FILP)—uses an ultra‐low‐noise camera to image a scene illuminated by compact diode lasers of various colours, coupled with emission filters to resolve individual FPs, to phenotype transgenic plants expressing FP genes. Each of the 20 FPs screened in plants were imaged at >3 m using FILP in a laboratory‐based laser range. We also show that pairs of co‐expressed fluorescence proteins can be imaged in canopies. The FILP system enabled a rapid synthetic promoter screen: starting from 2000 synthetic promoters transfected into protoplasts to FILP‐imaged agroinfiltrated Nicotiana benthamiana plants in a matter of weeks, which was useful to characterize a water stress‐inducible synthetic promoter. FILP canopy imaging was also accomplished for stably transformed GFP potato and in a split‐GFP assay, which illustrates the flexibility of the instrument for analysing fluorescence signals in plant canopies.
Keywords: remote sensing, plant phenomics, fluorescence imaging, synthetic biology, synthetic promoters, abiotic stress, water stress, salt stress, fluorescent proteins
Introduction
Phenomics seeks to tightly connect genotype to phenotype across various environmental conditions (Araus et al., 2018; Houle et al., 2010), which would enable translation of laboratory‐based research to agricultural production and sustainability (Tardieu et al., 2017). The various scales of phenotyping currently cover ranges from sub‐micron/microscopic to satellite‐based imaging of >2000 km, with tremendous disconnect between these scales. We posit that the ‘sweet spot’ to connect genes to phenotypes as well as genomes to phenomes—for both reductionistic‐mechanistic levels and ecological levels—lies at the scope of the plant canopy (metres); currently, there is a technological void at this range. At the microscopic level where most basic research takes place, studies assess cellular‐to‐subcellular activities using state‐of‐the‐art microscopes and molecular probes, for which innovations are numerous (Ckurshumova et al., 2011; Mylle et al., 2013).
At the whole plant‐to‐field level of assessment, there is tremendous potential for detecting environmental stresses on crops. The chief problem with ‘small‐scale’ laboratory studies is that they are confined to tightly controlled artificial conditions. Field experiments and radiometric models of vegetation remote sensing, enabling phenome‐to‐genome associations, have several key problems: (1) ‘real‐life’ systems generate data that is extremely noisy due to optical artefacts (incomplete illumination, subpixel mixing, bidirectional effects, etc.); and (2) in complex environments connecting robustly measured phenomes to genes and genomes is tenuous (Araus et al., 2018; Houle et al., 2010; Mulla, 2013).
In plant biology and agriculture, the most useful optical signals would be those that are unambiguous and occupy distinct spectral wavelengths from endogenous plant molecules. Leaf‐produced compounds such as alkaloids, terpenoids and chlorophyll produce sizable spectral ‘noise’ in plants in the form of autofluorescence (Talamond et al., 2015). In addition to avoiding spectral noise, heterologous signals should be directly tied to traits and genes. Indeed, a collection of these ‘ideal’ spectral signatures could be stacked for multispectral signalling to expand the diversity of applications. FPs fit these criteria and can be universally imaged in plant organs. Certainly, canopy‐level FP imaging is facile for UV‐excitable FPs such as (near) wild‐type GFP (Harper et al., 1999) and recently characterized GFP variants, such as those expressed in ornamental plants (Chin et al., 2018). UV‐excitable GFP can be easily imaged at the sub‐metre level, for example seedlings and small canopies, because emission filters are not required and GFP fluorescence may be seen in the dark (Stewart, 2006). Previously, researchers have developed an inexpensive imaging system using blue LED arrays to excite GFP engineered into Arabidopsis (Baker et al., 2012), in which dichroic filter cubes were coupled with an inexpensive camera, which could image cm‐scale seedling ‘canopies.’ At the other end of the cost spectrum, a portable laser‐induced fluorescence imaging (LIFI) system containing a tripled Nd:YAG laser (355 nm) has been used to excite UV‐excitable GFP in plants at a stand‐off (3 m), but this instrument was very expensive (Stewart et al., 2005). In order to move to higher efficiency light sources and multiple wavelengths, non‐imaging techniques were explored to frequency modulate 405 nm laser diodes and a fluorescence spectrometer was used to detect signals at distances greater than 2 km in field experiments (DiBenedetto et al., 2012; Trainham et al., 2015). All current remote FP‐imaging systems lack flexibility with regard to imaging a variety of FPs and cannot simultaneously image multiple FPs in multiple plants at the canopy level. Here, we show the performance of a relatively inexpensive custom device (<$50 000 USD), FILP, that images plant canopies expressing various FPs at >3 m in a laboratory setting in both constitutive and induced modalities. In addition, we show how FILP enables advanced plant biotechnology and synthetic biology by imaging fluorescence signatures in plant canopies that are the product of an abiotic stress‐induced synthetic promoter driving GFP.
Results
Fluorescence‐inducing laser projector (FILP) imaging of plant canopies
The flexibility of FILP lies in the ability to select diode lasers for FP excitation and custom filters for filtering emission. In the initial build, violet (400 nm), blue (465 nm) and green lasers (524 nm) were installed in the system. These excitation wavelengths were chosen because they can excite virtually any FP variant in the current colour palette (Figure 1). The diode laser beam was homogenized to produce an illumination pattern that was highly uniform (flat and smooth), which maximized spatial resolution across the area of illumination, which was approximately 400 cm2. Emission filters, housed in an automated filter wheel, were specifically chosen to prevent crosstalk between multiple FPs. The final major component of the system was a laboratory‐grade digital camera that enabled the capture of high‐resolution whole plant images. As designed, the system allows modular substitution of both diode lasers and emission filters to customize imaging of fluorescent signatures in plants, which can be accomplished at the end‐user level. The goal of our study was to conduct near‐simultaneous imaging of multiple, spectrally distinct FPs at the whole canopy level in plants as a new modality of plant phenomics, and to then apply FILP imaging to enable synthetic biology.
Figure 1.
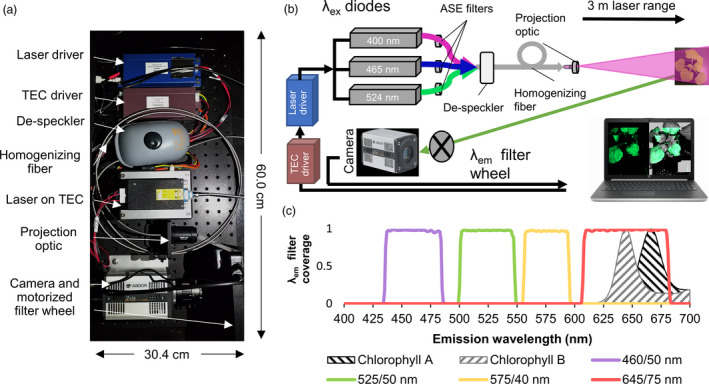
Fluoresence‐inducing laser projector (FILP) components. (a) Photograph of FILP system breadboard. (b) Schematic illustrating the setup of components. Abbreviations: Thermo‐electric cooler (TEC); amplified spontaneous emission (ASE) (c) Combined line and area plot. Line plots show the wavelengths covered by the 460/50 nm, 525/50 nm, 575/40 nm and 645/75 nm notch filters, in which the first numeral is the centre point and the second numeral is the breadth of the notch filter. The line plot also includes area plots which indicate the autofluorescence emission by chlorophylls A (excitation 614 nm) and B (excitation 435 nm) in diethyl ether.
To determine the flexibility of the FILP system, 20 FPs were characterized in agroinfiltrated Nicotiana benthamiana. The inherent excitation peaks for each FP variant ranged from UV (395 nm) to orange (578 nm) with emission peaks from blue (454 nm) to red (611 nm) (Table 1). The FPs also had a wide range of extinction coefficients, quantum yields and oligomerization states to allow for a plethora of multispectral imaging schemes in plants (Table 1). Each of these FP genes was placed under the control of a constitutive doubled 35S promoter in a common vector (Curtis and Grossniklaus, 2003) and expressed in N. benthamiana using either whole plant or whole leaf vacuum agroinfiltration. Given the range of FP characteristics, many of which were suboptimal for the initial laser diodes and emission filters chosen for FILP, we were surprised that all FPs could be imaged in the plant canopies (Figure 2). Owing to these suboptimal excitation and emission matches (FPs vs. FILP), in some cases, coupled with differences in relative brightness of FPs, there was a fourfold difference between power requirements for imaging among FPs in plants and the respective imaging channels (Table S1). Fluorescence imaging was complemented by on‐the‐plant fluorescence spectroscopy measurements that modelled the three laser excitation frequencies (Table S1). The heatmap from fluorescence spectroscopy data as well as signal‐to‐noise ratios of each FP emission peak, relative to a buffer infiltrated control excited at the same wavelength, was congruent with imaging results (Table S1). Therefore, we conclude FILP imaging is an apt indicator of FP expression in transgenic plants.
Table 1.
Fluorescent proteins engineered into and imaged in plants using the FILP laser range
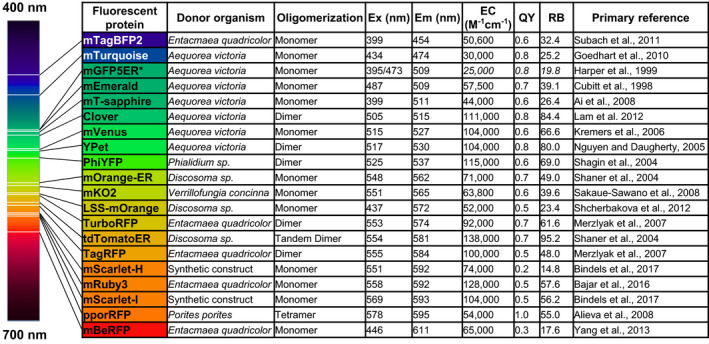
Figure 2.
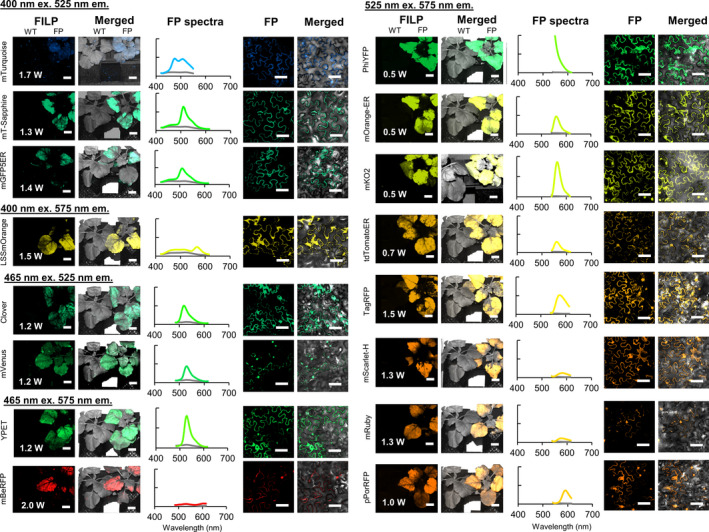
Images of plants expressing a wide variety of fluorescent protein genes taken using the FILP instrument at a 3 m stand‐off. Fluorescence spectroscopy measurements and confocal micrographs included for comparisons. Exposure times used in FILP‐based imaging are found in Table S1. Y‐axis for all plots is scaled to 5 × 10⁵ CPS except for PhiYFP, which is scaled to 1.0 × 10⁶ CPS. Scale bars for FILP images represent 2.5 cm at a detection distance of 3 m while scale bars for confocal images represent 50 μm
Excitation λ (Ex), emission λ (Em); extinction coefficient (EC); quantum yield (QY); relative brightness (RB). * indicates that the EC, QY and RB data were taken from avGFP, the wild‐type GFP.
Multiplexed fluorescence imaging in plant canopies
Of the 20 FPs initially screened in plants, four of these were selected as top performers with regard to stacking and/or imaging together in single plants or plant canopies: mTagBFP2, mEmerald, TurboRFP and mScarlet‐I (Figure 3). The ‘top FP’ emissions were in four distinct colour bands and were consistently brighter than others in those colour bands. Compared with other colour band emissions, blue light‐emitting FP candidates were few. When designing FILP components, we purposefully matched the laser and emission filter to the optimal blue fluorescence protein spectra of mTagBFP2 (Figure 1 and Table 1). Nonetheless, both mTagBFP2 and mTurquoise could be imaged in plants using the same laser/filter combination (Figure 2 and Figure 3). Other potential top‐performing FPs included both yPet and PhiYFP (Figure 2), which would be very good choices for single FP reporters, but their emission spectra overlapped with both green and orange emitters in the 525/50 nm and 575/40 nm emission filters, which prohibited their use for simultaneous co‐expression with other FPs. Top FPs were also selected based on their emission peaks which were aptly spaced across the visible spectrum to facilitate robust combinatorial detection pairs. mTagBFP2 or mEmerald paired with TurboRFP or mScarlet‐I was easily differentiated by FILP (Figure 4). One potential concern in imaging multiplexed FPs in the same plant cells was Förster (or fluorescence) resonance energy transfer (FRET) (Gadella et al., 1999). FRET occurs when one FP emits at the same spectrum that excites a second FP, which could potentially make dual FP detection ambiguous and confounding within the same plant. Therefore, we tested for evidence of FRET prior to selection of the four colour band ‘winners’ by fluorescence spectroscopy. We observed no detectable second emission peak in the spectrophotometric measurements taken on any two co‐expressed FP combinations; that is, no FRET was observed in our agroinfiltrated samples (Figure 4). The initial FILP components were selected to allow for capture of optimal FP emission spectra. However, optimization of the laser light source has been facile to excite most the FPs tested using a small fraction of the total laser power available in the system. Selection of alternative emission filters may facilitate simultaneously observing more than two FPs in the same plant.
Figure 3.
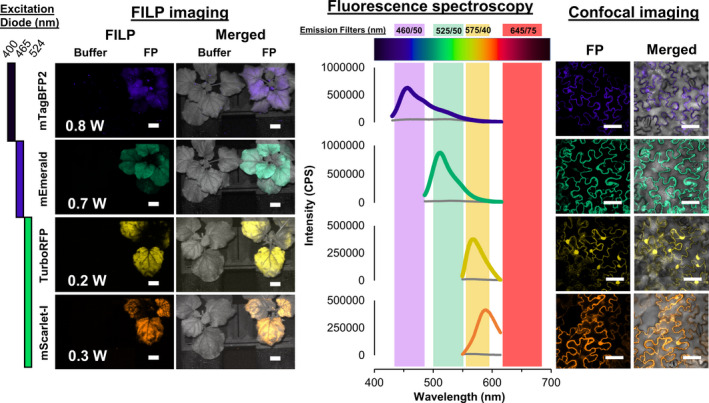
Top‐performing fluorescent proteins for stand‐off detection in plants by the FILP device. Bars along the left side of the figure indicate which laser was used for excitation of each fluorescent protein, whereas the emission filter corresponds to the emission peak taken from the fluorescence spectroscopy data. The laser power (W) used is displayed in the bottom left of the images of plants. Exposure time for FILP images was 150 ms. Scale bars for FILP images represent 2.5 cm at a detection distance of 3 m. Scale bars for confocal images represent 50 μm.
Figure 4.

FILP and fluorescence spectroscopy measurements of co‐expressed fluorescent protein genes in plants. (a) FILP images of four pairwise combinations of fluorescent proteins synthesized in plants. Bright‐field images for each of the combinations indicates the placement of the three plants with a circled number: (1) vacuum co‐infiltrated, (2) syringe‐infiltrated individual FPs and (3) buffer control. The buffer control is common among combinations. The FILP images were acquired sequentially at 150 ms exposures. (b) Line plots correspond to fluorescence emission measurements taken on agroinfiltrated whole plants for dual fluorescent proteins. Black lines designate the buffer control plant reading for the 1st FP and the buffer for the 2nd FP is in grey. Scale bars for FILP images represent 2.5 cm at a detection distance of 3 m.
Given the high irradiance potential of lasers, it is reasonable to question whether prolonged exposure to any of the lasers might potentially injure plants. Upon exposing transgenic plants to the highest available laser power at each wavelength for up to 60 min, no apparent leaf damage was observed, nor were off‐type phenotypes seen after long‐term laser exposure (Figure S1).
Imaging stable transgenic GFP potato plants
To demonstrate the potential for FILP usage as a phenomics tool in the high‐throughput selection of stable transgenic plants, a 2 × 35S::mEmerald GFP construct was engineered into the potato (Solanum tuberosum cv. ‘Desiree’) nuclear genome. Among 14 transgenic events, FILP imaging of young potato plants indicated that Events 1, 2, and 3 were most highly fluorescent; on that basis, we inferred these were the highest GFP expressers (Figure 5). Conversely, Events 9 and 12 appeared similar to WT plants with regard to GFP fluorescence (Figure 5). These observations correspond with qRT‐PCR‐transcript abundance for each event. Thus, we conclude that FILP imaging is useful as a screening tool for both agroinfiltrated plants as well as stable transgenic plants to gauge the relative level of gene expression between events, using an FP gene as a marker.
Figure 5.

Comparison between FILP images of stably‐transformed potato plants expressing an mEmerald GFP gene and the relative GFP transcription of each independent transgenic line. (a) The line numbers correspond to the 14 independent lines expressing GFP. A non‐transgenic potato (WT) was included. (b) FILP images of transgenic potato plants synthesizing various levels of GFP. (c) Bright‐field and (d) merged images are shown. The FILP images were acquired using the 465 nm ex. 525/50 em. at 0.70 W with 150 ms exposure. Scale bars represent 1 cm for all images. (e) Relative qRT‐PCR transcription levels of GFP compared with those of the L8 reference gene (y‐axis: 2ΔCT) among transgenic potato lines (x‐axis: transgenic lines 1‐14 and wild‐type controls) are shown. (f) Relative expression of the endogenous gene ef1 comparing to the same L8 reference gene. Data are expressed as means ± standard deviations of 3 biological replicates and 3 technical replicates per biological replicate. Data were analysed using ANOVA and Tukey HSD mean separations (P < 0.05). Statistical significance among lines is indicated by letters (a‐f). High mEmerald‐expressing lines (line 1‐3) are indicated with asterisk (*).
Synthetic biology enablements: synthetic promoter screen‐to‐fluorescent plants, and protein–protein interactions via BiFC observed in plant canopies
In this study, a 2000‐member synthetic promoter library was screened in protoplasts under osmotic stress. Among six putative hits from the protoplast screen of the synthetic promoter library, one candidate synthetic promoter (referred to here as JL1; Figures S4 and S5) was selected from protoplast transfection experiments and further characterized in agroinfiltrated N. benthamiana canopies (Figure 6a and b). Using FILP, within three‐to‐five days post‐osmotic stress treatment, strong inducible GFP expression could be detected in N. benthamiana leaves relative to control treatments. The FILP‐imaged green fluorescence corresponded with the fluorescent spectroscopy data that was taken from the time‐course post‐osmotic stress treatment. (Figure 6a and 6b).
Figure 6.

Synthetic inducible promoter and BiFC intensity data. (a) The ‘JL1’ synthetic promoter’ was induced by osmotica in a high‐throughput screen, which was indicated by GFP production in transfected potato protoplasts (b) Time‐course of fluorescence measurements of N. benthamiana leaves synthesizing mEmerald GFP (509 nm em.) over 5 days following an osmotic stress treatment. FILP images of the plants on day 5 after treatment. In the bright‐field images, the identification of leaf numbers are indicated by representative numerals of different colours for treatments: buffer (black), mock (green) and salt (red), 1Leaf 1, 2Leaf 2 and 3Leaf 3. FILP images for the inducible promoter construct ‘JL1’ were obtained using 400 nm ex., and 525/50 nm em. with a 150 ms exposure time. c) Fluorescence intensity readings for BiFC constructs at the mVenus peak emission (527 nm em.) with and without the helper P19. (d) FILP images of all AtRAD51 BiFC constructs. RR, AtRAD51/AtRAD51, or, AtODB1/AtRAD51. FILP images for BiFC constructs were obtained 525 nm ex., and 575/40 nm em. using 150 ms exposure time. The scale bars for all FILP images represent 2.5 cm at a detection distance of 3 m.
In addition to imaging single and dual FPs in plants, FILP was useful for canopy‐level fluorescence phenotyping for other FP assays that have typically been restricted to cell‐based characterization. One such application was bimolecular fluorescence complementation (BiFC), which is based on a split‐GFP system which allows in vivo analysis of protein–protein interactions. To test for specific protein–protein interactions, we used AtRAD51, which self‐dimerizes in Y2H experiments (Figure S2). AtODB1 was also cloned to test whether it participates in a protein interaction with AtRAD51 to mediate functions related to DNA damage repair, as has been demonstrated for homologs in humans (Shen et al., 1996). However, in Y2H mating experiments this interaction does not appear to be conserved (Figure S2a). For this reason, the combination was included in future BiFC experiments to serve as a negative control.
Gookin and Assmann (2014) designed a split‐GFP system based on the mVenus FP variant, which was characterized in plant canopies in the present study (Figure 2). This mVenus design displays reduced background compared with other split‐GFP systems by using an optimized split at amino acid 210 as well as including the P19 silencing suppressor (Gookin and Assmann, 2014). Both combinations, AtRAD51:NVen210/AtRAD51:CVen210 and AtODB1:NVen210/AtRAD51:CVen210 were constitutively expressed in N. benthamiana agroinfiltration assays, with and without co‐expression of P19 (Figure 6c and d). Fluorescence spectroscopy measurements shown in Figure 6c indicate that leaves expressing the AtRAD51 BiFC pair, without the help of the P19 silencing suppressor, were significantly brighter than leaves that were only infiltrated with buffer, but not different than the negative control (AtRAD51/AtODB1). By including the P19 silencing suppressor, the AtRAD51/AtRAD51 BiFC pair was approximately threefold brighter than the negative control that was also expressed with P19 (Figure 6c). These results were easily visible in FILP images of the infiltrated plant canopies (Figure 6d) and demonstrated how FILP can expand to any fluorescent protein derived technology.
Discussion
Advanced plant canopy fluorescence phenotyping
FILP is a relatively compact and inexpensive device that is versatile to image plant canopies for fluorescence signatures. Its interchangeable lasers and emission filters allows for unprecedented flexibility for fluorescence‐based phenotyping in plants. As demonstrated, using 400 nm, 465 nm and 525 nm diode lasers as well as bandpass emission filters at 460/50 nm, 525/50 nm and 575/40 nm, it can successfully detect 20 unique fluorescent proteins across a wide range of excitation and emission wavelengths, oligomerization states and spectral properties (Table 1, Figure 2 and 3). Among these fluorescent proteins, we demonstrated that four very bright FPs could be co‐imaged in pairs in canopies at >3 m (Figure 4). All FPs were visible in whole leaves using far less laser power than the maximum (Table S1). It is conceivable that more than 2 FPs in plants could be observed simultaneously after optimal bandpass filters are installed. Compared with the commercially available FluorCam FC 800 (Photon Systems Instruments, Brno, Czech Republic) and the IVIS Lumina S5 imaging platforms (Perkin Elmer), FILP also allows for larger plant canopies, for example 10‐fold greater area, to be assayed in one view. Ideally, a FILP system could be employed as a fluorescence imaging station in an automated greenhouse setting. In such a system, potted plants or mesocosms could be grown in the greenhouse and assayed at a FILP station configured for brief (millisecond‐level) excitation. Dynamic temporal and spatial FP‐tagged gene expression studies could be performed to connect both physiology and morphology with plant performance.
Of concern is the consequence of repeated‐ or long‐term exposure of plants to relatively high‐intensity light supplied by class 4 diode lasers. Especially of interest is exposure to the 400 nm laser, which is at the border of UV‐A (320–400 nm). Since DNA does not absorb UV‐A—unlike UV‐B or UV‐C—the laser’s mutagenic effects are negligible. Experimentally, 10 J/cm2 doses of UV‐A have 300‐fold less mutagenicity than UV‐B on neonatal human fibroblasts. Doses of 5‐to‐10 J/cm2 UV‐A do not decrease yeast survival (Kappes et al., 2006; Kozmin et al., 2016). In plants, low dose UV‐A exposure may be beneficial with regard to growth, and photosynthesis, depending on species and/or varieties (Chen et al., 2019; Verdaguer et al., 2017). Anecdotally, after performing thousands of separate FILP measurements on hundreds of plants, no off‐target effects have been observed; nor has photobleaching been noted. Nonetheless, to provide a worst‐case scenario, we exposed various FP‐N. benthamiana combinations to continuous full power from each of the lasers. Calculation of the radiation from an hour of continuous exposure shows that 15.7 J/cm2 is the total dosage (Figure S1a). Without beam expansion, the exposure from the laser would be considerably higher; however, by expanding the beam to 400 cm2 for imaging, there are no adverse effects on the plants. We observed no morphological damage and no photobleaching of mTagBFP2, mEmerald, TurboRFP and mScarlet‐I produced in plants (Figure S1b and c). It is also important to note that typical exposure times for FILP were <500 ms, resulting in a maximum dose of 0.002 J/cm2. Thus, we conclude that the FILP system does not damage plants during normal or exaggerated use.
Synthetic biology synergies for phytosensing applications
As a phenomics tool, FILP would provide unparalleled assessment of gene expression in transgenic plants, as shown by imaging a range of GFP in stably transformed potato (Figure 5). This capability predicates the enablement of detection of inducible gene expression in intact plants. Indeed, the authors produced the FILP system as a means to assess the efficacy of environmental phytosensors, which are plants engineered to detect and report environmental stimuli (Stewart, 2005). Phytosensors have been developed to monitor plant pathogenic bacteria in the field (Fethe et al., 2014), but the production of clear and useful photonic signals remains challenging. In combination with advanced synthetic biology in plants (Wurtzel et al., 2019), especially in the area of synthetic promoters (Liu and Stewart, 2016) and circuits (de Lange et al., 2018), we are poised to enter the ‘golden era’ of gene‐targeted phenomics. Arguably, abiotic stress detection, for example osmotic stress, at an early onset stage, has the potential to revolutionize agricultural productivity and sustainability (Zhu, 2016).
Phytosensor design is being greatly improved by using stimulus‐specific synthetic promoters to drive fluorescent proteins (Liu et al., 2013). Nonetheless, one vexing problem is performing high‐throughput biology in plants. Herein, combining a high‐throughput synthetic promoter screen with FILP phenotyping provided a rapid‐genetics discovery platform in plants. In the example shown above, one postdoctoral scientist was able to screen up to 2000 synthetic promoters in protoplasts under an osmotic treatment and image the top candidate stress‐inducible synthetic promoter in agroinfiltrated plant canopies in less than two months. The experiments were replicated in both space and time (Figure 6).
Beyond inducible promoter assays, FILP has also shown the ability to capture protein–protein interactions in vivo (Figure 6). Like the induction of the synthetic JL1 promoter in response to osmotic stress, such in planta detection of protein–protein interactions could lead to novel characterization of the timely association of protein complexes in the context of diverse activating stimuli within agricultural settings and beyond.
The utilization of FILP as a detection and phenomics tool is only limited by the feasible employment of fluorescent protein‐based designs. Fortunately, fluorescent proteins have proven time and again as valuable characterization tools and have received much attention since the discovery of Aequorea GFP in 1962 (Shimomura et al., 1962). For years, thought leaders in the burgeoning field of plant phenomics have identified bottlenecks for effective gene‐to‐phenotype identification in various modes of operation. Dhondt et al. (2013) noted that organ‐level detection, increased dimensionality and sensor technologies are in need of a step change with regard to precision, as well as the need of direct links to plant physiology. FILP directly addresses all of these needs through fluorescence imaging at the canopy level through expression of fluorescent protein genes.
Conclusions
Our study represents the first demonstration of a ‘turn‐key’ system of an osmotic stress phytosensor that can be detected optically at a stand‐off. Moreover, the versatility of stand‐off detection using the suite of the FP colour palette and the FILP diode laser‐based phenotyping system represents an unprecedented application that clearly demonstrates the potential of FP‐based phenomics in agriculture.
Methods
Plant expression vectors for constitutive expression of fluorescent protein genes
The DNA coding sequences for the 20 fluorescent protein (FP) genes listed in Table 1 were mobilized into Invitrogen pENTR/D‐TOPO cloning vectors (Invitrogen, Carlsbad, CA). Following colony PCR and validation by sequencing, the FP coding sequences were each recombined into the pMDC32‐doubled 35S expression vector (Curtis and Grossniklaus, 2003) via the LR Clonase reaction (Invitrogen, Carlsbad, CA). FPs were subsequently sequence‐verified prior to transformation into Agrobacterium tumefaciens strain LBA4404.
Modular cloning was used for construction of the plant binary vector for mEmerald overexpression in potato. An expression cassette containing the double CaMV 35S, the full‐length mEmerald CDS, along with the 35S terminator was assembled by modular cloning and integrated into the pAGM4723 destination vector containing an hygromycin cassette for selection (Engler et al., 2014; Occhialini et al., 2019; Weber et al., 2011).
Generation of transgenic lines
Stably transformed potato (Solanum tuberosum) lines that overexpressed an mEmerald GFP gene under the control of the double CaMV 35S promoter were generated by Agrobacterium‐mediated transformation and regenerated in selective media as previously described (Chronis et al., 2014; Weigel and Glazebrook, 2006). Internode explants (~1 cm‐length) were taken from one‐month‐old in vitro‐grown potato plants; these were the target of transformation. Putative lines were assessed for transgene presence and expression by real‐time PCR and fluorography. Transgenic lines were grown in vitro in Magenta GA7 boxes containing selective propagation media (4.33 g/L Murashige and Skoog salt mixture; 170 mg/L sodium phosphate monobasic monohydrate; 100 mg/L inositol; 400 µg/L thiamine HCl; 30 g/L sucrose; 100 mg/L timentin; 20 mg/L hygromycin and 3 g/L phytagel; pH 5.6) as previously described (Chronis et al., 2014; Jung et al., 2005). Plants were acclimated and then transferred to pots. Transgenic and non‐transgenic potato was grown in a controlled environment at a temperature of 22‐24°C and a cycle light/dark of 16 and 8 hours, respectively.
Total RNA extraction, cDNA synthesis and real‐time PCR
For each plant, ~50 mg healthy leaf tissue was used for total RNA extraction using the Tri‐Reagent method (Molecular Research Center, Inc, Cincinnati, OH) according to manufacturer’s protocol. RNA preparations were then subjected to DNase treatment and a step of cleaning using the RNA Clean & Concentrator Kit (Zymogen, Irvine, CA). For each sample, 1 µg of clean total RNA was used for cDNA synthesis using the Super Script III Reverse Transcriptase (Thermo Fisher Scientific, Waltham, MA) following the manufacturer’s instruction. A NanoDrop spectrophotometer (Thermo Fisher Scientific, Waltham, MA) was then used to measure cDNA concentration.
cDNA dilutions (1:3 v/v in nuclease‐free H2O) were used in real‐time PCRs. The reaction was assembled in a total volume of 15 µL in 1X PowerUp™ SYBR™ Green Master Mix (Thermo Fisher Scientific, Waltham, MA), using 1 µL of diluted cDNA and 0.5 µm of each primer. The software Primer3 input v. 0.4.0 (Howard Hughes Medical Institute and by the National Institutes of Health; Untergasser et al., 2012) was used to design compatible pairs of primers with an annealing temperature of ~57°C and able to amplify a fragment of ~100 bp. The pairs of primers 1Fw/1Rv were used to amplify mEmerald, whereas the pair of primers 2Fw/2Rv and 3Fw/3Rv were used to amplify the two internal control ef1 (Solanum tuberosum elongation factor 1‐alpha; XM_006343390.2) and L8 (Solanum tuberosum 60S ribosomal protein L8: XM_006362853.2). In Table S2, the sequences of primers used for qRT‐PCR are shown.
The QuantStudio™ 6 Flex Real‐Time PCR System (Thermo Fisher Scientific, Waltham, MA) was used to perform real‐time PCRs using 96‐well plates (Thermo Fisher Scientific, Waltham, MA), whereas amplification data were acquired using the QuantStudio™ Real‐Time PCR Software v1.1 (Thermo Fisher Scientific, Waltham, MA). The 2ΔCT method was used to represent gene expression data in transgenic lines along with wild‐type controls. L8 was used as reference gene to determine the expression levels of both mEmerald and the internal control ef1 gene. Data are expressed as mean ± standard deviation (sd) of 3 biological replicates and 3 technical replicates per biological replicate per each transgenic line and wild‐type control. The ANOVA post hoc Tukey statistical analysis (P < 0.05) was performed using the IBM SPSS software to determine statistically significant difference among means.
Vacuum agroinfiltration of N. benthamiana
Agrobacterium was infiltrated according to Rigoulot et al. (2019) with modification. Agrobacterium tumefaciens strain LBA4404 was used for the infiltration of all fluorescent protein and BiFC constructs. Colony PCR was used to determine transformation of Agrobacterium. Agrobacterium was then grown from colonies overnight in 10 mL YEP media [10 g/L yeast extract, 10 g/L bacto peptone, 5 g/L NaCl, ph 7.0] with rifampicin (50 mg/L) and kanamycin (50 mg/L) selection at 28°C shaking (225 RPM). This culture was used as the seed culture for a 125 mL culture also grown overnight under the same conditions. Agrobacterium was resuspended in injection media (10 mm MES, 10 mm MgCl2 and 100 μm acetosyringone) to an OD600 value of 0.8, and this Agrobacterium solution was incubated for 3 hr at room temperature prior to infiltration. Four‐week‐old N. benthamiana plants grown under long day conditions at 23°C were used for infiltration experiments. Vacuum infiltration of N. benthamiana plants were performed using a modified Nalgene vacuum desiccator (Cole‐Parmer, Vernon Hills, IL). The sidearm on the base was blocked using the PTFE cap (provided with purchase) and secured in place with parafilm. The stopcock on the desiccator lid was removed and PVC tubing was retro‐fitted with a 1–5 mL pipette tip to connect the benchtop vacuum port with the vacuum desiccator. N. benthamiana plants were inverted and all aboveground tissues were submerged into a Magenta™ GA‐7 boxes (Fisher Scientific, Catalog No. 50‐255‐176) filled with the Agrobacterium suspension. The Magenta box was housed inside of a Styrofoam support ring that was cut to the size of a large glass container to prevent the movement of the vessel during application and release of the vacuum. With the modified pipette tip end of the hose securely inserted into the vacuum desiccator lid, the vacuum was applied in 1 min intervals. This was repeated 3 times to achieve thorough infiltration of leaf tissue indicated by visible saturation of the leaf with the Agrobacterium solution. The vacuum provided by the benchtop vacuum port was measured to be −84 kpa or −12 psi. After infiltration, the plants were rinsed in a beaker of deionized water and then allowed to dry at room temperature. The entire vacuum infiltration procedure is demonstrated in Movie S1. The plants were then returned to the growth room until fluorolog readings, FILP and confocal imaging were taken 72 hr post‐infiltration.
For co‐infiltrated plants, Agrobacterium solution was adjusted for both FP gene constructs to an OD600 of 1.6; then, FP constructs were mixed 1:1 and vacuum infiltration was conducted as previously described. Syringe infiltration of N. benthamiana leaves was conducted as described in Rigoulot et al. (2019) with Agrobacterium solution at an OD600 of 0.8.
Fluorescence spectroscopy of leaves
Prior to FILP measurements, the spectral characteristics of the youngest, fully expanded leaf of each plant was quantified using scanning fluorescence spectroscopy (Fluorolog®‐3, Jobin Yvon and Glen Spectra, Edison, NJ) using emission spectral acquisition by the FluorEssence Software (HORIBA Scientific, version 3.8.0.60). On‐the‐leaf fluorescence was measured using a fibre optic probe as described previously (Millwood et al., 2003). Excitation wavelengths matched Necsel laser diode wavelengths at 400 nm, 465 nm and 523 nm with a slit width of 5 nm. Emission wavelengths were scanned from 415–615 nm, 480–615 nm and 540–615 nm for the respective excitation wavelengths in increments of 1 nm. Leaves of the same developmental age were infiltrated with buffer as a negative control and measured for background fluorescence.
Fluorescence spectroscopy data were handled using custom software: the Fluorologger Shiny app, coded in R (Chang et al., 2019; R core Team, 2013). The graphic user interface allows for the visualization and normalization of fluorolog data, and the app is currently available on github at github.com/jaredbrabazon/Fluorologger. Output files from the Fluorolog (.dat format) were input into the application, and with user input, the data were normalized according to methods described in Millwood et al. (2003). A detailed user guide is available at the link provided.
The heatmap in Table S1 was created by recording the fold change difference between an individual fluorescent proteins peak emission as described on FPBase.org and the background emission at this same point taken by the Fluorolog instrument (signal to noise).
Confocal microscopy
The same leaf tissue analysed by fluorescence spectroscopy (Fluorolog) was imaged using an Olympus FV1200 confocal microscope (Olympus, Center Valley, PA). Diode lasers (405 nm, 440 nm, 473 nm, 559 nm and 635‐nm) along with conventional Argon and HeNe (R) lasers were used to image plant tissues synthesizing fluorescent proteins with the appropriate excitation and emission spectra (Table 1). The manufacturer’s Olympus FV10‐ASW Viewer software Ver.4.2a (Olympus, Center Valley, PA) and the ImageJ (Schneider et al., 2012) analysis software (version 1.41o) were used to acquire and process confocal images, respectively.
Fluorescence‐inducing laser projector phenotyping system
The fluorescence‐inducing laser projector (FILP) is a custom‐designed instrument primarily composed of components purchased from Necsel IP, Inc. (Milpitas, CA). The Necsel components include a custom NovaLum module with three independently modulating laser diodes that emit at 400.3 nm, 464.9 nm and 523.5 nm, a Thermal Platform Developer’s Kit, an intelligent controller kit and a homogenizing square core fibre (400 µm, 0.22 NA) used for flattening the Gaussian image produced by the lasers into a spatially uniform flat‐field, albeit with residual speckle from the laser coherence. This speckle was reduced by passing the fibre through a commercially available aquarium pump to vibrate the fibre faster than the camera’s exposure time, thereby smoothing and de‐speckling the resulting image. Individual amplified spontaneous emission (ASE) filters were hand cut and mounted onto each laser diode to limit the transmitted wavelength. As such, a 405 ± 20 nm filter (ZET405/20X, Chroma Technology Corp., Bellow Falls, VT) was mounted onto the 400 nm diode, a 460 ± 36 nm filter (ET465/36 nm, Chroma Technology Corp.) was mounted onto the 465 nm diode, and a 524 ± 24 nm (FF01‐524/24, IDEX Health & Science, LLC., Rochester, NY) was mounted onto the 523 nm diode. After assembly, the maximum power output of the complete Necsel system was 1.14 W @ 400 nm, 1.36 W @ 465 nm and 1.45 W @ 523 nm. Further, control of the current (from the intelligent controller) allowed linear control over the laser power with R2 values >0.99. To shape the beam for imaging whole plants, a projector lens (63‐714, Edmund Optics, Barrington, NJ) was placed 6 mm in front of the homogenizing fibre to form a 400 cm2 imaging square at a distance of 3 m.
Images of plants at ≥3 m was achieved using an Andor Zyla 5.5 sCMOS camera equipped with a 50 mm focal length lens (86‐574, Edmund Optics). The camera was mounted to the same breadboard as the laser system, ensuring that the excitation and emission distances were identical. Control of the camera resolution, exposure time and image acquisition was achieved using the free open‐source software µManager. A five‐position motorized filter wheel with USB control (84‐889, Edmund Optics) was mounted between the camera lens and the sample to enable collection of images for specific wavelengths pertaining to the target fluorescent protein synthesized by plants. In the current version of FILP, three 50 mm emission filters were loaded onto the emission wheel: 460 ± 50 nm (ET460/50 nm), 525 ± 50 nm (ET525/50 nm) and 575 ± 40 nm (ET575/40 nm) (Chroma Technology Corp.).
To ensure user safety of the system and provide complete darkness for sampling, a custom laser range, 0.61 m × 0.91 m × 3.7 m, was assembled around the entire system using 25 mm construction rails and black hardboard (XE25 & TB4, ThorLabs, Newton, NJ). Plants were placed inside the enclosure through a door fabricated at the back of the enclosure using the same materials. Finally, a magnetic interlock was used to ensure that the class IV lasers could be operated as a class I system where the lasers were immediately and automatically turned off if the door was opened.
A custom plant stand (‘FILP’s castle’) to secure potted plants being imaged in the laser range was fabricated using 3D printing. The stand tilts potted plant samples 75 degrees forward to allow for maximum foliar exposure while using the laser system. The stand accommodates three square (7.6 cm) pots that are grown in an 18 cell flat (59‐3080, Griffin Greenhouse Supplies, Inc., Tewksbury, MA). Designs for 3D printing are available upon request.
Image processing
Assembly of FILP and confocal microscope images was done using the ImageJ (Schneider et al., 2012) analysis software (version 1.41o). Colour determination for each fluorescent protein was done using the Wolfram Demonstration Project (https://demonstrations.wolfram.com/), Colours of the Visible Spectrum plugin. Using the Adobe colour space option, peak emission wavelengths were used to query for RGB values. These values, representing a percentage, were multiplied by the maximum value for the R, G or B decimal code (255). The resulting values were then used to establish look‐up tables (LUT) for the ImageJ software. Images are input into the ImageJ software independently. Adjustments to brightness and contrast were applied uniformly across images if necessary. Using the images to stack function, FILP or confocal fluorescent and bright‐field (BF) images were overlaid. After using the composite image function and selecting the colour option of the channels tool, pseudo colouring is applied to a selected image. Presets include the grey which can be used for the bright‐field image as well as blue, green, red, etc. For more specific colour palettes, a unique LUT was generated. By default, ImageJ applies different colours to the different channels (images) and these were changed using the channels tool colour option. Images were exported as.tiff files for the construction of figures. We provide an example of the Wolfram player determination of R, G, B values, the conversion of these values to generate individual LUTs, the table of RGB decimal values for all FPs and a visual walkthrough of pseudo colouring (Figure S3).
For the continuous laser exposure experiment of top performer FP infiltrated plants at full laser power, 16‐bit black and white laser images were obtained every minute for a 60‐minute time series using the multidimensional acquisition feature of µManager. These images were cropped using an automated action in Adobe Photoshop CC 2019 v.20.0.5 (Adobe Systems, Inc. San Jose, CA). Since the first 30 min show that the plants are adjusting to the orientation of the plant stand and the alternative light environment, measurements were taken starting at the 30 min time point (T0) and continued until the end of the hour (T30). The cropped images were batch measured in ImageJ to record the mean pixel intensity for the same plant over time. The mean pixel intensity for each image was plotted relative to time and displayed in Figure S1.
Potato cell suspension used for protoplast production
The preparation of potato cell suspension used for synthetic promoter screening of protoplasts was modified from a previously described method by Sajid and Aftab (2016). Solanum tuberosum cv. ‘Desireé’ was propagated by nodal explants into propagation media [4.33 g/L MS salts (Phytotech M524, PhytoTech Labs, Lenexa, KS), 25 g/L sucrose, 100 mg/L myo‐inositol, 0.17 g/L sodium phosphate monobasic, 0.44 g/L calcium chloride dihydrate, 0.4 mg/L thiamine HCL, 5 mL/L ‘complete vitamin stock’ (for 100 mL; 40 mg glycine, 10 mg nicotinic acid, 10 mg pyridoxine HCL, 10 mg thiamine HCL), 3 g/L phytagel, pH 5.8, 1 mL/L MS (Phytotech M557) vitamins) in Magenta GA7 vessels under 16‐h day, 8‐h night fluorescent light conditions at room temperature (23°C). Sterile leaf explants, cut into 1–2 cm squares, were taken from propagates and callus was induced on callus induction (CI) media [4.33 g/L MS salts, 20 g/L sucrose, 2 g/L gelzan (solid media), pH 5.8, 1 mL/L MS vitamins, 4 mg/L 2,4‐D (2,4‐dichlorophenoxyacetic acid)]. Callus was transferred to fresh CI plates every 2‐3 weeks. After 4–5 weeks on CI media, approximately 2 g of green, friable callus was used to inoculate 20 mL of liquid CI media and grown on a platform shaker at 120–140 rpm for 7 d. The suspension was then filtered through a 425 µm sieve and transferred to a new 125‐mL flask. After the filtered cells settled, 15 mL of liquid CI media was removed, replenished with fresh CI media, and the suspension was grown again on a platform shaker at 120–140 rpm. After 7 d, an additional 30 mL of fresh liquid CI media was added to the flask and allowed to grow for another week. The cell suspension was maintained every 5–7 day by sub‐culturing approximately 15 mL of the filtered suspension culture into 30 mL of fresh media. Cells were periodically filtered through a 425 µm sieve to maintain consistency.
Protoplast transfection
Potato protoplasts were isolated from cell suspension culture 3 d post‐subculture. Five millilitres of packed cell volume was digested by a cell wall‐digesting enzyme solution [0.4 m mannitol, 20 mm MES (pH 5.7), 20 mm KCl, 10 mm CaCl2, 1% (w/v) bovine serum albumin (BSA), 5 mm β‐mercaptoethanol, 4.4% (v/v) Rohament CL, 4% (v/v) Rohapect, 0.6% (v/v) Rohapect UF] in the dark at room temperature for 2 h with gentle shaking (88 RPM). After two washes with wash buffer [0.45 m mannitol, 10 mm CaCl2] protoplasts were filtered through a 40 µm nylon mesh cell strainer (Fisher Scientific, Hampton, NH) and intact cells were purified on a 23% sucrose gradient. Protoplasts were then resuspended in a MMg solution [0.4 m mannitol, 15 mm MgCl2, 4 mm MES] to a concentration of 2 × 10⁵ protoplasts/mL.
For the protoplast transfection assay, PEG‐mediated transfection was conducted according to Yoo et al. (2007) with modification. Ten microlitres of plasmid (1 µg/µL) was added to 100 µL of protoplast suspension. After adding 110 µL of 40% PEG solution [40% (w/v) PEG‐4000 (Sigma), 0.2 m mannitol, 0.1 m CaCl2], the mixture was incubated for 15 min at room temperature. The reaction was stopped by adding 440 µL of W5 solution [2 mm MES, 154 mm NaCl, 125 mm CaCl2, 5 mm KCl] and the protoplasts were centrifuged at 100 g for 1 min, and then resuspended in 200 µL of WI solution [0.5 M mannitol, 4 mm MES, 20 mm KCl] for incubation in the dark for 48 h. Due to the osmolality of the MMg (449 mOsm), W5 (695 mOsm) and WI (544 mOsm) solutions used in this work, protoplasts received an osmotic stress during the transitions between these solutions.
Transformed protoplasts were observed for GFP expression using an EVOS M7000 imaging system (Thermo Fisher Scientific) equipped with a GFP filter (excitation 470/22 nm, emission 510/42 nm).
Synthetic promoter screening
To identify candidate osmotic stress‐inducible plant promoters, a library of synthetic promoters, ~2000 constructs (Stewart et al., unpublished data), was screened with a potato protoplast assay. Transformed protoplasts incubated under hypertonic conditions described above were observed for GFP expression after 48 h using an EVOS M7000 imaging system (Thermo Fisher Scientific, Waltham, MA) equipped with a GFP filter (excitation: 470/22 nm, emission: 510/42 nm), and protoplasts were scored as positive or negative for induction based on green fluorescence. Promoters identified in the protoplast screen were then characterized in leaves by agroinfiltration assays in N. benthamiana. Of 8 putative hits, we characterized one of the more promising ones here: JL1 (Figures S4 and S5).
For the N. benthamiana canopy experiment, osmotic stress treatment was applied by watering each pot with 100 mL of NaCl solution (250 mm) 48 hr after agroinfiltration, followed by withholding water for 5 d to the partial wilt stage. The mock treatment consisted of 100 mL tap water applied every two days to each plant. Three biological replicates were used, and the experiments were repeated three times. Fluorescence spectroscopy measurements were taken immediately prior to NaCl treatment and then repeated every day for 5 d. FILP images were taken on the final day of the experiment. Leaves not previously measured by the fluorescence spectrometer were removed, including old leaves and new leaves produced since agroinfiltration. Plants were imaged using the 400 nm laser diode and observed using the 525/50 nm filter. Laser wattage was 0.8 W, and the exposure time was 150 ms.
Yeast two‐hybrid
The DNA coding sequences for AtRAD51(AT5G20850) and AtODB1 (AT1G71310) were cloned from Arabidopsis leaf cDNA and incorporated into Invitrogen pENTR/D‐TOPO cloning vectors (Invitrogen, Carlsbad, CA). Following colony PCR and validation by sequencing, the coding sequences were each recombined into Gateway‐compatible yeast expression plasmids via the LR Clonase reaction (Invitrogen, Carlsbad, CA). These plasmids, pGBKCg and pGADCg, feature c‐terminal fusions for the GAL4 DNA‐binding domain and the GAL4 activation domain, respectively (Stellberger et al., 2010).
Both AtRAD51 and AtODB1 constructs, including empty vector negative controls, were transformed into mating compatible S. cerevisiae strains AH109 and Y187. Transformation of yeast and mating experiments were conducted as previously described (Rigoulot et al., 2019). Tryptophan‐ and leucine‐deficient media selected for yeast containing both pGBKCg and pGADCg constructs, respectively, while histidine and adenine deficient media selected for positive interaction.
Bi‐molecular fluorescence complementation vector construction
Following the positive Y2H results for the AtRAD51 self‐interaction, AtRAD51 was domesticated to remove BsaI/BbsI sites and re‐cloned into the CDS1 no stop level 0 acceptor vector (pAGM1287) for use in Golden Gate cloning strategies (Engler et al., 2014; Occhialini et al., 2019; Weber et al., 2011). Similarly, AtODB1 was cloned as a CDS1 no stop level 0 for use in negative controls. C‐terminal BiFC fusion pieces were designed based on the Gookin and Assmann (2014) construct pDOE‐01 CD3 1901 available from the Arabidopsis Biological Resource Center repository. As with the production of the CDS1 no stop lvl 0 pieces, the N‐terminal (NVen210) and the C‐terminal pieces (CVen210) were domesticated and subsequently cloned into the C‐terminal lvl 0 acceptor vector (pAGM1301) to generate modules for use with other Golden Gate compatible components. Remaining pieces were obtained from the Engler Golden Gate Modular Cloning Toolbox for Plants (Engler et al., 2014). All final expression constructs were assembled in the pAGM4723 level 2 vector. CVen210 fusion cassettes occupy position 1, NVen210 fusion cassettes occupy position 2 and if present the P19 helper cassette occupies position 3. All cassettes were produced in the reverse orientation. AtRAD51 and AtODB1 fusion cassettes were expressed using the 2 × 35s_5U‐TMV promoter (pICH51288) and included the A. tumefaciens nos terminator (pICH41421). Helper plasmids for the +P19 multi‐cassette vectors emulated the aforementioned pDOE‐01 vector (Gookin and Assmann, 2014), using the A. tumefaciens mas promoter (pICH85281) and terminator (pICH77901) to regulate the Tomato Bushy Stunt Virus P19 silencing suppressor (pICH44022). Vectors at the level 0, level 1 and level 2 stages were validated using colony PCR, restriction digest and sequencing before conducting any further experimentation.
Conflicts of interest
MJF is employed by a company who manufactured FILP components. CNS, SCL and JHL are inventors on relevant intellectual property assigned to the University of Tennessee Research Foundation.
Author Contributions
CNS, JDB, SCL, TMS and SBR conceived of the research. JDB, JAM, MJF, SCL, TMS and CNS played roles in designing and building the FILP instrument. SBR, TMS, JHL, SCL and CNS wrote and prepared the manuscript. SBR, KAM, HB and JHL were responsible for the organization of figures. SBR, TMS, JHL, HB, MJS, KAM, MRP, JSL, MJS, AO, SCL and EMS were responsible for the design and construction of all constructs tested, plant care, potato cell culture, protoplast assays, agroinfiltration experiments, confocal microscopy, and FILP imaging and spectroscopy. KAM, RGS and SBR designed and executed the Y2H and BiFC experiments. AO and LL transformed and characterized stable GFP expressing potato. MJS and SBR developed the agroinfiltration apparatus and produced the Supplementary video. HB and JWB were responsible for the conception and writing of the Fluorologger software. SBR and KAM designed the custom plant stand.
Supporting information
Table S1 Heatmap of laser power required for the detection of fluorescent proteins.
Table S2 Sequences of PCR primer used in this study.
Figure S1 Extended exposure of top performers to FILP lasers at full power.
Figure S2 Y2H for combinations of AtRAD51—AtODB1.
Figure S3 Determination and application of image colour.
Figure S4 Schematic diagram of the synthetic promoter‐reporter gene construct.
Figure S5 Nucleotide sequence of the 171 bp synthetic promoter and mEmerald GFP reporter gene (starting at the yellow highlighted ATG) fusion construct from the 5’ to 3’ direction.
Movie S1 Vacuum infiltration of Nicotiana benthamiana using a modified vacuum desiccator apparatus.
Acknowledgments
Special thanks to all members of the Center for Agricultural Synthetic Biology at the University of Tennessee for their support as well as laboratory members Lezlee Dice, Taylor Frazier‐Douglas, Cassie Halvorsen, Stacee Harbison, Mitra Mazarei, Reginald Millwood, Mary‐Anne Nguyen, Alex Pfoetenhaur, Christiano Piasecki, Rebekah Rogers, Yuanhua Shao, Shamira Sultana and Yongil Yang. We sincerely appreciate the assistance from Richard Sexton and Vilmos Magda at the University of Tennessee Pendergrass library with the 3D printing of the custom plant stand. This research was developed with funding from the Defense Advanced Research Projects Agency (DARPA) Award No. HR0011‐18‐2‐0049 and Department of Energy (DOE) Grant No. DE‐SC0018347. The views, opinions and/or findings expressed are those of the authors and should not be interpreted as representing the official views or policies of the Department of Defense or the U.S. Government. (Approved for Public Release, Distribution Unlimited).
Rigoulot, S. B. , Schimel, T. M. , Lee, J. H. , Sears, R. G. , Brabazon, H. , Layton, J. S. , Li, L. , Meier, K. A. , Poindexter, M. R. , Schmid, M. J. , Seaberry, E. M. , Brabazon, J. W. , Madajian, J. A. , Finander, M. J. , DiBenedetto, J. , Occhialini, A. , Lenaghan, S. C. and Stewart, C. N. Jr (2021) Imaging of multiple fluorescent proteins in canopies enables synthetic biology in plants. Plant Biotechnol J, 10.1111/pbi.13510
Contributor Information
Scott C. Lenaghan, Email: slenagha@utk.edu.
C. Neal Stewart, Jr, Email: nealstewart@utk.edu.
References
- Alieva, N.O. , Konzen, K.A. , Field, S.F. , Meleshkevitch, E.A. , Hunt, M.E. , Beltran‐Ramirez, V. , Miller, D.J. et al. (2008) Diversity and evolution of coral fluorescent proteins. PLoS One, 3, e2680. [DOI] [PMC free article] [PubMed] [Google Scholar]
- Araus, J.L. , Kefauver, S.C. , Zaman‐Allah, M. , Olsen, M.S. and Cairns, J.E. (2018) Translating high‐throughput phenotyping into genetic gain. Trends Plant Sci. 23, 451–466. [DOI] [PMC free article] [PubMed] [Google Scholar]
- Bajar, B.T. , Wang, E.S. , Lam, A.J. , Kim, B.B. , Jacobs, C.L. , Howe, E.S. , Davidson, M.W. et al. (2016) Improving brightness and photostability of green and red fluorescent proteins for live cell imaging and FRET reporting. Sci. Rep. 6, 20889. [DOI] [PMC free article] [PubMed] [Google Scholar]
- Baker, S.S. , Vidican, C.B. , Cameron, D.S. , Greib, H.G. , Jarocki, C.C. , Setaputri, A.W. , Spicuzza, C.H. et al. (2012) An epifluorescent attachment improves whole‐plant digital photography of Arabidopsis thaliana expressing red‐shifted green fluorescent protein. AoB Plants, 2012, pls003. [DOI] [PMC free article] [PubMed] [Google Scholar]
- Bindels, D.S. , Haarbosch, L. , van Weeren, L. , Postma, M. , Wiese, K.E. , Mastop, M. , Aumonier, S. et al. (2017) mScarlet: a bright monomeric red fluorescent protein for cellular imaging. Nat. Methods, 14, 53–56. [DOI] [PubMed] [Google Scholar]
- Chang, W. , Cheng, J. , Allaire, J.J. , Xie, Y. and McPherson, J. (2019) Shiny: web application framework for R. R package version 1.3.0. [Google Scholar]
- Chen, Y. , Li, T. , Yang, Q. , Zhang, Y. , Zou, J. , Bian, Z. and Wen, X. (2019) UVA radiation is beneficial for yield and quality of indoor cultivated lettuce. Front. Plant Sci. 10, 1563. [DOI] [PMC free article] [PubMed] [Google Scholar]
- Chin, D.P. , Shiratori, I. , Shimizu, A. , Kato, K. , Mii, M. and Waga, I. (2018) Generation of brilliant green fluorescent petunia plants by using a new and potent fluorescent protein transgene. Sci. Rep. 8, 16556. [DOI] [PMC free article] [PubMed] [Google Scholar]
- Chronis, D. , Chen, S. , Lang, P. , Tran, T. , Thurston, D. and Wang, X. (2014) Potato transformation. Bio. Protoc. 4(1), 1017. [Google Scholar]
- Ckurshumova, W. , Caragea, A.E. , Goldstein, R.S. and Berleth, T. (2011) Glow in the dark: fluorescent proteins as cell and tissue‐specific markers in plants. Mol. Plant, 4, 794–804. [DOI] [PubMed] [Google Scholar]
- Cubitt, A.B. , Woollenweber, L.A. and Heim, R. (1998) Chapter 2: Understanding structure—function relationships in the Aequorea victoria green fluorescent protein. Methods Cell Biol. 58, 19–30. [DOI] [PubMed] [Google Scholar]
- Curtis, M.D. and Grossniklaus, U. (2003) A gateway cloning vector set for high‐throughput functional analysis of genes in planta. J. Plant Physiol. 133, 462–469. [DOI] [PMC free article] [PubMed] [Google Scholar]
- Dhondt, S. , Wuyts, N. and Inzé, D. (2013) Cell to whole‐plant phenotyping: the best is yet to come. Trends Plant Sci. 18, 428–439. [DOI] [PubMed] [Google Scholar]
- DiBenedetto, J. , Capelle, G.A. and O’Neill, M. (2012) Time‐resolved hyperspectral fluorescence spectroscopy using frequency‐modulated excitation. J. Appl. Phys. 112, 013109. [Google Scholar]
- Engler, C. , Youles, M. , Gruetzner, R. , Ehnert, T.‐M. , Werner, S. , Jones, J.D.G. , Patron, N.J. et al. (2014) A Golden Gate modular cloning toolbox for plants. ACS Synth Biol. 3, 839–843. [DOI] [PubMed] [Google Scholar]
- Fethe, M.H. , Liu, W. , Burris, J.N. , Millwood, R.J. , Mazarei, M. , Rudis, M.R. , Yeaman, D.G. et al. (2014) The performance of pathogenic bacterial phytosensing transgenic tobacco in the field. Plant Biotechnol. J. 12, 755–764. [DOI] [PubMed] [Google Scholar]
- Gadella, T.W.J. , van der Krogt, G.N.M. and Bisseling, T . (1999) GFP‐based FRET microscopy in living plant cells. Trends Plant Sci. 4, 287–291. [DOI] [PubMed] [Google Scholar]
- Goedhart, J. , van Weeren, L. , Hink, M.A. , Vischer, N.O. , Jalink, K. and Gadella, T.W. Jr . (2010) Bright cyan fluorescent protein variants identified by fluorescence lifetime screening. Nat. Methods, 7, 137–139. [DOI] [PubMed] [Google Scholar]
- Gookin, T.E. and Assmann, S.M. (2014) Significant reduction of BiFC non‐specific assembly facilitates in planta assessment of heterotrimeric G‐protein interactors. Plant J. 80, 553–567. [DOI] [PMC free article] [PubMed] [Google Scholar]
- Harper, B.K. , Mabon, S.A. , Leffel, S.M. , Halfhill, M.D. , Richards, H.A. , Moyer, K.A. and Stewart, C.N. Jr . (1999) Green fluorescent protein as a marker for expression of a second gene in transgenic plants. Nat. Biotechnol. 17, 5. [DOI] [PubMed] [Google Scholar]
- Houle, D. , Govindaraju, D.R. and Omholt, S. (2010) Phenomics: the next challenge. Nat. Rev. Genet. 11, 855–866. [DOI] [PubMed] [Google Scholar]
- Jung, C.S. , Griffiths, H.M. , De Jong, D.M. , Cheng, S. , Bodis, M. and De Jong, W.S. (2005) The potato P locus codes for flavonoid 3',5'‐hydroxylase. Theor. Appl. Genet. 110(2), 269–275. [DOI] [PubMed] [Google Scholar]
- Kappes, U.P. , Luo, D. , Potter, M. , Schulmeister, K. and Runger, T.M. (2006) Short‐ and long‐wave UV light (UVB and UVA) induce similar mutations in human skin cells. J. Invest. Dermatol. 126, 667–675. [DOI] [PubMed] [Google Scholar]
- Kozmin, S. , Slezak, G. , Reynaud‐Angelin, A. , Elie, C. , de Rycke, Y. , Boiteux, S. and Sage, E. (2016) UVA radiation is highly mutagenic in cells that are unable to repair 7,8‐dihydro‐8‐oxoguanine in Saccharomyces cerevisiae . PNAS, 102, 13538–13543. [DOI] [PMC free article] [PubMed] [Google Scholar]
- Kremers, G. , Goedhart, J. , Van Munster, E.B. , Gadella, J. and Gadella, TWJ (2006) Cyan and yellow super fluorescent proteins with improved brightness, protein folding, and FRET Fo¨rster radius. Biochemistry, 52, 11. [DOI] [PubMed] [Google Scholar]
- Lam, A.J. , St‐Pierre, F. , Gong, Y. , Marshall, J.D. , Cranfill, P.J. , Baird, M.A. , McKeown, M.R. et al. (2012) Improving FRET dynamic range with bright green and red fluorescent proteins. Nat. Methods, 9, 1005–1012. [DOI] [PMC free article] [PubMed] [Google Scholar]
- de Lange, O. , Klavins, E. and Nemhauser, J. (2018) Synthetic genetic circuits in crop plants. Curr. Opin. Biotechnol. 49, 16–22. [DOI] [PMC free article] [PubMed] [Google Scholar]
- Liu, W. and Stewart, C.N. Jr . (2016) Plant synthetic promoters and transcription factors. Curr. Opin. Biotechnol. 37, 36–44. [DOI] [PubMed] [Google Scholar]
- Merzlyak, E.M. , Goedhart, J. , Shcherbo, D. , Bulina, M.E. , Shcheglov, A.S. , Fradkov, A.F. , Gaintzeva, A. et al. (2007) Bright monomeric red fluorescent protein with an extended fluorescence lifetime. Nat. Methods, 4, 555–557. [DOI] [PubMed] [Google Scholar]
- Millwood, R.J. , Halfhill, M.D. , Harkins, D. , Russotti, R. and Stewart, C.N. (2003) Instrumentation and methodology for quantifying GFP fluorescence in intact plant organs. Biotechniques, 34, 5. [DOI] [PubMed] [Google Scholar]
- Mulla, D.J. (2013) Twenty five years of remote sensing in precision agriculture: key advances and remaining knowledge gaps. Biosyst. Eng. 114, 358–371. [Google Scholar]
- Mylle, E. , Codreanu, M. , Boruc, J. and Russinova, E. (2013) Emission spectra profiling of fluorescent proteins in living plant cells. Plant Methods, 9, 10. [DOI] [PMC free article] [PubMed] [Google Scholar]
- Nguyen, A.W. and Daugherty, P.S. (2005) Evolutionary optimization of fluorescent proteins for intracellular FRET. Nat. Biotechnol. 23, 355–360. [DOI] [PubMed] [Google Scholar]
- Occhialini, A. , Piatek, A.A. , Pfotenhauer, A.C. , Frazier, T.P. , Stewart, C.Neal and Lenaghan, S.C. (2019) MoChlo: a versatile, modular cloning toolbox for chloroplast biotechnology. Plant Physiol. 179(3), 943. [DOI] [PMC free article] [PubMed] [Google Scholar]
- R Core Team . (2013) R: A language and environment for statistical computing. Vienna, Austria: R Foundation for Statistical Computing. [Google Scholar]
- Rigoulot, S.B. , Petzold, H.E. , Williams, S.P. , Brunner, A.M. and Beers, E.P. (2019) Populus trichocarpa clade A PP2C protein phosphatases: their stress‐induced expression patterns, interactions in core abscisic acid signaling, and potential for regulation of growth and development. Plant Mol. Biol. 100(3), 303–317. [DOI] [PubMed] [Google Scholar]
- Sajid, Z.A. and Aftab, F. (2016) An efficient method for the establishment of cell suspension cultures in potato (Solanum tuberosum L.). Pak J. Bot. 48, 1993–1997. [Google Scholar]
- Sakaue‐Sawano, A. , Kurokawa, H. , Morimura, T. , Hanyu, A. , Hama, H. , Osawa, H. , Kashiwagi, S. et al. (2008) Visualizing spatiotemporal dynamics of multicellular cell‐cycle progression. Cell 132, 487–498. [DOI] [PubMed] [Google Scholar]
- Schneider, C.A. , Rasband, W.S. and Eliceiri, K.W. (2012) NIH Image to ImageJ: 25 years of image analysis. Nat Methods 9, 4. [DOI] [PMC free article] [PubMed] [Google Scholar]
- Shagin, D.A. , Barsova, E.V. , Yanushevich, Y.G. , Fradkov, A.F. , Lukyanov, K.A. , Labas, Y.A. , Semenova, T.N. et al. (2004) GFP‐like proteins as ubiquitous metazoan superfamily: evolution of functional features and structural complexity. Mol. Biol. Evol. 21, 841–850. [DOI] [PubMed] [Google Scholar]
- Shaner, N.C. , Campbell, R.E. , Steinbach, P.A. , Giepmans, B.N. , Palmer, A.E. and Tsien, R.Y. (2004) Improved monomeric red, orange and yellow fluorescent proteins derived from Discosoma sp. red fluorescent protein. Nat. Biotechnol. 22, 1567–1572. [DOI] [PubMed] [Google Scholar]
- Shcherbakova, D.M. , Hink, M.A. , Joosen, L. , Gadella, T.W. and Verkhusha, V.V. (2012) An orange fluorescent protein with a large Stokes shift for single‐excitation multicolor FCCS and FRET imaging. J. Am. Chem. Soc. 134, 7913–7923. [DOI] [PMC free article] [PubMed] [Google Scholar]
- Shen, Z. , Cloud, K.G. , Chen, D.J. and Park, M.S. (1996) Specific interactions between the human RAD51 and RAD52 proteins. J. Biol. 271, 148–152. [DOI] [PubMed] [Google Scholar]
- Shimomura, O. , Johnson, F.H. and Saiga, Y. (1962) Extraction, purification and properties of aequorin, a bioluminescent protein from the luminous hydromedusan, Aequorea. J. Cell Comp. Physiol. 59, 223–239 [DOI] [PubMed] [Google Scholar]
- Stellberger, T. , Häuser, R. , Baiker, A. , Pothineni, V.R. , Haas, J. and Uetz, P. (2010) Improving the yeast two‐hybrid system with permutated fusions proteins: the Varicella Zoster Virus interactome. Proteome Sci. 8, 8. [DOI] [PMC free article] [PubMed] [Google Scholar]
- Stewart, C.N. Jr . (2005) Monitoring the presence and expression of transgenes in living plants. Trends Plant Sci. 10, 390–396. [DOI] [PubMed] [Google Scholar]
- Stewart, C.N. Jr . (2006) Go with the glow: fluorescent proteins to light transgenic organisms. Trends Biotechnol. 24, 155–162. [DOI] [PubMed] [Google Scholar]
- Stewart, C.N. Jr , Millwood, R.J. , Halfhill, M.D. , Ayalew, M. , Cardoza, V. , Kooshki, M. , Capelle, G.A. et al. (2005) Laser‐induced fluorescence imaging and spectroscopy of GFP transgenic plants. J. Fluoresc. 15, 697–705. [DOI] [PubMed] [Google Scholar]
- Subach, O.M. , Cranfill, P.J. , Davidson, M.W. and Verkhusha, V.V. (2011) An enhanced monomeric blue fluorescent protein with the high chemical stability of the chromophore. PLoS One, 6, e28674. [DOI] [PMC free article] [PubMed] [Google Scholar]
- Talamond, P. , Verdeil, J.L. and Conejero, G. (2015) Secondary metabolite localization by autofluorescence in living plant cells. Molecules, 20, 5024–5037. [DOI] [PMC free article] [PubMed] [Google Scholar]
- Tardieu, F. , Cabrera‐Bosquet, L. , Pridmore, T. and Bennett, M. (2017) Plant phenomics, from sensors to knowledge. Curr. Biol. 27, R770–R783. [DOI] [PubMed] [Google Scholar]
- Trainham, R. , O'Neill, M. and McKenna, I.J. (2015) An analog filter approach to frequency domain fluorescence spectroscopy. J. Fluoresc. 25, 1801–1812. [DOI] [PMC free article] [PubMed] [Google Scholar]
- Untergasser, A. , Cutcutache, I. , Koressaar, T. , Ye, J. , Faircloth, B.C. , Remm, M. and Rozen, S.G. (2012) (2012) Primer3—new capabilities and interfaces. Nucleic Acids Res. 40(15), 115. [DOI] [PMC free article] [PubMed] [Google Scholar]
- Verdaguer, D. , Jansen, M.A. , Llorens, L. , Morales, L.O. and Neugart, S. (2017) UV‐A radiation effects on higher plants: exploring the known unknown. Plant Sci. 255, 72–81. [DOI] [PubMed] [Google Scholar]
- Weber, E. , Engler, C. , Gruetzner, R. , Werner, S. and Marillonnet, S. (2011) A modular cloning system for standardized assembly of multigene constructs. PLoS One, 6(2), 16765. [DOI] [PMC free article] [PubMed] [Google Scholar]
- Weigel, D. and Glazebrook, J. (2006) Transformation of Agrobacterium using the freeze‐thaw method. CSH Protoc. 2006, pdb.prot4666 [DOI] [PubMed] [Google Scholar]
- Wurtzel, E.T. , Vickers, C.E. , Hanson, A.D. , Harvey‐Millar, A. , Cooper, M. , Voss‐Fels, K.P. , Nikel, P.I. et al. (2019) Revolutionizing agriculture with synthetic biology. Nat. Plants 12, 1207–1210. [DOI] [PubMed] [Google Scholar]
- Yang, J. , Wang, L. , Yang, F. , Luo, H. , Xu, L. , Lu, J. , Zeng, S. et al. (2013) mBeRFP, an improved large stokes shift red fluorescent protein. PLoS One, 8, e64849. [DOI] [PMC free article] [PubMed] [Google Scholar]
- Yoo, S.D. , Cho, Y.H. and Sheen, J. (2007) Arabidopsis mesophyll protoplasts: a versatile cell system for transient gene expression analysis. Nat. Protoc. 2, 1565–1572. [DOI] [PubMed] [Google Scholar]
- Zhu, J.K. (2016) Abiotic stress signaling and responses in plants. Cell, 167, 313–324. [DOI] [PMC free article] [PubMed] [Google Scholar]
Associated Data
This section collects any data citations, data availability statements, or supplementary materials included in this article.
Supplementary Materials
Table S1 Heatmap of laser power required for the detection of fluorescent proteins.
Table S2 Sequences of PCR primer used in this study.
Figure S1 Extended exposure of top performers to FILP lasers at full power.
Figure S2 Y2H for combinations of AtRAD51—AtODB1.
Figure S3 Determination and application of image colour.
Figure S4 Schematic diagram of the synthetic promoter‐reporter gene construct.
Figure S5 Nucleotide sequence of the 171 bp synthetic promoter and mEmerald GFP reporter gene (starting at the yellow highlighted ATG) fusion construct from the 5’ to 3’ direction.
Movie S1 Vacuum infiltration of Nicotiana benthamiana using a modified vacuum desiccator apparatus.