Abstract
Introduction:
The Sociétè Internationale d`Oncologie Pédiatrique advocates for neoadjuvant chemotherapy in the management of nephroblastoma. Postoperatively, histological findings are used to assign risk classification to resected tumours. The aim of this study is to compare the response demonstrated by pre-operative imaging to the amount of necrosis seen on histology postoperatively.
Patients and Methods:
About 33 patients with nephroblastoma over a 10 year period had adequate imaging and histology records for this study. Three methods were used to assess tumour change following neoadjuvant therapy and were compared with histological records. 1. An estimation of necrosis, 2. Surface areas of apparent necrosis within the tumour measured on static imaging, 3. The change in volume of the mass. Pearson coefficient was calculated to measure the correlation between histologically observed necrosis and radiological changes. Results were considered significant if P < 0.05.
Results:
There was no correlation between radiological changes on pre-operative imaging and the percentage of necrosis seen on histology. Change in tumour size on radiological studies showed a moderate correlation to percentage tumour necrosis on histology but was unable to predict tumour risk classification.
Conclusions:
In nephroblastoma, there is a moderate correlation between the decrease in size of a mass noted on imaging following chemotherapy and the degree of necrosis found postoperatively on histology. Change in tumour size cannot be used to predict histological risk classification. It is not possible to predict the histological risk classification of a nephroblastoma based on the changes demonstrated on non-contrasted magnetic resonance imaging or computed tomography preoperatively.
Keywords: Necrosis, nephroblastoma, radiology, risk stratification
INTRODUCTION
The Sociétè Internationale d`Oncologie Pédiatrique (SIOP) advocates for pre-operative chemotherapy, followed by nephrectomy. Like other research groups, ongoing research by SIOP continues to improve the prognosis of nephroblastoma while also reducing complications, toxicity and costs associated with treatment.[1,2]
Risk stratification is a clinical management strategy used in the SIOP protocol to direct intensified treatment to those patients with the most aggressive tumours while sparing patients with less aggressive tumours the complications of unnecessary chemotherapy and radiotherapy. The SIOP protocol attributes risk according to stage, histological classification, age and genetic or biological factors.[2]
The SIOP histological classification system for renal tumours after chemotherapy [Table 1] assigns a risk stratification to tumours according to histological findings. Completely necrotic nephroblastoma represents tumours found by histology to have more than 90% necrosis present; these are considered to be low risk. Regressive type nephroblastoma represents all tumours with 66% or more necrosis, unless the histological characteristic of remaining viable tissue has blastemal elements which represent 10% or more of the entire tumour mass. If this is the case, the tumour is classified as mixed type; however, this does not affect the risk stratification of the tumour which is considered to be of intermediate risk, along with the regressive type nephroblastoma. Therefore, if it is possible to predict the necrosis to be more than 66%, it can confidently be said that the tumour is intermediate risk or less. A tumour that is 90% necrotic is certainly low risk.
Table 1.
The revised Sociétè Internationale d`Oncologie Pédiatrique classification of renal tumours of childhood[1,2]
| Risk | Histology |
|---|---|
| Low risk | Mesoblastic nephroma |
| Cystic partially differentiated nephroblastoma | |
| Nephroblastoma - Completely necrotic | |
| Intermediate | Nephroblastoma - Epithelial type |
| Nephroblastoma - Stromal type | |
| Nephroblastoma - Mixed type | |
| Nephroblastoma - Regressive type | |
| Nephroblastoma - Focal anaplastic type | |
| High | Nephroblastoma - Blastemal type |
| Nephroblastoma - Diffuse anaplasia | |
| Clear cell sarcoma of the kidney | |
| Rhabdoid tumour of the kidney |
The aim of this research was to compare findings on pre-operative imaging to histological findings in patients with nephroblastoma to assess if there was a correlation between changes noted on radiology due to neoadjuvant chemotherapy preoperatively and the amount of necrosis seen at histological assessment postoperatively. The purpose was to assess if there are any radiological factors which could predict the risk stratification of nephroblastoma preoperatively, thus opening the door to further tailor the pre-operative management of nephroblastoma to individual patient needs.
PATIENTS AND METHODS
A retrospective review of histological and radiological results was undertaken. All patients who underwent treatment for nephroblastoma at a single tertiary level hospital between June 2009 and June 2019 were assessed for eligibility. Inclusion criteria were as follows:
Final diagnosis of nephroblastoma
Completion of pre-operative neoadjuvant chemotherapy
Resection of tumour with radical nephrectomy
Availability of full histological report of resected kidney and tumour
Availability of electronic radiological records taken before chemotherapy and repeated after chemotherapy before resection.
International standards for histological assessment of a renal mass are undertaken on all tumours. In each case, the resected kidney and tumour were cut in the coronal section to expose the relation of the tumour to the renal tissue, collecting system and vasculature. The coronal section then underwent systematic histological assessment and an estimation of the percentage necrosis, as well as the viable cell lines, was made. The pathologist then assigned a histological risk classification to the tumour according to the SIOP working classification of tumours following chemotherapy [Table 1].
Radiological assessment of the tumours was undertaken using three methods. When generating the strategies used, the authors aimed to use easily reproducible methods which, if proven valuable, could be easily duplicated in clinical practice. No distinction was made between magnetic resonance imaging (MRI) and computed tomography (CT) and the imaging assessment techniques were adapted to be used in either modality.
Method 1: Estimation
The first method was an assessment made by a senior consultant radiologist. The radiologist was asked to scroll through the images and estimate the percentage of the tumour mass that was thought to be necrotic. The estimated percentage necrosis for the mass on the last imaging done before surgery was compared with the percentage necrosis found on histology.
Method 2: Surface area
The second method was modelled on the technique used by histologists to assess the histological characteristics of renal tumours described above. A senior radiologist was given static images of the mass and was asked to calculate the percentage surface area of the mass in each section which was found to be necrotic tissue. Three equally spaced cuts were taken for each mass and the average of this was taken as the percentage necrosis of the mass as a whole. The calculated average necrosis was again compared with histology findings.
Method 3: Change in volume
The third method involved the comparison of calculated volumes of tumour mass at diagnosis and following chemotherapy. To calculate the volumes of the tumours, an assumption was made that the tumours were elliptical in shape. Radiological assessment was undertaken to determine the diameter of the mass in three planes and the volume of the mass was calculated. The change in volume was calculated as a percentage of the original mass size and this was compared to histological findings.
The radiologist reviewing the imaging in each method was blinded to the histological and clinical outcomes of the patients.
For each method, a scatter chart was plotted and the Pearson's correlation coefficient was calculated. The Pearson's correlation coefficient was chosen because the data were continuous and a linear relationship was being investigated. Results were considered significant if P < 0.05.
For each of the included patients, the time taken between last imaging and surgical resection was noted in days and recorded as the waiting time.
Ethical approval was granted by the Health Research Ethics Committee of the academic institution associated with the tertiary hospital at which the study was done. Reference Number (S19/07/127).
RESULTS
There were 47 patients treated according to the SIOP protocol for nephroblastoma at a tertiary level institution between June 2009 and 2019. Of these 33 patients met the inclusion criteria for the study. Eighteen patients were excluded: two did not undergo neoadjuvant chemotherapy, ten did not have repeat imaging following chemotherapy before resection and two underwent nephron-sparing surgery for bilateral disease.
The data generated by the evaluation of imaging as well as the findings on histology are tabulated in Table 2.
Table 2.
Histological results with estimation of necrosis on pre-operative imaging by three methods and waiting time between last imaging done and operative intervention
| Risk stratification | Classification | HN (%) | Method 1 | Method 2 | Method 3 | WT |
|---|---|---|---|---|---|---|
| Epithelial | Intermediate | 0 | 80 | 83.3 | 85 | 16 |
| Mixed | Intermediate | 40 | 3 | 2.3 | 41 | 27 |
| Mixed | Intermediate | 65 | 10 | 10.0 | 5 | 21 |
| Diffuse anaplasia | High | 35 | 65 | 56.7 | 70 | 24 |
| Regressive | Intermediate | 85 | 2 | 1.7 | 94 | 6 |
| Regressive | Intermediate | 90 | 60 | 56.7 | 58 | 7 |
| Epithelial | Intermediate | 10 | 6 | 6.0 | 24 | 6 |
| Mixed | Intermediate | 65 | 35 | 33.3 | 81 | 1 |
| Stromal | Intermediate | 60 | 70 | 68.3 | 14 | 7 |
| Regressive | Intermediate | 80 | 65 | 60.0 | 79 | 5 |
| Focal anaplasia/mixed | Intermediate | 25 | 85 | 83.3 | 57 | 2 |
| Regressive | Intermediate | 80 | 7.5 | 8.3 | 86 | 2 |
| Blastemal | High | 0 | 5 | 7.3 | −13 | 5 |
| Blastemal | High | 25 | 35 | 36.7 | 71 | 6 |
| Diffuse anaplasia | High | 20 | - | - | 31 | 19 |
| Stromal | Intermediate | 45 | - | - | 18 | 10 |
| Regressive | Intermediate | 66 | - | - | 69 | 14 |
| Mixed | Intermediate | 85 | - | - | 87 | 1 |
| Mixed | Intermediate | 50 | - | - | 16 | 21 |
| Mixed | Intermediate | 10 | - | - | 56 | 5 |
| Necrotic | Low | 100 | - | - | 94 | 1 |
| Mixed | Intermediate | 80 | - | - | 93 | 16 |
| Regressive | Intermediate | 97 | - | - | 77 | 7 |
| Epithelial | Intermediate | 0 | - | - | 42 | 20 |
| Mixed | Intermediate | 0 | - | - | 6 | 25 |
| Stromal | Intermediate | 10 | - | - | 26 | 12 |
| Regressive | Intermediate | 80 | - | - | 32 | 17 |
| Blastemal | High | 60 | - | - | 86 | 5 |
| Stromal | Intermediate | 6 | - | - | 34 | 5 |
| Regressive | Intermediate | 85 | - | - | 74 | 15 |
| Necrotic | Low | 100 | - | - | 34 | 29 |
| Necrotic | Low | 100 | - | - | 93 | 19 |
| Regressive | Intermediate | 85 | - | - | 56 | 45 |
HN: Histological necrosis, WT: Waiting time between last imaging and surgical resection in days
Twenty-five tumours were classified as intermediate risk and five tumours were found to have high-risk histology. Three patients had low-risk tumours.
Seventeen tumours contained 65% or more necrosis and could be classified as low or intermediate risk on the basis of necrotic content alone. This included all low-risk tumours and 14 of the intermediate-risk tumours. The remaining 11 intermediate-risk tumours were classified according to findings over and above necrotic characteristics. None of the methods used to assess imaging preoperatively could correctly estimate necrosis consistently or identify the 17 tumours which could be classified as low or intermediate risk on the basis of necrotic content.
Method 1 and method 2 of measurement were only used on the first 14 tumours included in the study. These methods were aborted after this point as preliminary results demonstrated very weak correlation.
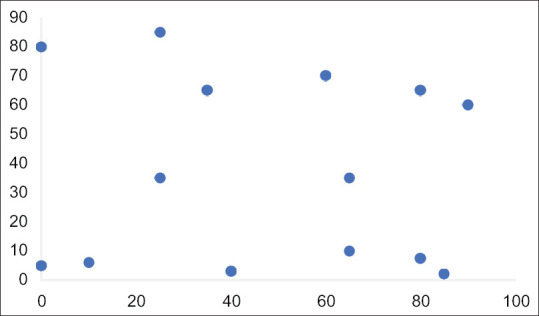
Method 1, using an estimation of necrosis by a senior radiologist, only correctly predicted one of the six tumours with regressive characteristic and incorrectly classified 1 high-risk tumour as intermediate risk. Figure 1 shows a scatter chart of the results comparing the estimation of necrosis to histologically demonstrated necrosis. The Pearson coefficient R was −0.0727 (P = 0.8) signifying a weak correlation with an insignificant P value.
Figure 1.

Scatter chart of histological necrotic content and estimation of necrosis on pre-operative imaging. Pearson's correlation coefficient −0.0727 (P = 0.8) indicating an extremely weak-negative correlation
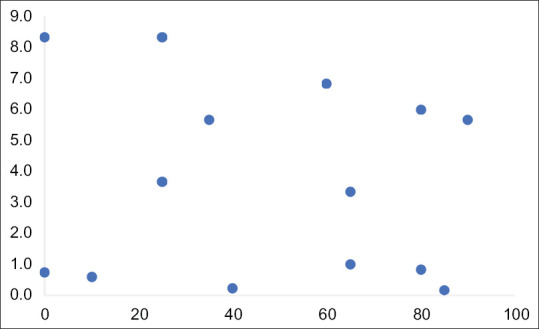
Method 2, which used the calculated surface area of necrosis in a selected section of the tumour, was not able to identify any of the regressive tumours. Figure 2 shows a scatter chart of the results comparing the surface area of necrosis to histologically demonstrated necrosis. The Pearson coefficient R was −0.1143 (P = 0.7) signifying a very weak correlation with an insignificant P value.
Figure 2.

Scatter chart of histological necrotic content and calculated surface area of necrosis on pre-operative imaging. Pearson's correlation coefficient = −0.1143 (P = 0.7) indicating an weak-negative correlation
Method 3, which calculated the change in the size of the tumour following neoadjuvant chemotherapy, performed the best and correctly identified 11 of the 17 tumours which could be classified on the basis of percentage necrosis. This method also incorrectly categorised 3 high-risk tumours as intermediate risk and estimated the necrotic content in an epithelial tumour with no necrosis to be 80%.
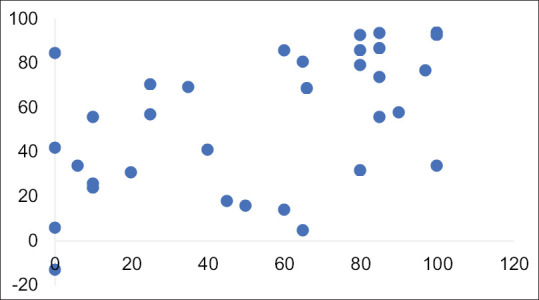
Figure 3 shows a scatter chart of the results comparing the surface area of necrosis to histologically demonstrated necrosis. The Pearson coefficient R was 0.51 (P < 0.05) signifying a moderate correlation with a significant P value.
Figure 3.

Scatter chart of histological necrotic content and change in volume of tumour on pre-operative imaging. Pearson's correlation coefficient R = 0.51 (P < 0.05) indication a moderate-positive correlation
Fourteen of the 33 patients waited more than 14 days after repeat imaging before surgery was undertaken. Removing these 14 patients from the data set did improve the performance of method 3 without rendering the results insignificant. The Pearson coefficient R was 0.7122 (P < 0.05).
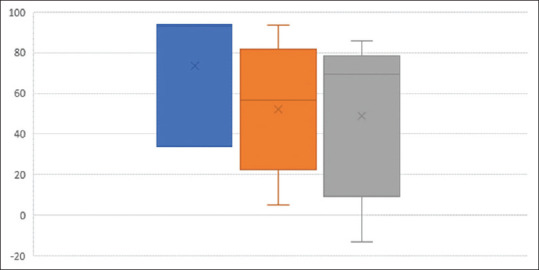
The results of method 3 were further analysed. The box and whiskers chart [Figure 4] summarises the means, interquartile range and minimum and maximum results of change in size according to the risk stratification. There was no significant difference between the means of the change in the size of the mass in low- and intermediate-risk tumours and high-risk tumours.
Figure 4.

Box and whiskers chart summarises the means, interquartile range, minimum and maximum results of change in size according to the histological risk stratification
DISCUSSION
This study found that the correlation between the changes seen in tumours on pre-operative imaging and histologically identified necrosis is moderate to weak. Despite assessing changes in imaging using a range of different methods, it was not possible to reliably predict which tumours had more than 65% necrosis on histological assessment.
Had an effective strategy to predict necrosis been identified, 17 (52%) of the cases would be amenable to assessment preoperatively. This is because of the nature of the model used which only utilises necrosis to predict the histological risk stratification. Only tumours with 65% or more necrosis would be eligible for comment while the remaining tumours would have other factors which would need assessment in the SIOP risk stratification protocol.
This study demonstrated that there is a moderate correlation between change in size of tumour and percentage necrosis on histological assessment. However, when comparing the risk stratification of tumours to the degree of change in size, there was no significant difference of the means. Therefore, although tumour shrinkage may correlate moderately with an increased amount of tumour necrosis, this is not an adequate marker to predict tumour risk classification preoperatively.
Change in size as an independent marker of responsiveness has previously been flagged as a problematic sign in nephroblastoma.[3] This is because an increase in size of the tumour may actually represent differentiation indicating favourable histology while predominantly blastemal elements can be found in tumours which have shrunk considerably after chemotherapy.[4] This is in keeping with previous research which noted that radiological response as measured by a decrease in tumour size and increased in non-enhancing content, among other factors, was not related to histopathological classification.[5] This means that seemingly unresponsive tumours may represent favourable histological types while others which appear to be necrotic on imaging may represent high-grade tumours. Thus, assumptions about responsiveness to chemotherapy preoperatively, before the histological assessment can be undertaken, should be avoided as this does not relate to risk stratification and may mislead treating physicians and surgeons.
Apart from ultrasound assessment, post-chemotherapy pre-operative imaging of nephroblastoma itself is interesting but of little clinical importance at this time. Ultrasound and Doppler ultrasound seem to be the best modality for pre-operative reassessment of the primary tumour, as these provide the best indication of intravascular thrombus extension and cleavage planes which are the key factors needed for surgical planning.[5,6] However, the popularity of MRI and CT scans is maintained in clinical practice as ultrasound is known to be operator dependant and because of the relative ease with which non-radiologist clinicians are able to review MRI or CT imaging.[5]
Other techniques to assess nephroblastoma have been investigated with research on the use of nuclear medicine to assess the histological nature of residual tumour mass in a small study showing promising results which may contribute to clinical decision-making in the future.[7]
Diffusion-weighted imaging (DWI) in MRI is able to assess the cellularity of tissues and tumours by observing changes in Brownian motion of molecules in response to magnetic pulses and is reported as apparent diffusion coefficients.[8] Most malignant tumours are found to have high cellularity and thus show signs of restriction on DWI.[9] Nephroblastomas with pre-dominant epithelial and blastemal histology showed limitation of ACD which is in keeping with the assessment that areas of increased cellularity will show diffusion restriction.[10,11,12] Stroma-rich tumours show less restriction.[10]
The use of imaging in the form of CT and MRI has previously been examined for the purpose of pre-operative staging,[5,6,13,14] but this study purely investigated changes seen in the primary tumour itself and thus cannot contribute to the dialogue around monitoring or diagnosis of lymph node or distant metastatic involvement.
Limitations
Given the retrospective nature of this study, the imaging techniques were not standardised. Both MRI and CT were used and a distinction was not made between the modalities which could have given distinct results in the estimation of necrosis. Furthermore, the imaging studies used in this study were non-contrasted. This limits the ability of this study to explore the use of contrast uptake as a process for the assessment of necrosis.
Not all the tumours were assessed using method 1 and method 2 due to early recognition that these strategies were unreliable and unlikely to yield positive results.
The time between pre-operative imaging and resection was also not standardised which could potentially allow for unrecorded ongoing changes of tumour histology between the last radiological assessment and histological assessment. This was addressed in part by the repeat assessment of data after exclusion on patients with a waiting time >21 days.
Finally, the assumption that the tumours were elliptical in shape was made to facilitate the calculation of tumour volume. In reality, tumours are often irregular shape and unlikely to ever be symmetrical. This may have contributed to the weakening of the correlation between histological and radiological findings.
CONCLUSIONS AND RECOMMENDATIONS
The correlation between the changes seen in tumours on pre-operative radiological assessment and histologically identified necrosis is very weak.
Apparently unresponsive tumours may represent favourable histological types of tumour, while others which seem to have become mostly necrotic on imaging may represent high-grade tumours.
Care should be taken to avoid assumptions about the response to chemotherapy preoperatively before histological assessment can be undertaken as this does not relate to risk stratification and may be misleading to treating physicians and surgeons.
Apart from ultrasound assessment, post-chemotherapy pre-operative imaging of the nephroblastoma itself is interesting but of little clinical importance at this time.
Further research is needed to explore the use of DWI in MRI and other novel techniques such as nuclear medicine studies. The use of contrasted imaging to estimate necrosis is a further potential area of development.
Financial support and sponsorship
Nil.
Conflicts of interest
There are no conflicts of interest.
REFERENCES
- 1.Vujanić GM, Sandstedt B. The pathology of Wilms' tumour (nephroblastoma): The International Society of Paediatric Oncology approach. J Clin Pathol. 2010;63:102–9. doi: 10.1136/jcp.2009.064600. [DOI] [PubMed] [Google Scholar]
- 2.Sandstedt B, Harms D, Yujanic GM. The International Society of Paediatric Oncology. Pathology Protocol. [[Last accessed on 2020 Oct 22]]. Available from: https://www.semanticscholar.org/paper/THE-REVISED-S.I.O.P.-WORKINGCLASSIFICATION-OF-OF/874f25d9947bd37ca234d7ed634b754805d1201b#paper-header .
- 3.Brisse HJ, Smets AM, Kaste SC, Owens CM. Imaging in unilateral Wilms tumour. Pediatr Radiol. 2008;38:18–29. doi: 10.1007/s00247-007-0677-9. [DOI] [PubMed] [Google Scholar]
- 4.Olsen ØE. Why measure tumours? Pediatr Radiol. 2015;45:35–41. doi: 10.1007/s00247-014-3148-0. [DOI] [PMC free article] [PubMed] [Google Scholar]
- 5.Refaie HD, Sarhan M, Hafez A. Role of CT in assessment of unresectable Wilms' tumor response after preoperative chemotherapy in pediatrics. ScientificWorldJournal. 2008;8:661–9. doi: 10.1100/tsw.2008.96. [DOI] [PMC free article] [PubMed] [Google Scholar]
- 6.McHugh K, Pritchard J. Problems in the imaging of three common paediatric solid tumours. Eur J Radiol. 2001;37:72–8. doi: 10.1016/s0720-048x(00)00289-8. [DOI] [PubMed] [Google Scholar]
- 7.Begent J, Sebire NJ, Levitt G, Brock P, Jones KP, Ell P, et al. Pilot study of F (18)-fluorodeoxyglucose positron emission tomography/computerised tomography in Wilms' tumour: Correlation with conventional imaging, pathology and immunohistochemistry. Eur J Cancer. 2011;47:389–96. doi: 10.1016/j.ejca.2010.09.039. [DOI] [PubMed] [Google Scholar]
- 8.Gawande RS, Gonzalez G, Messing S, Khurana A, Daldrup-Link HE. Role of diffusion-weighted imaging in differentiating benign and malignant pediatric abdominal tumors. Pediatr Radiol. 2013;43:836–45. doi: 10.1007/s00247-013-2626-0. [DOI] [PubMed] [Google Scholar]
- 9.Humphries PD, Sebire NJ, Siegel MJ, Olsen ØE. Tumors in pediatric patients at diffusion-weighted MR imaging: apparent diffusion coefficient and tumor cellularity. Radiology. 2007;245:848–54. doi: 10.1148/radiol.2452061535. [DOI] [PubMed] [Google Scholar]
- 10.Hales PW, Olsen ØE, Sebire NJ, Pritchard-Jones K, Clark CA. A multi-Gaussian model for apparent diffusion coefficient histogram analysis of Wilms' tumour subtype and response to chemotherapy. NMR Biomed. 2015;28:948–57. doi: 10.1002/nbm.3337. [DOI] [PubMed] [Google Scholar]
- 11.Littooij AS, Sebire NJ, Olsen ØE. Whole-tumor apparent diffusion coefficient measurements in nephroblastoma: Can it identify blastemal predominance? J Magn Reson Imaging. 2017;45:1316–24. doi: 10.1002/jmri.25506. [DOI] [PubMed] [Google Scholar]
- 12.Littooij AS, Nikkels PG, Hulsbergen-van de Kaa CA, van de Ven CP, van den Heuvel-Eibrink MM, Olsen ØE. Apparent diffusion coefficient as it relates to histopathology findings in post-chemotherapy nephroblastoma: A feasibility study. Pediatr Radiol. 2017;47:1608–14. doi: 10.1007/s00247-017-3931-9. [DOI] [PMC free article] [PubMed] [Google Scholar]
- 13.Lubahn JD, Cost NG, Kwon J, Powell JA, Yang M, Granberg CF, et al. Correlation between preoperative staging computerized tomography and pathological findings after nodal sampling in children with Wilms tumor. J Urol. 2012;188:1500–4. doi: 10.1016/j.juro.2012.02.020. [DOI] [PubMed] [Google Scholar]
- 14.Kaste SC, McCarville MB. Imaging pediatric abdominal tumors. Semin Roentgenol. 2008;43:50–9. doi: 10.1053/j.ro.2007.08.007. [DOI] [PubMed] [Google Scholar]


