

SUMMARY
Although T cell expansion depends on glycolysis, T effector cell differentiation requires signaling via the production of reactive oxygen species (ROS). Because the pentose phosphate pathway (PPP) regulates ROS by generating nicotinamide adenine dinucleotide phosphate (NADPH), we examined how PPP blockade affects T cell differentiation and function. Here, we show that genetic ablation or pharmacologic inhibition of the PPP enzyme 6-phosphogluconate dehydrogenase (6PGD) in the oxidative PPP results in the generation of superior CD8+ T effector cells. These cells have gene signatures and immunogenic markers of effector phenotype and show potent anti-tumor functions both in vitro and in vivo. In these cells, metabolic reprogramming occurs along with increased mitochondrial ROS and activated antioxidation machinery to balance ROS production against oxidative damage. Our findings reveal a role of 6PGD as a checkpoint for T cell effector differentiation/survival and evidence for 6PGD as an attractive metabolic target to improve tumor immunotherapy.
In brief
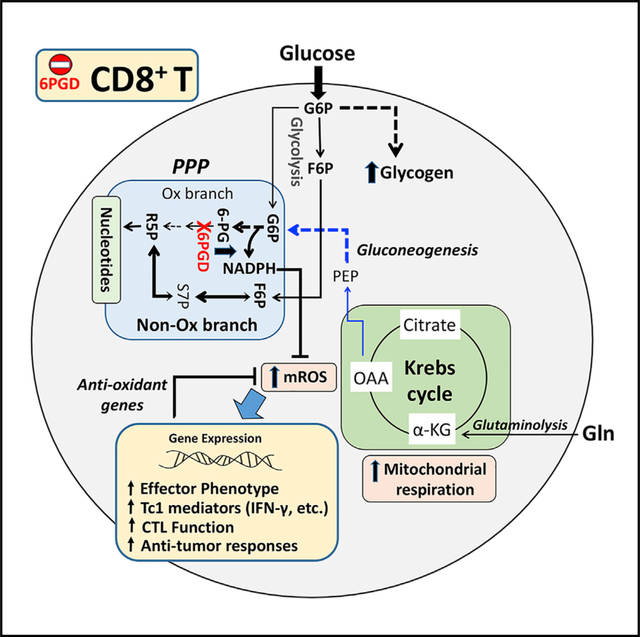
Daneshmandi et al. show that 6-phosphogluconate dehydrogenase (6PGD) in the oxidative pentose phosphate pathway (PPP) is a modulator of CD8+ T cell activation and differentiation. 6PGD blockade reprograms CD8+ T cell metabolism to support superior effector function with higher tumoricidal activity. This metabolic checkpoint represents a key therapeutic target for cancer immunotherapies.
Graphical Abstract
INTRODUCTION
Cellular metabolism has a key role in T cell differentiation (MacIver et al., 2013). Unlike other cell types, T lymphocytes have distinct bioenergetics requirements that are dependent on their differentiation and functional state. Quiescent naive T cells utilize various classes of nutrients including glucose, amino acids (aa), and fatty acids (FAs) and rely on oxidative phosphorylation (OXPHOS) as a primary means to meet their energy demands. After encountering antigen (Ag), differentiation into CD8+ T effector (TEFF) cells is characterized by the metabolic shift to glycolysis as the main source of energy with less contribution from OXPHOS (Macintyre et al., 2014; Pearce et al., 2013). This has led to the widely accepted concept that activated T cells are primarily glycolytic despite an ample supply of oxygen (aerobic glycolysis). During T cell activation, there is also an increase in the expression of the Slc7a5-Slc3a2 complex, which imports branched chain aa (BCAAs) that are involved in the activation of mTORC1 and metabolic reprogramming (Sinclair et al., 2013). T cell receptor (TCR) signaling also upregulates sodium-coupled neutral aa transporters SNAT1 (Slc1a5) and SNAT2 (Slc38a2) (Carr et al., 2010; Sinclair et al., 2013) that transport glutamine as well as the alanine, serine, and cysteine transporter ASCT2 (Nakaya et al., 2014) that can also transport glutamine and BCAAs. After completion of effector function, CD8+ T cells undergo contraction with concomitant differentiation into T memory (TM) cells, which rely on oxidation of fatty acids as a key metabolic mechanism for energy generation (O’Sullivan et al., 2014). The reciprocal engagement of nutrient utilization and T cell differentiation is supported by observations that inhibition of glycolysis during antigen encountering prevents CD8+ TEFF differentiation and leads to the generation of TM cells (Sukumar et al., 2013).
An unusual feature of TM cells’ enhanced mitochondrial function is the substantial spare respiratory capacity (SRC). SRC is the extra mitochondrial capacity available in a cell to produce energy under conditions of increased work or stress and is thought to be important for long-term cellular survival and function (van der Windt et al., 2012). Although the role of mitochondria has mostly been studied in TM cells, mitochondrial function and production of mitochondrial reactive oxygen species (mROS) are also critical for TEFF cell activation and differentiation (Patsoukis et al., 2016). It is well established that T cell activation requires mROS and scavenging ROS results in blockade of T cell responses (Sena et al., 2013). Although mitochondrial function increases during T cell activation, SRC significantly decreases in activated T cells, a feature potentially related to mitochondrial fission during cell division (Buck et al., 2016).
ROS scavenging relies heavily of nicotinamide adenine dinucleotide phosphate (NADPH) production to regenerate glutathione (GSH) from oxidized GSH (GSSG). As a major producer of NADPH, the pentose phosphate pathway (PPP) plays an important role in a cell’s antioxidant machinery. PPP, also known as hexose monophosphate shunt or phosphogluconate pathway, consists of two branches: (1) the largely irreversible oxidative arm, which generates NADPH and ribulose-5-phosphate (Ru5P); and (2) the reversible non-oxidative branch that produces glyceraldehyde-3-phosphate (G3P), fructose-6-phosphate (F6P), xylulose-5-phosphate (Xyl5P), and ribose-5-phosphate (Rib5P) (Figure S1). Among the key products of oxidative PPP, NADPH is not only required for GSH regeneration but also for support of reductive biosynthesis reactions, such as FA and cholesterol biosynthesis, whereas Ru5P provides the backbone for nucleotide synthesis (Grant, 2008; Kardon et al., 2008; Kruger and von Schaewen, 2003; Pollak et al., 2007). The products of non-oxidative PPP, Rib5P and Xyl5P, are substrates for ribonucleotide biosynthesis; F6P can be converted to glucose-6-phosphate (G6P) to fuel both glycolysis and oxidative PPP; and G3P can be used in glycolysis (Stincone et al., 2015).
Although previous studies have investigated how glycolysis drives the generation of CD8+ TEFF versus TM cells (Sukumar et al., 2013) and shown that defective glycolysis results in impaired TEFF function (Chang et al., 2013; Peng et al., 2016), it remains poorly understood how divergence of glucose utilization between glycolysis and PPP affects CD8+ T cell differentiation. To investigate this, we generated mice with flox targeted allele for the 6PGD gene, whose protein product catalyzes the conversion of 6-phosphogluconate (6PG) to Rib5P in the second step of the PPP (Figure S1). The 6PGDfl/fl mice were crossed with mice expressing Cre recombinase under the control of the CD4 promoter to delete 6PG dehydrogenase (6PGD) in CD4+ and CD8+ T cells. After stimulation in vitro, 6PDG-deficient CD8+ T cells had enhanced glucose uptake and elevated glycogen content as a consequence of impaired glucose metabolism in PPP. They also exhibited enhanced mitochondrial fission, a higher number of mitochondria per cell, increased mitochondrial metabolism/ROS production, and a higher abundance of GSH, GSH peroxidases, peroxiredoxin, and thioredoxin (Txn1) that protect cells against oxidative damage. These metabolic changes were related to enhanced differentiation into TEFF memory (TEM) cells with elevated expression of granzyme B and interferon (IFN)-γ and potent effector function against Listeria monocytogenes (Lm) and tumors. These immunological, metabolic, and functional effects were induced not only by genetic ablation but also by pharmacologic inhibition of 6PGD ex vivo in CD8+ T cells. Our findings reveal a previously unidentified role of 6PGD blockade in inducing differentiation of TEFF cells via mROS production and its balance control by enhanced antioxidation capacity.
RESULTS
6PGD deficiency induces an activated T cell phenotype
To investigate whether targeting PPP would affect the T cell function, we inactivated the PPP enzymes G6PD or 6PGD by using the G6PD inhibitor dehydroepiandrosterone (DHEA) and the 6PGD inhibitor 6-aminonicotinamide (6-AN), a niacin analog (Davis and Kauffman, 1987). CD8+ T cells stimulated by αCD28 + αCD3 monoclonal antibodies (mAbs) in the presence of 6-AN, but not with DHEA, were highly activated as assessed by intracellular IFN-γ expression (Figure 1A). DHEA-treated cells also showed significantly lower viability (Figure 1B). Based on these data, we generated mice with flox targeted 6PGD allele (Figures S2A–S2C) and crossed them with mice expressing Cre recombinase under the control of CD4 promoter to generate 6PGDfl/fl/CD4-Cre (hereafter named 6PGD−/−) to specifically delete 6PGD in T cells (Figures S2D–S2F). Using 6PGDfl/fl and 6PGD−/− mice, we examined CD4+ and CD8+ T cells in the thymus, lymph nodes, and spleen. Although thymic differentiation was comparable (Figures 1C and 1D), the frequency of CD4+ and CD8+ T cells in the lymph nodes and spleen of 6PGD−/− mice was reduced compared with that of littermate 6PGDfl/fl mice (Figures 1E and 1F). Besides reduced percentage, 6PGD−/− mice had decreased absolute numbers of CD4+ and CD8+ T cells in secondary lymphoid organs (Figures 1G and 1H). CD4+ and CD8+ T cells in the spleen of 6PGD−/− mice demonstrated an altered immune phenotype, characterized by elevated CD44high/CD62Llow, KLRG1high/CD127low (interleukin 7 receptor alpha [IL-7Rα]) subsets and increased expression of CD69 activation marker (Figures 1I–1K). Similar changes were observed in lymph node T cells (Figure S3).
Figure 1. Blocking 6PGD induces an effector T cell phenotype.

(A and B) CD8+ T cells were isolated from C57BL/6 mice and were stimulated for 4 days with αCD3 + αCD28 mAbs and IL-2 in the presence of either 6-aminonicotinamide (6-AN) (10 μM), DHEA (20 μM), or vehicle control (DMSO) (A). IFN-γ expression was assessed by intracellular staining and flow cytometry, and (B) viability was calculated as percentage of total. The plot shown is representative of three independent experiments with n = 4 per experiment.
(C and D) Thymic T cells were collected from 6PGD−/− and 6PGDfl/fl mice, and fractions of CD4+ and CD8+ T cells as well as expression of CD44 and CD25 on gated double-negative (DN) T cells were assessed by flow cytometry. Results are representative of three independent experiments.
(E and F) Percentage of CD4+ and CD8+ T cells in spleen (E) and lymph nodes (F) of 6PGD−/− and 6PGDfl/fl mice was examined by flow cytometry.
(G and H) Absolute numbers of CD4+ (G) and CD8+ (H) T cells in thymus, lymph nodes, and spleen of 6PGD−/− and 6PGDfl/fl mice were calculated from three replicates.
(I–K) Splenocytes from 6PGD−/− and 6PGDfl/fl mice were analyzed for expression of CD44 and CD62L (I), KLRG1 and CD127 (J), and CD69 (K) by flow cytometry. Results are representative of five independent experiments with n = 4 mice per group. Error bars represent ± SEM. *p < 0.05; **p < 0.01; ***p < 0.001.
6PGD−/− CD8+ T cells have a molecular signature of TEFF
To further investigate the ability of 6PGD−/− CD8+ T cells to respond to activation, we examined their molecular profile after in vitro stimulation with αCD3 + αCD28 mAbs by RNA-sequencing analysis. 6PGD−/− CD8+ T cells were enriched in genes encoding for factors known to identify TEFF cells, including GZM family members, Ifng, Ccr5, Ccr2, Il17a, Tbx21 (encoding T-bet), Zeb2, Klrg1, and Stat3. By contrast, transcripts encoding key regulators of memory differentiation such as Tcf7 and Klf2 were downregulated (Figure 2A). The changes of key genes’ expression were confirmed by qPCR and flow cytometry and were clearly apparent after naive CD8+ T cell stimulation in vitro (Figures 2B–2L). Thus, despite their activated baseline state (Figures 1I–1K), naive 6PGD−/− T cells responded robustly to αCD3 + αCD28-mediated stimulation in vitro and exhibited enhanced expression of molecular hallmarks associated with TEFF cells. It should be noted that during in vitro culture, suboptimal concentrations of αCD3 + αCD28 mAbs were used (0.5 μg/mL of each soluble antibody) to allow detection of the enhanced responses of 6PGD−/− compared with 6PGDfl/fl CD8+ T cells.
Figure 2. 6PGD−/− CD8+ T cells display a TEFF phenotype.

(A) CD8+ T cells were isolated from spleen of 6PGD−/− and 6PGDfl/fl mice and stimulated for 48 h with αCD3 + αCD28 mAbs, followed by RNA extraction and RNA-sequencing analysis. Heatmap of gene expression for 6PGD−/− versus 6PGDfl/fl CD8+ T cells is shown.
(B) For confirmation, naive (CD62Lhigh CD44low) CD8+ T cells were isolated and stimulated for 4 days with αCD3 + αCD28 mAbs and IL-2 (20 IU/mL). Expression of representative genes was confirmed by real-time PCR on day 0 and day 4.
(C–M) Naive CD8+ T cells were stimulated for 4 days with αCD3 + αCD28 mAbs and IL-2 (20 IU/mL) followed by assessment of IFN-γ expression by intracellular staining (C) and quantification of IFN-γ production by ELISA (D). Expression of granzyme B (E–F), T-bet (G and H), Fas (CD98) (I and J), FasL (CD178) (K and L), and CD69 (M) was assessed by flow cytometry. Results are representative of three independent experiments with n = 6 mice per group. Error bars represent ± SEM. ***p < 0.001; ****p < 0.0001.
6PGD−/− CD8+ T cells generate potent pathogen-specific and tumor-specific immune responses in vivo
To determine whether 6PGD-deficient CD8+ T cells display altered effector responses in vivo, we examined antigen-specific stimulation during infection with Lm expressing ovalbumin (Lm-Ova) (Bose et al., 2013; Pope et al., 2001). We generated 6PGD−/− mice carrying the OTI transgenic TCR by crossing 6PGD−/− mice with OTI TCR transgenic mice and performed adoptive transfer of T cells from OTI/6PGD−/− and OTI/6PGDfl/fl control mice to syngeneic recipients followed by inoculation of Lm-Ova. Recipients of OTI/6PGD−/− T cells were able to clear the Lm-Ova infection more effectively than control mice (Figure 3A). Moreover, OTI/6PGD−/− antigen-specific T cells produced higher levels of IFN-γ than OTI/6PGDfl/fl control T cells after in vivo stimulation with antigen (Figure 3B).
Figure 3. 6PGD−/− CD8+ T cells have enhanced cytolytic function in vitro and potent pathogen-specific and tumor-specific activity in vivo.

(A and B) Freshly isolated CD8+ T cells from OTI/6PGDfl/fl and OTI/6PGD−/− mice were adoptively transferred to wild-type mice followed by inoculation of Lm-Ova 24 h later. On day 3 after inoculation, bacterial burden was assessed in the spleen (A) and IFN-γ production (B) was evaluated by flow cytometry on tetramer-positive cells.
(C) CD8+ T cells from OTI/6PGDfl/fl and OTI/6PGD−/− mice were cultured with αCD3 + αCD28 mAbs and IL-2 (20 IU/mL) for 4 days. CTL activity was assessed as described in the STAR methods. Results are representative of three independent experiments with n = 7 mice per group.
(D and E) CD8+ T cells from OTI/6PGDfl/fl and OTI/6PGD−/− mice were adoptively transferred to mice bearing EG7 lymphoma as indicated in the schema (D). Tumor size was measured every 48 h, and tumor volume was calculated (E). Results are representative of two independent experiments with n = 10 mice per group.
(F–I) On day 10 after adoptive transfer, fractions of tumor-specific, tetramer-positive T cells in tumor-infiltrating lymphocytes (TILs) were assessed by tetramer staining (F), and expression of granzyme B (G) and mitochondrial mass (H and I) in tetramer-positive, tumor-specific T cells was assessed by flow cytometry. Results are representative of two independent experiments with n = 7–8 mice per group. Error bars represent ± SEM. *p < 0.05; **p < 0.01.
Based on these findings, we examined whether 6PGD−/− CD8+ T cells had superior effector function against tumors. First, we assessed whether OTI/6PGD−/− T cells had altered cytotoxic activity against the Ova-expressing murine thymoma cell line EG7. Compared with CD8+ T cells isolated from OTI/6PGDfl/fl mice, CD8+ T cells from OTI/6PGD−/− mice showed higher cytotoxic function when co-cultured with EG7 tumor cells in vitro (Figure 3C). To test anti-tumor activity in vivo, we implanted EG7 tumor cells in congenic (CD45.1+) mice followed by adoptive transfer of CD8+ T cells from OTI/6PGD−/− and control OTI/6PGDf/f mice (Figure 3D). Recipients of OTI/6PGD−/− CD8+ T cells showed significantly smaller tumors than recipients of OTI/6PGDfl/fl T cells (Figure 3E), indicating that antigen-specific 6PGD−/− T cells had more potent anti-tumor effector function. Analysis of tumor-infiltrating lymphocytes (TILs) demonstrated that EG7 tumors from OTI/6PGD−/− CD8+ T cell recipients had higher fractions of antigen-specific T cells as determined by tetramer staining (Figure 3F), which also expressed higher levels of granzyme B (Figure 3G) and had increased mitochondrial mass (Figures 3H and 3I).
To examine whether the superior anti-tumor function of 6PGD−/− T cells was observed in other tumors, we used the pmel TCR transgenic mouse strain, which expresses a TCR that recognizes the mouse melanoma antigen gp100 (Overwijk et al., 2003), to generate pmel/6PGD−/− mice. We adoptively transferred pmel/6PGD−/− or pmel/6PGDfl/fl CD8+ T cells to congenic recipients bearing the B16-F10 melanoma that expresses gp100, and tumor growth was monitored (Figure S4A). Recipients of pmel/6PGD−/− T cells had significantly smaller tumor growth than recipients of pmel/6PGDfl/fl T cells (Figure S4B).
Pharmacologic inhibition of 6PGD recapitulates the properties of 6PGD−/− T cells
Because our initial observation was that the 6PGD inhibitor 6-AN enhanced IFN-γ production in activated CD8+ T cells (Figure 1A), we investigated whether 6-AN treatment might also recapitulate other immunophenotypic and functional properties identified in CD8+ T cells from 6PGD−/− mice. First, we tested the effects of 6-AN on the activation and function of wild-type CD8+ T cells in vitro. Treatment of naive (CD44lowCD62Lhigh) CD8+ T cells with 6-AN during stimulation resulted in significant enhancement of TEFF phenotype (CD44highCD62Llow) (Figure 4A) and higher level of CD69 (Figure 4B). Compared with vehicle-control-treated T cells, 6-AN-treated T cells also had higher expression of IFN-γ (Figures 4C and 4D), granzyme B (Figures 4E and 4F), T-bet (Figure S5A), and Fas/FasL (Figures S5B–S5D).
Figure 4. 6-AN, a small-molecule inhibitor of 6PGD, recapitulates the phenotype and function of 6PGD−/− T cells.

(A–F) Naive CD8+ T cells (CD3+CD8+CD44lowCD62Lhigh) were isolated from spleens of 6PGDfl/fl mice and were stimulated in vitro with αCD3 + αCD28 mAbs and IL-2 (20 IU/mL) in the presence of DMSO or 6-AN (10 μM) for 4 days. Expression of CD44 and CD62L (A) and CD69 (B) was assessed by flow cytometry. IFN-γ production was assessed by flow cytometry (C) and ELISA (D). Expression of granzyme B was assessed by flow cytometry (E and F).
(G) CTL activity was assessed as described in STAR methods. Results are representative of three independent experiments with n = 4 per experiment.
(H–L) CD8+ T cells were isolated from OTI/6PGDfl/fl mice and were stimulated in vitro with αCD3 + αCD28 mAbs and IL-2 (20 U/mL) for 4 days in the presence of 6-AN or DMSO followed by adoptive transfer to congenic (CD45.1+) mice bearing EG7 lymphoma tumor, as indicated in the schema (H). Tumor growth was evaluated every 2 days, and tumor volume was calculated (I). Results are representative of two independent experiments with n = 12 mice per group. The fraction of OTI+ CTLs (CD45.2+) in TILs (J) (p < 0.05) and their capacity to produce IFN-γ in the tumor microenvironment after treatment with 6-AN or DMSO (K) were assessed by flow cytometry (p < 0.05). No difference in IFN-γ production by CD45.2− host CD8+ TILs was observed between recipients of 6-AN-treated and DMSO-treated CD45.2+ antigen-specific CD8+ T cells (p > 0.05) (L). Error bars represent ± SEM. **p < 0.01; ***p < 0.001.
To examine whether pharmacologic inhibition of 6PGD might recapitulate the anti-tumor function of 6PGD−/− CD8+ T cells, we assessed the cytotoxic function of 6-AN-treated and vehicle-control-treated OTI/6PGDfl/fl CD8+ T cells against EG7 tumor cells in vitro. 6-AN treatment resulted in elevated cytolytic function of OTI/6PGDfl/fl CD8+ T cells (Figure 4G), similarly to what was observed in OTI/6PGD−/− CD8+ T cells (Figure 3C). To examine whether the enhanced anti-tumor cytolytic function induced by 6-AN treatment occurs in vivo, we pretreated 6PGDfl/fl/OTI-CD8+ cells with 6-AN or vehicle control during in vitro culture in the presence of αCD3 + αCD28 mAbs and IL-2 for 4 days and adoptively transferred these T cells to mice bearing EG7 tumors (Figure 4H). Recipients of OTI/6PGDfl/fl CD8+ T cells pretreated with 6-AN had significantly lower tumor burden than DMSO-treated OTI/6PGDfl/fl CD8+ T cells (Figure 4I). Analysis of TILs showed higher frequency of antigen-specific OTI/6PGDfl/fl CD8+ T cells in tumor-bearing recipients of 6-ANtreated OTI/6PGDfl/fl T cells than recipients of DMSO-treated OTI/6PGDfl/fl T cells (Figure 4J) (p < 0.05), with enhanced IFN-γ expression (Figures 4K and 4L) (p < 0.05). Similar results were observed when pmel/6PGDfl/fl CD8+ T cells were pretreated with 6-AN versus vehicle control during in vitro stimulation followed by adoptive transfer to mice bearing B16-F10 melanoma tumors (Figures S4C, S4D, and S6A–S6C). Thus, pharmacologic inhibition of 6PGD recapitulates the effects of 6PGD genetic ablation in activated mouse and human T cells.
Deficiency in 6PGD−/− cells reprograms metabolic circuits
Glucose uptake in CD8+ T cells is mediated by the glucose-transporter 1 (Glut1). TCR-mediated signaling and CD28 engagement promote the upregulation of Glut1 via AKT-dependent and independent pathways (Frauwirth et al., 2002; Jacobs et al., 2008). Relative to 6PGDfl/fl CD8+ T cells, 6PGD−/− CD8+ T cells showed higher expression of Glut1 on their surface and enhanced glucose uptake capacity measured by 2-deoxy-2-[(7-nitro-2,1,3-benzoxadiazol-4-yl)amino]-D-glucose (2-NBDG) fluorescence (Figures S6D–S6G) via flow cytometry. This enhanced glucose uptake capacity could be critical to the functioning of CD8+ T cells in low-glucose conditions, such as the tumor microenvironment. It is shown that competition for glucose can determine the outcome of tumor immune response (Chang et al., 2015). To test this, pmel/6PGDfl/fl and 6PGD−/− CD8+ T cells were co-cultured for 20 h with B16-F10 melanoma cells in 1:1 ratio and then exposed to 2-NBDG. 6PGD−/− CD8+ T cells were able to take up glucose more effectively in co-culture conditions than pmel/6PGDfl/fl CD8+ T cells (Figures S6H and S6I).
Other than glucose, glutamine is also a main fuel source for T cells via metabolism into glutamate and then alpha-ketoglutarate (αKG). This serves as an anaplerotic input into the Krebs cycle to fuel mitochondrial energy production (Carr et al., 2010) and anabolic metabolism.
To simultaneously track the consequence of 6PGD blockade on glucose and glutamine metabolism, we stimulated naive 6PGD−/− and 6PGDfl/fl CD8+ T cells in the presence of D7-glucose and 13C5 15N2-glutamine. The ion chromatography-ultrahigh resolution mass spectrometry (IC-UHRMS) method used clearly resolved 13C, 15N, and 2H (D) in given metabolites as illustrated for a set of 4 ATP isotopologes seen in the double tracer experiments (Figure S7). Although all four isotopologes had the same nominal mass (+3 higher than the unlabeled species), they were well resolved in the UHRMS spectra. Also shown is the higher relative abundance of the 13C3 species in 6PGD−/− (Figure S7A) than 6PGDfl/fl CD8+ T cells (Figure S7B). Such good resolution together with the reproducible retention time and highly accurate mass determination for given metabolites afforded robust assignment of single and mixed labeled metabolites shown in Figures S8–S12.
Transformations of the two tracers into PPP (Figures 5A and S8), glycolysis, the Krebs cycle (Figure S9), and pyrimidine (Figure S10A) and purine (Figure S10B) nucleotides pathways were determine by stable isotope-resolved metabolomics (SIRM) analysis. In a separate experiment, CD8+ T cells were labeled with 13C6-glucose (13C6-Glc) and transformation into PPP (Figure S11) and the glycogen pathway (Figures 5B and 5C) was determined by IC-UHRMS and nuclear magnetic resonance (NMR) spectroscopy. Shown in Figures 5A and S8–S10 are the responses of unlabeled metabolites (0), D incorporation from glucose (D* = sum of D1 to Dx), 13C incorporation from glutamine (C* = sum of 13C1 to 13Cx), 15N incorporation from glutamine (N* = sum of 15N1 to 15Nx), or incorporation of 13C from glutamine metabolism alone and co-metabolism of glucose and glutamine (C*Dx or C*NxDx). For each metabolite, fractional enrichment (the fraction of a metabolite pool that is enriched with given isotopic label[s]) and/or the amount in μmol/g protein is shown.
Figure 5. 6PGD−/− ablation results in enhanced non-oxidative PPP and accumulation of glycogen.

(A–C) Naive CD8+ T cells (CD3+CD8+CD44lowCD62Lhigh) were isolated from 6PGD−/− and 6PGDfl/fl mice and stimulated with αCD3 + αCD28 mAbs and IL-2 (20 IU/mL) in the presence of D7-glucose plus 13C5, 15N2-glutamine in (A) or 13C6-glucose in (B) and (C). Isotope-labeling patterns of metabolites of cell extracts were analyzed by IC-UHRMS as fractional enrichment (A and C) or 1H NMR (B). (A) Shows the conversion of D7-glucose and 13C5, 15N2-glutamine into the metabolites of PPP and gluconeogenesis (GNG) via the Krebs cycle. (B and C) Tracks 13C6-glucose incorporation, respectively, into glycogen as well as glucose-1-phosphate (G1P) and UDP-glucose (UDPG) as intermediates of glycogen biosynthesis.
(D) Accumulation of dark glycogen particles was evident in electron microscopy (EM) analysis of naive 6PGD−/− CD8+ T cells compared with 6PGDfl/fl after 4 days of stimulation. Measurements of scale bars are given in the figures.
(E) Schematic diagram indicating the site of GPI action.
(F) Accumulation of glycogen in 6PGD−/− Cd8+ T cells after 48 h of culture evaluated in colorimetric method.
(G) 6PGDfl/fl CD8+ T cells were stimulated for 48 h with αCD3 + αCD28 mAbs in the presence of either 6-AN, 6-AN + glycogen phosphorylase inhibitor (GPI), or DMSO and then glycogen content was assessed via colorimetric method. Results were generated from two independent experiments. Legend in x axis: 0 = unlabeled; Dx = sum of D1 to Dx or Glc-derived species; C*Dx = sum of 13C-labeled species with 0-x number of D; N*Dx = sum of 15N-labeled species with 0-x number of D; C3NxDx = sum of 13C3 with 0-x number of D and 15N, which could reflect incorporation of GNG product into the ribose unit of NADPH (cf. atom tracing diagram Figure S9). C*NxDx = sum of 13C-labeled species with 0-x number of 15N and D. G6P, glucose-6-phosphate; 6PG, 6-phosphogluconate; R5P, ribose-5-phosphate; S7P, sedoheptulose-7-phosphate; Gly3P, glyceraldehyde-3-phosphate; X5P, xylulose-5-phosphate; E4P, erythrose-4-phosphate; F6P, fructose-6-phosphate; OAA, oxaloacetate; PEP, phosphoenolpyruvate; TK, transketolase; TA, transaldolase. Error bars represent ± SEM. **p < 0.01; ***p < 0.001.
Glucose/glutamine metabolic reprogramming through PPP and gluconeogenesis (GNG) in 6PGD−/− CD8+ T cells
Glucose taken up is converted to G6P, which can be metabolized via the two branches (oxidative and non-oxidative) of PPP. In the oxidative branch, G6P is irreversibly oxidized to Ru5P via 6-phosphogluconolactone (6PGL) and 6PG with NADPH production. Subsequent reversible reactions involving R5P/Xyl5P and/or F6P/glyceraldehyde-3-phosphate (gly-3P) (also products of glycolysis) constitute the non-oxidative branch (Figure S1). We found a large buildup of deuterated 6PG (Figure S8B) with no change in the fractional enrichment (Figure 5A–b) upon 6PGD blockade, but the 6PGD product R5P also accumulated (D*, Figure S8C) without decrease in the fractional enrichment (Figure S8C). These data indicated profound inhibition of the oxidative PPP, but activation of the non-oxidative branch in 6PGD−/− CD8+ T cells, to counteract the loss of 6PGD (Figure S1). The enhancement in non-oxidative branch is consistent with the buildup of D-labeled sedoheptulose-7-phosphate (S7P), erythrose-4-phosphate (E4P), and F6P (D*, Figures S8D–S8F) without a decrease in the fractional enrichment (Figures 5A–d,e,f). Notably, studies in cancer cells have shown that the non-oxidative PPP accounts for a major portion of the de novo ribose synthesis (Boros et al., 1997). In addition, the key enzymes in the non-oxidative PPP, transaldolase (TA) and transketolase (TK), are highly overexpressed in rapidly proliferating cells such as cancer cells to fulfill the need for ribonucleotide synthesis (Boros et al., 1998).
In addition, the level and fractional enrichment of the other 6PGD product, NADPH, were not attenuated (Figures 5A–h and S8H) in 6PGD-deficient CD8+ T cells. NADPH cannot be produced by the non-oxidative PPP, which points to the compensation by other NADPH-producing reactions such as G6PD, NADP+-dependent isocitrate dehydrogenase (IDH), and malic enzyme (ME) (Lee et al., 2002; Ratledge, 2014). In the case of G6PD, the buildup of D- and 13C-labeled 6PG (Figures 5A–b and S8B) is indicative of significant G6PD activity. NADPH, in turn, maintains the levels of GSH in the cell. The slightly enhanced GSH synthesis in 6PDG−/− CD8+ T cells (Figures S9A and S9B–i) is consistent with the continued supply of NADPH despite the block at 6PGD.
To confirm the activation of non-oxidative PPP seen in the double tracer study, we performed single tracer studies using 13C6-glucose (Figure S11) on unsorted CD8+ T cells isolated from 6PGD−/− versus 6PGDfl/fl mice. This experiment showed increased buildup of 13C scrambled products of R5P, S7P, E4P, and F6P in response to 6PGD deficiency (1–4, 5, or 7, Figure S11). These products are derived from non-oxidative PPP, thereby validating the activation of this pathway deduced from the double tracer study (Figure S8).
Glutamine is not a substrate for the PPP unless it is transformed in the gluconeogenic pathway to produce Gly3P, G6P, and F6P. Previous studies reported enhanced GNG in T cells upon activation (Ho et al., 2015; Ma et al., 2018). The enhanced buildup of 13C-labeled 6PG (C*Dx, Figures 5A–b and S8B) in 6PGD−/− versus 6PGDfl/fl CD8+ T cells suggests that glutamine-derived G6P preferentially enters the oxidative PPP to fuel NADPH production via G6PD. Consistent with this was the observations of reduced flow of glutamine-derived carbons through the non-oxidative PPP as evidenced by the lower level and fractional enrichment of 13C in R5P and E4P in 6PGD−/− versus 6PGDfl/fl CD8+ T cells (Figures 5A–c,e and S8C and S8E).
In another set of experiments, naive 6PGDfl/fl CD8+ T cells were stimulated for 4 days and treated with 6-AN or vehicle DMSO in the presence of D7-glucose and 13C5 15N2-glutamine. Similar response patterns that indicate inhibition of 6PGD and activation of the non-oxidative PPP were seen in 6-AN-treated cells (Figure S12). In addition, a significant buildup of D- and 13C-labeled G6P was observed in 6-AN-treated cells, which was not evident in 6PGDfl/fl cells. This points to inhibition of G6PD in addition to the block in 6PGD activity by 6-AN. Moreover, 6-AN appeared to further enhance the flow of glutaminecarbon to the non-oxidative PPP, as evidenced by the buildup of 13C-labeled products of phosphoenolpyruvate (PEP), R5P, S7P, and E4P (C*Dx, Figures S12C–S12E and S12G).
Glycolysis, Krebs cycle, and glutaminolysis are not significantly altered in 6PGD−/− CD8+ T cells
After TCR activation, naive T cells switch from OXPHOS to glycolysis to meet the higher ATP demands. This enhanced glycolysis at early stages (minutes) after TCR engagement arises via suppression of pyruvate dehydrogenase kinase 1 (PDHK1) and inhibition of pyruvate import into the Krebs cycle and in later stages (hours) by CD28 and AKT signaling to increase glucose uptake and activity of glycolytic enzymes (Menk et al., 2018). In our study, prolonged stimulation of naive CD8+ T cells resulted in slightly enhanced glycolysis as evidenced by the non-statistically significant increase in the release of D-labeled lactate into the media in 6PGD−/− versus 6PGDfl/fl CD8+ T cells (Figure S13A). As for glutamine metabolism, we did not see significant changes in 13C-glutamine consumption, the release of the 13C-glutamic acid and 13C-lactate products into the media (Figure S13B) in response to 6PGD blockade.
Tracking the fate of the glutamine tracer into the Krebs cycle, we noted that glutamine was much preferred over glucose (C* versus D*) as the fuel source for the Krebs cycle via glutaminolysis catalyzed by glutaminase (GLS) in both activated T cell types (Figure S9). 6PGD blockade led to some depletion of 13C-αKG (Figure S9B–f) and 13C-malate (Figure S9B–h), but not citrate (Figure S9B–d), isocitrate (Figure S9B–e), and fumarate (Figure S9B–g). Such depletion did not lead to reduced 13C fractional enrichment in αKG or malate (Figure S9A). As indicated earlier, these response patterns of αKG and malate could be due to enhanced utilization (e.g., αKG as substrate for dioxygenases and malate as substrate for ME), rather than decreased synthesis, which will need to be confirmed by kinetic modeling. Sustained αKG production via IDH and enhanced ME reactions could contribute to the production of NADPH (Ratledge, 2014; Wise et al., 2011), as stated earlier.
To further verify the findings of the dual tracer studies, we performed single 13C5, 15N2-glutamine tracer experiment on unsorted CD8+ T cells isolated from 6PGDfl/fl and 6PGD−/− mice (Figures S13C and S13D). We saw a similar 13C-labeling patterns of the Krebs cycle products resulting from glutaminolysis plus the first cycle reactions, i.e., the dominance of 13C5-αKG as well as 13C4-fumarate, 13C4-malate, 13C4-citrate, and 13C4-isocitrate (Figures S13C and S13D) in the single as in the dual tracer experiments (Figure S9). Also consistent is the depletion of 13C5-αKG by 6PGD−/− cells seen in both single (Figure S13D) and dual tracer experiments (Figure S9B). Moreover, both tracer experiments showed at best a minor response to 6PGD blockade for pyruvate, lactate, and GSH (Figures S9B and S13D).
Nucleotide biosynthesis is sustained by glutamine metabolism in 6PGD−/− CD8+ T cells
PPP generates R5P, which is then converted to 5-phosphoribosyl-1-pyrophosphate (PRPP), before incorporation into pyrimidine and purine nucleotides (Lorkiewicz et al., 2012). Despite the 6PGD block, R5P synthesis from glucose via the non-oxidative PPP (D*, Figures 5A–c and S8C) was sustained to support PRPP synthesis (D*, Figures S10A–b,b’) in 6PDG−/− CD8+ T cells. A small but noticeable fraction of PRPP was also derived from glutamine, which was sustained in 6PDG−/− versus 6PDGfl/fl CD8+ T cells (C*Dx, Figure S10A–b). This response differed from that of R5P (C*Dx, Figure 5A–c), which showed depletion in response to 6PGD blockade. These data suggest enhanced utilization of glutamine-derived R5P for PRPP synthesis. Preferential incorporation of glutamine-derived products into pyrimidine (UTP/CTP [uridine triphosphate/cytidine triphosphate]) and purine nucleotide metabolites (ATP/guanosine triphosphate [GTP]/NADH/ADP-ribose [ADPR]) was much more pronounced in both cell types. This was evidenced by the high 13C enrichment in pyrimidine (C4–8NxDx, Figures S10A–c,d,c’,d’) and purine nucleotides (C3NxDx, Figures S10B–a to d, a’ to d’) that reflect 13C labeling of their ribose units. We did note some depletion of these mixed labeled species of ATP and GTP by 6PGD blockade, but the fractional enrichment (Figure S10B) was not altered. Altogether, despite the complete block of 6PGD, synthesis of R5P and PRPP from glucose and glutamine was maintained to sustain nucleotide synthesis.
Glycogen accumulates in 6PGD-deficient CD8+ T cells
6PDG−/− CD8+ T cells showed higher capacity for glucose uptake (Figure S6), but glucose utilization through glycolysis, PPP, or the Krebs cycle (Figures 5A, S8, and S9) did not corroborate with this enhanced uptake.
In the 13C6-glucose tracer experiment, the glycogen content was analyzed by 1H NMR (Figure 5B), which showed large accumulation of both unlabeled and 13C-glycogen in the 6PDG−/− compared with 6PGDfl/fl CD8+ T cells. This was accompanied by the buildup of 13C6-glucose-derived UDP-glucose (UDPG) (Figure 5C–d), which is the direct substrate for glycogen synthesis. These data suggest enhanced glycogen production induced by 6PGD deficiency. Glycogen buildup was also revealed by electron microscopy, which showed more dark particles in 6PGD−/− than 6PGDfl/fl CD8+ T cells 4 days after stimulation of naive cells with soluble αCD3 + αCD28 mAbs and IL-2 (Figure 5D). We further confirmed enhanced glycogen accumulation in 6PGD−/− CD8+ T cells by colorimetric method (Figure 5F). Thus, the excess glucose taken up by 6PDG−/− CD8+ T cells appeared to be diverted to glycogen synthesis. Moreover, stimulation of 6PGDfl/fl CD8+ T cells with 6-AN treatment also showed glycogen buildup, and further enhancement of this accumulation was induced by the addition of GPI (glycogen phosphorylase inhibitor) (Figure 5G). Interestingly, we observed increased levels and fractional enrichment of unlabeled glucose-1-phosphate (G1P) (Figures 5C–a,b), which might result from enhanced degradation of pre-existing glycogen induced by 6PGD deficiency. Two separate studies on CD8+ T cells (Ma et al., 2018) and macrophages (Ma et al., 2020) have shown that inhibition of 6PGD resulted in glycogen accumulation in the activated cells. In both cell types, accumulated glycogen was metabolized via the oxidative PPP to generate NADPH, which is required for cell survival by detoxifying ROS (Ma et al., 2018, 2020).
6PGD−/− CD8+ T cells demonstrate enhanced mitochondrial respiration
mROS is critical for TEFF cell activation and differentiation (Patsoukis et al., 2016; Sena et al., 2013), while scavenging mROS results in blockade of T cell responses (Sena et al., 2013). However, excess production of ROS can lead to oxidative damage and then apoptotic cell death (Kamiński et al., 2012a). Thus, we asked whether and how cellular ROS status is altered by 6PGD blockade. After stimulation, naive 6PGD−/− CD8+ T cells showed significantly higher ROS content than 6PGDfl/fl cells (Figures 6A–6C) in vitro. These cells also showed higher mROS production (Figure 7B). In addition, 6PGD−/− T cells showed elevated mitochondrial membrane potential (ΔΨm) compared with 6PGDfl/fl T cells (Figures 6D–6F), which could underlie elevated ROS production. Enhanced ΔΨm in 6PGD−/− CD8+ T cells was also evident in their co-cultures with B16-F10 melanoma cells in vitro (Figures S6J and S6K). These results are interesting in light of previous reports indicating loss of mitochondrial functions in tumor-infiltrating CD8+ T cells as determined by reduced mitochondrial mass and ΔΨm (Gemta et al., 2019; Scharping et al., 2016).
Figure 6. 6PGD−/− CD8+ T cells have enhanced mitochondrial respiration and mitochondrial structure consistent of TEFF cells.

(A–F) Splenic naive (CD62Lhigh CD44low) CD8+ T cells from 6PGD−/− and 6PGDfl/fl mice were isolated, stimulated with αCD3 + αCD28 mAbs and IL-2 (20 IU/mL) for 4 days, and production of reactive oxygen species (ROS) by H2DCFDA (A–C) as well as mitochondrial potential (ΔΨm) by tetra-methylrhodamine ester (TMRE) (D–F) was assessed by flow cytometry. Results are representative of three independent experiments with n = 4 per experiment. (G and H) 6PGD−/− and 6PGDfl/fl CD8+ T cells were analyzed by at day 0 (naive) and 4 days post stimulation by EM. Representative images of mitochondria ultrastructure (G) and mitochondria number per cell (H) are shown. For each cell type, n = 100 cells were assessed. Measurements of scale bars are given in the figures.
(I–O) Expression of fission proteins phospho-DRP1 [serine-616] (I and J) and phospho-MFF [serine-146] (K and L) was examined by flow cytometry. Expression of phospho-MFF [serine-146] and Opa1 was also analyzed by immunoblot (M) and quantified by densitometry (N and O). Results are representative of three independent experiments with n = 4 per experiment. Error bars represent ± SEM. *p < 0.05; **p < 0.01; ***p < 0.001.
Figure 7. 6PGD blockade induce mitochondrial ROS and expression of antioxidant enzymes.

(A) Naive CD8+ T cells from 6PGD−/− and 6PGDfl/fl mice were stimulated for 4 days with αCD3 + αCD28 mAbs and IL-2 (20 IU/mL), and expression of CD62L and CD44 was examined by flow cytometry.
(B–L) Naive CD8+ stimulated for 4 days with αCD3 + αCD28 mAbs and IL-2 (20 IU/mL), mitochondrial ROS was assessed using MitoSOX Red (B), and lipid peroxidation capacity was assessed using BODIPY 581/591 C11 (C) and flow cytometry. (D–L) The indicated enzymes of ROS metabolism pathway were assessed by real-time PCR (D–K), and their quantitative changes in 6PGDfl/fl and 6PGD−/− T cells during activation were also depicted by the heatmap (L). Results are representative of three independent experiments with n = 3 per experiment. Gsr, glutathione reductase; Gpx4, glutathione peroxidase 4; Nrf2, nuclear factor erythroid 2-related factor 2; Prdx2, peroxiredoxin 2; SOD2: superoxide dismutase 2; Txn1, thioredoxin 1; Txnrd1, thioredoxin reductase 1. Error bars represent ± SEM. *p < 0.05; **p < 0.01; ***p < 0.001; ****p < 0.0001.
Mitochondrial remodeling is a signature of T cell activation and differentiation states, which are regulated by nuclear-encoded GTPases (Nunnari and Suomalainen, 2012). Mitochondrial fission during TEFF activation is important for the effector function (Buck et al., 2016). This process is required for preparing the appropriate number of mitochondria to supply daughter cells during cell division. Conversely, during TM cell differentiation, mitochondria undergo fusion, forming elongated mitochondria to engage electron transport chain (ETC) activity as the key mechanism for energy generation in memory cells (Buck et al., 2016). We evaluated mitochondrial ultrastructure by electron microscopy before and after stimulation of naive 6PGD−/− and control 6PGDfl/fl CD8+ T cells for 4 days. The two cell types had comparable mitochondria numbers at baseline, which increased after stimulation (Figures 6G and 6H). Activated 6PGD−/− T cells had significantly higher mitochondria number per cell than activated 6PGDfl/fl control cells (Figures 6G and 6H and S14A), which is consistent with increased mitochondrial fission activity in response to 6PGD blockade. Moreover, in activated 6PGD−/− T cells, mitochondria had altered morphology with wider cristae and less tightly organized intermembrane space (Figure 6G, enlarged inset), a pattern identified in TEFF cells (Buck et al., 2016).
To further investigate mitochondrial remodeling in 6PGD−/− CD8+ T cells, we examined the mitochondrial fission proteins Dynamin-related protein 1 (Drp1) and Mitochondrial fission factor (MFF). Drp1 is a member of the nuclear-encoded GTPase superfamily and stimulates mitochondria fission in mammalian cells when phosphorylated at serine-616 (Hu et al., 2017; Knott et al., 2008). MFF is anchored within the outer mitochondrial membrane as part of the mitochondrial fission complex and serves as one of the multiple receptors for Drp1 (Liu and Chan, 2015). We observed higher levels of Drp1 phosphorylation at serine-616 (Figures 6I and 6J) and MFF phosphorylation at serine-146 in 6PGD−/− CD8+ T cells (Figures 6K–6N), providing biochemical evidence that mitochondria fission machinery was hyperactivated in these cells. By contrast, there were no apparent differences in the expression of Optic atrophy-1 (Opa1) (Figures 6M and 6O) that controls fusion of the outer and inner mitochondrial membranes (Knott et al., 2008; Song et al., 2007), a process that occurs during TM cell differentiation (Buck et al., 2016).
6PGD blockade enhances mROS and expression of antioxidant genes
Mitochondrial dynamics and ultrastructure are regulated by ROS production (Buck et al., 2016; Kim and Song, 2016), which is essential to T cell activation (Murphy and Siegel, 2013). Based on these, we evaluated the changes in mROS status and the ROS pathways enzymes elicited by 6PGD deficiency (Figure 7). Naive 6PGD−/− and 6PGDfl/fl CD8+ T cells were stimulated with αCD3 + αCD28 mAbs and IL-2 for 4 days, and activation status was checked by CD62L, CD44 (Figure 7A), and CD69 (Figure S14B) markers. Corresponding mROS was detected by MitoSOX Red (Figure 7B), and overall peroxidation capacity was evaluated by BODIPY 581/591 C11 fluorescence (Figure 7C). Expression of the antioxidant genes was also measured every 24 h by real-time PCR (Figures 7D–7L). 6PGD−/− and 6PGDfl/fl CD8+ T cells in the naive state showed the same capacity for mROS production, but upon activation, 6PGD−/− CD8+ T cells produced higher mROS, which plateaued at 48 h post activation (Figure 7B). Elevated level of lipid peroxidation was also noted for 6PGD−/− versus 6PGDfl/fl CD8+ T cells 24 h after stimulation (Figure 7C). These changes were accompanied by increased expression of enzymes for the ROS metabolism machinery in 6PGD−/− CD8+ T cells, commencing 24 h after stimulation (Figures 7D–7L). These included superoxide dismutase 2 (SOD2), catalase, GSH reductase (Gsr), GSH peroxidase 4 (Gpx4), Txn1, thioredoxin reductase 1 (Txnrd1), and peroxiredoxin 2 (Prdx2). The expression of many of these antioxidant enzymes is known to be regulated by nuclear factor erythroid 2-related factor 2 (Nrf2), which displayed similar time course changes in gene expression (Figure 7K) as its target genes. The time course changes in gene expression of these enzymes in 6PGD−/− versus 6PGDfl/fl CD8+ T cells is also presented as heatmap (Figure 7L).
The early and heightened capacity for mROS production and lipid peroxidation in 6PGD−/− versus 6PGDfl/fl CD8+ T cells was related to the observed faster and stronger development of TEFF phenotype after stimulation (Figures 7A–7C). However, ROS buildup to beyond tolerable levels causes cell damage and death (Finkel, 2012). Thus, homeostatic control of the ROS response is critical to T cell activation and survival. Elevated expression of Nrf2 and its antioxidant enzyme target genes coupled with continued NADPH supply can orchestrate a fine balance between ROS production and detoxification in 6PGD−/− CD8+ T cells. This is reflected in the maintenance of GSH (Figures S9A and S9B) and NADPH (Figures 5A–h and S8H), despite the overproduction of ROS (Figures 6A–6C, 7B, and 7C) in these cells. Altogether, these results suggest that while 6PGD blockade suppressed part of the oxidative PPP and enhanced mROS production, heightened activation of antioxidant enzymes coupled with the maintenance of NADPH supply could keep ROS at tolerable levels, which in turn signal (Finkel, 2012; Kesarwani et al., 2013) the development of a more robust effector phenotype. Further studies are required to determine whether the balanced regulation of ROS levels and signaling is the key and causative mechanism for the enhanced effector function of 6PGD−/− T cells.
DISCUSSION
Activation of naive T cells is associated with increased bioenergetic, biosynthetic, and redox demands. To fulfil these demands, TCR activation triggers signaling pathways that enhance uptake of nutrients, especially glucose and glutamine. Glucose is metabolized via glycolysis and/or PPP in the cytoplasm, and glutamine is mainly oxidized in the Krebs cycle in mitochondria. PPP produces ribose phosphate as precursor of nucleotide synthesis and fuels antioxidant machinery by producing NADPH; therefore, PPP is critical in both biosynthesis and redox pathways.
In this study, we discovered a unique and significant role of 6PGD in modulating CD8+ T cell function. We showed that targeting 6PGD in the oxidative PPP induced mROS that potentially can signal a more robust effector differentiation in CD8+ T cells. Despite the block, these cells preserved the capacity for nucleotide biosynthesis by activating the non-oxidative PPP to support growth while sustaining NADPH supply, possibly via the G6PD (the entry enzyme of the oxidative PPP), IDH, and ME activity to fuel the antioxidation machinery. The importance of G6PD in T cell survival was shown in our pilot studies in that blocking G6PD reduced viability in CD8+ T cells and did not induce T cell activation. By contrast, suppressing 6PGD triggered an earlier and more robust development of effector functions in stimulated naive CD8 T cells, leading to enhanced capacity for blocking infection and tumor growth in vivo. These data are consistent with the requirement for NADPH for cell survival and the contribution of the G6PD activity to NADPH production during CD8+ T cell activation. The importance of G6PD in NADPH homeostasis and T cell function was shown recently by Ghergurovich et al. (2020), who reported that G6PD blockade significantly depleted NADPH and decreased inflammatory cytokine production in activated T cells. Therefore, the opposite outcomes of 6PGD versus G6PD blockade highlight the importance of NADPH homeostasis in T cell survival and activation.
The superior effector phenotype and anti-tumor cytolytic function observed by genetic 6PGD ablation was reproduced by pharmacological inhibition of 6PGD using 6-AN. While 6-AN treatment reproduces the enhanced effector and metabolic phenotype of CD8+ T cells, it also led to some buildup of G6P in addition to a huge buildup of 6PG, which supports the on-target effect of 6-AN on 6PGD, with some effect on G6PD. Thus, our findings uncover 6PGD as a previously unidentified checkpoint in oxidative PPP for T CD8+ activation and effector function. This is in addition to glucose utilization in glycolysis as a key metabolic pathway required for T cell activation shown by past studies.
Our multiplexed SIRM approach of using the dual glucose and glutamine tracers simultaneously revealed metabolic compensation for the loss of 6PGD via the non-oxidative PPP, enhanced flow of glucose-to-glycogen synthesis, and preferential use of glutamine in fueling nucleotide biosynthesis via GNG and the PPP to support cell growth. The buildup of glutamine-derived 6PG (Figure S8B) also points to a role of glutamine in supporting NADPH production via the G6PD activity in 6PGD-deficient CD8+ T cells. Again, these are previously unknown aspects of metabolic plasticity in activated T cells in response to PPP disruption and can account for the ability of CD8+ T cells to tolerate 6PGD blockade, but not G6PD blockade.
The enhanced glycogen synthesis induced by 6PGD deficiency is of interest in light of previous studies showing that metabolism of the accumulated glycogen in T cells (Ma et al., 2018) or macrophages (Ma et al., 2020) via the oxidative PPP is required to support their effector function. The exact mechanism of glycogen accumulation and its potential role in the superior effector function of 6PGD−/− CD8+ T cells remain to be determined in future studies.
Moreover, we detected profound changes in mitochondrial properties including elevated ΔΨm that can lead to ROS production (Kamiński et al., 2012b; Murphy and Siegel, 2013) as well as time-dependent increase in mROS and fission ultrastructure in 6PGD−/−, but not in 6PGDfl/fl CD8+, T cells. These are hallmarks of effector phenotype and corroborated with the time-dependent overexpression of cell-surface markers of activation. mROS can modulate various signaling cascades including the mitogen-activated protein kinase, phosphatidylinositol 3-kinase (PI3K)/AKT, and JAK/STAT pathways (Kesarwani et al., 2013), NFAT nuclear localization/Ca2+ release (Sena et al., 2013), and nuclear factor κB (NF-κB) signaling (Morgan and Liu, 2011). To induce the signal, mROS alter protein function by oxidizing protein thiolate anion to sulfenic form (Cys-SOH), which is reversible. However, further oxidation of Cys-SOH by excess ROS to the sulfinic (SO2H) or sulfonic (SO3H) irreversibly damage proteins (Finkel, 2012). Thus, the level of cellular ROS determines “redox signaling” or “oxidative damage” and control of ROS level by the antioxidant systems is crucial to a switch between the two states. This role of antioxidation is evident from the observed transcripts overexpression of antioxidant enzymes and their master transcriptional regulator Nrf2 that correlated in time with the buildup of mitochondrial ROS and the activation of 6PGD−/− CD8+ T cells. While all of these point to mROS as an important mechanism of 6PGD−/− CD8+ T cell activation, further studies are required to determine whether the timely and balanced regulation of ROS level and redox signaling is the cause of the enhanced effector function of 6PGD−/− T cells.
Although mROS is a logical mechanism for inducing the observed phenotype, other potential mechanisms will also need to be considered, including (1) alterations in the levels of metabolites such as 6PG and glycogen that can serve as a signal, (2) 6PGD’s roles in protein-protein interactions and signaling, and (3) epigenetic changes such as acetylation and methylation. Moreover, these possible mechanisms could cooperate to induce the observed effector phenotype in 6PGD-blocked CD8+ T cells.
In summary, in the present study we discovered 6PGD as modulator of CD8+ T cell activation and differentiation. 6PGD blockade reprogrammed CD8+ T cell metabolism to support superior effector function and tumoricidal activity. This metabolic checkpoint may represent a key therapeutic target for cancer immunotherapies.
STAR★METHODS
RESOURCE AVAILABILITY
Lead contact
Further information and requests for resources and reagents should be directed to and will be fulfilled by the Lead Contact, Pankaj Seth (sethpankaj829@gmail.com).
Materials availability
The 6PGDfl/fl CD4Cre mouse line generated in this study is available upon request. This study did not generate new unique reagents.
Data and code availability
The RNA-seq dataset referenced in this paper has been deposited to NCBI BioSample (BioSample Accession # PRJNA700438).
EXPERIMENTAL MODEL AND SUBJECT DETAILS
Mice
Steps to generate 6PGDfl/fl CD4Cre mice (6PGD−/−) are demonstrated in Figure S2. First, to generate 6PGDfl/+ mice SA–ßgeo–pA cassette was inserted in the intron between exons 4 and 5 of 6PGD. In the cassette FRT provides target site for FLP recombinase; loxP determine target site for Cre-recombinase, SA is splice acceptor, ßgeo is β-galactosidase/ neomycin phosphotransferase fusion gene and pA is polyadenylation sequence. Then 6PGDfl/+ mice were breed together to generate homozygous 6PGDfl/fl mice. 6PGDfl/fl mice then were crossed with B6.Cg-Tg(Cd4-cre)1Cwi/BfluJ mice carrying Cre recombinase under the control of the CD4 promoter (CD4Cre) to generate 6PGDfl/fl CD4Cre. Verification of 6PGDfl/fl CD4Cre was done by PCR, western blot and alteration in metabolite profile associated with the enzyme. Other mice used during experiments including C57BL/6J (B6 CD45.2+), B6.SJL-Ptprca Pepcb/BoyJ (B6 CD45.1+), C57BL/6-Tg (TcraTcrb)1100Mjb/J (OTI) and B6.Cg-Thy1a/Cy Tg(TcraTcrb) 8Rest/J (pmel) mice were purchased from Charles River or Jackson Laboratories. All experiments were carried out on males or females with 6–10 weeks of age. All mice were kept in specific pathogen-free conditions prior to use. Animal work was done in accordance with the Institutional Animal Care and Use Committee of the University of BIDMC.
METHOD DETAILS
Detection of T cell markers by flow cytometry
To obtain lymphocytes from spleen, lymph node or thymus of mice tissues were harvested and mechanically disintegrated, passed through a 70 μm strainer, followed by red blood cell (RBC) lysis. For flow cytometry assays, purified naive CD8+ cells were stained immediately after purification or collected 4 days after culture. Cells were suspended in FACS buffer (1%FCS in PBS) and stained for surface markers using anti-CD3-PerCP (145–2C11), CD8-FITC or -Pacific Blue (53–6.7), CD4-APC or -PE or -Pacific Blue or Brilliant violet (BV) 711, (GK1.5), CD44-PECy7 (IM7), CD62L-Pacific Blue or APC (MEL-14), KLRG1-APCCy7 (2F1/KLRG1), CD127-APC (A7R34), CD25-PE-Cy7 or BV711 (PC61), CD69-PE (H1.2F3), CD122-APC (TM-b1), Glut-1 AF488 (EPR3915) and Aqua LIVE/DEAD Fixable Dead Cell Stain. Surface staining was performed at 4°C for 30 minutes in 100 μL staining volume. In tumor experiments, TIL were stained with anti-CD45.2 to distinguish from the host (CD45.1+). In adoptive transfer experiments in CD45.2+ hosts, OTI CD8+ T cells were stained with a PE-labeled OVA-specific MHC class I (H-2Kb) tetramer carrying the SIINFEKL peptide (NIAID Tetramer Facility). Intracellular staining for IFN-γ and granzyme B was performed with the Fixation/Permeabilization Solution Kit with BD GolgiPlug (BD Bioscience) according to the manufacturer’s protocol. For IFN-γ staining, cells were cultured in RMPI containing 10% FBS and were stimulated with PMA (50 ng/ml), ionomycin (1 μg/ml) and GolgiPlug (1 μl/ml) for 4 hr at 37°C. After stimulation, cells were first stained for surface markers, then fixed and permeabilized with fixation/permeabilization (BD PharMingen). Cells were then stained with Ab to IFN-γ-APC (XMG1.2) for 45 min at RT for assessment of granzyme B-PE (NGZB 2), the same approach was used without PMA stimulation. For transcription factor T-bet, isolated cells were stained intracellularly using the Foxp3/Transcription Factor Buffer Set (eBiosciences) following the manufacturer’s protocol. In this protocol, T-bet-PerCP-Cy5.5 (4B10) antibody incubation was performed for 60 minutes at room temperature (RT). Glucose uptake was analyzed by incubation of the cells with 20 μM 2-NBD-glucose (Cayman Chemical) for 30 min at 37°C. Cells were analyzed by a CytoFLEX LX (Beckman Coulter) cytometer and analysis was performed using FlowJo_V10 software. All antibodies are listed in the Key Resources Table.
KEY RESOURCES TABLE.
| REAGENT or RESOURCE | SOURCE | IDENTIFIER |
|---|---|---|
| Antibodies | ||
| Anti-mouse CD3ε Antibody (clone: 145-2C11) APC conjugated | BioLegend | Cat No#100326; RRID: AB_893317 |
| Anti-mouse CD4 Antibody (clone: GK1.5) APC conjugated | BioLegend | Cat No#100412; RRID: AB_312697 |
| Anti-mouse CD4 Antibody (clone: GK1.5) PE conjugated | BioLegend | Cat No#100408; RRID: AB_312693 |
| Anti-mouse CD4 Antibody (clone: GK1.5) Pacific Blue conjugated | BioLegend | Cat No#100428; RRID: AB_ 493647 |
| Anti-mouse CD8a Antibody (clone: 53-6.7) FITC conjugated | BioLegend | Cat No#100706; RRID: AB_312745 |
| Anti-mouse CD8a Antibody (clone: 53-6.7) Pacific Blue conjugated | BioLegend | Cat No#100725; RRID: AB_493425 |
| Anti-mouse CD25 Antibody (clone: PC61) BV711 conjugated | BioLegend | Cat No#102049; RRID: AB_2564130 |
| Anti-mouse CD44 Antibody (clone: IM7) PE-Cy7 conjugated | BioLegend | Cat No#103030; RRID: AB_830787 |
| Anti-mouse CD45.2 Antibody (clone: 104) PE-Cy7 conjugated | BioLegend | Cat No#109830; RRID: AB_1186098 |
| Anti-mouse CD45.2 Antibody (clone: 104) PerCP conjugated | BioLegend | Cat No#109826; RRID: AB_893349 |
| Anti-mouse CD62L Antibody (clone: MEL-14) APC conjugated | BioLegend | Cat No#104412; RRID: AB_313099 |
| Anti-mouse CD62L Antibody (clone: MEL-14) Pacific Blue conjugated | BioLegend | Cat No#104424; RRID: AB_493380 |
| Anti-mouse KLRG1 Antibody (clone: 2F1/KLRG1) APC-Cy7 conjugated | BioLegend | Cat No#138426; RRID: AB_2566554 |
| Anti-mouse CD69 Antibody (clone: H1.2F3) PE conjugated | BioLegend | Cat No#104508; RRID: AB_313111 |
| Anti-mouse CD95 (Fas) Antibody (clone: SA367H8) APC conjugated | BioLegend | Cat No#152604; RRID: AB_2632899 |
| Anti-mouse CD178 (FasL) Antibody (clone: MFL3) PE conjugated | BioLegend | Cat No#106606; RRID: AB_313279 |
| Anti-mouse CD122 Antibody (clone: TM-β1) APC conjugated | BioLegend | Cat No#123214; RRID: AB_2562575 |
| Anti-mouse CD127 Antibody (clone: A7R34) APC conjugated | BioLegend | Cat No#135012; RRID: AB_1937216 |
| Anti-mouse Glut1 Antibody (clone: EPR3915) Alexa Fluor® 488 conjugated | Abcam | Cat No#ab195359; RRID: AB_2832207 |
| Anti-mouse T-bet Antibody (clone: 4B10) PerCP-Cy5.5 conjugated | ThermoFisher | Cat No#45-5825-82; RRID: AB_953657 |
| Anti-mouse IFN-γ Antibody (clone: XMG1.2) APC conjugated | BioLegend | Cat No#505810; RRID: AB_315404 |
| Anti-mouse IL-17A Antibody (clone: eBio17B7) PE conjugated | ThermoFisher | Cat No#12-7177-81; RRID: AB_763582 |
| Anti-mouse Granzyme B Antibody (clone: NGZB) PE conjugated | ThermoFisher | Cat No#12-8898-82; RRID: AB_10870787 |
| Anti-mouse CD3ε Antibody (clone: 145-2C11) Purified | BioLegend | Cat No#100340; RRID: AB_11149115 |
| Anti-mouse CD28 Antibody (clone: 37.51) Purified | BioLegend | Cat No#102116; RRID: AB_11147170 |
| Anti-mouse 6PGD (polyclonal) Rabbit | Sigma Aldrich | Cat No#HPA031314; RRID: AB_10610278 |
| Anti-β-actin (D6A8) Rabbit mAb | Cell Signaling Technology | Cat No#8457; RRID: AB_10950489 |
| Donkey anti-rabbit IgG (polyclonal) Antibody Alexa Fluor® 647 | BioLegend | Cat No#406414; RRID: AB_2563202 |
| Donkey anti-rabbit IgG (polyclonal) Antibody PE | BioLegend | Cat No#406421; RRID: AB_2563484 |
| Donkey anti-rabbit IgG (polyclonal) Antibody FITC | BioLegend | Cat No#406403; RRID: AB_893531 |
| DRP1 (D6C7) Rabbit mAb | Cell Signaling Technology | Cat No#8570; RRID:AB_10950498 |
| Phospho-DRP1 (Ser616) (D9A1) Rabbit mAb | Cell Signaling Technology | Cat No#4494; RRID:AB_11178659 |
| MFF (E5W4M) XP® Rabbit mAb | Cell Signaling Technology | Cat No#84580; RRID:AB_2728769 |
| Phospho-MFF (Ser146) Antibody | Cell Signaling Technology | Cat No#49281; RRID:AB_2799354 |
| OPA1 (D6U6N) Rabbit mAb | Cell Signaling Technology | Cat No#80471; RRID:AB_2734117 |
| Bacterial and virus strains | ||
| Ova Expressing Listeria monocytogenes (LM-OVA) | Dr. Vassiliki A. Boussiotis | N/A |
| Chemicals, peptides, and recombinant proteins | ||
| 6-Aminonicotinamide (6-AN) | Sigma Aldrich | Cat No#A68203 |
| Dehydroepiandrosterone (DHEA) | Cayman Chemical | Cat No# 15728 |
| Glycogen Phosphorylase Inhibitor (GPI) | Cayman Chemical | Cat No# 17578 |
| Dimethyl sulfoxide (DMSO) | Sigma Aldrich | Cat No#D2438 |
| Tetra-methylrhodamine ester (TMRE) | ThermoFisher | Cat No#T669 |
| 2′,7’-dichlorodihydrofluorescein diacetate (H2DCFDA) | ThermoFisher | Cat No#D399 |
| MitoSOX Red | ThermoFisher | Cat No#M36008 |
| MitoTracker Deep Red FM | ThermoFisher | Cat No#M22426 |
| 2-NBD-glucose (2-NBDG) | Cayman Chemical | Cat No#11046 |
| 13C6 Glucose | Sigma Aldrich | Cat No#389374 |
| D-GLUCOSE (1,2,3,4,5,6,6-D7, 97–98%) | Cambridge Isotope laboratories | Cat No#DLM-2062-PK |
| 13C5,15N2-Glutamine | Cambridge Isotope laboratories | Cat No#CNLM-1275-H-PK |
| Fetal Bovine Serum, heat inactivated | ThermoFisher | Cat No#16140071 |
| NuPAGE 4 to 12%, Bis-Tris, 1.5 mm, Mini Protein Gel | ThermoFisher | Cat No#NP0335BOX |
| NuPAGE MES SDS Running Buffer | ThermoFisher | Cat No#NP0002 |
| Recombinant Mouse IL-2 | BioLegend | Cat No#575404 |
| PE-labeled OVA-specific MHC class I (H-2Kb) tetramer | NIAID Tetramer Facility | N/A |
| Critical commercial assays | ||
| Glycogen assay kit | Abcam | Cat No#ab65620 |
| Fixation/Permeabilization Solution Kit with BD GolgiPlug | BD Bioscience | Cat No#555028 |
| BD Phosflow Perm Buffer II kit | BD Bioscience | Cat No#558052 |
| eBioscience Foxp3 / Transcription Factor Staining Buffer Set | ThermoFisher | Cat No#00-5523-00 |
| LIVE/DEAD Fixable Aqua Dead Cell Stain Kit (Aqua) | ThermoFisher | Cat No#L34957 |
| EasySep Mouse CD8+ T Cell Isolation Kit | STEMCELL Technologies | Cat No#19853 |
| EasySep Mouse Naive CD8+ T Cell Isolation Kit | STEMCELL Technologies | Cat No#19858 |
| RNeasy Mini Kit | QIAGEN | Cat No#74104 |
| Lactate Dehydrogenase (LDH) Assay Kit | Abcam | Cat No#ab65393 |
| Mitochondrial Dynamics Antibody Sampler Kit | Cell Signaling Technology | Cat No#48799 |
| Seahorse XF Cell Mito Stress Test Kit | Agilent | Cat No#103015-100 |
| Pierce BCA Protein Assay Kit | ThermoFisher | Cat No#23225 |
| Deposited data | ||
| 6PGD CD8+ RNA-Sep data | This paper | BioSample accessions: SAMN17831770, SAMN17831771, SAMN17831772, SAMN17831773, SAMN17831774, SAMN17831775 |
| Experimental models: cell lines | ||
| E.G7-OVA [derivative of EL4] | ATCC | ATCC® CRL-2113 |
| EL-4 | ATCC | ATCC® TIB-39 |
| B16-F10 | ATCC | ATCC® CRL-6475 |
| Experimental models: organisms/strains | ||
| 6PGDfl/fl CD4cre | This paper | N/A |
| C57BL/6J (B6 CD45.2+) | The Jackson Laboratory | Stock No: 000664 |
| B6.SJL-Ptprca Pepcb/BoyJ (B6 CD45.1+) | The Jackson Laboratory | Stock No: 002014 | B6 Cd45.1 |
| B6.Cg-Tg(Cd4-cre)1Cwi/BfluJ (CD4cre) | The Jackson Laboratory | Stock No: 022071 | CD4Cre |
| C57BL/6-Tg(TcraTcrb)1100Mjb/J (OTI) | The Jackson Laboratory | Stock No: 003831 | OT-1 |
| B6.Cg-Thy1a/Cy Tg (TcraTcrb) 8Rest/J (pmel) | The Jackson Laboratory | Stock No: 005023 |
| Oligonucleotides | ||
| Ifng TaqMan® Assay probe (FAM-MGB) | ThermoFisher | Cat No#4331182; Assay ID: Mm01168134_m1 |
| Tbet (Tbx21) TaqMan® Assay probe (FAM-MGB) | ThermoFisher | Cat No# 4331182; Assay ID: Mm00450960_m1 |
| Fas TaqMan® Assay probe (FAM-MGB) | ThermoFisher | Cat No#4331182; Assay ID: Mm01204974_m1 |
| Fasl TaqMan® Assay probe (FAM-MGB) | ThermoFisher | Cat No#4331182; Assay ID: Mm00438864_m1 |
| Gzb TaqMan® Assay probe (FAM-MGB) | ThermoFisher | Cat No#4331182; Assay ID: Mm00442834_m1 |
| Pou2af1 TaqMan® Assay probe (FAM-MGB) | ThermoFisher | Cat No#4331182; Assay ID: Mm00448326_m1 |
| SOD2 TaqMan® Assay probe (FAM-MGB) | ThermoFisher | Cat No#4453320; Assay ID: Mm01313000_m1 |
| Cat TaqMan® Assay probe (FAM-MGB) | ThermoFisher | Cat No#4453320; Assay ID: Mm00437992_m1 |
| Gsr TaqMan® Assay probe (FAM-MGB) | ThermoFisher | Cat No#4453320; Assay ID: Mm00439154_m1 |
| Gpx4 TaqMan® Assay probe (FAM-MGB) | ThermoFisher | Cat No#4453320; Assay ID: Mm00515041_m1 |
| Txn1 TaqMan® Assay probe (FAM-MGB) | ThermoFisher | Cat No#4448892; Assay ID: Mm00726847_s1 |
| Txnrd1 TaqMan® Assay probe (FAM-MGB) | ThermoFisher | Cat No#4448892; Assay ID: Mm00443675_m1 |
| Prdx2 TaqMan® Assay probe (FAM-MGB) | ThermoFisher | Cat No#4448892; Assay ID: Mm04208213_g1 |
| Nrf2 TaqMan® Assay probe (FAM-MGB) | ThermoFisher | Cat No#4453320; Assay ID: Mm00477784_m1 |
| 18S rRNA TaqMan® Assay probe (VIC-MGB) | ThermoFisher | Cat No#4319413E |
| Software and algorithms | ||
| FlowJo_V10 | FlowJo | https://www.flowjo.com/ |
| Graphpad Prism_V6 | Graphpad | https://www.graphpad.com/ |
Flow cytometry for mitochondrial markers
Mitochondrial markers were analyzed by surface staining combined by staining with 200 nM MitoTracker Deep Red FM (ThermoFisher) for mitochondrial mass, 200 nM tetra-methylrhodamine ester (TMRE) (ThermoFisher) for mitochondrial membrane-potential, 5 μM MitoSOX Red (ThermoFisher) for mitochondrial reactive oxygen species (ROS) and 20 μM dichlorofluorescin diacetate (DCFDA) (ThermoFisher) for general ROS detection. Staining were done in FACS buffer (PBS containing %2 FBS) for 30 min at 37°C. In case of MitoSOX Red staining, first surface antibodies were added, incubated at 37°C and then MitoSOX Red was added in last 10 minutes. To detect fission/fusion proteins with flow cytometry, BD Phosflow Perm Buffer II kit (BD Bioscience) was used according to the manufacturer’s protocol. In brief, cells were first stained for surface markers, washed and fixed with 4% PFA in PBS for 15 min at RT and then incubated in BD Phosflow Perm Buffer II for 20 minutes at 4°C. After washing with FACS buffer (PBS containing %2 FBS), cells were incubated with rabbit phospho-DRP1 [Ser616] (Cell Signaling) or rabbit phospho-MFF [Ser146] (Cell Signaling) for 30 minutes at 4°C. In final step, cell were washed and donkey anti-rabbit-Alexa Fluor® 647 was added for 30 minutes at 4°C. Cells were analyzed by a CytoFLEX LX (Beckman Coulter) cytometer and analyzed by FlowJo_V10.
Cell isolation and cultures
Total CD8+ T cells or naive CD8+ T cells were harvested from spleens and lymph nodes. In brief, spleens and lymph nodes were minced, passed through a 70 μm strainer (Fisher Scientific) and then lysed by RBC lysis buffer. Total CD8+ T cells were isolated by EasySep Mouse CD8+ T Cell Isolation Kit (STEMCELL Technologies) and naive CD8+ T cells were purified by EasySep Mouse Naive CD8+ T Cell Isolation Kit (STEMCELL Technologies) following manufacturer’s protocols. Purity of naive CD8+ T cells (CD8+CD62LhighCD44low) were more than 95%. Enriched naive CD8+ T cells were used for subsequent cultures. In most of the experiments 6PGD−/− and 6PGDfl/fl CD8+ T cells were analyzed at day 0 (naive) and 4 days post stimulation, unless otherwise indicated. For stimulation, naive CD8+ T cells were incubated with soluble αCD3 (2C11; 0.5 μg/ml), soluble αCD28 (37.51; 0.5 μg/ml) and mIL-2 (20 U/ml) for 4 days in complete RPMI containing 10% FBS. In the culture set up we performed pilot experiments with serial dilution of antibodies (soluble 0.1–5 μg/ml), plate bound (1–5 μg/ml overnight 4°C in PBS) and also antibody coated beads (different ratio) to find the optimized culture condition. Optimized antibody concentration was chosen to show clear difference between 6PGD−/− and 6PGDfl/fl CD8+ T cells (date not shown). For 6-AN treatment, sorted naive CD8+ T cells (CD8+CD62LhighCD44low) were cultured in RPMI medium containing 10% FBS and stimulated with soluble αCD3 (2C11; 0.5 μg/ml), soluble αCD28 (37.51; 0.5 μg/ml) and mIL-2 (20 U/ml) in the presence of 6-AN (10 μM) or vehicle control (DMSO). Treatment schedule was as follows: 10 μM for day zero and supplemented more 6-AN daily as 10 μM day 1 and then 5 μM for day 2 and 3 and cells were harvested on day 4. Cells were washed once with PBS and used for subsequent experiments. Tumor-infiltrating lymphocytes were obtained by mincing tumors followed by treatment with 2 mg/ml Collagenase A (Sigma Aldrich) and1 mg/ml DNase I (Sigma Aldrich) in 5% FBS containing RMPI (Thermo Fisher Scientific) under shaking for 45 minutes. Homogenized suspension was passed through the 70 μm filters and lymphocytes were purified by Percoll-gradient centrifugation.
Listeria. monocytogenes (LM-OVA) clearance assay
Ova Expressing Listeria monocytogenes (LM-OVA) clearance was examined in two models: 1) direct injection of bacteria to 6PGD−/− mice (and their corresponding 6PGDfl/fl mice), and 2) immunization of WT mice (CD45.1+) one day after adoptive transfer of OTI+ CD8+ T cells (CD45.2+). In both models mice were immunized by intravenously (i.v.) transfer of recombinant attenuated Lm-OVA (2 × 10³ CFU [colony-forming units]). Adoptive transfer included i.v. transfer of 1 × 10⁵ OTI cells from either 6PGDfl/fl CD4cre mice or 6PGDfl/fl mice. Three days post infection, splenocytes were isolated and analyzed for bacterial load (CFUs) or frequency of OVA-specific CD8+ T cells. To check the bacterial load (CFUs), harvested splenocytes were cultured at 37°C on Brain Heart Infusion (BHI) culture agars and colonies were counted 24 hr later. The frequency of transferred cells in spleen was determined flow cytometry staining of CD45.2+ cells. PE-labeled OVA-specific MHC class I (H2Kb/OVA257–264) tetramer was used to determine OVA-specific CD8+ T cells in LM-OVA infected 6PGD−/− or 6PGDfl/fl mice.
Tumor model and adoptive transfer
To generate EG7 tumor models expressing OVA, 1×10⁶ cells/mouse of EG7-OVA [derivative of EL4] (ATCC CRL-2113) cells resuspended in PBS and were injected subcutaneously (s.c.) into the B6 CD45.1+ mice right flank. For pmel tumor model, B6 CD45.1+ mice were injected s.c. with 2×10⁵ cells/mouse of B16-F10 (ATCC® CRL-6475) cells. For adoptive transfer 1×10⁵ isolated OTI CD8+ T cells or 1×10⁶ prepared pmel CD8+ T cells were intravenously (i.v.) injected into recipient mice on day 5 post-tumor engraftment. For experiments with 6-AN treatment, WT CD8+ T cells were isolated from OTI/6PGDfl/fl or pmel/6PGDfl/fl mice and stimulated with 0.5 μg/ml soluble αCD3+αCD28 mAbs-plus-IL-2 (20 U/ml) for 4 days in the presence of 6-AN or vehicle control (DMSO) followed by adoptive transfer to congenic (CD45.1+) mice bearing EG7 or B16-F10 tumors, respectively. For glycogen phosphorylase inhibitor (GPI) studies, OTI/CD8+ T cells were cultured with 6-AN or DMSO as above or in the presence of GPI (50 μM), cells were collected on day 4 and used for adoptive transfer to EG7 tumor-bearing mice. Tumor growth for all groups was monitored every 48 hr and tumor volume was calculated as length × width2/2 of the tumor. Tumors, draining lymph nodes, and spleens were harvested at the end point (day 14–16) and adoptively transferred cells (marked by CD45.2+) were further analyzed for flow cytometry. When B6 CD45.2+ mice were used as tumor hosts, PE-labeled OVA-specific MHC class I (H2Kb/OVA257–264) tetramer was used to detect OVA-specific CD8+ T cells.
Cytotoxic T Lymphocyte (CTL) assay
CTL assay was done in two set of experiments: 1) CD8+ T cells from OTI/6PGD−/− and pmel/6PGD−/− mice were cultured with soluble αCD3 (1μg/ml), soluble αCD28 (1μg/ml) and mIL-2 (20 IU/ml) for 4 days. Corresponding OTI/6PGDfl/fl and pmel/6PGDfl/fl controls also were cultured in the same manner. 2) CD8+ T cells from OTI/6PGDfl/fl or pmel/6PGDfl/fl mice were isolated and stimulated with αCD3 (1μg/ml), αCD28 (1μg/ml) and mIL-2 (20 IU/ml) for 4 days in the presence of 6-AN or vehicle control (DMSO). After 4 days of T cells culture, 1×10⁵ cells were cultured with EG7 (for OTI) or B16-F10 (for pmel) in T: tumor cell ratio of 1:1 for 18 hr. T cells alone and tumor cells alone were considered as controls. After incubation, toxicity percentage of total was determined by Lactate Dehydrogenase (LDH) Assay Kit (Abcam) following manufacturer’s protocol.
RNA purification, RNA-sequencing and Real-time quantitative PCR
Isolated 6PGD−/− and 6PGDfl/fl CD8+ T cells were stimulated with soluble αCD3 (1μg/ml) and soluble αCD28 (1μg/ml) for 48 hr. Total RNA was extracted with RNeasy Mini Kit (QIAGEN) and RNA concentrations were determined using Nanodrop (Thermo Scientific). Total DNA-free RNA was used for mRNA isolation and library construction. Libraries were sequenced on an Illumina HISEQ 2500 (Illumina). To confirm RNA-sequencing results, naive CD8+ T cells (CD62Lhigh CD44low) from 6PGD−/− and 6PGDfl/fl mice were isolated and stimulated with soluble αCD3 (1μg/ml), soluble αCD28 (1μg/ml) and mIL-2 (20 IU/ml) for 4 days. Naive T cells or at 4 days post stimulation were examined for expression of representative genes by real-time quantitative PCR method using ABI 7300 Real-Time PCR system (Applied Biosystems). For ROS enzymes, all 4 days were examined. After running the samples, expression of each gene was normalized to the housekeeping gene expression (18S rRNA) as ΔCT = CT (gene X) − CT (18S rRNA). Then alteration between 6PGD−/− and 6PGDfl/fl CD8+ T cells was calculated as fold change = 2^(ΔΔCT). ΔΔCT is: CT (gene X) − CT (gene X at baseline). Specific used TaqMan™ probes (ThermoFisher) are listed in the Key Resources Table.
Bioenergetics analysis by Seahorse
Prepared 6PGD−/− and 6PGDfl/fl CD8+ T cells were seeded on Cell-Tak coated Seahorse XFe24 (Agilent) culture plates (0.8–1 × 10⁶ cells/well) in assay media. For oxygen consumption rates (OCR) evaluation assay media was DMEM supplemented with 1% BSA and 25 mM glucose, 1 mM pyruvate, and 2 mM glutamine. Basal OCR were taken for 30 min. To obtain maximal respiratory and control values, cells were stimulated with oligomycin (1 μM), FCCP (1.5 μM) and rotenone/antimycin A (0.5 μM). Spare respiratory capacity (SRC) was calculated as the difference between basal OCR and maximal amount of OCR up on FCCP uncoupling.
Tracer studies in cell cultures
In Tracing experiments naive CD8+ T cells from 6PGD−/− and 6PGDfl/fl mice were isolated and stimulated with soluble αCD3 (1μg/ml), soluble αCD28 (1μg/ml) and mIL-2 (20 IU/ml) for 4 days in labeling media. To prepare labeling media, Glc-free Gln-free RPMI medium was supplemented with 10% dialyzed FBS (Life Technologies), 20 mM HEPES, 0.05 mM 2-mercaptoethanol and 1% penicillin-streptomycin plus 10 mM D7-D-glucose (D7-Glc) and 2 mM 13C5, 15N2-glutamine (13C5, 15N2-Gln) (Cambridge Isotope laboratories). In a separate set of experiments for detection of glycogen with NMR, 6PGD−/− and 6PGDfl/fl CD8+ T cells were cultured in tracing media containing 13C6-Glc and unlabeled glutamine (Gln). Final cells were collected, washed with PBS and then frozen under liquid nitrogen. The frozen cell pellets were homogenized in 60% cold acetonitrile in water in a ball mill (Retch MM400, Verder Scientific, Newtown, PA) for denaturing proteins and optimizing extraction. Polar metabolites were extracted by the solvent partitioning method with a final CH3CN:H2O:CHCl3 (2:1.5:1, v/v) ratio, followed by a second extraction including methanol, and lyophilized until later use. Supernatant culture media also was collected and metabolites were extracted by adding 200 μl cold acetone per 50 μl of media (final ratio 80:20). After centrifugation, media supernatant was removed and lyophilized.
IC-UHR-MS analysis
Polar extracts for Ion Chromatography-UltraHigh Resolution Mass Spectrometry (IC-UHR-MS) were reconstituted in 20 μL ultrapure deionized water (EMD Millipore) of which 10 μL was injected for IC-MS. All analyses were performed on a Dionex ICS-5000+ ion chromatography interfaced to a Thermo Fusion Orbitrap Tribrid mass spectrometer (Thermo Fisher Scientific). Ion chromatography was performed using an IonPac AS11-HC-4 μm RFIC&HPIC (2 × 250 mm) column and an IonPac AG11-HC-4 μm guard column (2 × 50 mm). The column flow rate was constant at 0.38 mL/min with column temperature at 35°C and 0.06 mL/min methanol added post-column as a makeup solvent to aid vaporization in the heated electrospray ionization (HESI) unit. The HESI vaporizer temperature was 400°C with sheath gas set at 35 arbitrary units (~3 L/min) and auxiliary nitrogen flow at 4 abitrary units (~4 L/min). In the IC the KOH gradient is electrolytically generated as follow: initial equilibration for 8 min with 1 mM KOH, followed by 1 mM KOH for 2 min, which after 10 μL of sample was injected, then linear ramp to 40 mM KOH from 2 to 25 min, a second linear ramp to 100mM from 25 to 39.1 min, and held at 100mM to 50 min. The run program includes a reset for the next injection by ramping down to 1 mM KOH at 50.1 min and held there until 52.5 min. Post-column KOH suppression was achieved with a Dionex AERS 500 2 mm suppressor with an external AXP pump supplying nanopore water regenerant at a flow rate of 0.75 mL/min, which kept highest baseline conductivity below 1 μS in the eluent presented to the HESI. Mass spectra were recorded at a maximum resolution setting of 450,000 (achieving a resolution of ~360,000 measured at 400 m/z) from 80 to 700 m/z scan range in the negative ion mode using the following settings: HESI = 2800 V; ion transfer tube temperature = 300°C; automatic gain control (AGC) target = 2 × 10⁵; maximal injection time = 100 msec. All data were collected as MS1 under this UHR condition to resolve any and all isotopologues of any combination of 13C5 and 15N2 simultaneously. Peak areas were integrated and exported to Excel via the Thermo TraceFinder (version 3.3) software package. Peak areas were corrected for natural abundance as previously described (Fan et al., 2016).
Protein normalized concentration was calculated from peak areas using the MS response factor for authentic standards of known concentration analyzed before and after the samples (μmole/g protein). Fractional enrichment (fraction) was calculated as the percentage of the natural abundance corrected signal of each isotopologue of the sum of all isotopologues within a certain metabolite. These procedures were previously described (Fan et al., 2016).
NMR analysis
The cell and corresponding media samples were extracted as previously described (Crooks et al., 2019). The lyophilized powder of cell extracts were reconstituted in D2O (> 99.9%, Cambridge Isotope Laboratories, MA) containing 0.1 mM EDTA (Ethylenediaminetetraacetic acid, Sigma Aldrich, St. Louis, MO) and 0.5 mM D6-2,2-dimethyl-2-silapentane-5-sulfonate (DSS) (Cambridge Isotope Laboratories, Tewksbury, MA) as internal standard. Media extracts were reconstituted in phosphate buffer (pH = 7) containing 0.25 mM D6-DSS. 1D 1H and 1H[13C] HSQC NMR spectra were acquired on a 14.1 Tesla spectrometer (Agilent Technologies, CA) equipped with a 3 mm inverse triple resonance HCN cryogen cooled probe. 1D 1H spectra were acquired with standard PRESAT pulse sequence for water suppression at 15°C. A total of 16384 data points were acquired each time with 2 s acquisition time, 512 transients, 12 ppm spectral width, and 4 s recycle delay. The spectra were then linear predicted and zero filled to 128k data points and apodized with 1 Hz exponential function. 1D HSQC spectra were recorded with 13C adiabatic decoupling scheme for broad range decoupling during proton acquisition time of 0.25 s. 1796 data points were collected each transient and a total of 1024 transients were acquired with 12 ppm spectral width. The HSQC spectra were then apodized with unshifted Gaussian function and 4 Hz exponential line broadening and zero filling to 16k data points before Fourier transformation. Metabolites were assigned by comparison with in-house and public NMR databases. Metabolite and their 13C isotopomers were quantified using the Mnova software (Mestrelab Research S.L., Santiago de Compostela, Spain) by peak deconvolution. The peak intensities of metabolites obtained were converted into nmoles by calibration against the peak intensity of DSS at 0 ppm and then further normalized to the total protein weight extracted in each sample.
Electron Microscopy
Naive CD8+ T cells were isolated from spleen of 6PGD−/− and 6PGDfl/fl mice and stimulated with soluble αCD3 (1μg/ml), soluble αCD28 (1μg/ml) and mIL-2 (20 IU/ml) for 4 days. Naive cells at time 0 and stimulates cells at day 4 were fixed in 4% glutaraldehyde and stained for electron microscopy. In brief, cells were fixed in 2.5% glutaraldehyde, 1.25% paraformaldehyde and 0.03% picric acid in 0.1 M sodium cacodylate buffer with pH = 7.4. After 2 hr at RT, cells were pelleted, washed in 0.1 M cacodylate buffer and then post-fixed with 1% osmiumtetroxide (OsO4)/1.5% potassium ferrocyanide (KFeCN6) for 1 hour. Cell pellet was then washed with water and maleate buffer (MB) and incubated in 1% uranyl acetate in MB for 1 hr. Pellet was twice washed with water and dehydrated in 50%, 70%, 90% (twice 10 minutes each) and 100% (twice 10 minutes each) grades of alcohol. Cells then were incubated in propyleneoxide for 1 hr and infiltrated in a 1:1 mixture of propyleneoxide and TAAB Epon (Marivac Canada Inc. St. Laurent, Canada). The day after samples were embedded in TAAB Epon and polymerized at 60°C for 2 days. Ultrathin sections (about 60 nm) were cut on a Reichert Ultracut-S microtome, picked up on to copper grids stained with lead citrate and examined in a JEOL 1200EX Transmission electron microscope or a TecnaiG2 Spirit BioTWIN and images were recorded with an AMT 2k CCD camera.
Immunoblotting
Naive CD8+ T cells were isolated from spleen of 6PGD−/− and 6PGDfl/fl mice and stimulated with soluble αCD3 (1μg/ml), soluble αCD28 (1μg/ml) and mIL-2 (20 IU/ml) for 4 days. Cells then were lysed on ice-cold lysis buffer [50 mmol/L Tris-HCl (pH 7.4), 50 mmol/L sodium fluoride, 150 mmol/L NaCl, 1% Nonident P40, 0.5 mol/L EDTA (pH 8.0)] and the protease inhibitor cocktail Complete Mini (Roche). Supernatants were collected after centrifugation at 14,000 g at 4°C for 20 min and protein concentrations were determined by Pierce BCA Protein Assay Kit (ThermoFisher). 25 μg of each protein sample was then electrophoresed on NuPAGE 4%–12% Bis-Tris Gel (ThermoFisher) in NuPAGE MES SDS running buffer (ThermoFisher) for 90 minutes at 100 V. The membranes were blocked with 5% nonfat dry milk in 1X Tris-Buffered Saline (TBS) for 1 hour and then probed with primary antibodies (diluted at 1:1,000 in 1X TBS with 5% nonfat milk) overnight at 4°C. Membranes were then washed in 1X TBS buffer and incubated with fluorescent conjugated secondary antibodies (donkey anti rabbit) at a dilution of 1:5,000 for 1 hour at room temperature. Bands were visualized fluorescent scanner. Used antibodies were as follow: 6PGD (primary, HPA031314), β-actin (primary, D6A8), phosphor-DRP1 [Ser616] (primary, D9A1), DRP1 (primary, D6C7), phospho-MFF [Ser146] (primary, polyclonal), MFF (primary, E5W4M), OPA1 (primary, D6U6N), PE-donkey anti rabbit (secondary, poly4064) and FITC-donkey anti rabbit (secondary, poly4064).
QUANTIFICATION AND STATISTICAL ANALYSIS
All the statistical analysis were done using GraphPad Prism 6 (GraphPad) and Excel software. Difference between groups was analyzed using the Student t test (for two groups) or one way ANOVA (for multiple groups), followed by the post hoc Tukey test. Differences in tumor growth was calculated by two-way ANOVA. Differences between groups were rated significant at values of p < 0.05. In the figures all data are shown as mean ± SEM and *p ≤ 0.05, ** p ≤ 0.01, *** p ≤ 0.001, **** p ≤ 0.0001.
Supplementary Material
Highlights.
Blocking 6PGD induces a CD8+ T effector phenotype
6PGD-deficient CD8+ T cells have enhanced non-oxidative PPP
6PGD inhibition triggers mROS production and antioxidant machinery in CD8+ T cells
6PGD may serve a metabolic checkpoint for cell-based cancer immunotherapy
ACKNOWLEDGMENTS
This work was supported by BIDMC seed funds to P.S., 2014-07-1112 target grant from Bayer to P.S., pilot grant 1U24DK097215-01A1 to P.S., and the Markey Cancer Center Redox and Metabolism Shared Resource Facility grant P30CA177558. P.S. was partially supported by R01CA169470 and W81XWH-15-1-0686. T.W.-M.F. was supported by 1P01CA163223-01A1 (NIH), and V.A.B. was supported by R01CA212605 and R01CA238263 (NIH). We thank Dr. A.N. Lane for valuable and critical reading of the manuscript. We acknowledge technical assistance from BIDMC mitochondria metabolism core and Flow Cytometry core and Harvard Medical School molecular electron microscopy facilities.
Footnotes
DECLARATION OF INTERESTS
V.A.B. has patents on the PD-1 pathway licensed by Bristol-Myers Squibb, Roche, Merck, EMD-Serono, Boehringer Ingelheim, AstraZeneca, Novartis, and Dako. The authors declare no other competing interests.
SUPPLEMENTAL INFORMATION
Supplemental information can be found online at https://doi.org/10.1016/j.celrep.2021.108831.
REFERENCES
- Boros LG, Puigjaner J, Cascante M, Lee WN, Brandes JL, Bassilian S, Yusuf FI, Williams RD, Muscarella P, Melvin WS, and Schirmer WJ (1997). Oxythiamine and dehydroepiandrosterone inhibit the nonoxidative synthesis of ribose and tumor cell proliferation. Cancer Res. 57, 4242–4248. [PubMed] [Google Scholar]
- Boros LG, Lee PW, Brandes JL, Cascante M, Muscarella P, Schirmer WJ, Melvin WS, and Ellison EC (1998). Nonoxidative pentose phosphate pathways and their direct role in ribose synthesis in tumors: is cancer a disease of cellular glucose metabolism? Med. Hypotheses 50, 55–59. [DOI] [PubMed] [Google Scholar]
- Bose TO, Pham QM, Jellison ER, Mouries J, Ballantyne CM, and Lefrançois L (2013). CD11a regulates effector CD8 T cell differentiation and central memory development in response to infection with Listeria monocytogenes. Infect. Immun 81, 1140–1151. [DOI] [PMC free article] [PubMed] [Google Scholar]
- Buck MD, O’Sullivan D, Klein Geltink RI, Curtis JD, Chang CH, Sanin DE, Qiu J, Kretz O, Braas D, van der Windt GJ, et al. (2016). Mitochondrial Dynamics Controls T Cell Fate through Metabolic Programming. Cell 166, 63–76. [DOI] [PMC free article] [PubMed] [Google Scholar]
- Carr EL, Kelman A, Wu GS, Gopaul R, Senkevitch E, Aghvanyan A, Turay AM, and Frauwirth KA (2010). Glutamine uptake and metabolism are coordinately regulated by ERK/MAPK during T lymphocyte activation. J. Immunol 185, 1037–1044. [DOI] [PMC free article] [PubMed] [Google Scholar]
- Chang CH, Curtis JD, Maggi LB Jr., Faubert B, Villarino AV, O’Sullivan D, Huang SC, van der Windt GJ, Blagih J, Qiu J, et al. (2013). Posttranscriptional control of T cell effector function by aerobic glycolysis. Cell 153, 1239–1251. [DOI] [PMC free article] [PubMed] [Google Scholar]
- Chang CH, Qiu J, O’Sullivan D, Buck MD, Noguchi T, Curtis JD, Chen Q, Gindin M, Gubin MM, van der Windt GJ, et al. (2015). Metabolic Competition in the Tumor Microenvironment Is a Driver of Cancer Progression. Cell 162, 1229–1241. [DOI] [PMC free article] [PubMed] [Google Scholar]
- Crooks DR, Fan TW, and Linehan WM (2019). Metabolic Labeling of Cultured Mammalian Cells for Stable Isotope-Resolved Metabolomics: Practical Aspects of Tissue Culture and Sample Extraction. Methods Mol. Biol. 1928, 1–27. [DOI] [PMC free article] [PubMed] [Google Scholar]
- Davis LH, and Kauffman FC (1987). Metabolism via the pentose phosphate pathway in rat pheochromocytoma PC12 cells: effects of nerve growth factor and 6-aminonicotinamide. Neurochem. Res 12, 521–527. [DOI] [PubMed] [Google Scholar]
- Fan TW, Warmoes MO, Sun Q, Song H, Turchan-Cholewo J, Martin JT, Mahan A, Higashi RM, and Lane AN (2016). Distinctly perturbed metabolic networks underlie differential tumor tissue damages induced by immune modulator β-glucan in a two-case ex vivo non-small-cell lung cancer study. Cold Spring Harb. Mol. Case Stud. 2, a000893. [DOI] [PMC free article] [PubMed] [Google Scholar]
- Finkel T (2012). From sulfenylation to sulfhydration: what a thiolate needs to tolerate. Sci. Signal 5, pe10. [DOI] [PubMed] [Google Scholar]
- Frauwirth KA, Riley JL, Harris MH, Parry RV, Rathmell JC, Plas DR, Elstrom RL, June CH, and Thompson CB (2002). The CD28 signaling pathway regulates glucose metabolism. Immunity 16, 769–777. [DOI] [PubMed] [Google Scholar]
- Gemta LF, Siska PJ, Nelson ME, Gao X, Liu X, Locasale JW, Yagita H, Slingluff CL Jr., Hoehn KL, Rathmell JC, and Bullock TNJ (2019). Impaired enolase 1 glycolytic activity restrains effector functions of tumor-infiltrating CD8+ T cells. Sci. Immunol 4, eaap9520. [DOI] [PMC free article] [PubMed] [Google Scholar]
- Ghergurovich JM, García-Cañaveras JC, Wang J, Schmidt E, Zhang Z, TeSlaa T, Patel H, Chen L, Britt EC, Piqueras-Nebot M, et al. (2020). A small molecule G6PD inhibitor reveals immune dependence on pentose phosphate pathway. Nat. Chem. Biol 16, 731–739. [DOI] [PMC free article] [PubMed] [Google Scholar]
- Grant CM (2008). Metabolic reconfiguration is a regulated response to oxidative stress. J. Biol 7, 1. [DOI] [PMC free article] [PubMed] [Google Scholar]
- Ho PC, Bihuniak JD, Macintyre AN, Staron M, Liu X, Amezquita R, Tsui YC, Cui G, Micevic G, Perales JC, et al. (2015). Phosphoenolpyruvate Is a Metabolic Checkpoint of Anti-tumor T Cell Responses. Cell 162, 1217–1228. [DOI] [PMC free article] [PubMed] [Google Scholar]
- Hu C, Huang Y, and Li L (2017). Drp1-Dependent Mitochondrial Fission Plays Critical Roles in Physiological and Pathological Progresses in Mammals. Int. J. Mol. Sci 18, 144. [DOI] [PMC free article] [PubMed] [Google Scholar]
- Jacobs SR, Herman CE, Maciver NJ, Wofford JA, Wieman HL, Hammen JJ, and Rathmell JC (2008). Glucose uptake is limiting in T cell activation and requires CD28-mediated Akt-dependent and independent pathways. J. Immunol 180, 4476–4486. [DOI] [PMC free article] [PubMed] [Google Scholar]
- Kamiński MM, Röth D, Sass S, Sauer SW, Krammer PH, and Gülow K (2012a). Manganese superoxide dismutase: a regulator of T cell activation-induced oxidative signaling and cell death. Biochim. Biophys. Acta 1823, 1041–1052. [DOI] [PubMed] [Google Scholar]
- Kamiński MM, Sauer SW, Kamiński M, Opp S, Ruppert T, Grigaravičius P, Grudnik P, Gröne HJ, Krammer PH, and Gülow K (2012b). T cell activation is driven by an ADP-dependent glucokinase linking enhanced glycolysis with mitochondrial reactive oxygen species generation. Cell Rep. 2, 1300–1315. [DOI] [PubMed] [Google Scholar]
- Kardon T, Stroobant V, Veiga-da-Cunha M, and Schaftingen EV (2008). Characterization of mammalian sedoheptulokinase and mechanism of formation of erythritol in sedoheptulokinase deficiency. FEBS Lett. 582, 3330–3334. [DOI] [PubMed] [Google Scholar]
- Kesarwani P, Murali AK, Al-Khami AA, and Mehrotra S (2013). Redox regulation of T-cell function: from molecular mechanisms to significance in human health and disease. Antioxid. Redox Signal. 18, 1497–1534. [DOI] [PMC free article] [PubMed] [Google Scholar]
- Kim B, and Song YS (2016). Mitochondrial dynamics altered by oxidative stress in cancer. Free Radic. Res. 50, 1065–1070. [DOI] [PubMed] [Google Scholar]
- Knott AB, Perkins G, Schwarzenbacher R, and Bossy-Wetzel E (2008). Mitochondrial fragmentation in neurodegeneration. Nat. Rev. Neurosci 9, 505–518. [DOI] [PMC free article] [PubMed] [Google Scholar]
- Kruger NJ, and von Schaewen A (2003). The oxidative pentose phosphate pathway: structure and organisation. Curr. Opin. Plant Biol. 6, 236–246. [DOI] [PubMed] [Google Scholar]
- Lee SM, Koh HJ, Park DC, Song BJ, Huh TL, and Park JW (2002). Cytosolic NADP(+)-dependent isocitrate dehydrogenase status modulates oxidative damage to cells. Free Radic. Biol. Med. 32, 1185–1196. [DOI] [PubMed] [Google Scholar]
- Liu R, and Chan DC (2015). The mitochondrial fission receptor Mff selectively recruits oligomerized Drp1. Mol. Biol. Cell 26, 4466–4477. [DOI] [PMC free article] [PubMed] [Google Scholar]
- Lorkiewicz P, Higashi RM, Lane AN, and Fan TW (2012). High information throughput analysis of nucleotides and their isotopically enriched isotopologues by direct-infusion FTICR-MS. Metabolomics 8, 930–939. [DOI] [PMC free article] [PubMed] [Google Scholar]
- Ma R, Ji T, Zhang H, Dong W, Chen X, Xu P, Chen D, Liang X, Yin X, Liu Y, et al. (2018). A Pck1-directed glycogen metabolic program regulates formation and maintenance of memory CD8+ T cells. Nat. Cell Biol. 20, 21–27. [DOI] [PubMed] [Google Scholar]
- Ma J, Wei K, Liu J, Tang K, Zhang H, Zhu L, Chen J, Li F, Xu P, Chen J, et al. (2020). Glycogen metabolism regulates macrophage-mediated acute inflammatory responses. Nat. Commun 11, 1769. [DOI] [PMC free article] [PubMed] [Google Scholar]
- Macintyre AN, Gerriets VA, Nichols AG, Michalek RD, Rudolph MC, Deoliveira D, Anderson SM, Abel ED, Chen BJ, Hale LP, and Rathmell JC (2014). The glucose transporter Glut1 is selectively essential for CD4 T cell activation and effector function. Cell Metab. 20, 61–72. [DOI] [PMC free article] [PubMed] [Google Scholar]
- MacIver NJ, Michalek RD, and Rathmell JC (2013). Metabolic regulation of T lymphocytes. Annu. Rev. Immunol. 31, 259–283. [DOI] [PMC free article] [PubMed] [Google Scholar]
- Menk AV, Scharping NE, Moreci RS, Zeng X, Guy C, Salvatore S, Bae H, Xie J, Young HA, Wendell SG, and Delgoffe GM (2018). Early TCR Signaling Induces Rapid Aerobic Glycolysis Enabling Distinct Acute T Cell Effector Functions. Cell Rep. 22, 1509–1521. [DOI] [PMC free article] [PubMed] [Google Scholar]
- Morgan MJ, and Liu ZG (2011). Crosstalk of reactive oxygen species and NF-κB signaling. Cell Res. 21, 103–115. [DOI] [PMC free article] [PubMed] [Google Scholar]
- Murphy MP, and Siegel RM (2013). Mitochondrial ROS fire up T cell activation. Immunity 38, 201–202. [DOI] [PubMed] [Google Scholar]
- Nakaya M, Xiao Y, Zhou X, Chang JH, Chang M, Cheng X, Blonska M, Lin X, and Sun SC (2014). Inflammatory T cell responses rely on amino acid transporter ASCT2 facilitation of glutamine uptake and mTORC1 kinase activation. Immunity 40, 692–705. [DOI] [PMC free article] [PubMed] [Google Scholar]
- Nunnari J, and Suomalainen A (2012). Mitochondria: in sickness and in health. Cell 148, 1145–1159. [DOI] [PMC free article] [PubMed] [Google Scholar]
- O’Sullivan D, van der Windt GJ, Huang SC, Curtis JD, Chang CH, Buck MD, Qiu J, Smith AM, Lam WY, DiPlato LM, et al. (2014). Memory CD8(+) T cells use cell-intrinsic lipolysis to support the metabolic programming necessary for development. Immunity 41, 75–88. [DOI] [PMC free article] [PubMed] [Google Scholar]
- Overwijk WW, Theoret MR, Finkelstein SE, Surman DR, de Jong LA, Vyth-Dreese FA, Dellemijn TA, Antony PA, Spiess PJ, Palmer DC, et al. (2003). Tumor regression and autoimmunity after reversal of a functionally tolerant state of self-reactive CD8+ T cells. J. Exp. Med 198, 569–580. [DOI] [PMC free article] [PubMed] [Google Scholar]
- Patsoukis N, Bardhan K, Weaver J, Herbel C, Seth P, Li L, and Boussiotis VA (2016). The role of metabolic reprogramming in T cell fate and function. Curr. Trends Immunol. 17, 1–12. [PMC free article] [PubMed] [Google Scholar]
- Pearce EL, Poffenberger MC, Chang CH, and Jones RG (2013). Fueling immunity: insights into metabolism and lymphocyte function. Science 342, 1242454.24115444 [Google Scholar]
- Peng M, Yin N, Chhangawala S, Xu K, Leslie CS, and Li MO (2016). Aerobic glycolysis promotes T helper 1 cell differentiation through an epigenetic mechanism. Science 354, 481–484. [DOI] [PMC free article] [PubMed] [Google Scholar]
- Pollak N, Niere M, and Ziegler M (2007). NAD kinase levels control the NADPH concentration in human cells. J. Biol. Chem 282, 33562–33571. [DOI] [PubMed] [Google Scholar]
- Pope C, Kim SK, Marzo A, Masopust D, Williams K, Jiang J, Shen H, and Lefrançois L (2001). Organ-specific regulation of the CD8 T cell response to Listeria monocytogenes infection. J. Immunol 166, 3402–3409. [DOI] [PubMed] [Google Scholar]
- Ratledge C (2014). The role of malic enzyme as the provider of NADPH in oleaginous microorganisms: a reappraisal and unsolved problems. Biotechnol. Lett 36, 1557–1568. [DOI] [PubMed] [Google Scholar]
- Scharping NE, Menk AV, Moreci RS, Whetstone RD, Dadey RE, Watkins SC, Ferris RL, and Delgoffe GM (2016). The Tumor Microenvironment Represses T Cell Mitochondrial Biogenesis to Drive Intratumoral T Cell Metabolic Insufficiency and Dysfunction. Immunity 45, 701–703. [DOI] [PubMed] [Google Scholar]
- Sena LA, Li S, Jairaman A, Prakriya M, Ezponda T, Hildeman DA, Wang CR, Schumacker PT, Licht JD, Perlman H, et al. (2013). Mitochondria are required for antigen-specific T cell activation through reactive oxygen species signaling. Immunity 38, 225–236. [DOI] [PMC free article] [PubMed] [Google Scholar]
- Sinclair LV, Rolf J, Emslie E, Shi YB, Taylor PM, and Cantrell DA (2013). Control of amino-acid transport by antigen receptors coordinates the metabolic reprogramming essential for T cell differentiation. Nat. Immunol 14, 500–508. [DOI] [PMC free article] [PubMed] [Google Scholar]
- Song Z, Chen H, Fiket M, Alexander C, and Chan DC (2007). OPA1 processing controls mitochondrial fusion and is regulated by mRNA splicing, membrane potential, and Yme1L. J. Cell Biol. 178, 749–755. [DOI] [PMC free article] [PubMed] [Google Scholar]
- Stincone A, Prigione A, Cramer T, Wamelink MM, Campbell K, Cheung E, Olin-Sandoval V, Grüning NM, Krüger A, Tauqeer Alam M, et al. (2015). The return of metabolism: biochemistry and physiology of the pentose phosphate pathway. Biol. Rev. Camb. Philos. Soc 90, 927–963. [DOI] [PMC free article] [PubMed] [Google Scholar]
- Sukumar M, Liu J, Ji Y, Subramanian M, Crompton JG, Yu Z, Roychoudhuri R, Palmer DC, Muranski P, Karoly ED, et al. (2013). Inhibiting glycolytic metabolism enhances CD8+ T cell memory and antitumor function. J. Clin. Invest 123, 4479–4488. [DOI] [PMC free article] [PubMed] [Google Scholar]
- van der Windt GJ, Everts B, Chang CH, Curtis JD, Freitas TC, Amiel E, Pearce EJ, and Pearce EL (2012). Mitochondrial respiratory capacity is a critical regulator of CD8+ T cell memory development. Immunity 36, 68–78. [DOI] [PMC free article] [PubMed] [Google Scholar]
- Wise DR, Ward PS, Shay JE, Cross JR, Gruber JJ, Sachdeva UM, Platt JM, DeMatteo RG, Simon MC, and Thompson CB (2011). Hypoxia promotes isocitrate dehydrogenase-dependent carboxylation of α-ketoglutarate to citrate to support cell growth and viability. Proc. Natl. Acad. Sci. USA 108, 19611–19616. [DOI] [PMC free article] [PubMed] [Google Scholar]
Associated Data
This section collects any data citations, data availability statements, or supplementary materials included in this article.
Supplementary Materials
Data Availability Statement
The RNA-seq dataset referenced in this paper has been deposited to NCBI BioSample (BioSample Accession # PRJNA700438).