Summary
Ferroptosis, an iron-dependent, non-apoptotic cell death program, is involved in various degenerative diseases and represents a targetable vulnerability in certain cancers1. The ferroptosis-susceptible cell state can either preexist in cells arising from certain lineages or be acquired during cell-state transitions2–5. Precisely how ferroptosis susceptibility is dynamically regulated remains poorly understood. Using genome-wide CRISPR/Cas9 suppressor screens, we identify the peroxisome organelle as a critical contributor to ferroptosis sensitivity in human renal and ovarian carcinoma cells. By lipidomic profiling, we show that peroxisomes contribute to ferroptosis through the synthesis of polyunsaturated ether phospholipids (PUFA-ePLs), an understudied lipid class that provides substrates for lipid peroxidation, resulting in turn in induction of ferroptosis. Moreover, carcinoma cells that are initially sensitive to ferroptosis can switch to a ferroptosis-resistant state in vivo, a state associated with extensive PUFA-ePL downregulation. We further find that the pro-ferroptotic role of PUFA-ePLs can be extended beyond neoplastic cells to other cell types, including normal neurons and cardiomyocytes. Together, our work reveals important roles for the peroxisome–ether phospholipid axis in driving ferroptosis susceptibility and evasion, highlights PUFA-ePL as a distinct functional lipid group that is dynamically regulated during cell-state transitions, and suggests multiple regulatory nodes for therapeutic interventions in diseases involving ferroptosis.
The molecular and metabolic basis underlying the dynamic regulation of ferroptosis sensitivity is poorly understood. To identify factors that modulate susceptibility to ferroptosis, we performed two independent genome-wide CRISPR/Cas9 suppressor screens in the ferroptosis-susceptible clear-cell renal cell carcinoma (ccRCC) model 786-O3 and the high-grade serous ovarian carcinoma model OVCAR-8 (Fig. 1a). In both models, ferroptosis is induced via inhibition of the lipid peroxidation repair enzyme glutathione peroxidase 4 (GPX4) using either ML210 or 1S,3R-RSL3 (RSL3)3,6,7 (Supplementary Video 1). Both screens uncovered known ferroptosis regulators, including acyl-CoA synthetase long-chain family member 4 (ACSL4)8 (Fig. 1b, Extended Data Fig. 1a-b, Supplementary Dataset 1), confirming the robustness of our screens for identifying mediators of ferroptosis sensitivity.
Figure 1. Genome-wide CRISPR screens identify peroxisome components as contributors for ferroptosis susceptibility.
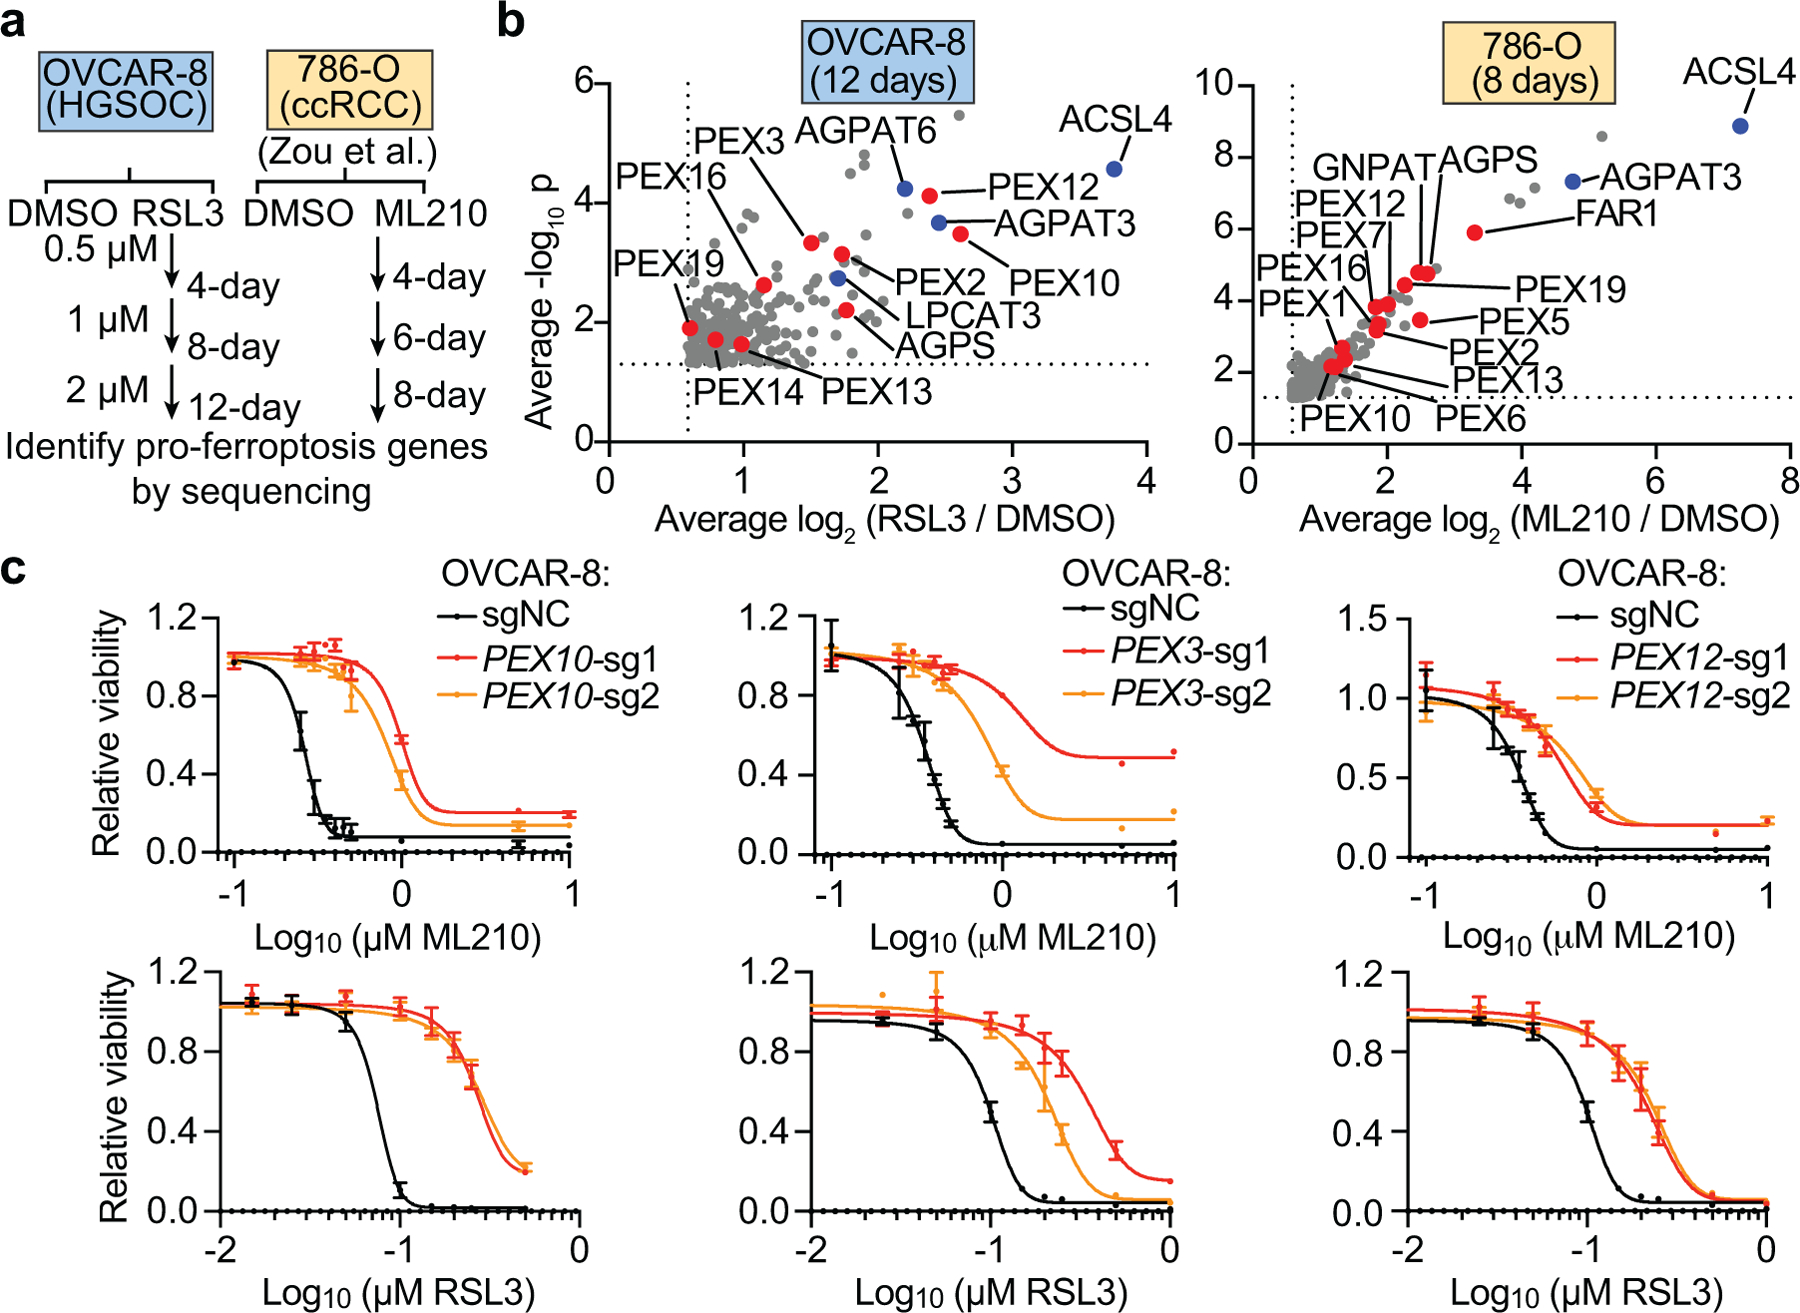
a. Schematic diagram summarizing the CRISPR screens in OVCAR-8 and 786-O cells to identify ferroptosis regulators. HGSOC, high grade serous ovarian carcinoma; ccRCC, clear-cell renal cell carcinoma; ML210 and RSL3, covalent small molecule inhibitors of glutathione peroxidase 4 (GPX4) and inducers of ferroptosis.
b. Volcano plots showing the top genes in 12-day RSL3-treated OVCAR-8 (left) and 8-day ML210-treated 786-O (right) cells. For presentation purposes, only genes enriched in the RSL3 or ML210 treated condition for ≥ 1.5 fold (log2 fold change ≥ 0.585) are plotted. Blue highlights lipid synthesis genes; red highlights peroxisome genes. See Methods for data analysis methods.
c. Viability curves of OVCAR-8 cells expressing a non-targeting negative control sgRNA (sgNC) or sgRNAs targeting PEX10, PEX3, or PEX12 and being treated with indicated concentrations of ML210 or RSL3 for 72 h. n=3 biologically independent samples. Data center and error bars indicate mean±s.d.. Representative results of experiments performed in triplicate.
Among the previously uncharacterized pro-ferroptotic genes, peroxisome components emerged as the most enriched gene cluster using both STRING, a protein network database9 and a new pathway analysis algorithm we developed named Gene-List Network Enrichment Analysis (GeLiNEA) (Extended Data Fig. 1a-e, Supplementary Dataset 2). Peroxisomal genes identified in both screens include peroxisomal biogenesis genes PEX10 and PEX310,11, and the peroxisomal enzymes alkylglycerone phosphate synthase (AGPS) and fatty acyl-CoA reductase 1 (FAR1)12; other peroxisomal genes, including glycerone-phosphate O-acyltransferase (GNPAT), PEX12 and PEX7, also appeared as significant hits in each individual condition (Fig. 1b, Extended Data Fig. 1a-b,f-g).
We focused on elucidating the possible role of peroxisomes in ferroptosis, since these understudied organelles had not previously been implicated in ferroptotic cell death. Our findings indicate that depleting PEX3, PEX10, and PEX12 in both OVCAR-8 and 786-O cells using CRISPR/Cas9, reduced peroxisome abundances and diminished sensitivity to GPX4 inhibition-induced ferroptosis (Fig. 1c, Extended Data Fig. 2a-d). Conversely, experimental overexpression of murine Pex3 or Pex10 cDNAs resistant to the corresponding human sgRNAs restored this reduced sensitivity to ferroptosis (Extended Data Fig. 2e-f), supporting peroxisomes as contributors to ferroptosis susceptibility in renal and ovarian carcinoma cells.
Among other biochemical functions, peroxisomes detoxify cytosolic reactive oxygen species and initiate degradation of very long-chain and branched-chain fatty acids11. In addition, peroxisomes participate in the biosynthesis of ether-linked glycerolipids, which possess an ether-linkage at the glycerol sn-1 position, unlike ester-linked diacyl-glycerolipids (R1CH2CO2CH2R2) (Fig. 2a, Extended Data Fig. 3a). In more detail, ether phospholipids contain two subtypes: 1-O-alkyl-(R1CH2CH2OCH2R2) and 1-O-alkenyl-glycerophospholipids (the latter known as plasmalogens, R1CH=CHOCH2R2)12. Most plasmalogens possess an ester-linked polyunsaturated fatty acyl (PUFA) chain at the sn-2 position12 (Fig. 2a). Consistent with peroxisome’s lipid synthesis function, lipidomic profiling revealed selective loss of ether glycerolipids in both PEX3- and PEX10-depleted cells; this reduction is most prominent in polyunsaturated ether phospholipids (PUFA-ePLs), which are presumably largely plasmalogens (Fig. 2b, Extended Data Fig. 3b, Supplementary Datasets 3-4).
Figure 2. The polyunsaturated ether lipid biosynthesis pathway mediates the pro-ferroptotic roles of peroxisomes.
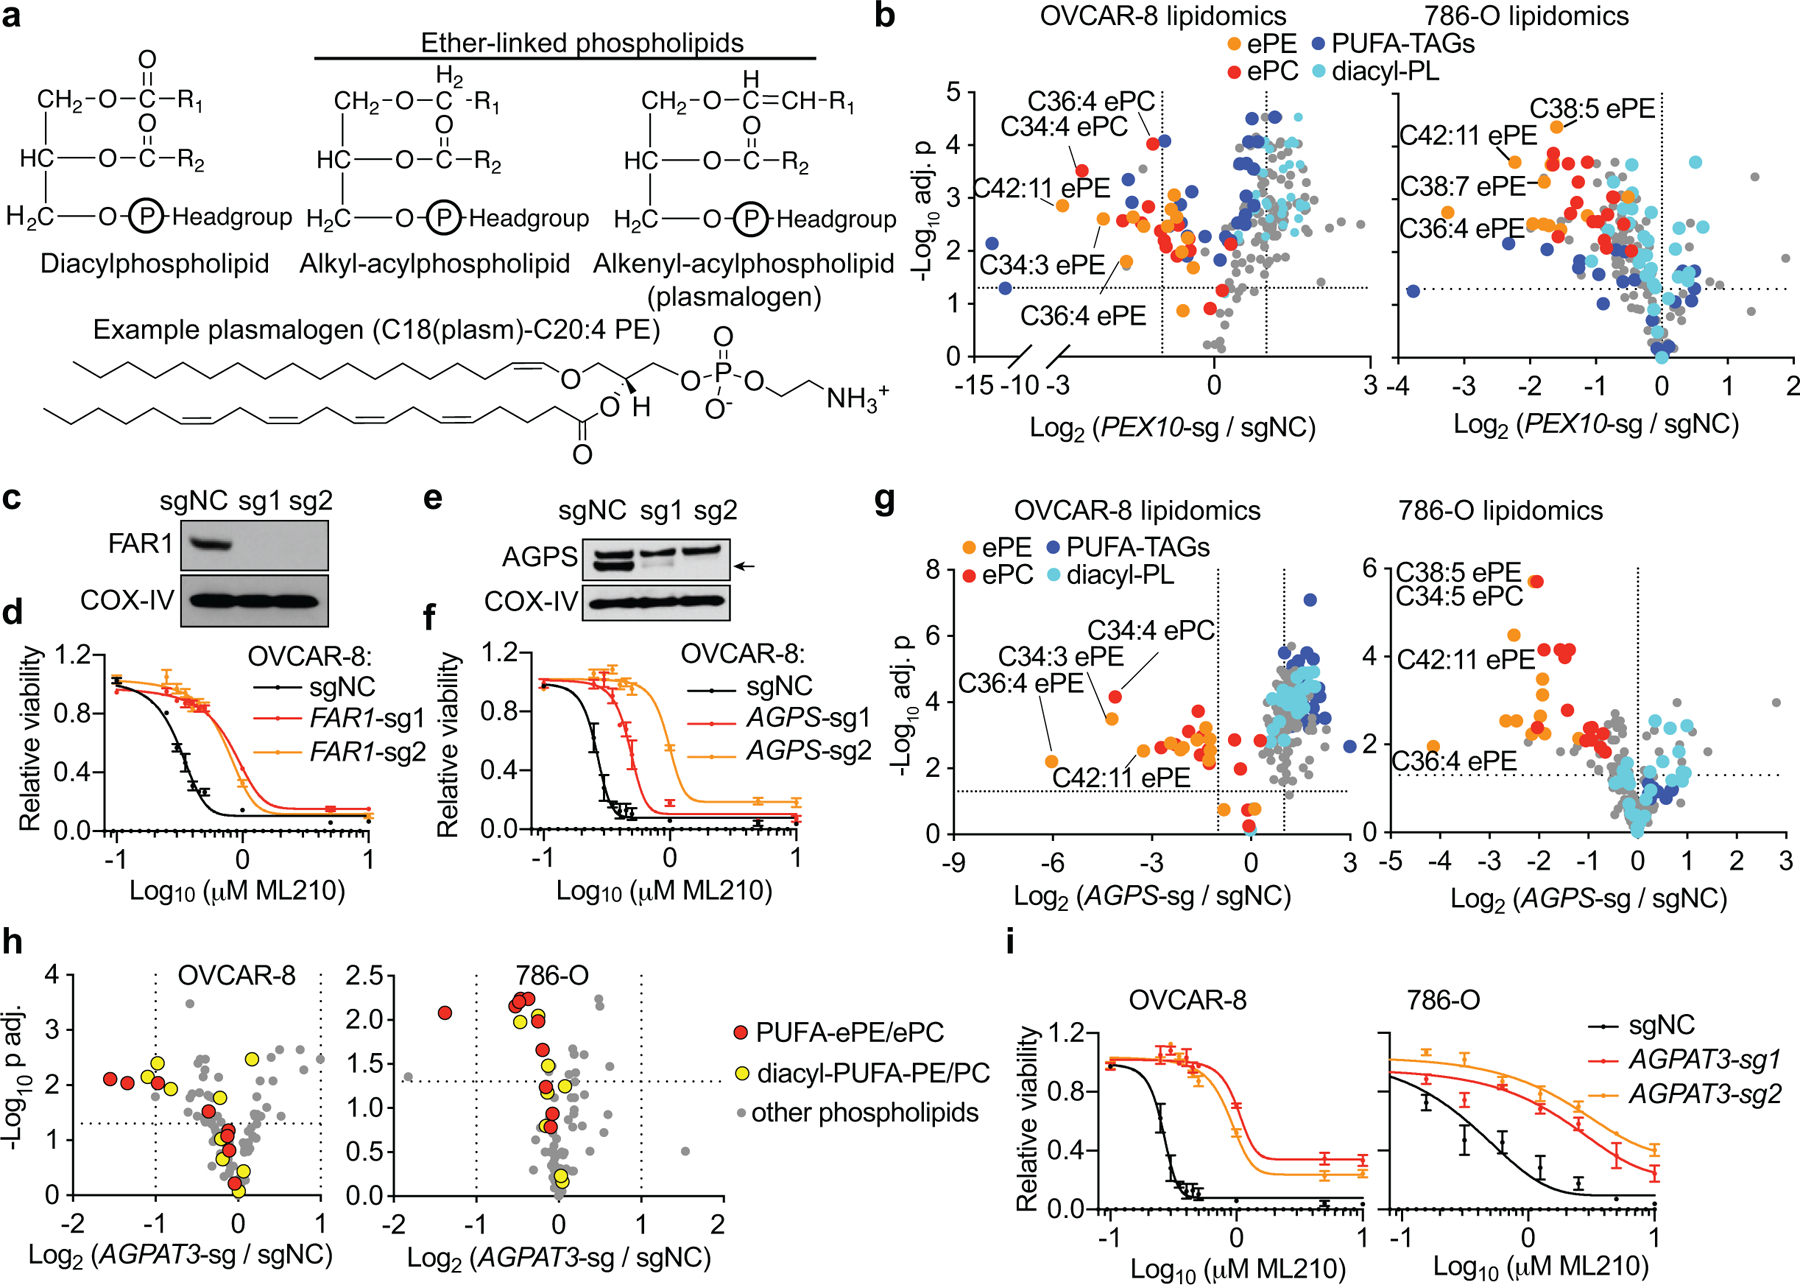
a. Schematic diagram showing the distinct structures of diacyl- and two subtypes of ether-linked phospholipids. Bottom, the chemical structure of an example plasmalogen, C18(plasm)-C20:4 PE.
b. Volcano plots showing the lipidomic analysis of OVCAR-8 and 786-O cells expressing sgNC or PEX10-targeting sgRNAs. n=3 biologically independent samples.
c. Immunoblot showing FAR1 protein levels in OVCAR-8 cells expressing negative control (sgNC) or FAR1-targeting sgRNAs.
d. Viability curves of OVCAR-8 cells expressing non-targeting negative control sgRNA (sgNC) or FAR1-targeting sgRNAs treated with ML210 for 72 h. n=3 biologically independent samples.
e. Immunoblot showing AGPS protein levels in OVCAR-8 cells expressing sgNC or AGPS-targeting sgRNAs. Arrow indicates the AGPS protein band.
f. Viability curves of OVCAR-8 cells expressing sgNC or AGPS-targeting sgRNAs treated with ML210 for 72 h. n=3 biologically independent samples.
g. Volcano plots showing the lipidomics results of OVCAR-8 and 786-O cells expressing sgNC or AGPS-targeting sgRNAs. n=3 biologically independent samples.
h. Volcano plots showing the changes in the phospho-lipidome in OVCAR-8 and 786-O cells expressing sgNC or AGPAT3-targeting sgRNA. n=3.
i. Viability curves of AGPAT3-depleted cells treated with ML210. n=3 (OVCAR-8) or n=4 (786-O) biologically independent samples.
Immunoblots in c, e are representative data from experiments performed twice. COX-IV was used as a loading control. See Supplementary Information for uncropped immunoblot images. Viability curves are representative data from experiments performed in triplicate, and data center and error bars indicate mean±s.d.. Two-tailed Student’s T test was used in calculating p values in volcano plots. Multiple-testing adjustment was performed using the Benjamini-Hochberg method. Abbreviations: ePE, ether-linked phosphatidylethanolamine; ePC, ether-linked phosphatidylcholine; PUFA-, polyunsaturated fatty acyl-; TAG, triacylglycerol; PL, phospholipids.
Since AGPS and FAR1 – two peroxisome-associated enzymes that catalyze ether lipid biosynthesis – also emerged as top hits in both CRISPR screens, we hypothesized that ether lipid biosynthesis is integral to peroxisomes’ pro-ferroptotic functions. Indeed, CRISPR/Cas9-mediated AGPS- or FAR1-depletion in bulk or single-cell clones recapitulated the ferroptosis-resistance phenotype and concomitant changes in ether phospholipids observed upon peroxisome-depletion (Fig. 2c-g, Extended Data Fig. 3c-m, 4a-e, Supplementary Datasets 3-4). The specificity of the CRISPR/Cas9 knockout procedure was verified by reversal of these phenotypes through introduction of sgRNA-resistant Agps/Far1 cDNAs into these cells (Extended Data Fig. 5a-c). The pro-ferroptotic roles of the ether lipid biosynthesis pathway were further confirmed by ectopic cDNA overexpression in wildtype cells, shRNA-mediated gene knockdown, and an AGPS small-molecule inhibitor13 (Extended Data Fig. 5d-h). In contrast, knockout of two peroxisomal enzymes unrelated to ether lipid synthesis – superoxide dismutase 1 (SOD1) and catalase (CAT) – did not alter ferroptosis sensitivity (Extended Data Fig. 5i-k), supporting that the pro-ferroptotic role of peroxisomes is specifically mediated by ether lipid biosynthesis.
Importantly, depletion of either peroxisomes or ether lipids also reduced ferroptosis sensitivity in GPX4-dependent HuH-7 hepatocellular carcinoma and SNU-685 endometrial carcinoma cells14 (Extended Data Fig. 6a-e). Moreover, analysis of prior lipidomics data revealed that ccRCC tumors, a ferroptosis-susceptible cancer type3, exhibit higher levels of polyunsaturated-ePLs and increased AGPS expression relative to normal kidney tissues15 (Extended Data Fig. 6f). These analyses suggest that the pro-ferroptotic role of the ether lipid biosynthesis pathway may be applicable to other carcinoma cell types and to human cancers.
Of note, the loss of ether phospholipids in peroxisome-depleted cells occurred without significant changes in protein levels of either ACSL4 or lysophosphatidylcholine acyltransferase 3 (LPCAT3) – rate-limiting enzymes in the biosynthesis of most cellular polyunsaturated lipids8,16 (Extended Data Fig. 7a-b). Co-deleting ACSL4 together with peroxisome/ether lipid biosynthesis genes led to further protection against ferroptosis – similar to the effect conferred by the ferroptosis inhibitor ferrostatin-1 (Fer-1) (Extended Data Fig. 7c-d). These observations implicate non-peroxisome-derived PUFA-lipids in ferroptosis, and point toward a potential combinatorial strategy involving inhibition of both ACSL4 and PUFA-ePL biosynthesis enzymes in order to block ferroptosis.
Ether lipid biosynthesis is performed by functional collaboration of peroxisomes with the endoplasmic reticulum (ER)11. Within peroxisomes, the FAR1, GNPAT, and AGPS enzymes act to synthesize the ether lipid precursor, 1-O-alkyl-glycerol-3-phosphate (AGP)17. AGP is then dispatched to the ER, where it is acylated at the sn-2 position of glycerol, head groups are added to the sn-3 position and, in the case of plasmalogens, a double bond is introduced to create an alkenyl-ether linkage11,17–19. While PUFA addition at the sn-2 position is critical for synthesizing ferroptosis-relevant ether lipids, the identities of the ER enzyme(s) mediating this process remain(s) unknown. In fact, we identified the ER-resident enzyme 1-acylglycerol-3-phosphate O-acyltransferase 3 (AGPAT3) as a hit in both CRISPR screens (Fig. 1b, Extended Data Fig. 1a-b,f-g). AGPAT3 was also a pro-ferroptotic hit in a CRISPR screen in human haploid KBM7 cells16. Importantly, AGPAT3 has been reported to selectively incorporate arachidonic acid/docosahexaenoic acid into lysophosphatidic acids, leading to diacyl PUFA-phosphatidic acid synthesis20. However, whether AGPAT3 also contributes to AGP acylation and PUFA-ePL biosynthesis is unknown.
Using lipidomic analysis, we found that AGPAT3-depletion selectively reduced the levels of the polyunsaturated species among both ether-linked and diacyl-phospholipids (Fig. 2h, Extended Data Fig. 7e, Supplementary Dataset 3,5). Consistently, genetic AGPAT3-depletion suppressed sensitivity to ferroptosis (Fig. 2i, Extended Data Fig. 7f-j), confirming AGPAT3’s pro-ferroptotic role. Moreover, expression of a CRISPR-resistant, wild-type Agpat3 cDNA restored ferroptosis sensitivity in AGPAT3-depleted cells, while the catalytically-dead Agpat3E176A mutant20 failed to do so (Extended Data Fig. 7k-l). These results suggest that AGPAT3 functions downstream of the peroxisomal pathway to synthesize PUFA-ePLs in the ER (Extended Data Fig. 8a).
To confirm that PUFA-ePLs are necessary and sufficient to induce ferroptosis sensitization, we used nanoparticles to deliver various diacyl and ether phospholipids to cells (Extended Data Fig. 8b). Among the ethanolamine-containing phospholipids, application of either C18(plasm)-C20:4PE, C18(plasm)-C22:6PE or C18:0-C20:4PE, but not C18(plasm)-C18:1PE, led to ferroptosis sensitization in OVCAR-8 cells (Extended Data Fig. 8c). Among the choline-containing phospholipids, C18(plasm)-C20:4PC, but not C18:0-C20:4PC or C18(plasm)-C18:1PC, exhibited significant ferroptosis sensitization activity, whereas both C18(plasm)-C22:6PC and C16(-O-)-C20:4PC showed intermediate effects (Extended Data Fig. 8d-e). Similar effects were observed in the PEX3-, PEX10- or AGPS-depleted OVCAR-8 and 786-O cells (Extended Data Fig. 8c-d). Taken together, these results suggest that the presence of the PUFA chain, but not the alkenyl-ether group, is critical to ferroptosis sensitization.
To rule out the possibility that intracellular conversion of the applied PUFA-ePLs to other phospholipids following uptake may underlie their ferroptosis-sensitizing abilities, we assessed lipid peroxidation levels using time-lapse imaging of BODIPY-C11 oxidation in GPX4-inhibited cells immediately after nanoparticle administration. This analysis showed that both C18:0-C20:4PE and C18(plasm)-C20:4PE induced a rapid increase in lipid peroxidation within 10 mins of addition, whereas C18(plasm)-C20:4PC induced slightly higher peroxidation levels than C18:0-C20:4PC (Extended Data Fig. 9a-e). These data imply that PUFA-plasmalogens are indeed oxidized in GPX4-inhibited cells. This conclusion is supported by the modest reduction in PUFA-ePE/ePC levels in cells treated with ML210 even for periods as brief as 90 min, a treatment that leaves cells in a viable state even though they experience significant lipid peroxidation-induced phospholipid hydrolysis3,21 (Extended Data Fig. 9f, Supplementary Dataset 6).
We proceeded to assess whether peroxisomes also promote sensitivity to ferroptosis in vivo. Without GPX4 inhibitors that are suitable for in vivo use, we generated GPX4−/− OVCAR-8 and 786-O cells that depend on Fer-1 to maintain their viability3,5. In contrast to GPX4−/− cells expressing non-targeting negative control sgRNAs (sgNC), which undergo rapid ferroptosis in the absence of Fer-1, GPX4−/− cells that are also depleted of either PEX3, PEX10, AGPS or FAR1 exhibited significant viability in vitro (Fig. 3a, Extended Data Fig. 10a). When implanted into immunocompromised mice, GPX4+/+ cells rapidly established tumors, whereas GPX4−/−-sgNC tumor formation was significantly delayed, ostensibly because these cells experienced ferroptosis in vivo; however, cells that suffer concomitant deletion of GPX4 and either AGPS, FAR1, PEX3, or PEX10 genes formed significantly larger tumors than GPX4−/−-sgNC cells by week 6 (Fig. 3b). These results suggest that the peroxisome-ether lipid axis contributes to ferroptosis sensitivity both in vitro and in vivo. Notably, our data indicate that AGPS, FAR1, PEX3, or AGPAT3-depleted cancer cells can grow robustly in vitro and in vivo (Fig. 3a-b, Extended Data Fig. 10b-e). These results suggest that ether phospholipids are dispensable for primary renal and ovarian carcinoma growth, while their enrichment confers a vulnerability to ferroptosis.
Figure 3. Cancer cells initially dependent on GPX4 downregulate polyunsaturated ether phospholipids to evade ferroptosis.
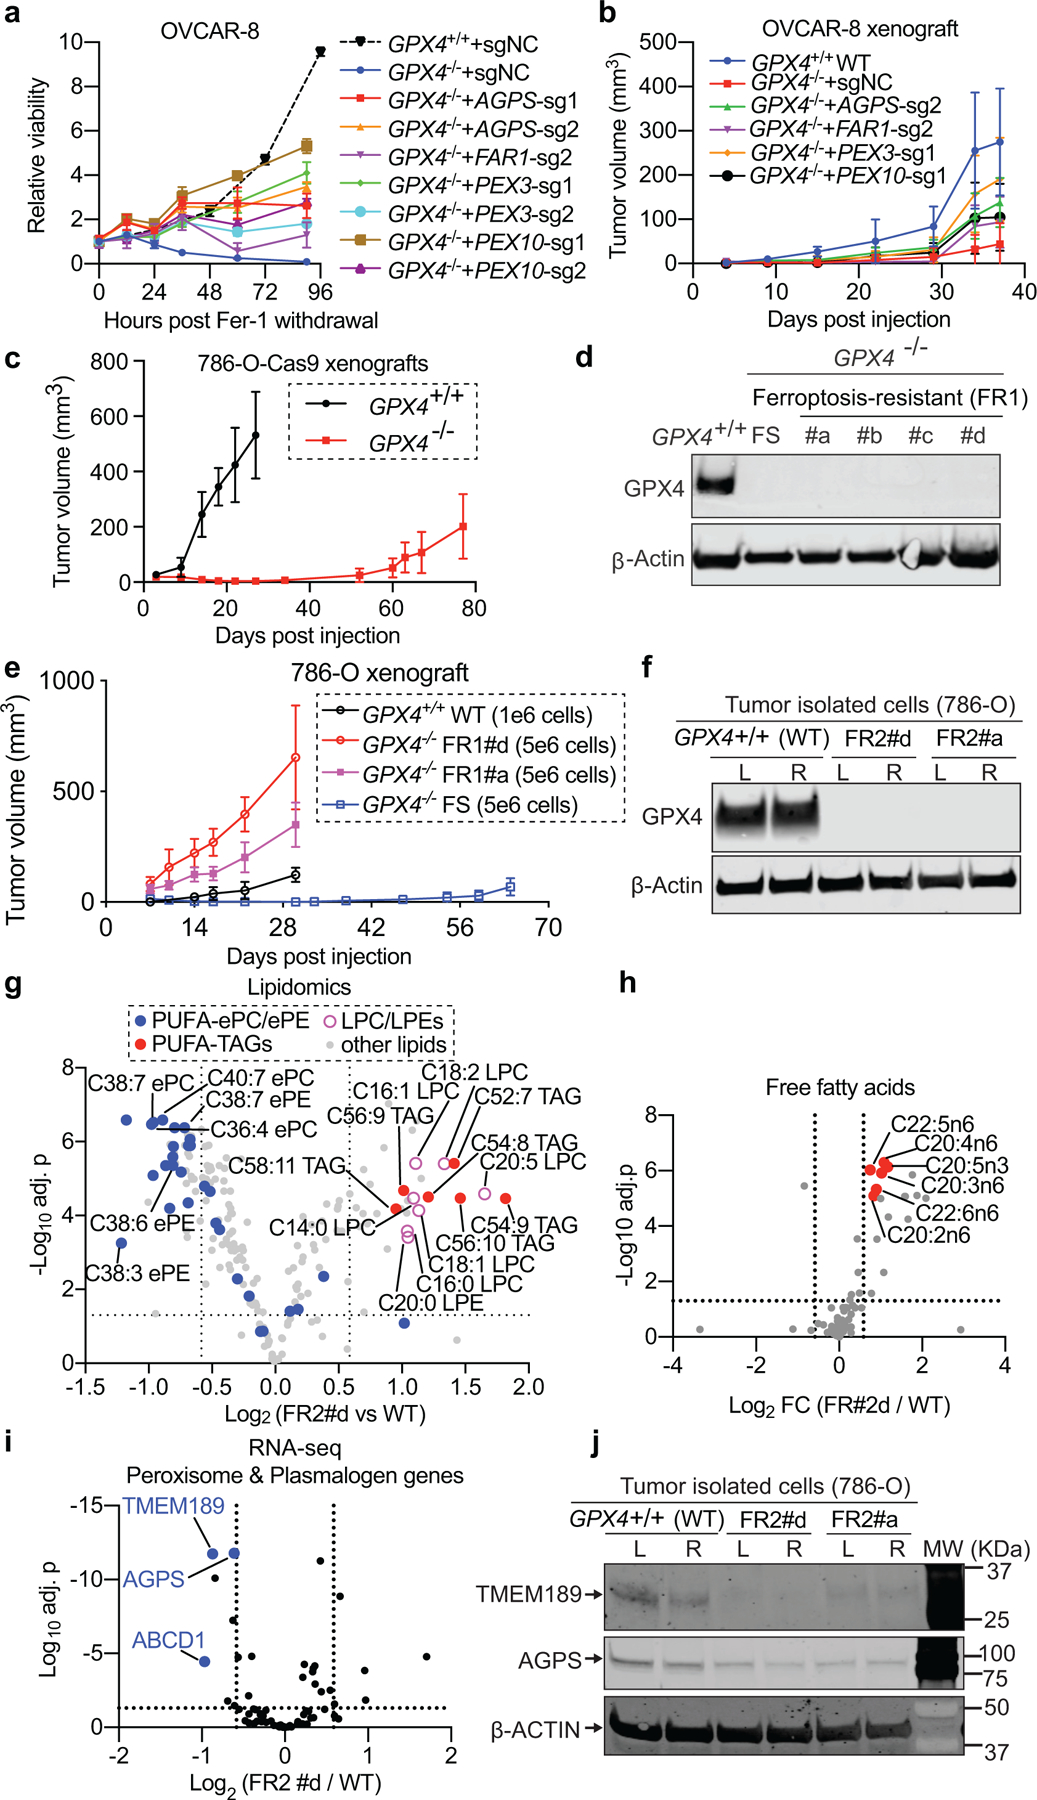
a. Relative viability of indicated OVCAR-8 cells following ferrostatin-1 (Fer-1) withdrawal. n=8 biologically independent samples. GPX4+/+-sgNC (black dash curve) was analyzed independently and included as a reference. P values for 90-hour viability of GPX4−/− derivatives: GPX4−/−-sgNC vs GPX4−/−-AGPS-sg1, p=9.07x10e-8; vs -AGPS-sg2, p=9.66x10e-15; vs -FAR1-sg2, p=3.79x10e-5; vs -PEX3-sg1, p=5.9x10e-12; vs -PEX3-sg2, p=2.92×10e-17; vs -PEX10-sg1, p=1.99x10e-16; vs -PEX10-sg2, p=3.53x10e-13.
b. Tumor growth rates of indicated OVCAR-8 xenografts. GPX4−/−-sgNC: n=8 mice, other conditions: n=5 mice. P values for day-37 tumor sizes: GPX4+/+ vs GPX4−/−-sgNC, p=4.03x10e-7. GPX4−/−-sgNC vs -AGPS-sg2, p=0.000115; vs -FAR1-sg2, p=0.0446; vs -PEX3-sg1, p=0.0000213; vs -PEX10-sg1, p=0.0197.
c. Tumor growth rates of indicated 786-O xenografts. n=5 mice. For day-27 tumors, GPX4+/+ vs GPX4−/−, p=1.4×10e-8.
d. Immunoblot showing GPX4 protein levels in GPX4+/+ 786-O, the original ferroptosis-sensitive (FS) GPX4−/− clone, and the first round of ferroptosis-resistant (FR1) cells.
e. Tumor growth curves of indicated 786-O xenografts. n=5 mice. P values for day-30 tumors, GPX4−/− FR1#a vs FS, p=1.96x10e-8; GPX4−/− FR1#d vs FS, p=3.42×10e-7.
f. Immunoblot showing GPX4 protein levels in FR2 cells. FR2#a: from a FR1#a tumor; FR2#d: from a FR1#d tumor. L/R, left/right tumor.
g. Volcano plot showing the lipidomic analysis comparing GPX4−/− FR2#d and GPX4+/+ 786-O cells. LPE, lysophosphatidylethanolamine; LPC, lysophosphatidylcholine; TAG, triacylglycerol; PUFA-, polyunsaturated fatty acyl-. n=6 biologically independent samples.
h. Volcano plot showing the free fatty acid lipidomic analysis comparing GPX4−/− FR2#d and GPX4+/+ 786-O cells. n=6 biologically independent samples.
i. Volcano plots showing the relative mRNA expression (RNA-seq) of peroxisome and ether-lipid metabolism-related genes comparing indicated conditions. n=4 biologically independent samples. See Methods for data analysis methods.
j. Immunoblotting showing TMEM189 and AGPS protein levels in indicated cells.
For immunoblots, β-ACTIN was used as a loading control. a,c,d,f,j, representative results of experiments performed twice. See Supplementary Information for uncropped immunoblot images. Data center and error bars: mean±s.d.. P-values were calculated using two-tailed Student’s T-test. Multiple-testing adjustment was performed using the Benjamini-Hochberg method. Two tumors were injected per mouse in animal experiments.
We also investigated whether cancer cells would be able to evolve strategies to evade experimentally induced ferroptosis. In fact, we observed that in both OVCAR-8 and 786-O tumor xenografts, the ferroptosis-vulnerable GPX4−/− cells initially appeared unable to colonize the mice3; however, large tumor nodules emerged after a latency period (Fig. 3b-c). We successfully isolated cancer cells from the emerging 786-O tumors, and confirmed that these cells remained GPX4-null (Fig. 3d). Re-implantation of these apparently ferroptosis-resistant (FR1) cells into mice led to robust tumor outgrowth without significant latency (Fig. 3e), implying that FR1 cells had acquired cell-heritable traits that rendered them insensitive to GPX4-depletion.
To explore the mechanisms underlying the observed in vivo ferroptosis evasion, we performed metabolomics and lipidomics in cells (termed FR2) isolated from the tumors formed by the GPX4−/− FR1 cells, and found that PUFA-ePLs were the most significantly downregulated lipids in FR2 cells relative to cells from parental, ferroptosis-susceptible tumors (Fig. 3f-h, Extended Data Fig. 10f-h, Supplementary Dataset 7). These results imply that ccRCC cells can modulate their PUFA-ePL levels and that this biochemical plasticity may facilitate ferroptosis evasion in vivo.
To assess whether the observed PUFA-ePL downregulation might be driven by defective peroxisome biogenesis, we characterized peroxisome abundances in FR2 cells but failed to detect significant changes (Extended Data Fig. 10i). In addition, Exome-seq revealed only one non-synonymous somatic mutation in FR2 cells: a small frame-shift deletion in TLR7, which was not a hit in our CRISPR screens and has no reported ferroptosis-relevant functions (Supplementary Dataset 8). However, RNA-seq uncovered that among 87 known peroxisome and ether lipid biosynthesis genes, AGPS and TMEM189 were significantly downregulated in FR2 cells, a loss that was validated at the protein level (Fig. 3i-j, Extended Data Fig. 10j-k, Supplementary Dataset 8). Expression levels of other known ferroptosis modulators, including ACSL4, LPCAT3 and AIFM2 (FSP1)22,23, were not significantly altered (Extended Data Fig. 10k-l).
The TMEM189 gene encodes a 1-O-alkyl-PE desaturase that converts 1-O-alkyl ethers into 1-O-alkenyl ethers24 and represents a co-dependency with ACSL4, PEX3, and FAR1 in the Cancer Dependency Map25 (Extended Data Fig. 11a). However, TMEM189 did not register as a significant hit in our CRISPR screens. In addition, perturbing TMEM189 levels by CRISPR/Cas9, shRNA or cDNA did not significantly alter ferroptosis sensitivity (Extended Data Fig. 11b-g), implying that the pro-ferroptotic role of PUFA-ePLs is independent of the double bond present in the alkenyl-ether linkage. In contrast, we found that AGPS inactivation, which depletes both 1-O-alkyl- and 1-O-alkenyl-lipids, is sufficient to restore growth of GPX4−/− tumors, leading us to conclude that the spontaneous downregulation of AGPS (but not TMEM189) contributed to the observed emergence of ferroptosis resistance.
We then explored whether the ferroptosis-sensitizing role of PUFA-ePLs is relevant in non-neoplastic settings. We chose to look at neurons and cardiomyocytes, which are major cell types from the brain and heart – vital organs that exhibit high ePL levels18 and have been reported to undergo ferroptosis under pathological conditions26,27. In the SH-SY5Y neuronal differentiation model28, we found that differentiated neurons exhibited higher sensitivity to GPX4 inhibition-induced lipid peroxidation and ferroptosis than the parental cells, a difference associated with upregulated PUFA-ePE/ePCs in the neurons (Fig. 4a-c, Extended Data Fig. 12a-e, Supplementary Dataset 9).
Figure 4. Neurons and cardiomyocytes acquire increased polyunsaturated ether phospholipids and gain sensitivity to ferroptosis during differentiation.
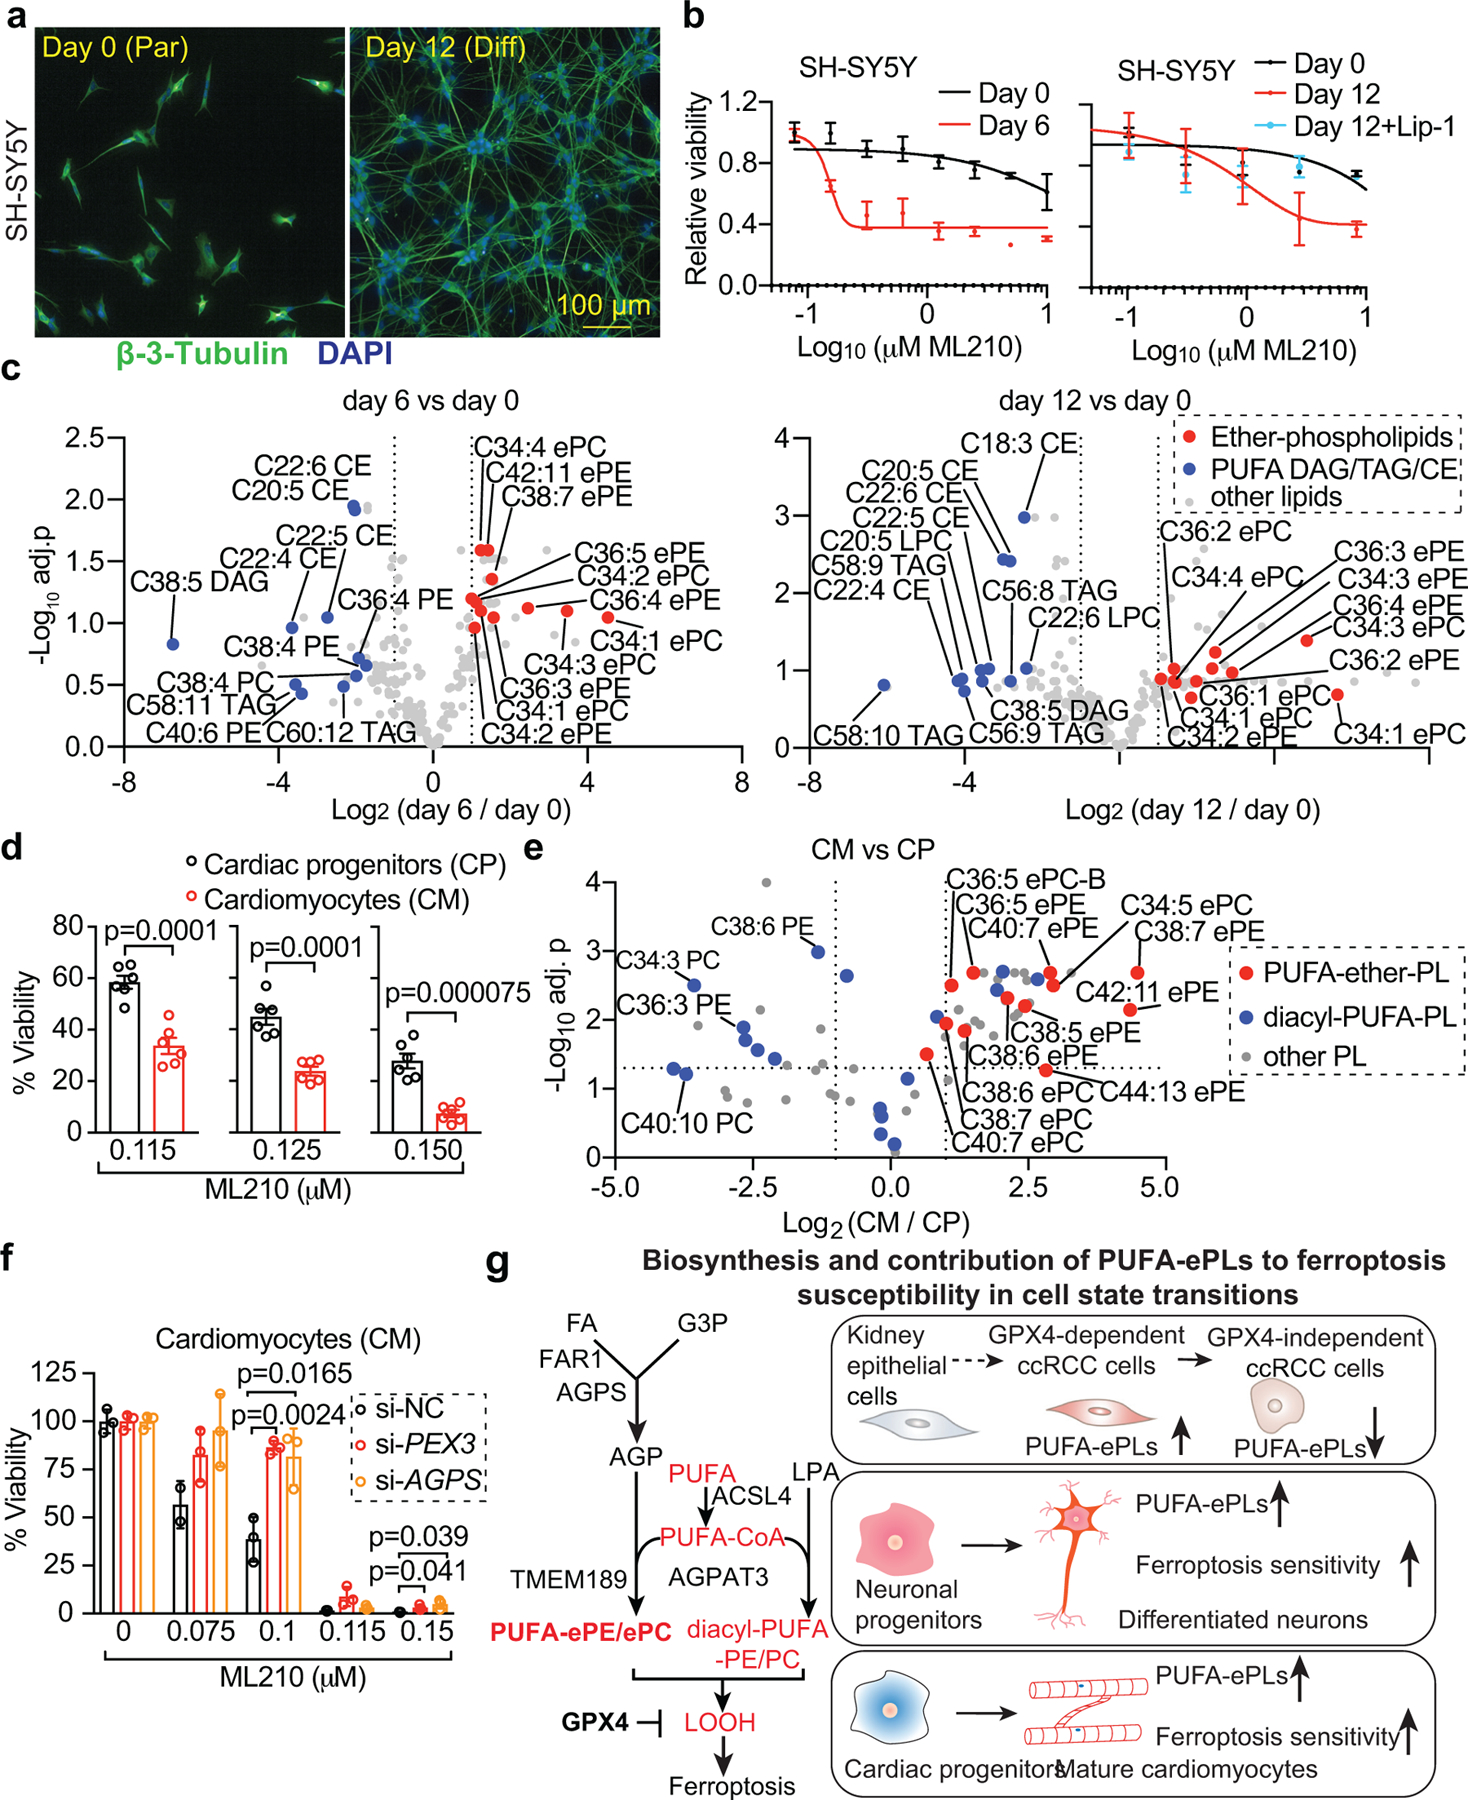
a. Fluorescent images showing the immunofluorescence analysis of neuronal marker β-3-tubulin expression in day 0 (parental) and day 12 (differentiated) SH-SY5Y cells.
b. Viability curves of SH-SY5Y cells at each stage treated with ML210 or ML210+liproxstatin-1 (Lip-1) for 48 h. n=2 or 4 biologically independent samples.
c. Volcano plots showing the lipidomic profiling results of day 0, 6 and 12 differentiating SH-SY5Y cells. n=3 biologically independent samples for parental and n=4 for day 6 or day 12 differentiation conditions.
d. Bar plots showing relative viability of human iPSC-derived cardiac progenitors (CP) and mature cardiomyocytes (CM) treated with ML210 for 24h. n=6 biologically independent samples.
e. Volcano plot showing the phospho-lipidome of CP (n=2 biologically independent samples) and CM (n=4 biologically independent samples).
f. Bar plots showing the cardiomyocytes transiently transfected with siRNAs targeting control (si-NC), PEX3, or AGPS. n=3.
g. Schematic diagram summarizing the peroxisomes and the polyunsaturated ether phospholipid biosynthesis pathway and their contribution to ferroptosis susceptibility in cell-state transitions.
Data center and error bars: mean±s.d.. P-values in volcano plots and growth curves were calculated using two-tailed Student’s T-test. Multiple-testing adjustment was performed using the Benjamini-Hochberg method. Scale bars, 100 µm. a,b,d,e,f: representative data from experiments performed in duplicates. Abbreviations: ePL, ether-phospholipids; FA, fatty acids; LPA, lysophosphatidic acid; PUFA, polyunsaturated fatty acids; G3P, glycerol-3-phosphate; AGP, 1-O-alkyl G3P; ePE, ether-phosphatidylethanolamine; ePC, ether-phosphatidylcholine; CE, cholesterol esters; DAG, diacylglycerol; LOOH, phospholipid hydroperoxides.
We also found that cardiomyocytes (CM) derived from human induced pluripotent stem cells (iPSC) were more sensitive to GPX4 inhibition than were iPSC or iPSC-derived cardiac progenitors (CP) (Fig. 4d, Extended Data Fig. 12f-g, Supplementary Video 2). CM cell death induced by ML210 exhibited ferroptosis-like morphology, which was prevented by liproxstatin-1/Fer-1 treatment, but not by necroptosis inhibitor necrostatin-1 or apoptosis inhibitor z-VAD-FMK (Extended Data Fig. 12h-i, Supplementary Video 3). Our lipidomic analysis further revealed that CMs significantly up-regulate PUFA-ePE/ePCs compared with CPs (Fig. 4e, Extended Data Fig. 12j, Supplementary Dataset 10). Moreover, PEX3 or AGPS knockdown reduced the sensitivity to ferroptosis in CMs (Fig. 4f, Extended Data Fig. 12k), suggesting that PUFA-ePL upregulation contributes to heightened ferroptosis sensitivity in CMs. In summary, selective upregulation of PUFA-ePLs is associated with the ferroptosis-susceptible state in both neuronal and cardiac lineages (Fig. 4g).
We describe here the importance of the peroxisomes and polyunsaturated ether phospholipids (PUFA-ePLs) in modulating ferroptosis susceptibility in cancer as well as in neuronal and cardiac conditions. Moreover, acquisition of a low-PUFA-ePL state, promoted by downregulating the expression of ePL biosynthetic enzymes, can lead to ferroptosis evasion and tumor relapse in ccRCC. While plasmalogens, the major PUFA-ePL type, have been viewed as antioxidants due to reactivity of their alkenyl-ether group29, our study describes an additional, pro-ferroptotic role specific to ePLs that bear a PUFA at the sn-2 position. Noting that postmortem brain samples of Alzheimer’s disease patients exhibit dramatically reduced plasmalogen levels30, further investigation into the role of plasmalogen-mediated ferroptosis in neurodegeneration is warranted. We also note that cardiomyocyte ferroptosis has been reported to contribute to chemotherapy- and ischemia/reperfusion-induced cardiomyopathy27, and that the iron-chelator dexrazoxane is the only FDA-approved drug for treating doxorubicin-induced cardiotoxicity. These diverse findings suggest that induction of ferroptosis may represent a powerful anti-cancer strategy and that blocking this process may prove highly useful in forestalling or alleviating various types of damage to the brain and heart.
Methods
Cell line sources and culture conditions
Cancer cells and immortalized cells.
All cells were cultured in a humidified incubator at 37 °C with 5% CO2. 786-O, 769-P and SNU-685 cells were cultured with RPMI1640 (Gibco) medium. HuH-7 and HEK-293T cells were cultured with DMEM (Gibco) medium. OVCAR-8 cells (obtained from the laboratory of Joan Brugge; Harvard Medical School), were cultured in 1:1 MCDB 105 media (Sigma) / Medium 199 Eagles media (Thermo Fisher Scientific). All culture media were supplemented with 10% fetal bovine serum (FBS, Gibco) and 1% penicillin/streptomycin (Sigma). All cancer cells except OVCAR-831 were obtained from the Cancer Cell Line Encyclopedia (CCLE) distributed by the Broad Institute Biological Samples Platform and Genetic Perturbation Platform. HEK-293T cells were obtained from American Type Culture Collection (ATCC). All cells were regularly tested for mycoplasma contamination and cells used in experiments were negative for mycoplasma. Human cell line authentication (CLA) analysis of OVCAR-8 cells were performed prior to screening by Duke University DNA Analysis facility.
SH-SY5Y cell culture and neuronal differentiation.
SH-SY5Y cells were obtained from European Collection of Authenticated Cell Cultures (ECACC)/Sigma-Aldrich, and cultured in DMEM (Gibco) medium containing 10% FBS and 1% penicillin/streptomycin. SH-SY5Y cells were differentiated in DMEM F12 medium in 96-well plates coated with 5 μg/mL laminin (Gibco). To induce neuronal differentiation28, parental cells were treated with 10 μM Retinoic acid (RA, Tokyo Chemical Industry) for 3 days with DMEM F12 medium with 10% FBS, and then removed off of serum for 3 days using an N2 media supplement. After 6 days of RA treatment the cells were treated with brain derived neurotrophic factor (BDNF, Invitrogen) at 50 ng/mL. Differentiation efficiency was evaluated by immunoblotting and immunofluorescence analysis of neuronal markers.
Cardiomyocyte cell culture.
iCell Cardiomyocytes2 (R1017) and Cardiac progenitors (R1093) were purchased from FUJIFILM Cellular Dynamics, Inc. and cultured according to manufacturer’s instructions in 96 well (Corning, 3904) and 12 well (VWR, 62406) plates at a density of 500,000 cells/ml suspended in the provided Plating Medium (R1017). After 24 hours, Plating Medium was replaced with provided Maintenance Medium (R1017). Ferroptosis sensitivity of iCell Cardiomyocytes2 was also assessed at a lower seeding density of 250,000 cells/ml. Cardiac progenitors were suspended in Maintenance Medium (FUJIFILM, R1093) supplemented with William’s E Medium (Thermo Fisher Scientific, A1217601), Cocktail B (Thermo Fisher Scientific, CM4000), and bFGF (Life Technologies, PHG6015) at a final concentration of 1 μg/ml. Lipid extraction and immunofluorescence of iCell cardiomyocytes and cardiac progenitors were performed on day 2 post plating.
Human iPS cell culture.
Human induced pluripotency stem (iPS) cells (CW20111, FUJIFILM Cellular Dynamics) were resuspended in mTeSR medium (Stem Cell Technology 05825) supplemented with 10 µM ROCK Pathway Inhibitor (Sigma Aldrich Y-27632) and plated on a 6-well tissue culture plate (VWR 353046) coated with Matrigel (Corning 345230). Cells were split at about 75% confluence (every three days) using ReLeSR™ (05872). One day prior to viability experiments, cells were dissociated into a single-cell suspension using Gentle Cell Dissociation Reagent (Stem Cell Technology 07174) and plated in 96 well (Corning 3904) and 12 well (VWR 62406) plates at a density of 250,000 cells/ml.
Compound sources and treatment conditions
ML210 (SML0521), RSL3 (SML2234), ferrostatin-1 (SML0583), liproxstatin-1 (SML1414), erastin (E7781) and necrostatin-1 (N9037) were obtained from Sigma-Aldrich, all of which exhibit purity ≥98% by HPLC. z-VAD-FMK was purchased from Thermo Fisher Scientific (FMK001). AGPS inhibitor ZINC-69435460 was synthesized following previously described procedures13. FIN56 was synthesized as previously described (#WO2008140792A1)32,33.
Immunofluorescence (IF) analyses and antibodies
IF of Neuronal cells.
Neuronal cells were differentiated in 96-well plate format from SH-SY5Y cells for IF analysis. Immediately before fixing neuronal cells, differentiation media was supplemented with 1% FBS in order to promote fixation. Neuronal cells were then fixed with 4% paraformaldehyde in phosphate buffered saline (PBS) at room temperature (RT) for 10 minutes, then washed and stored in PBS at 4°C until further analysis. Fixed samples were blocked and permeabilized with PBS containing 2% BSA and 0.1% Triton X-100 for 30 minutes at RT. Block/permeabilization buffer was then removed and replaced with anti-β-III-tubulin primary antibody (Abcam, ab78078, 1:1,000 dilution) in block/permeabilization buffer, then incubated overnight at 4°C. Cells were then washed 3 times with a block/permeabilization buffer, waiting 2 minutes between washes. Samples were then incubated with diamidino-2-phenylindole (DAPI, Invitrogen 62248) at 0.1 μg/mL in block/permeabilization buffer for 1 hr at RT, then washed 3 times with the same buffer before imaging. Images were acquired on Operetta Imaging equipment (PerkinElmer) at RT.
IF of cardiac cells.
Human iPS cell-derived cardiomyocytes (iCell Cardiomyocytes2) and cardiac progenitors were fixed with 4% formaldehyde in PBS and permeabilized using PBS containing 0.1% Triton X-100 (Sigma Aldrich) and 3% non-fat milk. Cardiac Troponin I (Abcam, ab56357, 1:200 dilution) and NKX2.5 (Abcam, ab35842, 1:200 dilution) were incubated in a permeabilization buffer at 4 °C overnight. The following day, nuclei were labeled with 0.1 μg/mL DAPI along with secondary antibodies (Thermo Fisher Scientific, a21467 or a11010, 1:500 dilution) in PBS. Cardiac Troponin I, NKX2.5, and DAPI were imaged accordingly on a Nikon A1R Spectral Scanning Confocal Microscope at RT.
Cellular viability measurements
Cell-Titer Glo assay.
Cells were seeded in 384-well opaque, white, tissue culture and assay plates (Corning) at 1,000 cells/well (786-O, HuH-7, and SNU-685) or in 96-well opaque, black, clear-bottom tissue culture plates (Corning) at 6,000 cells/well (OVCAR-8). Unless otherwise specified, 18–24 hours after seeding, cells were treated with compounds at the indicated concentrations for 48–72 hours, with three or four biological replicates per condition. Cellular ATP levels were quantified using the CellTiter-Glo Luminescent Cell Viability Assay (Promega) following manufacturer’s instructions on a multi-plate reader (Envision). Relative viability was normalized to the respective untreated condition unless otherwise indicated. The mean and standard deviation for the biological replicates of each data point in a representative experiment are presented. Sigmoidal non-linear regression models were used to compute the regression fit curves in Prism 8 (GraphPad).
Live cell imaging.
Live cell imaging for viability measurement was performed using Incucyte S3 for bright field images and PerkinElmer Operetta CLS High-Contrast analysis system for fluorescent (Hoechst 33342 stained) live cell imaging. Cells were maintained at 37°C with 5% CO2 in both instruments. Typically, three wells were imaged for each cell-line condition. For incucyte data, the cell covered surface areas in each image were quantified using Incucyte S3 software. Relative viability for cells treated with each concentration of ML210 was calculated by normalizing the cell coverage to the untreated conditions. Analysis for Operetta images was performed using Harmony 4.5 analysis software.
Immunoblotting and antibody information
Immuoblotting procedure.
For immunoblotting, cells were washed with ice-cold PBS and lysed in RIPA buffer containing 0.1% SDS, 40 mM sodium fluoride, 1 mM sodium pyrophosphate, 50 nM calyculin and 0.5% protease inhibitor cocktails (Sigma). Protein concentrations were determined by DC Assay (Bio-Rad). Quantified lysates were diluted with NuPAGE 4X LDS Sample Buffer and DTT-containing reducing agent (Thermo Fisher Scientific) and then incubated at 70 °C for 10 min. Samples were resolved by SDS-PAGE using NuPAGE 4–12% Bis-Tris protein gels (Thermo Fisher Scientific) and transferred to nitrocellulose (Bio-Rad) or PVDF membranes (GE Healthcare, USA). Membranes were blocked in a solution of 5% milk in TBS buffer containing 0.1% Tween-20 (TBST) for 1 hour, washed with TBST, and incubated with primary antibodies overnight at 4 °C in a solution of 5% bovine serum albumin (BSA) in TBST. After washing with TBST, membranes were incubated with HRP-conjugated secondary antibodies in a solution of 5% milk/TBST, washed with TBST, and developed using ECL substrate (Thermo Fisher Scientific).
Alternatively, adherent cells were briefly washed twice with cold PBS and lysed with 1% SDS lysis buffer containing 10 mM EDTA and 50 mM Tris-HCl, pH 8.0. Lysates were collected, briefly sonicated, and incubated at 95 °C for 10 min, and the protein concentrations were determined by BCA Protein Assay kit (Pierce). Calibrated samples were diluted with 4X LDS sampling buffer (Novus), separated by SDS-PAGE using NuPAGE 4–12% Bis-Tris protein gels (Novus), and transferred to PVDF membranes by iBlot2 protein-transfer system (Thermo Fisher Scientific). Membranes were blocked with 50% Odyssey blocking buffer (LiCor) diluted with TBST buffer prior to primary antibody incubation. Membranes were then washed with TBST and incubated with IRDye 800CW goat-anti-Rabbit or 680RD donkey-anti-Mouse secondary antibodies (LiCor). Immunoblotting images were acquired on an Odyssey equipment (LiCor) according to the manufacturer’s instructions, and analyzed in the ImageStudio software (v5.2.5, LiCor).
Antibodies.
The following primary antibodies were used in the present study: anti-PEX10 (Sigma-Aldrich, AV43442, Lot #QC13766, produced in rabbit, used at 1:2,000 dilution), anti-AGPS (Invitrogen, PA5–56398, Lot #TG2599887, produced in rabbit, used at 1:2,000 dilution), anti-FAR1 (Novus Biologicals, LLC, NBP1–89847, Lot #A107209, produced in rabbit, used at 1:1,000 dilution), anti-GPX4 (Abcam, ab41787, produced in rabbit, used at 1:2000 dilution), anti-β-Actin (8H10D10, Cell Signaling Technologies, #3700, and 13E5, #4970; or Novus, NB600–501, produced in mouse, used at 1:10,000 dilution), anti-COX-IV (Cell Signaling Technology, #4850S, produced in rabbit, used at 1:10,000 dilution), anti-β-III Tubulin (Abcam, ab78078, produced in mouse, used at 1:1000 dilution), anti-MAP2 (Abcam, ab5392, produced in chicken, used at 1:10,000 dilution), anti-Tyrosine Hydroxylase (Abcam, ab137869, produced in rabbit, used at 1:1,000 dilution), anti-NeuN (Neuronal nuclei antigen) (Abcam, ab177487, produced in rabbit, used at 1:1,000 dilution), anti-ACSL4 (Abcam, ab155282, produced in rabbit, used at 1:1,000 dilution), anti-LPCAT3 (Abcam, ab232958, produced in rabbit, used at 1:1,000 dilution), anti-SOD1 (Abcam, ab13498, produced in rabbit, used at 1:1,000 dilution), anti-Catalase (Sigma-Aldrich, C0979, mouse monoclonal antibody, used at 1:5,000 dilution), anti-AIFM2/FSP1 (VWR, ABGEAP1355C, produced in rabbit, used at 1:1,000 dilution), anti-TMEM189 (Novus Biological, NBP2–32476, produced in rabbit, used at 1:1,000 dilution), and anti-GAPDH (14C10, Cell Signaling Technologies, #2118S, produced in rabbit, used at 1:20,000 dilution). Despite extensive efforts, we did not identify high-quality antibodies for PEX3, PEX12 and AGPAT3 that could be used for immunoblotting analyses. The following secondary antibodies were used: HRP-linked anti-rabbit IgG (Cell Signaling Technology, #7074S, produced in goat, used at 1:10,000 dilution), IRDye 800CW goat-anti-Rabbit (LiCor, used at 1:10,000 dilution) and 680RD donkey-anti-Mouse (LiCor, used at 1:10,000 dilution), Alexa Fluor® 488 AffiniPure Donkey Anti-Mouse IgG (H+L) (Jackson Lab, used at 1:500 dilution).
Lipidomic profiling and data analyses
Lipidomics procedures.
Analyses of polar and non-polar lipids were conducted using an LC-MS system comprising a Shimadzu Nexera X2 U-HPLC (Shimadzu Corp.; Marlborough, MA) coupled to an Exactive Plus orbitrap mass spectrometer (Thermo Fisher Scientific; Waltham, MA). Lipids were extracted from cells with 0.8 mL isopropanol (HPLC Grade; Honeywell). Three replicates were analyzed for each cell line or condition. Cell extracts were centrifuged at 10,000 rcf for 10 minutes to remove residual cellular debris prior to injecting 10 μL onto an ACQUITY BEH C8 column (100 × 2.1 mm, 1.7 µm; Waters, Milford, MA). The column was eluted isocratically with 80% mobile phase A (95:5:0.1 vol/vol/vol 10 mM ammonium acetate/methanol/formic acid) for 1 min followed by a linear gradient to 80% mobile-phase B (99.9:0.1 vol/vol methanol/formic acid) over 2 min, a linear gradient to 100% mobile phase B over 7 min, then 3 min at 100% mobile-phase B. MS data were acquired using electrospray ionization in the positive-ion mode over 200–1100 m/z and at 70,000 resolutions. Other MS settings were: sheath gas 50, in source CID 5 eV, sweep gas 5, spray voltage 3 kV, capillary temperature 300 °C, S-lens RF 60, heater temperature 300°C, microscans 1, automatic gain control target 1×10⁶, and maximum ion time 100 ms. Despite extensive attempts, resolving between 1-O-alkyl- or 1-O-alkenyl-lipids was challenging due to limited instrument resolution and available experimental protocols.
Lipidomics data processing.
Raw data were processed using TraceFinder 3.3 (Thermo Fisher Scientific; Waltham, MA) and Progenesis QI (Nonlinear Dynamics; Newcastle upon Tyne, UK) software for detection and integration of LC-MS peaks. Lipid identities were determined based on comparison to reference standards and reference plasma extracts and were denoted by total number of carbons in the lipid acyl chain(s) and total number of double bonds in the lipid acyl chain(s). Negative ion mode analyses of free fatty acids and bile acids (C18-neg) were conducted similarly as previously described34. For downstream data analysis, median normalization was performed between each sample in the same experiment. Median-normalized lipidomics datasets are presented as Supplementary Datasets. Differential-abundance analysis was performed between previously annotated lipid species (about 200 lipids were previously annotated) using two-tailed Student’s T-test. For fold-change analysis, each dataset was normalized to the mean of the WT cell condition for each lipid species, and the ratio between Test/WT was log2 transformed and presented as bar graphs, volcano plots or heatmaps. P values are adjusted for multiple-test correction using Benjamini-Hochberg correction method and presented as “-log10 adj. P” in RStudio.
Free fatty acid lipidomic profiling.
Negative ion mode analyses of free fatty acids and bile acids (C18-neg) were conducted using an LC-MS system composed of a Shimadzu Nexera X2 U-HPLC (Shimadzu Corp) coupled to a Q Exactive hybrid quadrupole orbitrap mass spectrometer (Thermo Fisher Scientific). The samples were injected onto a 150×2.1 mm, 1.7 μm ACQUITY BEH C18 column (Waters; Milford, MA). The column was eluted isocratically at a flow rate of 450 μL/min with 80% mobile phase A (0.01% formic acid in water) for 3 minutes followed by a linear gradient to 100% mobile phase B (acetonitrile with 0.01% acetic acid) over 12 minutes and held for 3 minutes. Column re-equilibration at initial conditions were performed for 8 minutes. MS analyses were performed in the negative ion mode using electrospray ionization, full scan MS acquisition over 70 to 850 m/z, and a resolution setting of 70,000. Metabolite identities were confirmed using authentic reference standards. Other MS settings were as follows: sheath gas 45, sweep gas 5, spray voltage –3.5 kV, capillary temperature 320 °C, S-lens RF 60, heater temperature 300 °C, microscans 1, automatic gain control target 1×10⁶, and maximum ion time 250 ms.
HILIC-positive polar metabolomic profiling.
HILIC analyses of water-soluble metabolites in the positive ionization mode (HILIC-pos) were conducted using an LC-MS system composed of a Shimadzu Nexera X2 U-HPLC (Shimadzu Corp) coupled to a Q Exactive hybrid quadrupole orbitrap mass spectrometer (Thermo Fisher Scientific). 100 μL of cell extracts were evaporated under nitrogen (TurboVap) to dryness. Samples were reconstituted in 10 μL water and 90 μL of 74.9:24.9:0.2 v/v/v acetonitrile/methanol/formic acid containing stable isotope-labeled internal standards (valine-d8, Sigma-Aldrich; and phenylalanine-d8, Cambridge Isotope Laboratories). The samples were centrifuged (10 minutes, 9,000g, 4°C), and the supernatants (10 μl) were injected directly onto a 150×2 mm, 3-μm Atlantis HILIC column (Waters). The column was eluted isocratically at a flow rate of 250 μL/min with 5% mobile phase A (10 mmol/L ammonium formate and 0.1% formic acid in water) for 0.5 minute followed by a linear gradient to 40% mobile phase B (acetonitrile with 0.1% formic acid) over 10 minutes. Mass spectroscopic (MS) analyses were performed by using electrospray ionization in the positive ion mode using full scan analysis over 70 to 800 m/z at 70,000 resolution and 3 Hz data acquisition rate. Other MS settings were as follows: sheath gas 40, sweep gas 2, spray voltage 3.5 kV, capillary temperature 350 °C, S-lens RF 40, heater temperature 300 °C, microscans 1, automatic gain control target 1×10⁶, and maximum ion time 250 ms.
Genome-wide CRISPR screen and data analysis
CRISPR screen in OVCAR-8 cells.
315×106 OVCAR8 cells were transduced with a pooled genome-wide lentiviral sgRNA library in a Cas9-containing vector35–37 (Addgene #1000000100) at MOI < 1. Stably transduced cells were selected with 2 μg/ml puromycin, and 240×106 cells were passaged every 48–72 hours at a density of 3×10⁶ cells/15 cm dish in OVCAR-8 growth medium for the duration of the screen. At 6 weeks post-puromycin selection, 360×106 cells were treated with escalating doses of RSL3 for 4 days each: 0.5 μM, 1 μM, and 2 μM. 1×10⁷ cells each were collected from the surviving population of RSL3-treated cells and an endpoint-matched untreated population. Genomic DNA was isolated using the QIAmp DNA Blood Miniprep kit, and high-throughput sequencing libraries were prepared as previously described37, with the following changes: 1) the forward PCR primer sequence is: AATGATACGGCGACCACCGAGATCTACACGAATACTGCCATTTGTCTCAAGATCTA; 2) 6 μg of genomic DNA was used in a 50 μL PCR reaction; 3) ExTaq DNA polymerase (Takara) is used for the library amplification; 4) the library was amplified for 28 cycles. For sequencing of the DNA library, 40 nt reads were generated using the Illumina HiSeq.
CRISPR screen data analysis.
Sequencing reads were aligned to the sgRNA library and the abundance of each sgRNA was calculated. The counts from each population were normalized for sequencing depth after adding a pseudocount of one. sgRNAs that were not detected in the untreated population were omitted from downstream analyses. The log2 fold change in representation of each sgRNA between the RSL3-treated and endpoint-matched untreated reference populations was calculated and used to define a CRISPR Score (CS) for each gene. The CS is the average log2 fold change in representation of all sgRNAs targeting a given gene. The two-sided Kolmogorov-Smirnov test was used to compare the distribution of all sgRNAs targeting a given gene against the distribution of the entire population of sgRNAs, and the Benjamini-Hochberg method was used to correct the resulting p-values for multiple comparisons. Genes represented by fewer than 4 sgRNAs in the initial reference dataset were omitted from downstream analyses.
Gene-list Network Enrichment Analysis (GeLiNEA)
Details of the GeLiNEA method is described in Supplementary Information. Input gene lists and output genesets from GeLiNEA and Gene Set Enrichment Analysis (GSEA) are presented in Supplementary Dataset 2.
Lipid peroxidation analysis using BODIPY-C11
BODIPY-C11 imaging.
For imaging SH-SY5Y cells, differentiated SH-SY5Y cells were treated with 8.33 μM ML210 for 24 hours. During the last 4 hours of ML210 treatment, cells were co-treated with 5 μM of BODIPY-C11 dye38. Imaging was acquired on an Operetta Imaging equipment (PerkinElmer) at 563nm for the reduced form BODIPY-C11, and 488 nm for the oxidized form. Nuclear-staining dyes were avoided in SH-SY5Y live-cell imaging experiments since they exhibited cytotoxicity to differentiated neurons.
Flow cytometry analysis.
OVCAR-8 cells and derivatives were treated with DMSO or 5 μM ML210 for 2 hours, while for the last 30 min cells were also treated with 1 μM of BODIPY-C11 dye resuspended in culture medium. Cells were then washed with ice-cold PBS twice, stained with Hoechst 33342 for 5 min, trypsinized and filtered through a 70 μm filter to produce single-cell suspensions. Flow cytometry analysis was performed on a SONY SH800 cell sorter with standard settings, using PE-Texas Red filter for reduced BODIPY-C11 and the fluorescein isothiocyanate (FITC) filter for oxidized BODIPY-C11. A minimum of 10,000 cells were analyzed for each condition except in the OVCAR-8-sgNC cells, which exhibit low viability after ML210 treatment. Data analysis was performed using the FlowJo 10 software. An example gating strategy is included in Extended Data Figures.
BODIPY-C11 time-lapse imaging with nanoparticle treatment.
786-O cells were treated with ML210 at a concentration of 10 μM or ML210 + 1 μM Lip-1. BODIPY-C11 dye was added at a concentration of 5 μM and the cells were imaged every 10 minutes on Operetta (PerkinElmer). Nanoparticles were added at a concentration of 20 μM in triplet either the same time as ML210 or 1 hr after ML210 treatment. Cells were imaged every 10 minutes since nanoparticle application. About 10 min accounting for lipid handling was deducted in the plots. The total signal was calculated for BODIPY-C11 oxidation of each nanoparticle type and normalized to the oxidized BODIPY-C11 intensity in cells prior to ML210 treatment.
Cell imaging and quantification
Incucyte and Operetta imaging for cell quantification.
OVCAR8 and 786-O cells were treated with pre-prepared nanoparticles at a concentration of 20 μM one day before treatment with ML210 (concentrations ranging from 20 μM to 0 μM). Cells were imaged at day 2, 3 and 6 of ML210 treatment on an Incucyte at 20x magnification and at day 6 with Hoechst DNA stain at 1:1000 on an Operetta imaging platform (PerkinElmer) for cell counting.
Time-lapse live cell imaging.
Imaging was performed using a Nikon Ti microscope with incubation enclosure, stage-top delivery of 5% CO2, a MAGx/NA objective, Andor Clara CCD camera. The equipment was controlled using the MetaMorph software (Molecular Devices). Magnification settings for live cell imaging: MagSetting=20X_0.45NA_Ph1. RSL3-treated OVCAR-8 cells were imaged for a duration of 8 hours with a frame interval of 1,200 seconds. ML210 treated cardiomyocytes were imaged for a duration of 10 hours with a frame interval of 15 minutes.
Peroxisome imaging and quantification
For OVCAR-8 cells expressing sgNC, PEX3-sgRNA1 or PEX10-sgRNA 1, cells were incubated with CellLight™ Peroxisome-GFP, BacMam 2.0 (Thermo Fisher Scientific, #C10604) according to manufacturer’s instruction. After 24 hours, transduced cells were resuspended in 3% IFS/PBS, sorted on BD FACSAria SORP and analyzed on BD LSRII, using BD FACSDiva Software (BD Biosciences, USA). Isolated GFP positive cells were seeded at 30,000 cells/well in 8 well chamber glass bottom plates (Ibidi, #80827). Attached cells were incubated with Hoechst 33342 nucleic acid stain (Thermo Fisher Scientific, Cat no. H3570) at 1:5,000 for 20 min. Hoechst dye was removed and cells were imaged on an Andor Revolution spinning disk confocal mounted on a Nikon Ti stand using a 60X/1.4NA Plan Apo objective, Andor Zyla 5.5 sCMOS camera and MetaMorph acquisition software. Quantification of GFP positive puncta was performed using cell profiler39.
For other peroxisome quantification experiments performed in OVCAR-8, 786-O and HuH-7 cells and derivatives, peroxisome staining was performed similarly, and imaging was performed directly on the BacMam infected cells using the Operetta Imaging Station (PerkinElmer) without cell-sorting on flow cytometry. Peroxisome quantification was performed on the Harmony (PerkinElmer) image processing software according to the vendor’s instructions, and presented as the number of puncta in each cell that was imaged.
DPPH assay
The 2,2-diphenyl-1-picrylhydrazyl (DPPH) assay was used to measure lipid radical scavenging activities of chemicals40. The stable radical 2,2-diphenyl-1-picrylhydrazyl (DPPH; Cayman Chemical) was dissolved in ethanol to prepare a 0.1 mM solution. Test compounds (1 µL in DMSO) or DMSO (1 µL) were added to 100 µL of the DPPH solution in a clear bottom 96-well plate. The plate was shaken, incubated at room temperature for 30 min, and the absorbance at 517 nm was measured. Measurements were performed in triplicate. Note that this assay showed that the AGPS small-molecule inhibitor ZINC-6943546013 did not exhibit notable radical scavenging activity. Ferrostatin-1 is used as a lipid radical scavenger positive control.
Phospholipid nanoparticle preparation and treatment.
See Supplementary Information for details of methods involved in phospholipid nanoparticle preparation, quality control and treatment.
RNA extraction and qRT-PCR analysis.
See Supplementary Information for details of methods involved in RNA extraction, qRT-PCR analysis and primer sequences.
Genetic perturbations.
See Supplementary Information for details of methods involved in CRISPR/Cas9-mediated genome editing, shRNA/siRNA-mediated gene knockdown, cDNA-mediated gene overexpression, lentiviral production and nucleotide oligo sequences.
Animal experiments
All animal experiments were in compliance with relevant ethical regulations and were approved by the Institutional Animal Care and Use Committee (IACUC) of the Broad Institute, or the Animal Care and Use Committees at the Massachusetts Institute of Technology, as indicated below. While both IACUC protocols demand that the maximal tumor size should not exceed 2 cm in any dimension, none of implanted tumors in our experiments exceeded this restriction, as demonstrated by the source data reporting the tumor size measurements in all relevant experiments. No randomization of animals was performed in the experiments described below, and the investigators were not blinded to the tumor conditions while performing tumor measurements.
Isolation of ferroptosis-resistant cells.
These experiments were performed at the Broad Institute. Briefly, 3–4 week-old, male athymic nude mice were used for hosting the 786-O tumor xenografts. In the experiment that leads to isolation of ferroptosis-resistant 1 (FR1) cells , 5×10⁶ wildtype or GPX4−/− single-cell clone (originally named as #3A7 clone3, then renamed as ferroptosis-sensitive (FS) GPX4−/− cells in the present study) of 786-O-Cas9 cells were resuspended in 50 μl sterile PBS containing 50 μM Fer-1, mixed with 50 μl Matrigel (BD Biosciences), and subcutaneously injected into both flanks of the mouse. Tumor sizes were monitored and measured on a weekly basis. Tumor volumes were quantified by measuring the length (L) and width (W) of the tumor using a caliper and calculated according to V = (L*W*W)/2.
To establish cancer cell lines from the xenograft tumors, four GPX4−/− 786-O tumor-bearing mice were euthanized and prior to tumor tissue harvest. Dissected tumors were minced into small pieces in DMEM/Ham’s F12-medium supplemented with 0.125% collagenase III, 0.1% hyaluronidase (StemCell Technologies) and 5 μM Fer-1, and incubated for digestion with gentle rocking at room temperature overnight. The next day, cells were briefly centrifuged, resuspended in 0.25% trypsin, and incubated for 10 min in a 37 °C water bath. Cells were resuspended in RPMI culture media containing 10% FBS, 1% penicillin/streptomycin, and 5 μM Fer-1. These cells were expanded to large quantity, validated as GPX4-null by immunoblotting, and named ferroptosis-resistant 1 clones a-d (FR1 #a-d).
In the following mouse experiment that leads to the isolation of ferroptosis-resistant 2 (FR2) cells, 5×106 GPX4−/− 786-O FS, FR1 #a or FR1 #d cells were subcutaneously injected into each flank of athymic mice. Not anticipating the FR1#a or FR1 #d cells to establish tumors rapidly, 1×10⁶ (20% of standard number of cells per injection) of 786-O-Cas9 wildtype cells were injected per tumor. Tumor cells were isolated from the two tumors (left and right) of one WT-tumor bearing mouse, one FR1#a bearing mouse and one FR1#d tumor-bearing mouse using the abovementioned protocol. Cells were allowed to recover in culture for 48 hours prior to sample extraction for immunoblot analysis and lipidomic profiling. These cells were designated as 786-O- WT (-L and -R) or GPX4−/− -FR2#a (-L and -R) and -FR2#d (-L and -R) cells.
Xenografts of AGPS, FAR1, PEX3 and AGPAT3 knockout 786-O cells.
These experiments were performed at the Broad Institute. 786-O-Cas9 cells expressing sgNC or sgRNAs targeting either AGPS, FAR1, PEX3 or AGPAT3 were expanded to desired cell number, trypsinized, resuspended in ice-cold PBS and mixed with Matrigel. 5 × 10⁶ cells were injected to each tumor in male, 3–4 week-old, athymic, nude mice (Charles River Laboratories). Each cell line was injected into 5 mice and at two tumors per mouse. Starting day 4, tumor volume was measured once a week.
Xenografts of AGPS and FAR1 knockout OVCAR-8 cells.
These experiments were performed at the Whitehead Institute, MIT. Briefly, 2 × 10⁶ cells were resuspended in 20 μl of sterile PBS containing 20% Matrigel (Corning), and implanted into the right ovary fat pad of 6–8 week-old, female, NSG, immunocompromised mice. Animals were sacrificed about 5 weeks post-injection and tumors were excised and weighed.
Xenografts of OVCAR-8 cells double knockout of GPX4 and each of AGPS, FAR1, PEX3 and PEX10.
These experiments were performed at the Broad Institute. The following genotypes of OVCAR-8 cells were expanded in 5 μM Fer-1 and used in this experiment: GPX4+/+, GPX4−/−-sgNC, GPX4−/−-AGPS-sg2, GPX4−/−-FAR1-sg2, GPX4−/−-PEX3-sg1, and GPX4−/−-PEX10-sg1. Cells were trypsinized, counted, resuspended in ice-cold PBS containing 50 μM Fer-1, and mixed with equal volume of Matrigel (Corning). 3.5 × 10⁶ cells were injected in each tumor lesion and two tumors were injected per mouse. Female, 3–4 week-old, athymic, nude mice (Charles River Laboratories) were used. 8 mice were injected with GPX4−/−-sgNC cells, while 5 mice were injected with each of the other cell lines.
RNA-sequencing, exome-sequencing and data analysis
RNA preparation and sequencing.
RNA-Seq analysis was performed as previously described3. Briefly, total RNA was extracted from cancer cells in culture using the RNeasy Mini Kit (Qiagen) following manufacturer’s instructions. RNA sequencing library was prepared using NEB-Next Ultra RNA Library Prep Kit following the manufacturer’s recommendations. Briefly, total RNA samples were quantified and tested for contamination and degradation. After the QC procedures, mRNA from eukaryotic organisms is enriched using oligo (dT) beads. For prokaryotic organisms or eukaryotic organisms’ long-non-coding libraries, rRNA is removed using the Ribo-Zero kit that leaves the mRNA. First, the mRNA is fragmented randomly by adding fragmentation buffer, then the cDNA is synthesized by using mRNA template and random hexamers primer, after which a custom second-strand synthesis buffer (Illumina), dNTPs, RNase H and DNA polymerase I are added to initiate the second-strand synthesis. Second, after a series of terminal repair, A ligation and sequencing adaptor ligation, the double-stranded cDNA library is completed through size selection and PCR enrichment. The qualified libraries are fed into Illumina Novaseq6000 sequencers after pooling according to its effective concentration and expected data volume using a 2×150 bp paired-end configuration. Image analysis and base calling were conducted by the HiSeq Control Software. Raw sequence data generated from Illumina HiSeq was converted into fastq files and de-multiplexed using Illumina’s bcl2fastq 2.17 software. One mismatch was allowed for index sequence identification.
RNA-Seq data analysis.
Raw paired-end 150 bp/150 bp sequencing reads were mapped to human genome build hg38 using Bowtie2 (v2.3.1) with standard settings. On average 67% of read pairs were uniquely mapped to the hg38 genome. Mapped reads were counted to gene features by the htseq-count function from HTSeq (version 0.9.1) with standard settings, normalized to library size and analyzed for differentially expressed genes with DESeq2 (Bioconductor). Heatmaps were generated using the heatmap.2 function in gplots package in R (The Comprehensive R Archive Network). Normalized read count table is available from Gene Expression Omnibus. Differentially expressed gene lists between 786-O WT and GPX4−/− FR#2a or FR#2d cells are presented in Supplementary Dataset 8. List of peroxisome and ether-lipid biosynthesis-related genes are also available in Supplementary Dataset 8.
Exome-sequencing.
Genomic DNA of cancer cells was extracted using the QIAamp DNA blood mini kit (Qiagen) following manufacturer’s instructions. DNA degradation and contamination were monitored on 1% agarose gels, and DNA concentration was measured using Qubit® DNA Assay Kit in Qubit® 2.0 Flurometer (Life Technologies, CA, USA). A total amount of 1.0 μg genomic DNA per sample was used as input material for the DNA library preparation. Sequencing libraries were generated using Agilent SureSelect Human All Exon kit (Agilent Technologies, CA, USA) following manufacturer’s recommendations and index codes were added to each sample. Briefly, fragmentation was carried out by a hydrodynamic shearing system (Covaris, Massachusetts, USA) to generate 180–280bp fragments. Remaining overhangs were converted into blunt ends via exonuclease/polymerase activities and enzymes were removed. After adenylation of 3’ ends of DNA fragments, adapter oligonucleotides were ligated. DNA fragments with ligated adapter molecules on both ends were selectively enriched in a PCR reaction. After PCR reaction, libraries hybridize with Liquid phase with biotin labeled probe, then use magnetic beads with streptomycin to capture the exons. Captured libraries were enriched in a PCR reaction to add index tags to prepare for hybridization. Products were purified using AMPure XP system (Beckman Coulter, Beverly, USA) and quantified using the Agilent high sensitivity DNA assay on the Agilent Bioanalyzer 2100 system. Sequencing libraries that passed quality threshold were sequenced on an Illumina Novaseq6000 platform according to effective concentration and data volume.
Exome-seq data analysis.
Raw paired-end sequencing reads were mapped to human genome build hg38 (Dec 2013) using Bowtie2 (v2.3.1) with standard settings. The SAM files containing mapped reads were sorted and indexed into BAM files using Samtools (v1.10). Sorted BAM files were processed using PICARD (v2.22.2–0) tools and GATK (v4.1.6.0) Exome-seq variant calling best practices pipeline suggested by GATK. The following commands were sequentially used to pre-process the sample datasets, all with standard settings: MarkDuplicates, Samtools (sort+index), AddOrReplaceReadGroups, BaseRecalibrator, and Apply Recalibration. GATK MUTect2 tool was used for variant calling using GPX4 wildtype samples as normal control, while GPX4 KO ferroptosis resistant cells were treated as “tumor” samples. For variant filtering, the following GATK commands were used sequentially: GetPileupSummaries, CalculateContamination, and FilterMutectCalls. Final variants that passed all thresholds in all ferroptosis-resistant samples were annotated with GATK Funcotator and reported in Supplementary Dataset 8.
Public dataset queries
786-O CRISPR screen data.
Results for CRISPR screening in 786-O ccRCC cells were described previously3, and can be accessed in Gene Expression Omnibus (GSE126696) [https://www.ncbi.nlm.nih.gov/geo/query/acc.cgi?acc=GSE126696].
Gene co-dependency analysis in Cancer Dependency Map.
Genes of interest were entered into the Cancer Dependency Map25 web portal [https://depmap.org/portal/]. Data was retrieved on March 31, 2020.
Statistical analyses and software information
Data are generally plotted as mean±s.d. unless otherwise indicated. No statistical methods were used to predetermine sample sizes. Unless otherwise indicated, all replication numbers in the figure legends (n) indicate biological replicates. Statistical significance was determined using a two-tailed Student’s T-test using Prism 8 software (GraphPad Software) unless otherwise indicated. The Benjamini-Hochberg correction method was used to adjust the p values where multi-testing corrections were involved. Statistical significance was set at p<=0.05 unless otherwise indicated. Figures were finalized in Adobe Illustrator 2020.
Materials and Correspondences
Further information and requests for resources and reagents should be directed to corresponding authors Yilong Zou (yzou@broadinstitute.org), Stuart L. Schreiber (stuart_schreiber@harvard.edu) or Robert A. Weinberg (weinberg@wi.mit.edu).
Data and code availability
Lists of genes scored significantly in the OVCAR-8 CRISPR screening experiment are provided in Supplementary Dataset 1, raw sequencing data of the CRISPR screening is deposited in Gene Expression Omnibus via accession number GSE151062. Input gene list and output gene sets of GeLiNEA and GSEA analysis are included in Supplementary Dataset 2. Code for the GeLiNEA is available on GitHub [https://github.com/broadinstitute/GeLiNEA]. Lipidomics and metabolomics data are available as Supplementary Datasets 3-7 and 9-10. Raw Exome-sequencing and RNA-sequencing data are available in Gene Expression Omnibus under accession number GSE148297, and processed data, including top variants and differentially expressed genes in the tumor-derived ferroptosis-resistant cells, are listed in Supplementary Dataset 8. Three Supplementary Videos are included. All original data for each figure are provided as source data in Supplementary Information.
Extended Data
Extended Data Figure 1. CRISPR screens identify peroxisome components as contributors of sensitivity to ferroptosis.
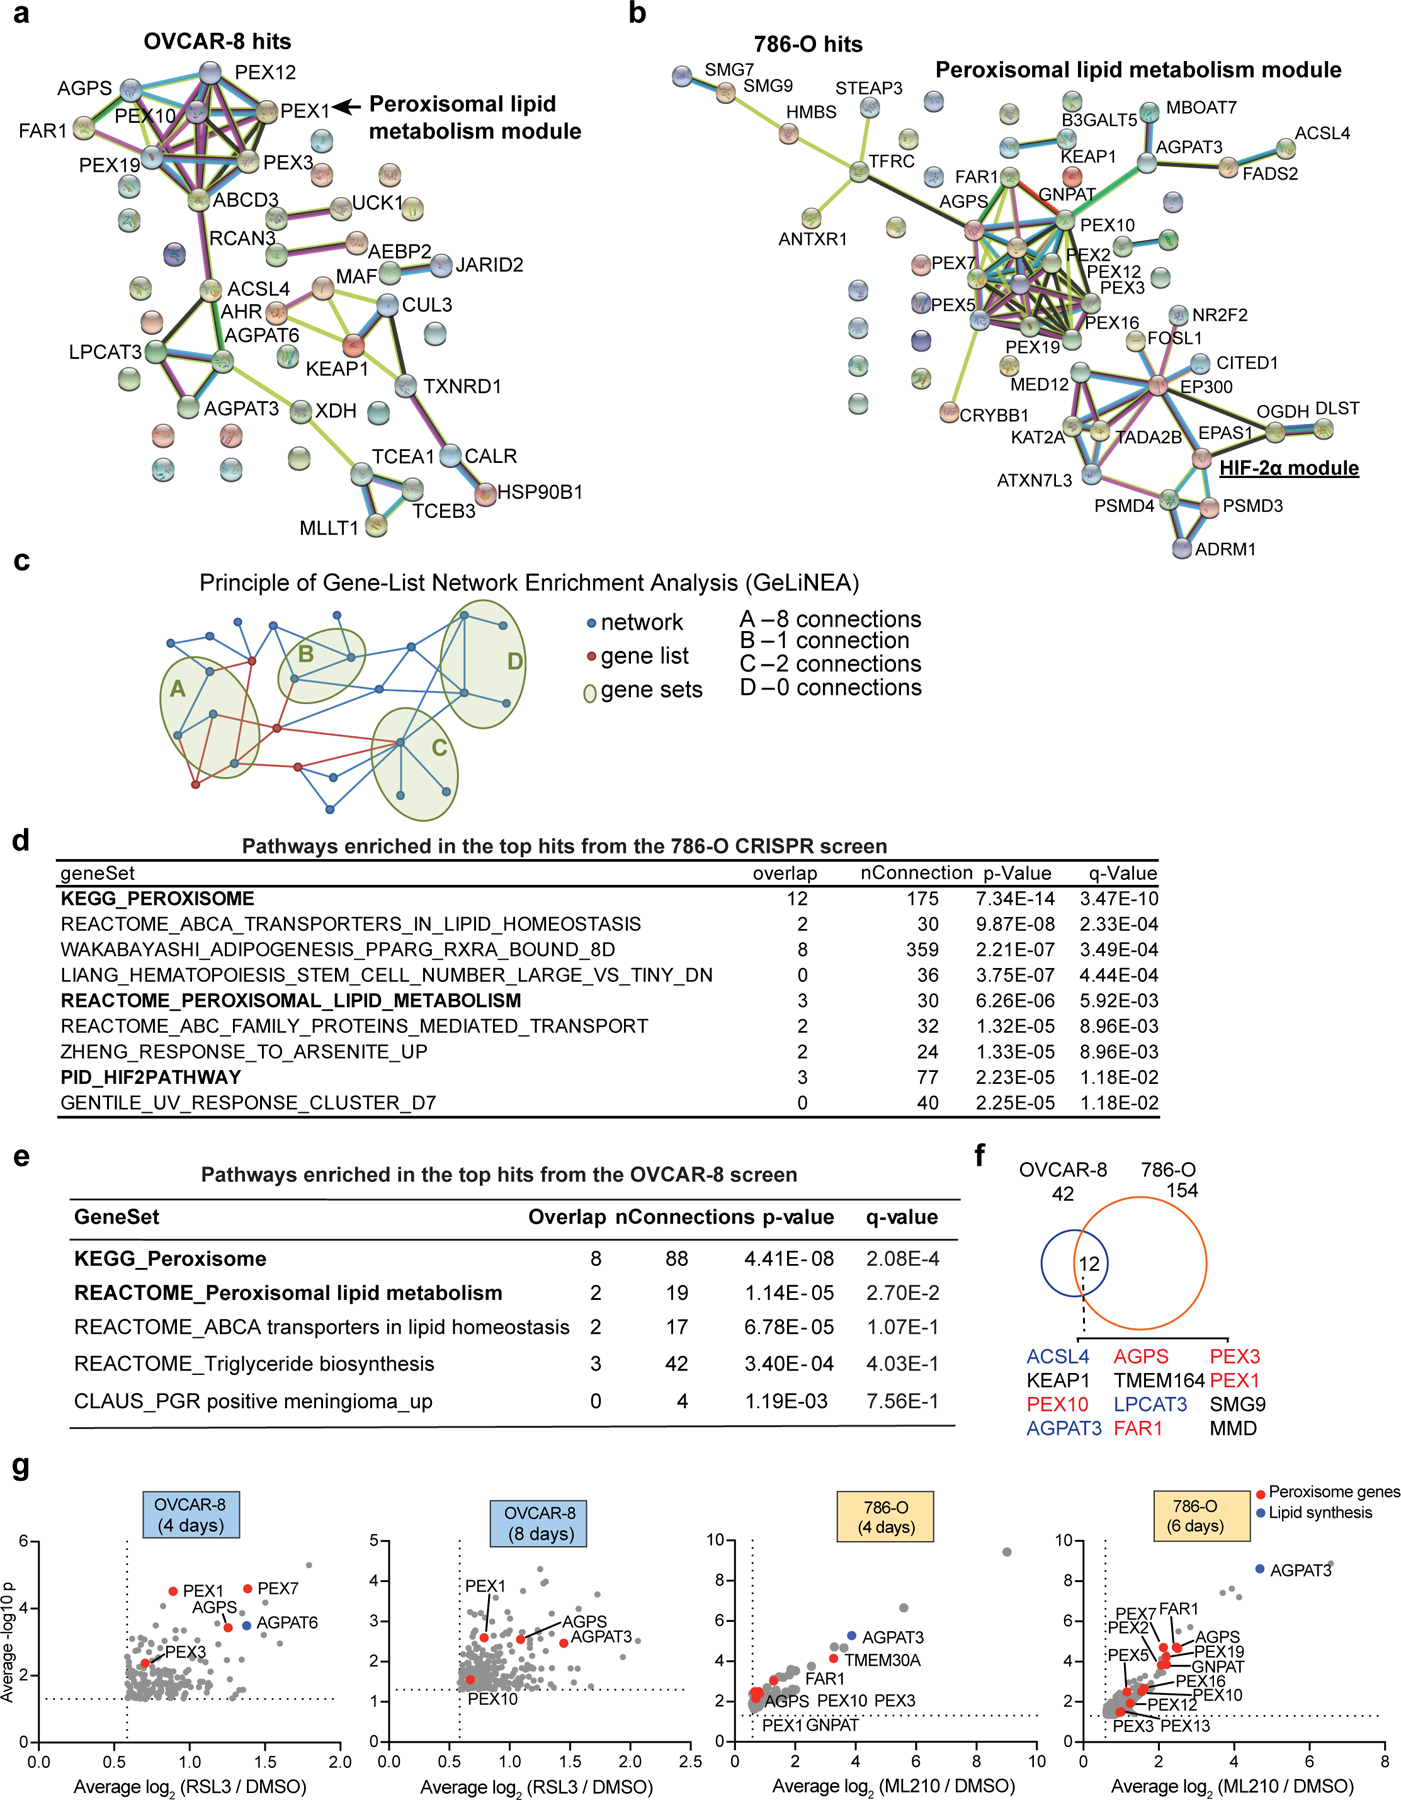
a. STRING Protein Network analysis of the top OVCAR-8 screening hits.
b. STRING Protein Network analysis of the top 786-O screening hits.
c. Schematic diagram showing simplified illustration of the principle and work flow for the Gene-list Network Enrichment Analysis (GeLiNEA) method.
d. Table showing the top pathways enriched in the 786-O screen hits using GeLiNEA. Overlap is the number of genes in common between a gene set and the screening hit list, nConnections is the number of connections between a gene set and the screening hit list, p-values are computed using equation (1), and q-values are p-values adjusted for multiple testing using the Benjamini-Hochberg correction method.
e. Table showing the top pathways enriched in OVCAR-8 screen hits using GeLiNEA.
f. Venn diagram showing the overlapped CRISPR screen hits in OVCAR-8 and 786-O cells.
g. Volcano plots showing the top hits in OVCAR-8 and 786-O genome-wide CRISPR screens. For presentation purposes, only genes that are enriched in the RSL3 or ML210 treated condition for ≥ 1.5 fold (log2FC ≥ 0.585) are plotted. See Methods for data analysis methods.
Extended Data Figure 2. Peroxisomes contribute to ferroptosis sensitivity in renal and ovarian carcinomas cells.
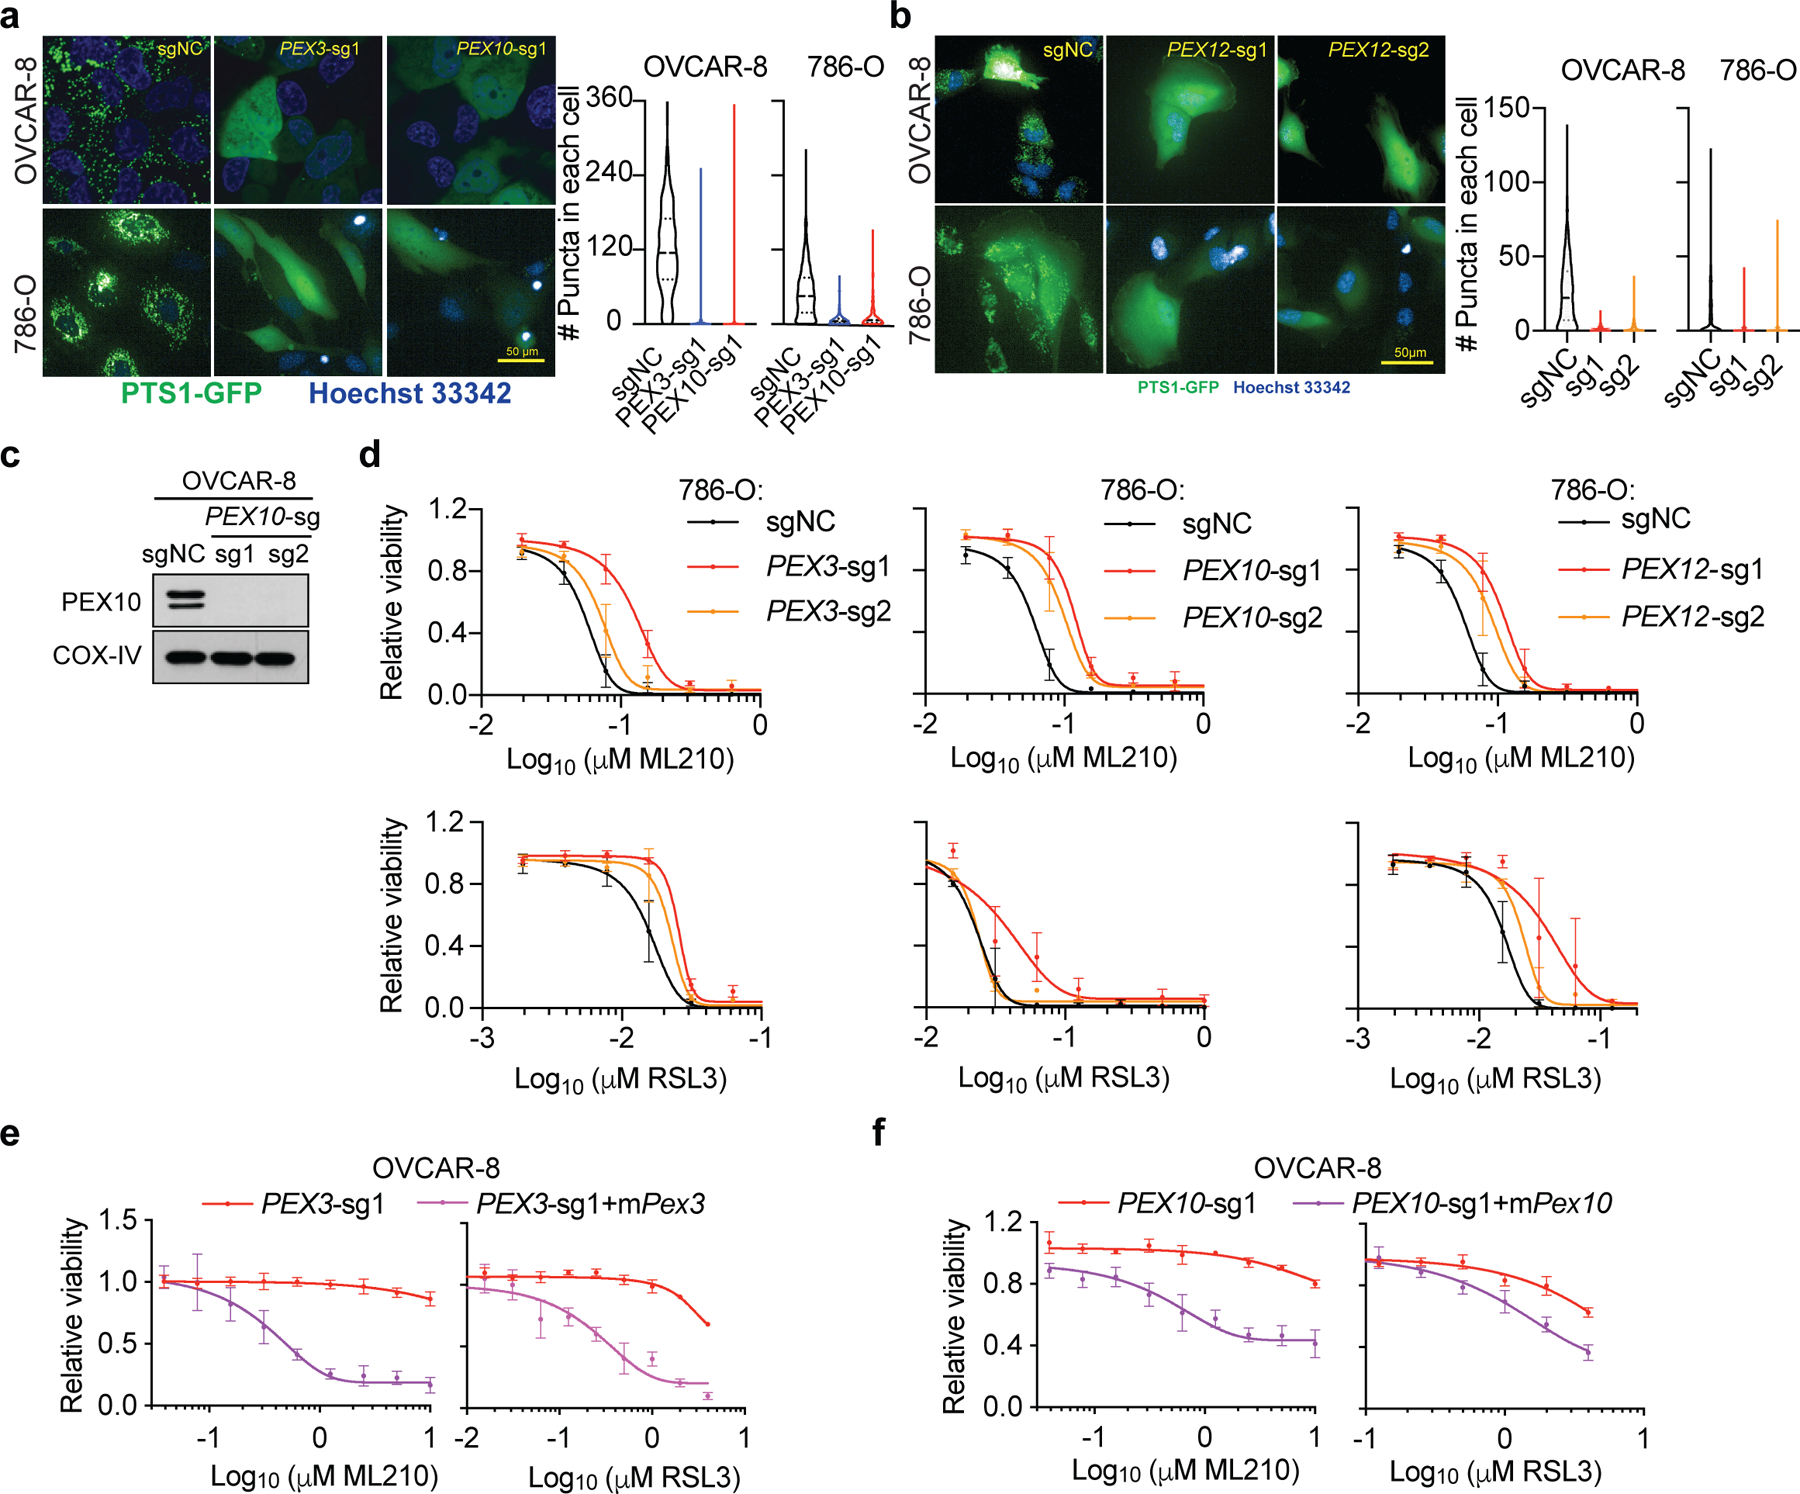
a. Fluorescent imaging analysis of peroxisome abundances, reported by PTS1-GFP signal, in OVCAR-8 (top) and 786-O (bottom) cells expressing sgNC, or PEX3, PEX10-targeting sgRNAs. Scale bar, 50 µm. Peroxisome quantitations are shown on the right as violin plots. OVCAR-8-sgNC, n=295, PEX3-sg1, n=318, PEX10-sg1, n=301; 786-O-sgNC, n=604, PEX3-sg1, n=617, PEX10-sg1, n=543. Lines in violin plots indicate median and quartiles.
b. Fluorescent imaging analysis of peroxisome abundances, reported by PTS1-GFP signal, in OVCAR-8 and 786-O cells expressing sgNC, or PEX12-targeting sgRNAs. Scale bar, 50 µm. Peroxisome quantitations are shown on the right as violin plots. OVCAR-8-sgNC, n=1032, PEX12-sg1, n=259, PEX12-sg2, n=444; 786-O-sgNC, n=1139, PEX12-sg1, n= 623, PEX12-sg2, n=1326. Lines in violin plots indicate median and quartiles.
c. Immunoblot analysis showing the PEX10 protein levels in OVCAR-8 cells expressing sgNC or PEX10-targeting sgRNAs. COX-IV was used as a loading control. Representative result of experiment performed in duplicate. See Supplementary Information for uncropped immunoblot images.
d. Viability curves of 786-O cells expressing negative control (sgNC) or sgRNAs targeting PEX3, PEX10 or PEX12 treated with indicated concentrations of ML210 or RSL3 for 48h. n=4 biologically independent samples. Representative result of experiment performed in triplicate.
e. Viability curves of PEX3-sg1-expressing OVCAR-8 cells rescued with sgRNA-resistant mouse Pex3 cDNA respectively and being treated with indicated concentrations of ML210 or RSL3. In this experiment, cellular viability was measured at 24 hours of treatment, at which time point the PEX3-sg1-only cells were not yet dying. n=4 biologically independent samples. Data of experiment performed once.
h. Viability curves of PEX10-sg1-expressing OVCAR-8 cells rescued with sgRNA-resistant mouse Pex10 cDNA respectively and being treated with indicated concentrations of ML210 or RSL3. In this experiment, cellular viability was measured at 24 hours of treatment, at which time point the PEX10-sg1-only cells were not yet dying. n=4 biologically independent samples. Data of experiment performed once.
For viability curves, data center and error bars indicate mean±s.d..
Extended Data Figure 3. Peroxisomes contribute to ferroptosis sensitivity via the ether lipid biosynthesis pathway.
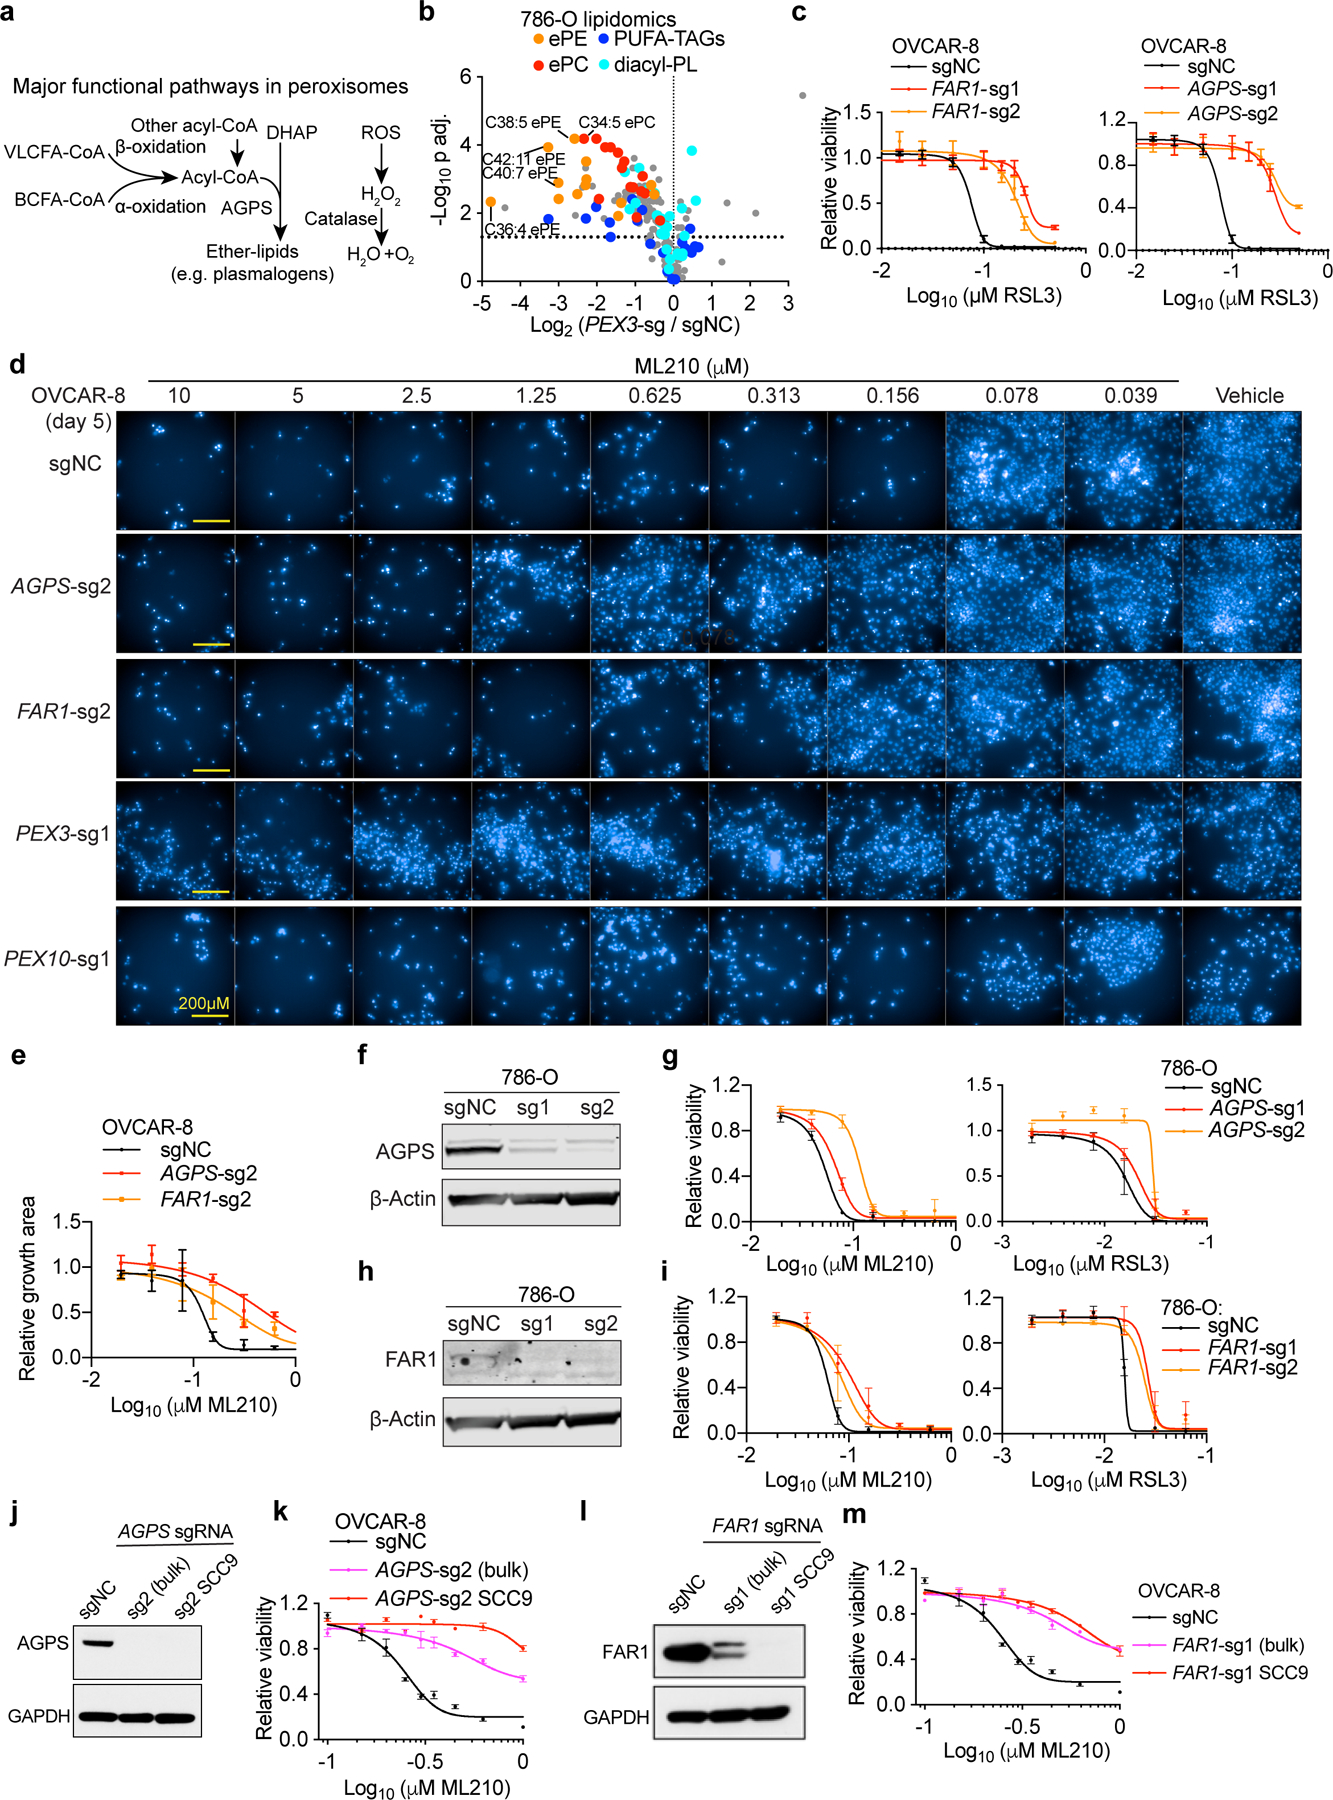
a. Schematic diagram of the known functional pathways involved in lipid metabolism and reduction of reactive oxygen species (ROS) in the peroxisome. Abbreviations, VLCFA, very long-chain fatty acids; BCFA, branched-chain fatty acids; DHAP, dihydroxyacetone; AGPS, alkylglycerone phosphate synthase.
b. Volcano plots showing the lipidomic analysis of 786-O cells expressing sgNC or PEX3-targeting sgRNAs. n=3 biologically independent samples. Two tailed Student’s T-test. Multiple-testing adjustment was performed using the Benjamini-Hochberg method. Abbreviations: ePE, ether-linked phosphatidylethanolamine; ePC, ether-linked phosphatidylcholine; PUFA-, polyunsaturated fatty acyl-; TAG, triacylglycerol; PL, phospholipids.
c. Viability curves of OVCAR-8 cells expressing negative control (sgNC), FAR1-targeting sgRNAs (left) or AGPS-targeting sgRNAs (right) and treated with indicated concentrations of RSL3 for 72 h. n=3 biologically independent samples. Representative results of experiment performed in triplicate.
d. Fluorescent imaging showing nuclear staining by Hoechst 33342 in OVCAR-8 cells with the indicated genetic perturbations and treated with vehicle (DMSO) or indicated concentrations of ML210 for 5 days. Representative images from experiment performed once, and each condition has three biological replicates.
e. Relative growth rates measured by areas of live cell coverage in OVCAR-8 cells expressing sgNC, AGPS-sg2 or FAR1-sg2 and treated with indicated concentrations of ML210 for 5 days. n=2 or 3 biologically independent samples. Data of experiment performed once.
f. Immunoblot analysis of AGPS protein levels in 786-O cells expressing negative control (sgNC) or AGPS-targeting sgRNAs.
g. Viability curves of 786-O cells expressing sgNC or AGPS-targeting sgRNAs treated with indicated concentrations of ML210 or RSL3 for 48h. n=4 biologically independent samples. Representative result of experiment performed in triplicate.
h. Immunoblot analysis of FAR1 protein levels in HuH-7 cells expressing negative control (sgNC) or AGPS-targeting sgRNAs. β-Actin was used as a loading control.
i. Viability curves of 786-O cells expressing sgNC or FAR1-targeting sgRNAs treated with indicated concentrations of ML210 or RSL3 for 48 h. n=4 biologically independent samples. Representative result of experiment performed in triplicate.
j. Immunoblot showing AGPS protein levels in OVCAR-8 cells expressing sgNC or AGPS-sg2, and AGPS−/− single cell clone (SCC)#9.
k. Viability curves of OVCAR-8 cells expressing sgNC or AGPS-sg2, and AGPS−/− SCC9 treated with ML210 for 72 h. n=3 biologically independent samples. Representative result of experiment performed in duplicate.
l. Immunoblot showing FAR1 protein levels in OVCAR-8 cells expressing sgNC or FAR1-sg1, and FAR1−/− single cell clone (SCC)#9.
m. Viability curves of OVCAR-8 cells expressing sgNC or FAR1-sg1, and FAR1−/− SCC9 treated with ML210 for 72 h. n=3 biologically independent samples. Representative result of experiment performed in duplicate.
Immunoblots are representative data of experiments performed twice. See Supplementary Information for uncropped immunoblot images. β-Actin or GAPDH was used as a loading control. For viability curves, data center and error bars indicate mean±s.d..
Extended Data Figure 4. AGPS/FAR1-depletion blocks ether phospholipid synthesis and lipid peroxidation.
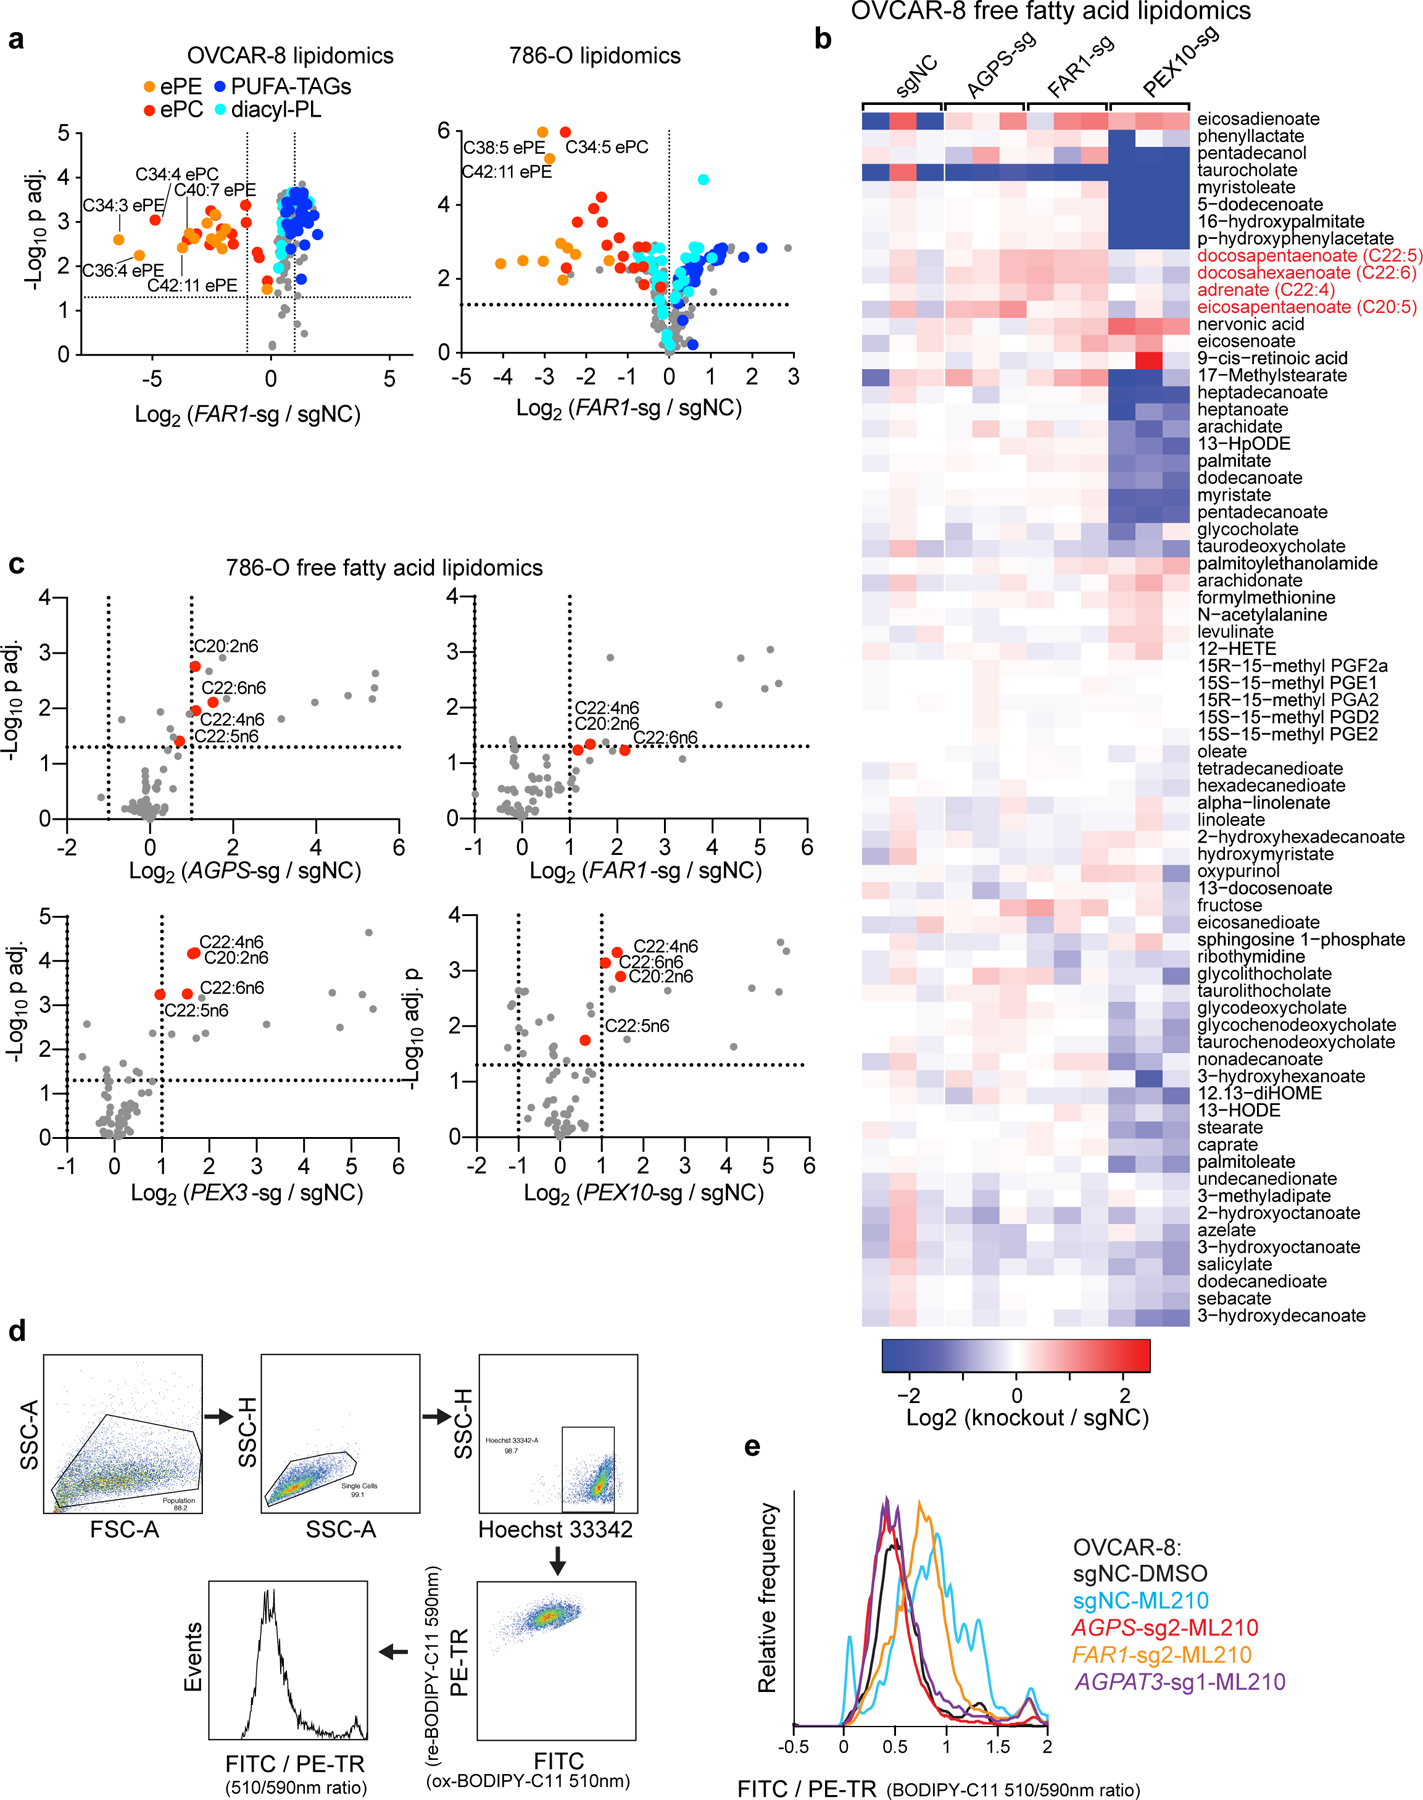
a. Volcano plots showing the lipidomic analysis of OVCAR-8 and 786-O cells expressing sgNC or FAR1-targeting sgRNAs. n=3 biologically independent samples. Two tailed Student’s T-test. Multiple-testing adjustment was performed using the Benjamini-Hochberg method. Abbreviations: ePE, ether-linked phosphatidylethanolamine; ePC, ether-linked phosphatidylcholine; PUFA-, polyunsaturated fatty acyl-; TAG, triacylglycerol; PL, phospholipids.
b. Heatmap showing the relative abundances of free fatty acids in wildtype and AGPS, FAR1, or PEX10-depleted OVCAR-8 cells. n=3 biologically independent samples. Highlighted in red are polyunsaturated fatty acids that are enriched in response to AGPS or FAR1 knockout.
c. Volcano plots showing free fatty acid lipidomic analysis in wildtype and AGPS, FAR1, PEX3 or PEX10-depleted 786-O cells. n=3 biologically independent samples. Highlighted in red are free polyunsaturated fatty acids upregulated in the knockout cells. Two tailed Student’s T-test. Multiple-testing adjustment was performed using the Benjamini-Hochberg method.
d. Representative gating strategy used in the flow cytometry analysis of BODIPY-C11 oxidation levels.
e. Histogram showing the lipid peroxidation levels reported by the ratio between oxidized and reduced BODIPY-C11 levels in the indicated OVCAR-8 cells treated with DMSO or ML210 for 2 h. Plot of experiment performed once.
Extended Data Figure 5. The ether lipid biosynthesis pathway but not other peroxisomal pathways contributes to ferroptosis susceptibility.
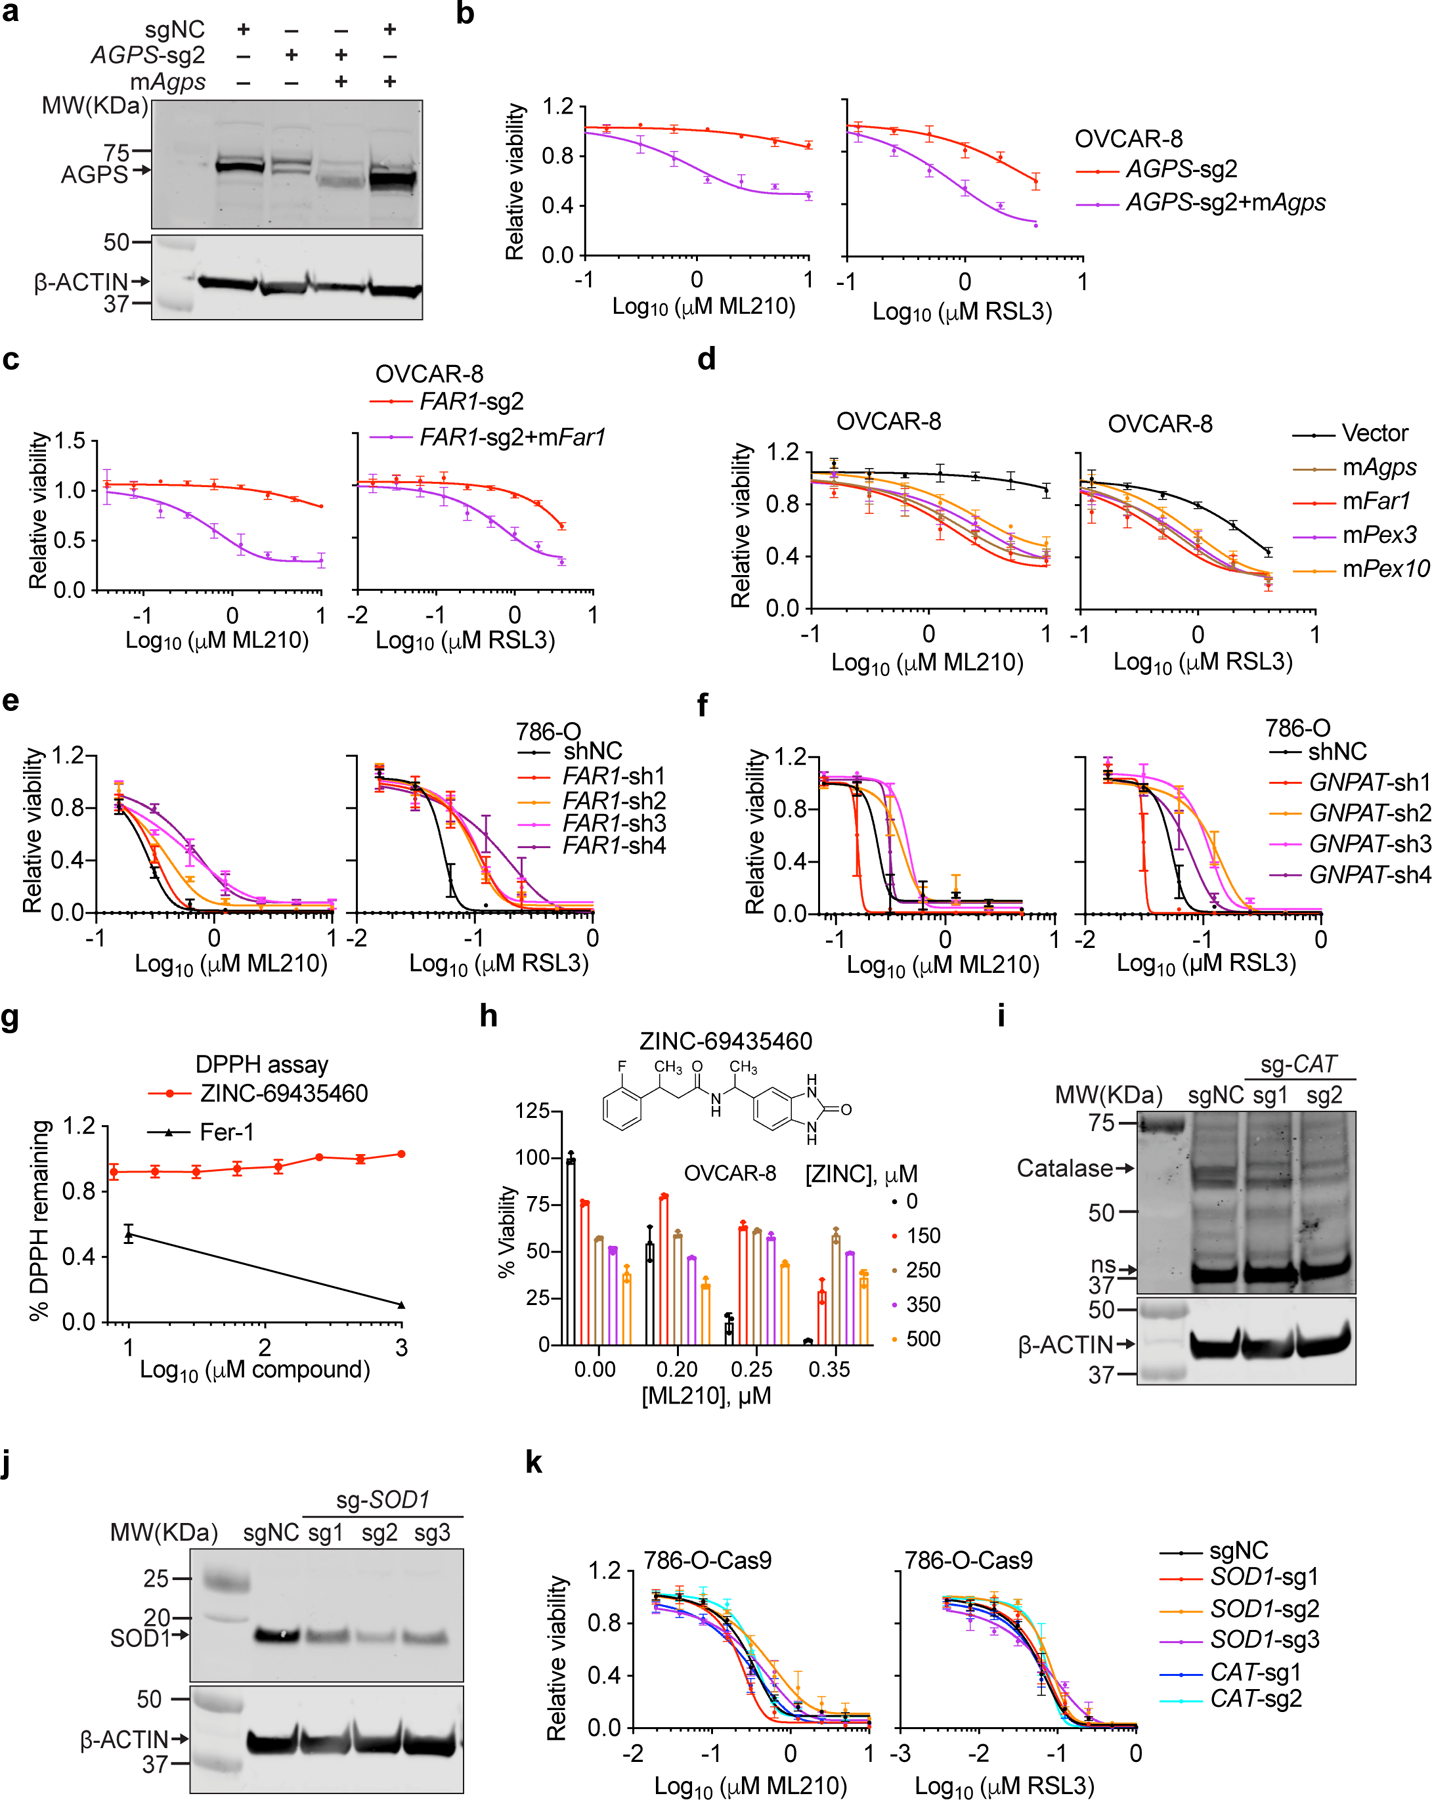
a. Immunoblot analysis of AGPS protein levels in cells expressing the indicated constructs. Plot of experiment performed once.
b. Viability curves of AGPS-sg2-expressing OVCAR-8 cells rescued with sgRNA-resistant mouse Agps cDNA and being treated with indicated concentrations of RSL3 for 24 h. n=4 biologically independent samples. Plot of experiment performed once.
c. Viability curves of FAR1-sg2-expressing OVCAR-8 cells rescued with sgRNA-resistant mouse Far1 cDNA and being treated with indicated concentrations of RSL3 for 24 h. n=4 biologically independent samples. Plot of experiment performed once.
d. Viability curves for OVCAR-8 cells expressing empty vector or cDNAs of mouse Agps, Far1, Pex3 or Pex10 and treated with indicated concentrations of ML210 or RSL3. In this experiment, cellular viability was read at 24 hours of treatment (instead of normally at 72 hours), at which time point the control cells were not yet dying. n=4 biologically independent samples. Plot of experiment performed once.
e. Viability curves of 786-O cells expressing non-targeting negative control shRNA (shNC) or FAR1-targeting shRNAs treated with indicated concentrations of ML210 or RSL3 for 48 h. n=4 biologically independent samples. Representative data of experiment performed twice.
f. Viability curves of 786-O cells expressing shNC or GNPAT-targeting shRNAs treated with indicated concentrations of ML210 or RSL3 for 48 h. n=4 biologically independent samples. Representative data of experiment performed twice.
g. Percentage of remaining DPPH levels in in vitro DPPH assay system containing indicated concentrations of ZINC-69435460 or ferrostatin-1 (Fer-1). n=3 biologically independent samples. Data center and error bars: mean±s.d. DPPH, 2,2-diphenyl-1-picrylhydrazyl. ZINC-69435460 vs Fer-1 both at 1mM, p=6.05x10e-8.
h. Relative viability of OVCAR-8 cells pre-treated with AGPS inhibitor ZINC-69435460 (ZINC) for 24h, followed by ML210 treatment for another 72 h. n=3 biologically independent samples. Data center and error bar, mean±s.e.m. Representative data of experiment performed in triplicate. For 0.25 µM ML210 conditions, 0 µM vs 150 µM ZINC, p=0.000076; vs 250 µM ZINC, p=0.000073; vs 350 µM ZINC, p=0.00011; vs 500 µM ZINC, p=0.00045. For 0.35 µM ML210 conditions, 0 µM vs 150 µM ZINC, p=0.0017; vs 250 µM ZINC, p=0.000011; vs 350 µM ZINC, p=7.55x10e-9; vs 500 µM ZINC, p=0.00015.
i. Immunoblot analysis of Catalase (CAT) protein levels in 786-O cells expressing sgNC or CAT-targeting sgRNAs. Plot of experiment performed once.
j. Immunoblot analysis of Superoxide Dismutase 1 (SOD1) protein levels in 786-O cells expressing sgNC or SOD1-targeting sgRNAs. Plot of experiment performed once.
k. Viability curves of 786-O cells expressing sgNC or SOD1- or CAT-targeting sgRNAs treated with indicated concentrations of ML210 or RSL3 for 48 h. n=4 biologically independent samples. Plots of experiment performed once.
β-ACTIN was used as a loading control in immunoblots. See Supplementary Information for uncropped immunoblot images. For viability curves, data center and error bars indicate mean±s.d.. P-values were calculated using two-tailed Student’s T-test.
Extended Data Figure 6. Peroxisomes and the ether lipid biosynthesis pathway contribute to ferroptosis in liver, endometrial and kidney cancers.
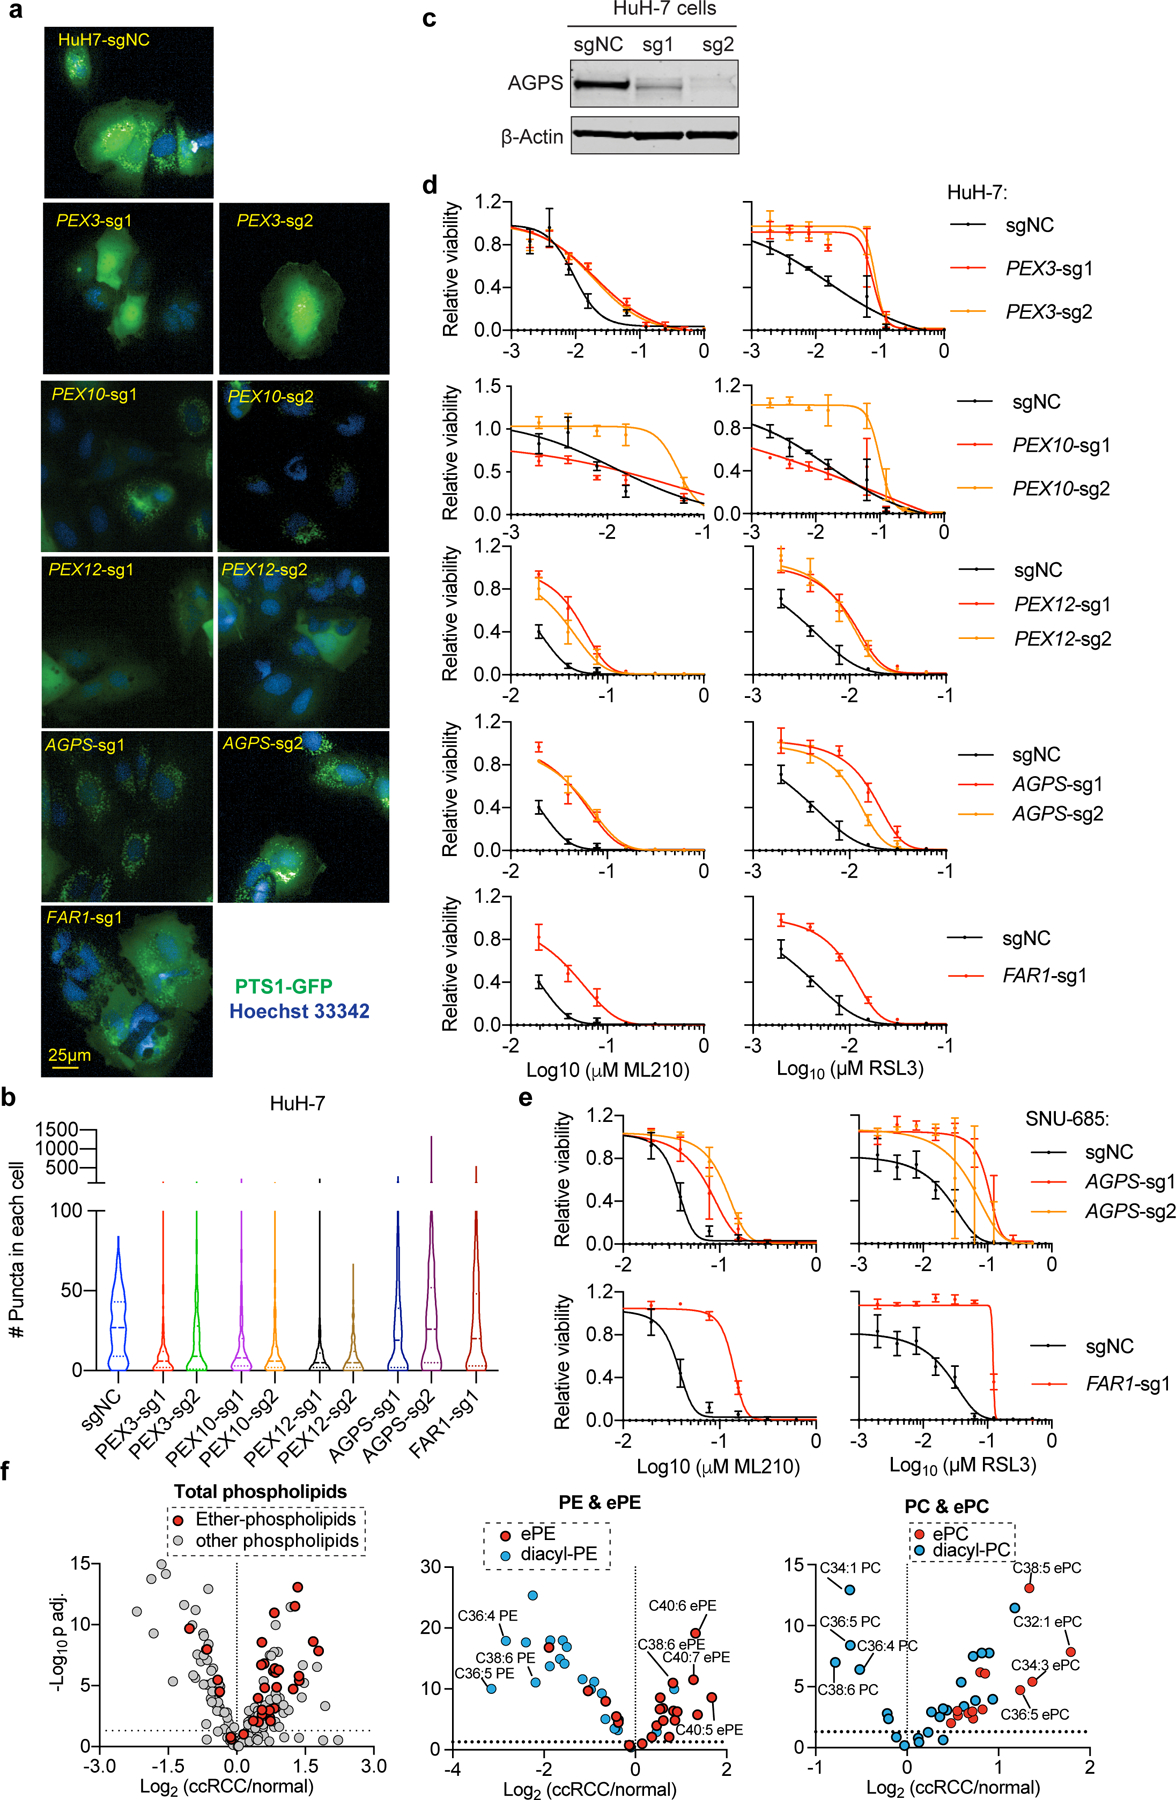
a. Fluorescent imaging analysis of peroxisome abundances, reported by PTS1-emGFP signal, in HuH-7 cells expressing the indicated sgRNAs. Scale bar, 25 µm. Representative images from experiment performed once, and each condition has three biological replicates.
b. Violin plots showing the quantitation of peroxisomes in HuH-7 cells expressing indicated sgRNAs. HuH-7-sgNC, n=250, PEX3-sg1, n=231, PEX3-sg2, n=256, PEX10-sg1, n=600, PEX10-sg2, n=455, PEX12-sg1, n=295, PEX12-sg2, n=278, AGPS-sg1, n=321, AGPS-sg2, n=304, FAR1-sg1, n=411. Lines in violin plots indicate median and quartiles.
c. Immunoblot analysis of AGPS protein levels in HuH-7 cells expressing negative control (sgNC) or AGPS-targeting sgRNAs. β-Actin was used as a loading control. Plot of experiment performed once.
d. Viability curves for HuH-7 cells expressing the indicated sgRNAs treated with indicated concentrations of ML210 or RSL3 for 48 h. n=4 biologically independent samples. Representative results from experiment performed twice.
e. Viability curves for SNU-685 cells expressing the indicated sgRNAs treated with indicated concentrations of ML210 or RSL3 for 48 h. n=4 biologically independent samples. Representative results from experiment performed once.
f. Volcano plots showing the lipidomic analysis (Saito et al. 2016) results comparing 49 pairs of clear-cell renal cell carcinoma (ccRCC) tumor and adjacent normal kidney tissues. n=49 tumor samples, n=49 normal samples. Two-tailed Student’s T-test. Multiple-testing adjustment was performed using the Benjamini-Hochberg method. Abbreviations: PC, phosphatidylcholine; PE, phosphatidylethanolamine; ePE, ether-phosphatidylethanolamine; ePC, ether-phosphatidylcholine.
See Supplementary Information for uncropped immunoblot images. For viability curves, data center and error bars indicate mean±s.d..
Extended Data Figure 7. AGPAT3 contributes to polyunsaturated ether phospholipid synthesis downstream of peroxisomes.
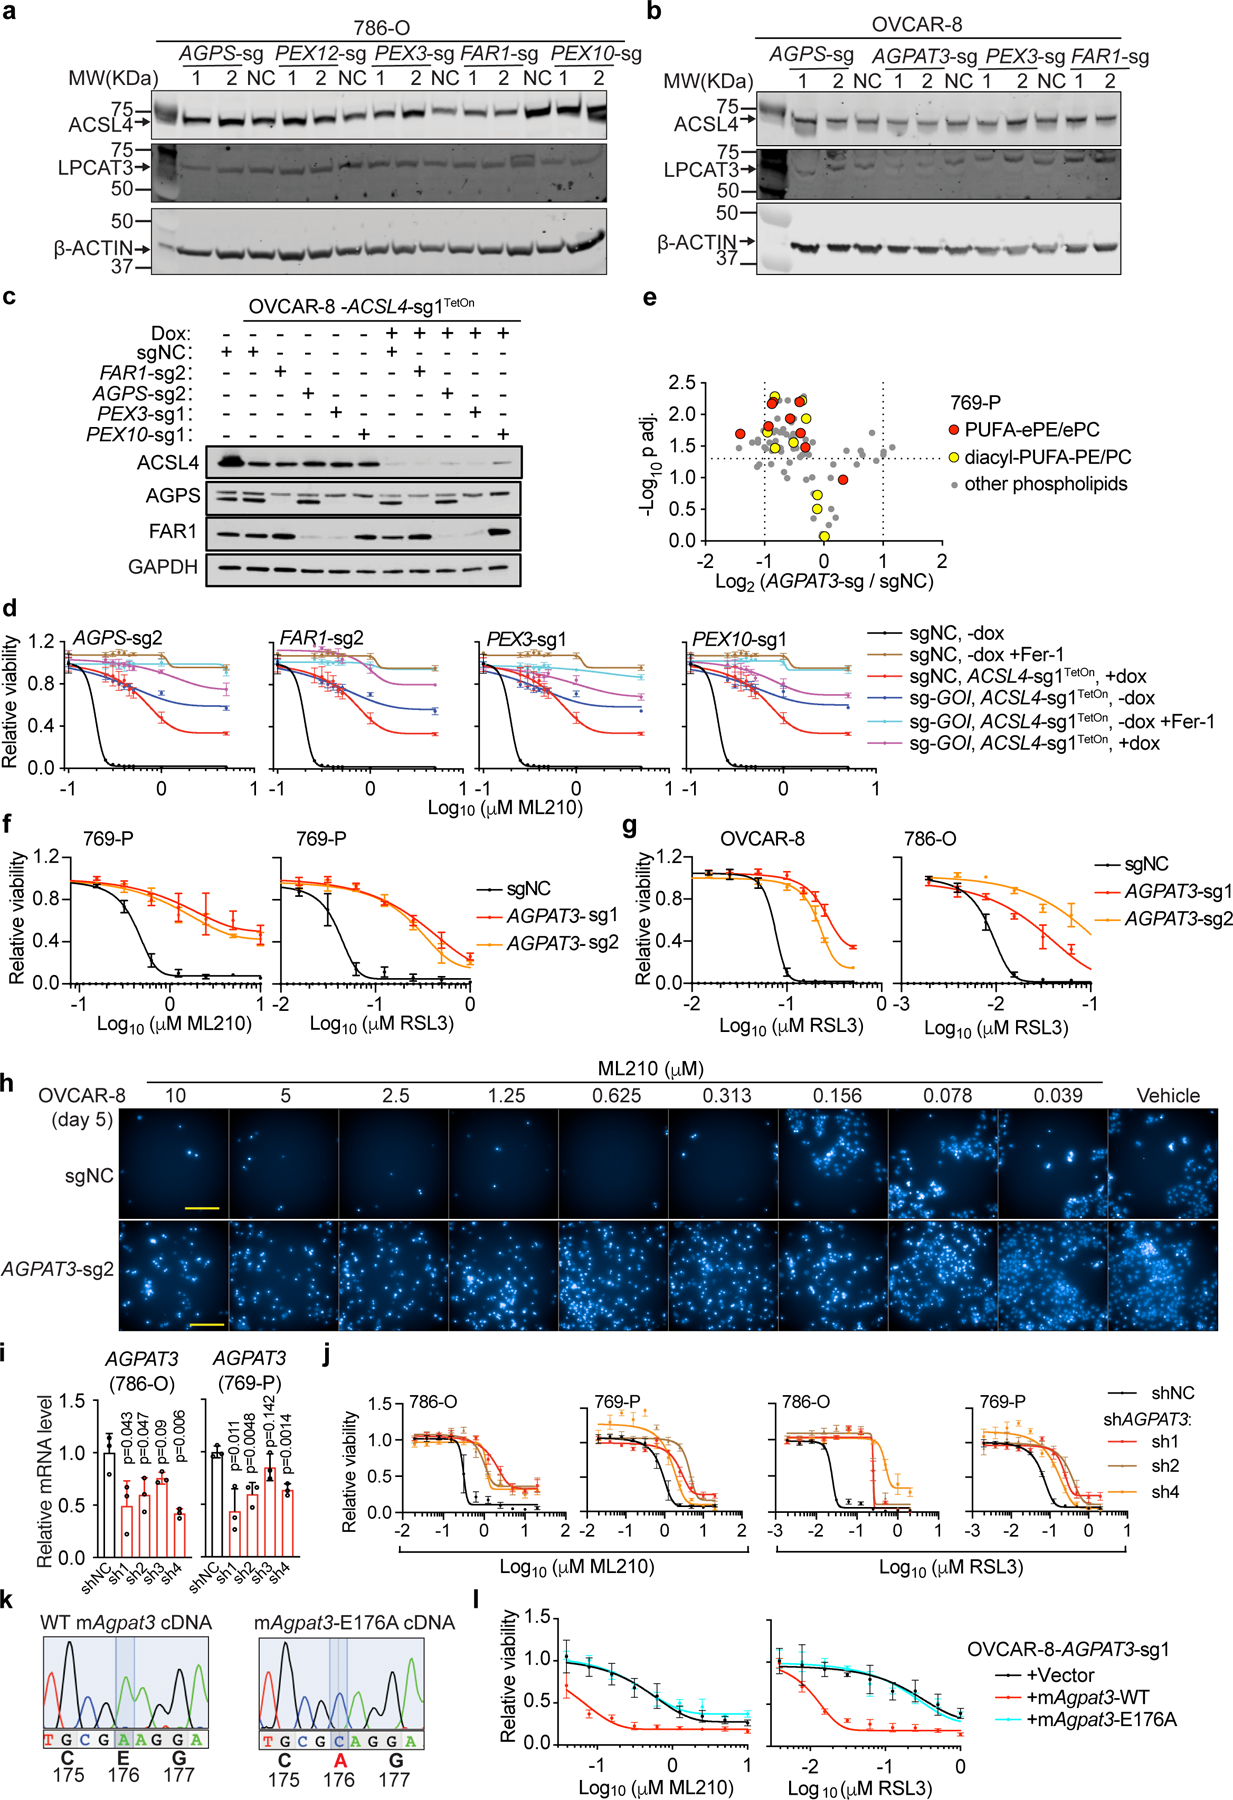
a. Immunoblot analysis of ACSL4 and LPCAT3 protein levels in 786-O cells expressing the indicated sgRNAs. Plot of experiment performed once.
b. Immunoblot analysis of ACSL4 and LPCAT3 protein levels in OVCAR-8 cells expressing the indicated sgRNAs. Plot of experiment performed once.
c. Immunoblotting of ACSL4, AGPS and FAR1 protein levels in the indicated OVCAR-8 cell lines. Representative result of experiment performed in duplicate.
d. Viability curves of OVCAR-8 cells expressing sgNC or sgRNAs targeting the gene of interest (GOI) as indicated on top of each graph, and transduced with doxycycline (dox)-inducible ACSL4-sgRNA1TetOn construct. These cells were pre-treated with vehicle or dox, and then treated with indicated concentrations of ML210, or ML210+Fer-1 for 72 h. n=3 biologically independent samples. Representative results from experiment performed twice.
e. Volcano plot showing the changes in phospholipid levels in sgNC or AGPAT3-targeting sgRNA expressing 769-P cells. n=3 biologically independent samples. Two tailed Student’s T-test. Multiple-testing adjustment was performed using the Benjamini-Hochberg method.
f. Viability curves for 769-P cells expressing sgNC or AGPAT3-targeting sgRNAs treated with indicated concentrations of ML210 or RSL3 for 48 h. n=4 biologically independent samples. Representative results from experiment performed in triplicate.
g. Viability curves for 786-O and OVCAR-8 cells expressing sgNC or AGPAT3-targeting sgRNAs treated with indicated concentrations of RSL3 for 48 h. n=3 (OVCAR-8) or n=4 (786-O) biologically independent samples. Representative results from experiment performed in triplicate.
h. Fluorescent imaging showing nuclear staining by Hoechst 33342 in OVCAR-8 cells with the indicated genetic perturbations and treated with vehicle (DMSO) or indicated concentrations of ML210 for 5 days. Representative images from experiment performed once, and each condition has three biological replicates.
i. qRT-PCR analysis of relative AGPAT3 mRNA expression in 786-O and 769-P cells expressing non-targeting negative control shRNA (shNC) or AGPAT3-targeting shRNAs. B2M was used as a loading control. n=3 biologically independent samples. Two-tailed student’s T-test; ns, not significant.
j. Viability curves for 786-O, and 769-P cells expressing shNC or AGPAT3-targeting shRNAs treated with indicated concentrations of ML210 or RSL3 for 48 h. n=4 biologically independent samples. Representative results from experiment performed in triplicate.
k. Nucleotide traces in sanger sequencing analysis showing the point mutation introduced in the mouse Agpat3E176A cDNA construct.
l. Viability curves of AGPAT3-sg1-expressing OVCAR-8 cells rescued with sgRNA-resistant, wildtype (WT) mouse Agpat3 or Agpat3E176A mutant cDNA and being treated with indicated concentrations of RSL3 for 24 h. n=4 biologically independent samples. Representative data of experiment performed twice.
β-Actin or GAPDH was used as a loading control. See Supplementary Information for uncropped immunoblot images. For viability curves and bar graphs, data center and error bars indicate mean±s.d..
Extended Data Figure 8. Polyunsaturated ether lipid nanoparticles increase cellular sensitivity to ferroptosis.
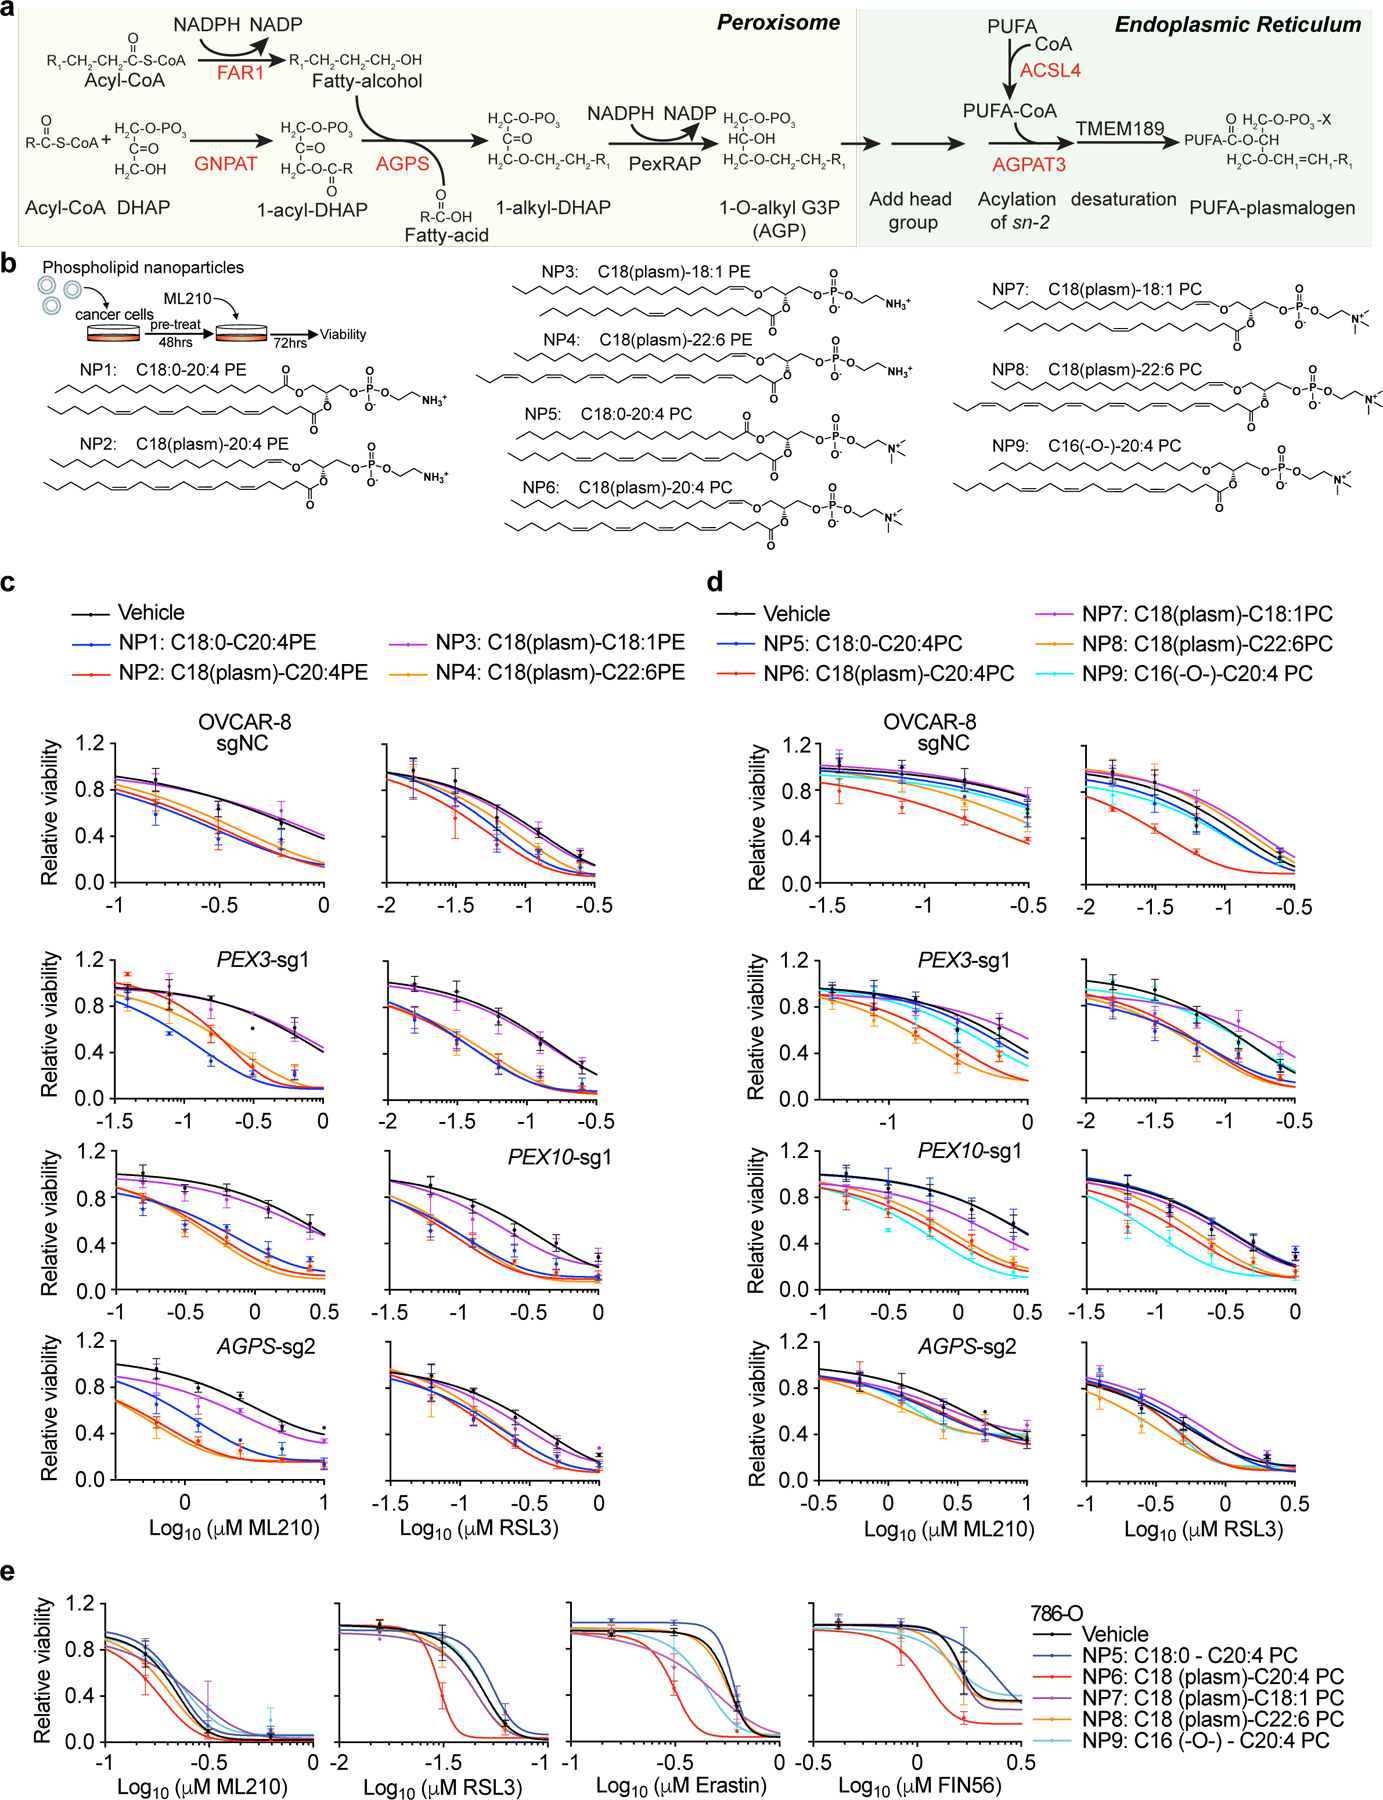
a. Schematic of the plasmalogen biosynthesis pathway. Genes marked in red highlight pro-ferroptotic genes identified from the CRISPR screens.
b. Strategy used to deliver synthetic phospholipids to OVCAR-8 cells using nanoparticles, and the chemical structures of synthetic phospholipids used.
c. Viability curves of OVCAR-8 cells expressing the indicated sgRNAs pre-treated with vehicle (sterilized water) or the specified PE nanoparticles, and then treated with indicated concentrations of ML210 or RSL3 for 72 h. n=4 biologically independent samples. Veh, vehicle used to package the phospholipids.
d. Viability curves of OVCAR-8 cells expressing the indicated sgRNAs pre-treated with vehicle or the specified PC nanoparticles, and then treated with indicated concentrations of ML210 or RSL3 for 72 h. n=4 biologically independent samples. Veh, vehicle used to package the phospholipids. P value for comparing the relative viabilities of NP5: C18:0-C20:4PC treated cells (blue) with that of NP6: C18 (plasm)-C20:4 PC (red): for ML210=0.0391 µM, p=0.00741; for ML210=0.0781 µM, p=0.00095; for ML210=0.156 µM, p=0.00177; for ML210=0.3125 µM, p=0.0101; for RSL3=0.0156 µM, p=0.0000468; for RSL3=0.03125 µM, p=0.00241; for RSL3=0.0625 µM, p=0.00104. Two-tailed Student’s T test.
e. Viability curves of 786-O cells expressing the indicated sgRNAs pre-treated with vehicle or the specified PC nanoparticles, and then treated with ferroptosis inducers. n=4 biologically independent samples.
For viability curves, data center and error bars indicate mean±s.d..
Extended Data Figure 9. Polyunsaturated plasmalogens promote lipid peroxidation in GPX4-inhibited cells.
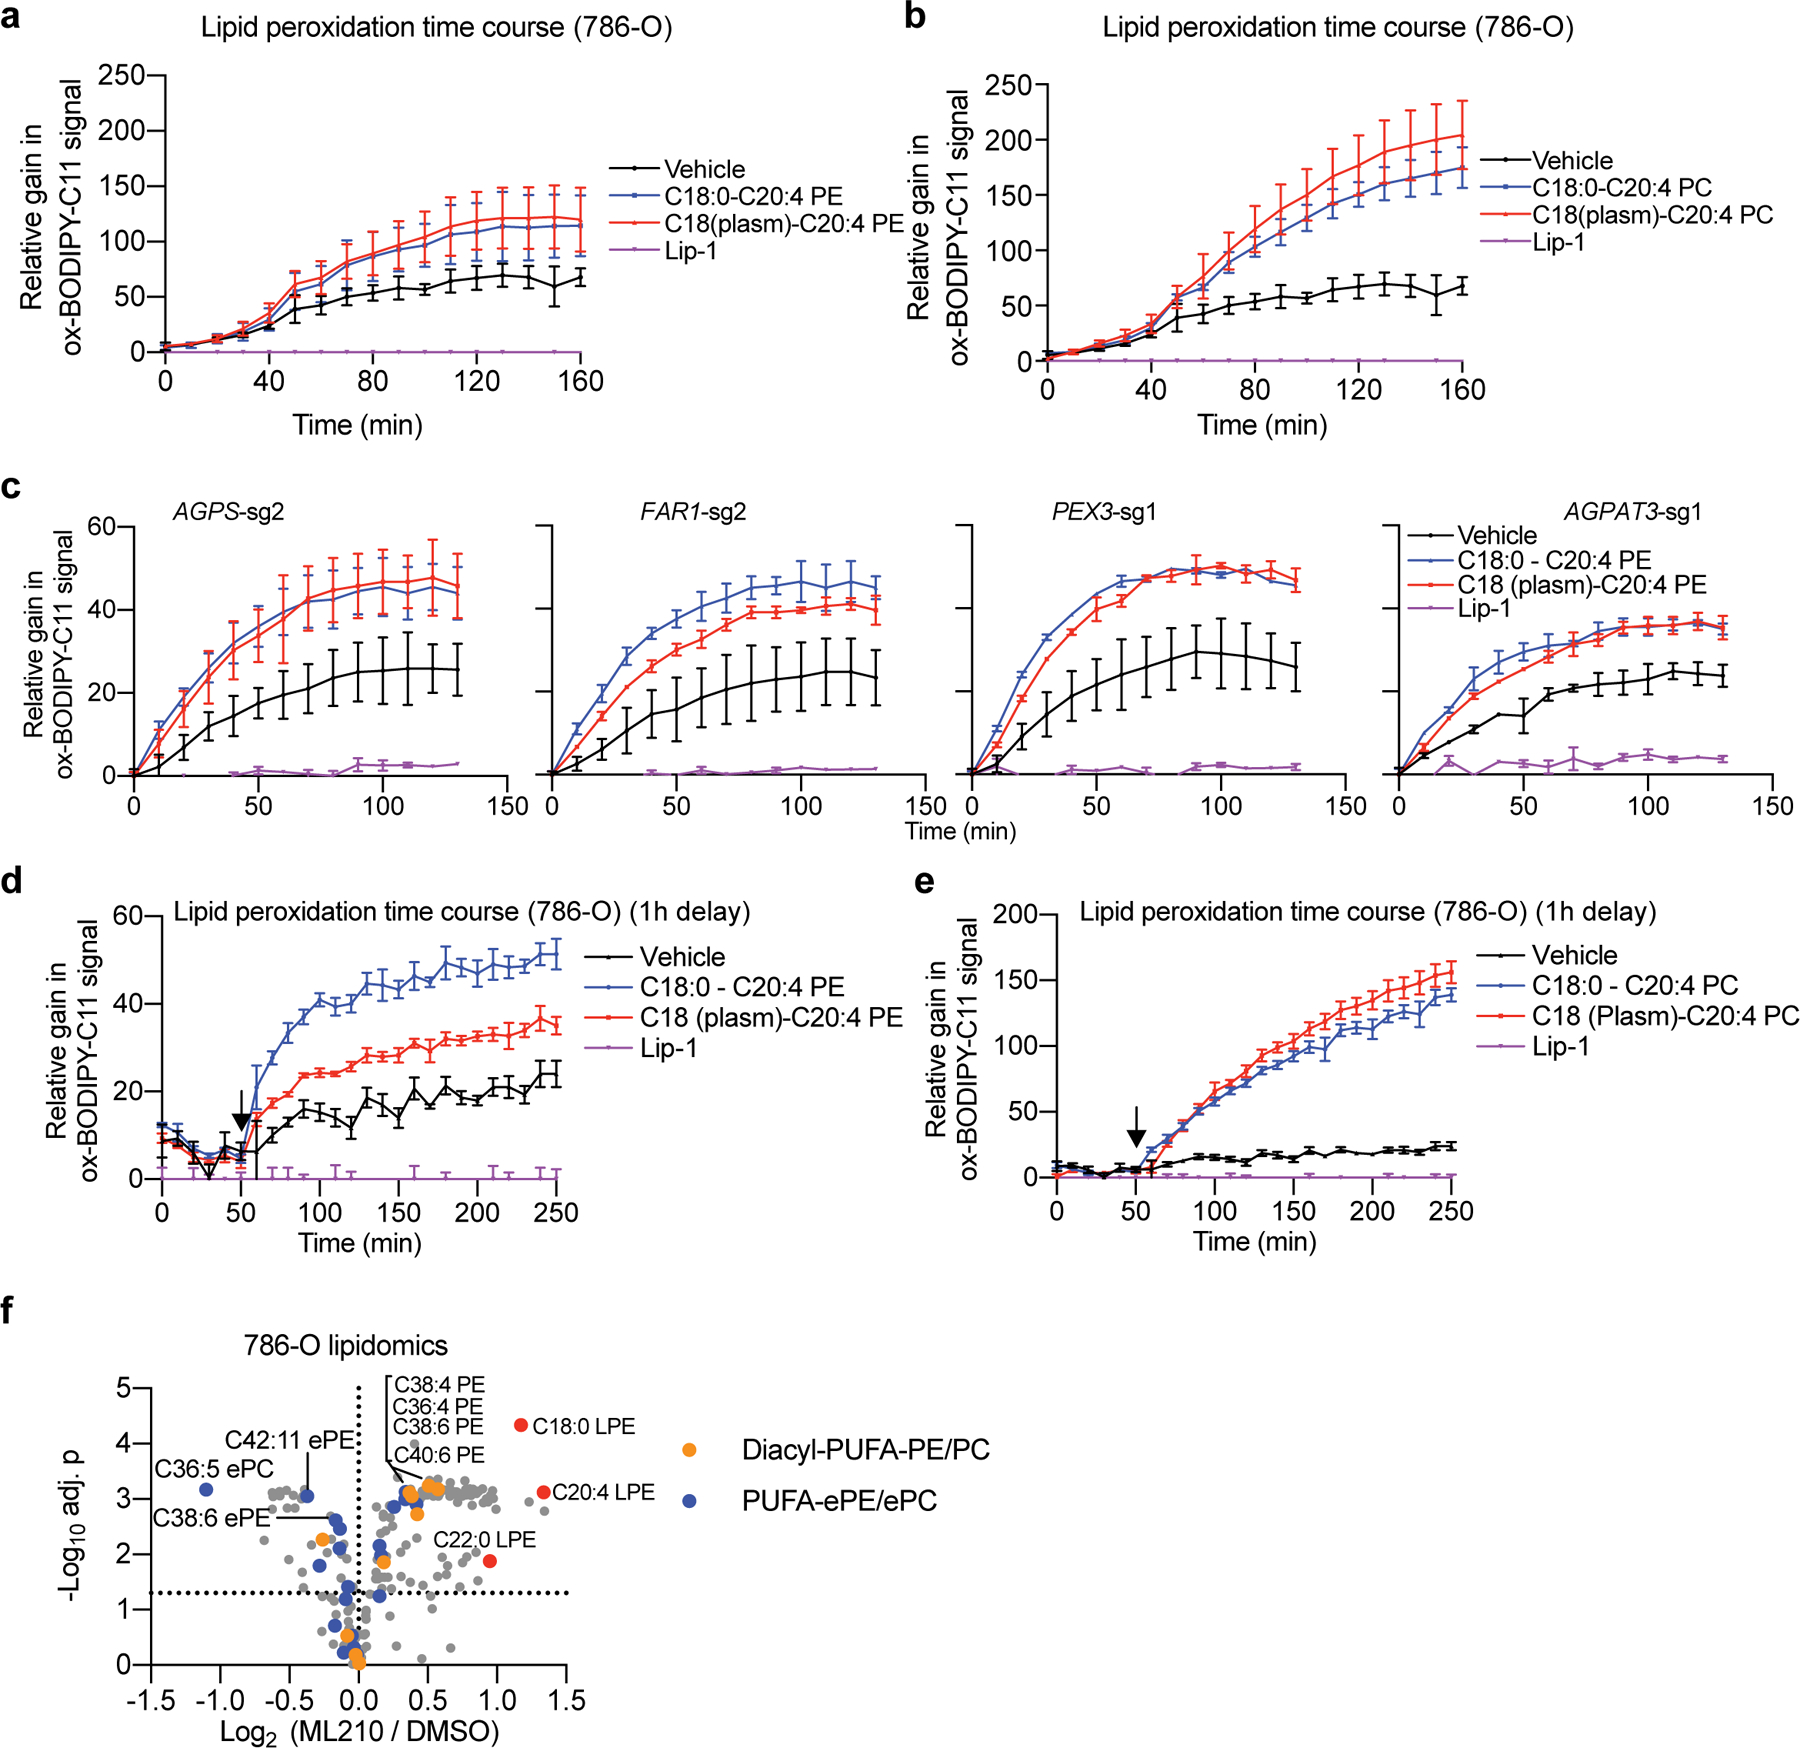
a. Quantification of time-lapse imaging of lipid peroxidation levels reported by BODIPY-C11 oxidation in 786-O cells co-treated with ML210 and indicated PE nanoparticles or Lip-1. n=3 biologically independent samples.
b. Quantification of time-lapse imaging of lipid peroxidation levels reported by BODIPY-C11 oxidation in 786-O cells co-treated with ML210 and indicated PC nanoparticles or Lip-1. n=3 biologically independent samples.
c. Quantification of time-lapse imaging of lipid peroxidation levels reported by BODIPY-C11 oxidation in 786-O cells expressing the indicated sgRNAs treated with ML210 and indicated PE nanoparticles or Lip-1. n=2 biologically independent samples. Nanoparticles were added at the same time as ML210.
d. Quantification of time-lapse imaging of lipid peroxidation levels reported by BODIPY-C11 oxidation in 786-O cells treated with ML210 and indicated PE nanoparticles or Lip-1. n=3 biologically independent samples. Nanoparticles were added 1 h after ML210 administration (indicated by the arrow, note a 10 min time is deduced for reagent and equipment handling).
e. Quantification of time-lapse imaging of lipid peroxidation levels reported by BODIPY-C11 oxidation in 786-O cells treated with ML210 and indicated PC nanoparticles or Lip1. n=3 biologically independent samples. Nanoparticles were added 1 h after ML210 administration (indicated by the arrow, note a 10 min time is deduced for reagent and equipment handling).
f. Volcano plots showing the lipidomic analysis of 786-O cells treated with ML210 or DMSO for 90 min. n=3 biologically independent samples. Two tailed Student’s T-test. Multiple-testing adjustment was performed using the Benjamini-Hochberg method.
For viability curves and lipid peroxidation time-lapse imaging quantification, data center and error bars indicate mean±s.d..
Extended Data Figure 10. Polyunsaturated ether phospholipid down-regulation is associated with acquired ferroptosis resistance in vivo.
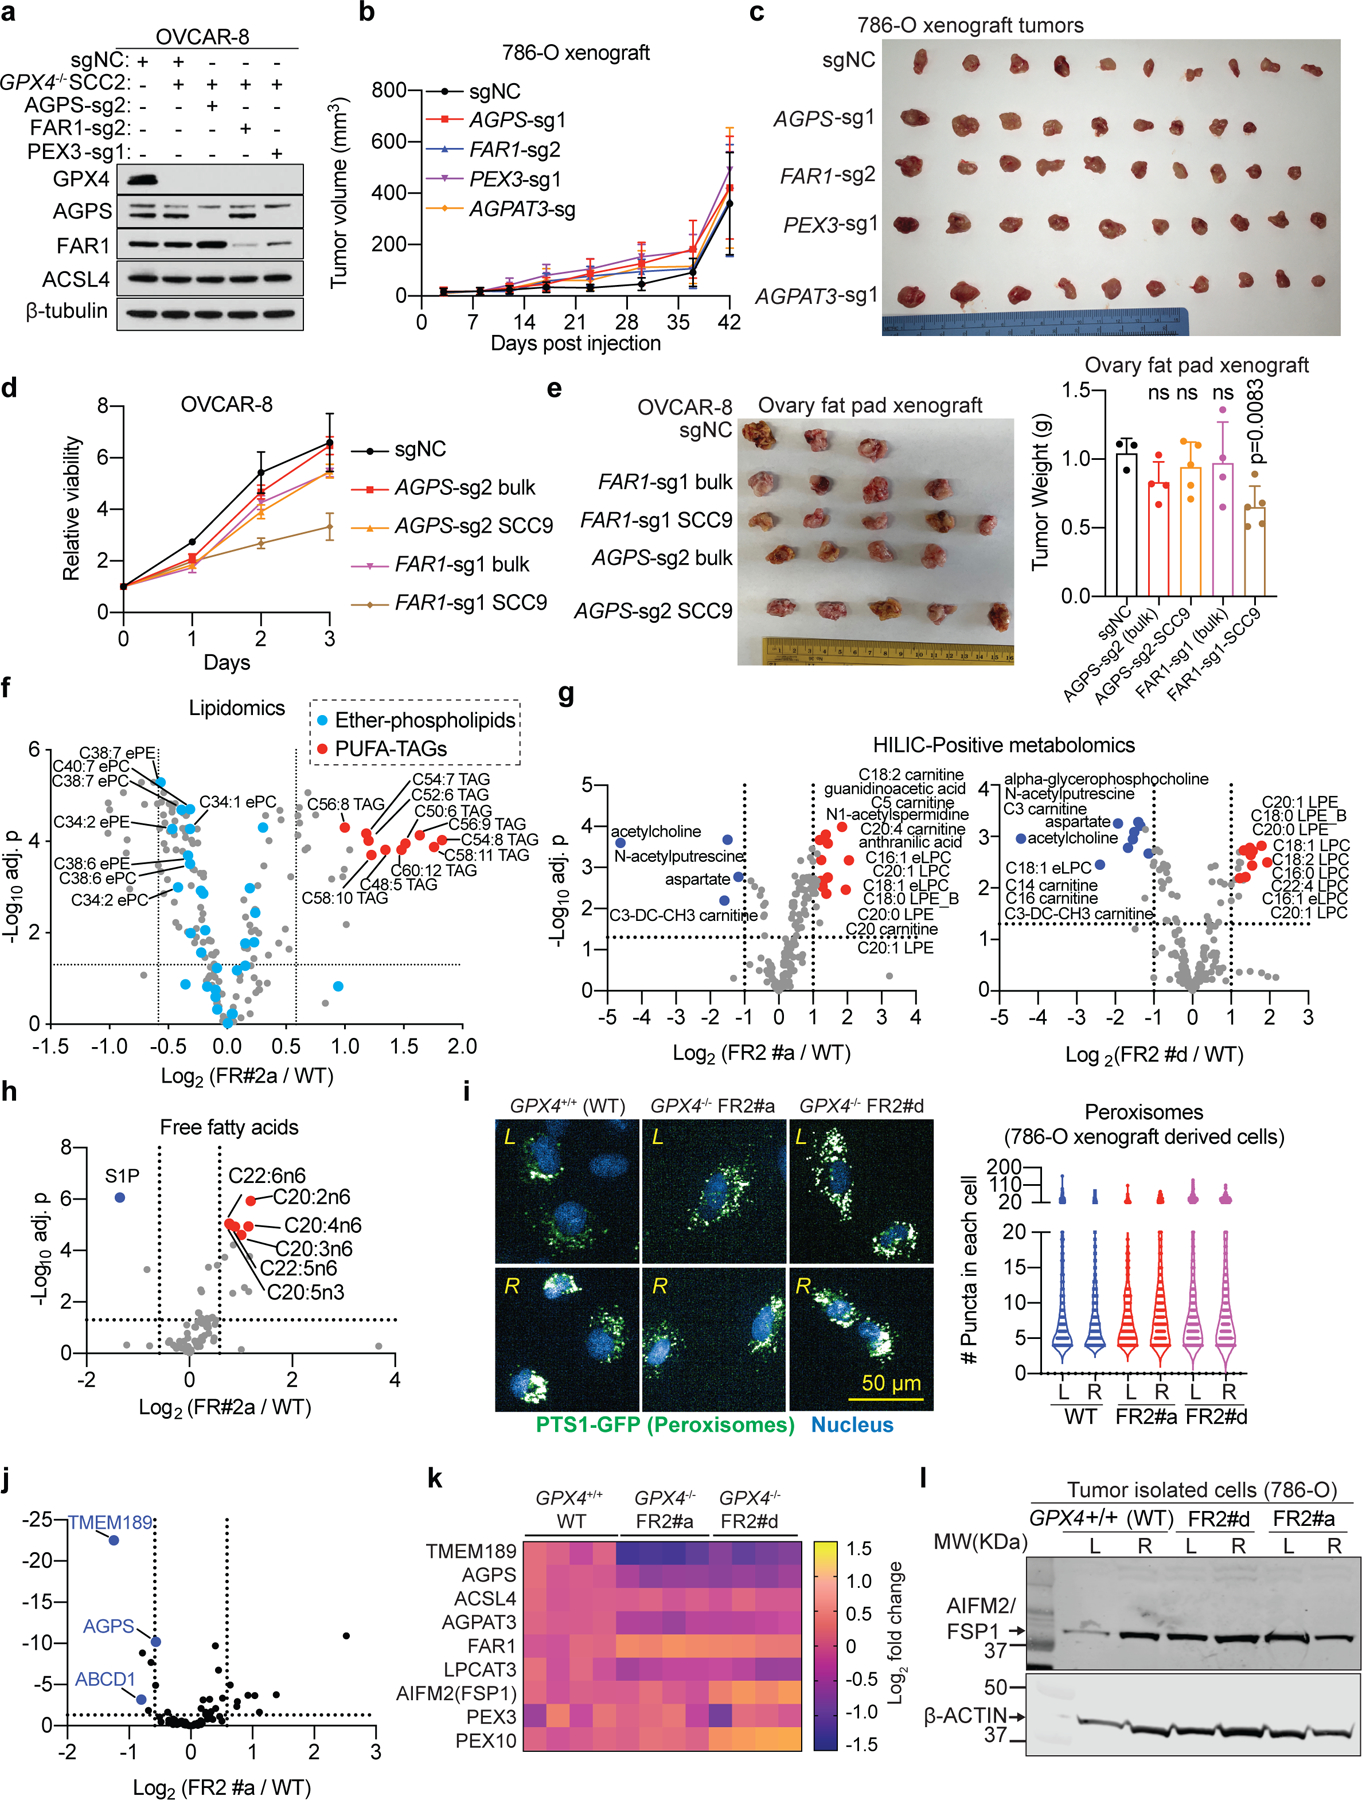
a. Immunoblotting analysis of GPX4, AGPS, FAR1 and ACSL4 protein levels of GPX4+/+ and GPX4−/− OVCAR-8 cells expressing sgNC or sgRNAs targeting each of AGPS, FAR1, and PEX3. β-tubulin was used as a loading control. Representative result of experiment performed in duplicate.
b. Tumor growth curves from mice implanted with 786-O cells expressing sgNC or sgRNAs targeting each of AGPS, FAR1, PEX3 and AGPAT3. n=5 mice per group, each mouse was injected with two tumors. Plot of experiment performed once. For day-42 tumor sizes, sgNC vs AGPS-sg1, p=0.496; sgNC vs FAR1-sg2, p=0.899; sgNC vs PEX3-sg1, p=0.066; sgNC vs AGPAT3-sg, p=0.54. Two tailed Student’s T-test.
c. Tumor images showing the relative sizes of the xenograft tumors formed by 786-O cells expressing sgNC or sgRNAs targeting each of AGPS, FAR1, PEX3 and AGPAT3 and dissected at day 42. Results from experiment performed once.
d. Relative viability of OVCAR-8 cells expressing sgNC, AGPS-sg2 or FAR1-sg1, and AGPS−/− and FAR1−/− single cell clones (SCC) over a 3-day time course. n=3 biologically independent samples. Representative results of experiments performed in triplicates. For day-3 viability, sgNC vs AGPS-sg2 bulk, p=0.872; vs AGPS-sg2 SCC9, p=0.172; vs FAR1-sg1 bulk, p=0.151; vs FAR1-sg1 SCC9, p=0.01. Two tailed Student’s T-test.
e. Relative sizes (left) and weights (right) of xenograft tumors dissected from immunocompromised mice injected with OVCAR-8 cells with the indicated genetic background. sgNC, n=3 tumors, FAR1-sg1 bulk, n=4 tumors, FAR1-sg1 SCC9, n=5 tumors, AGPS-sg2 bulk, n=4 tumors, AGPS-sg2 SCC9, n=5 tumors. Two tailed Student’s T-test., ns, not significant (p>0.05). Data of experiment performed once.
f. Volcano plot showing the global lipidomic analysis comparing GPX4−/− FR2#a cells and GPX4+/+ wildtype (WT) 786-O cells isolated from xenograft tumors. Two tailed Student’s T-test. Multiple-testing adjustment was performed using the Benjamini-Hochberg method. TAG, triacylglycerol; PUFA-, polyunsaturated fatty acyl-. n=6 biologically independent samples.
g. Volcano plot showing polar metabolomic analysis using HILIC-positive method and comparing GPX4−/− FR2#a (left) or FR2#d (right) cells and GPX4+/+ wildtype (WT) 786-O cells. n=6 in each group. Two tailed Student’s T-test. Multiple-testing adjustment was performed using the Benjamini-Hochberg method.
h. Volcano plot showing the free fatty acid lipidomic analysis comparing GPX4−/− FR2#a cells and GPX4+/+ wildtype (WT) 786-O cells. n=6 biologically independent samples in each group. Two tailed Student’s T-test. Multiple-testing adjustment was performed using the Benjamini-Hochberg method. S1P: sphingosine-1-phosphate.
i. Representative fluorescent images (left) of peroxisomes reported by PTS1-GFP expression and quantifications (right) in GPX4+/+ (WT), GPX4−/− FR2#a and FR2#d 786-O cells. Scale bar indicates 50 µm. WT-L, n=1320, WT-R, n=863, FR2#a-L, n=533, FR2#a-R, n=512, FR2#d-L, n=876, FR2#d-R, n=1019. Lines in violin plots indicate median and quartiles. Data of experiment performed once.
j. Volcano plots showing the relative mRNA expression (RNA-seq) of 87 peroxisome and ether-lipid biosynthesis-related genes comparing GPX4+/+ and GPX4−/− FR2#d cells. n=4 biologically independent samples. See Supplementary Information for statistical methods used.
k. Heatmap showing the relative mRNA expression of indicated genes GPX4+/+ (WT), GPX4−/− FR2#a and FR2#d 786-O cells analyzed by RNA-seq.
l. Immunoblotting analysis of AIFM2/FSP1 protein levels in GPX4+/+ (WT), GPX4−/− FR2#a and FR2#d 786-O cells. β-ACTIN was used as a loading control. Results from experiment performed once.
See Supplementary Information for uncropped immunoblot images. For cell and tumor growth curves and bar graphs, data center and error bars indicate mean±s.d..
Extended Data Figure 11. ER-resident enzyme plasmanylethanolamine desaturase/TMEM189 is not required for ferroptosis sensitivity in cancer cells.
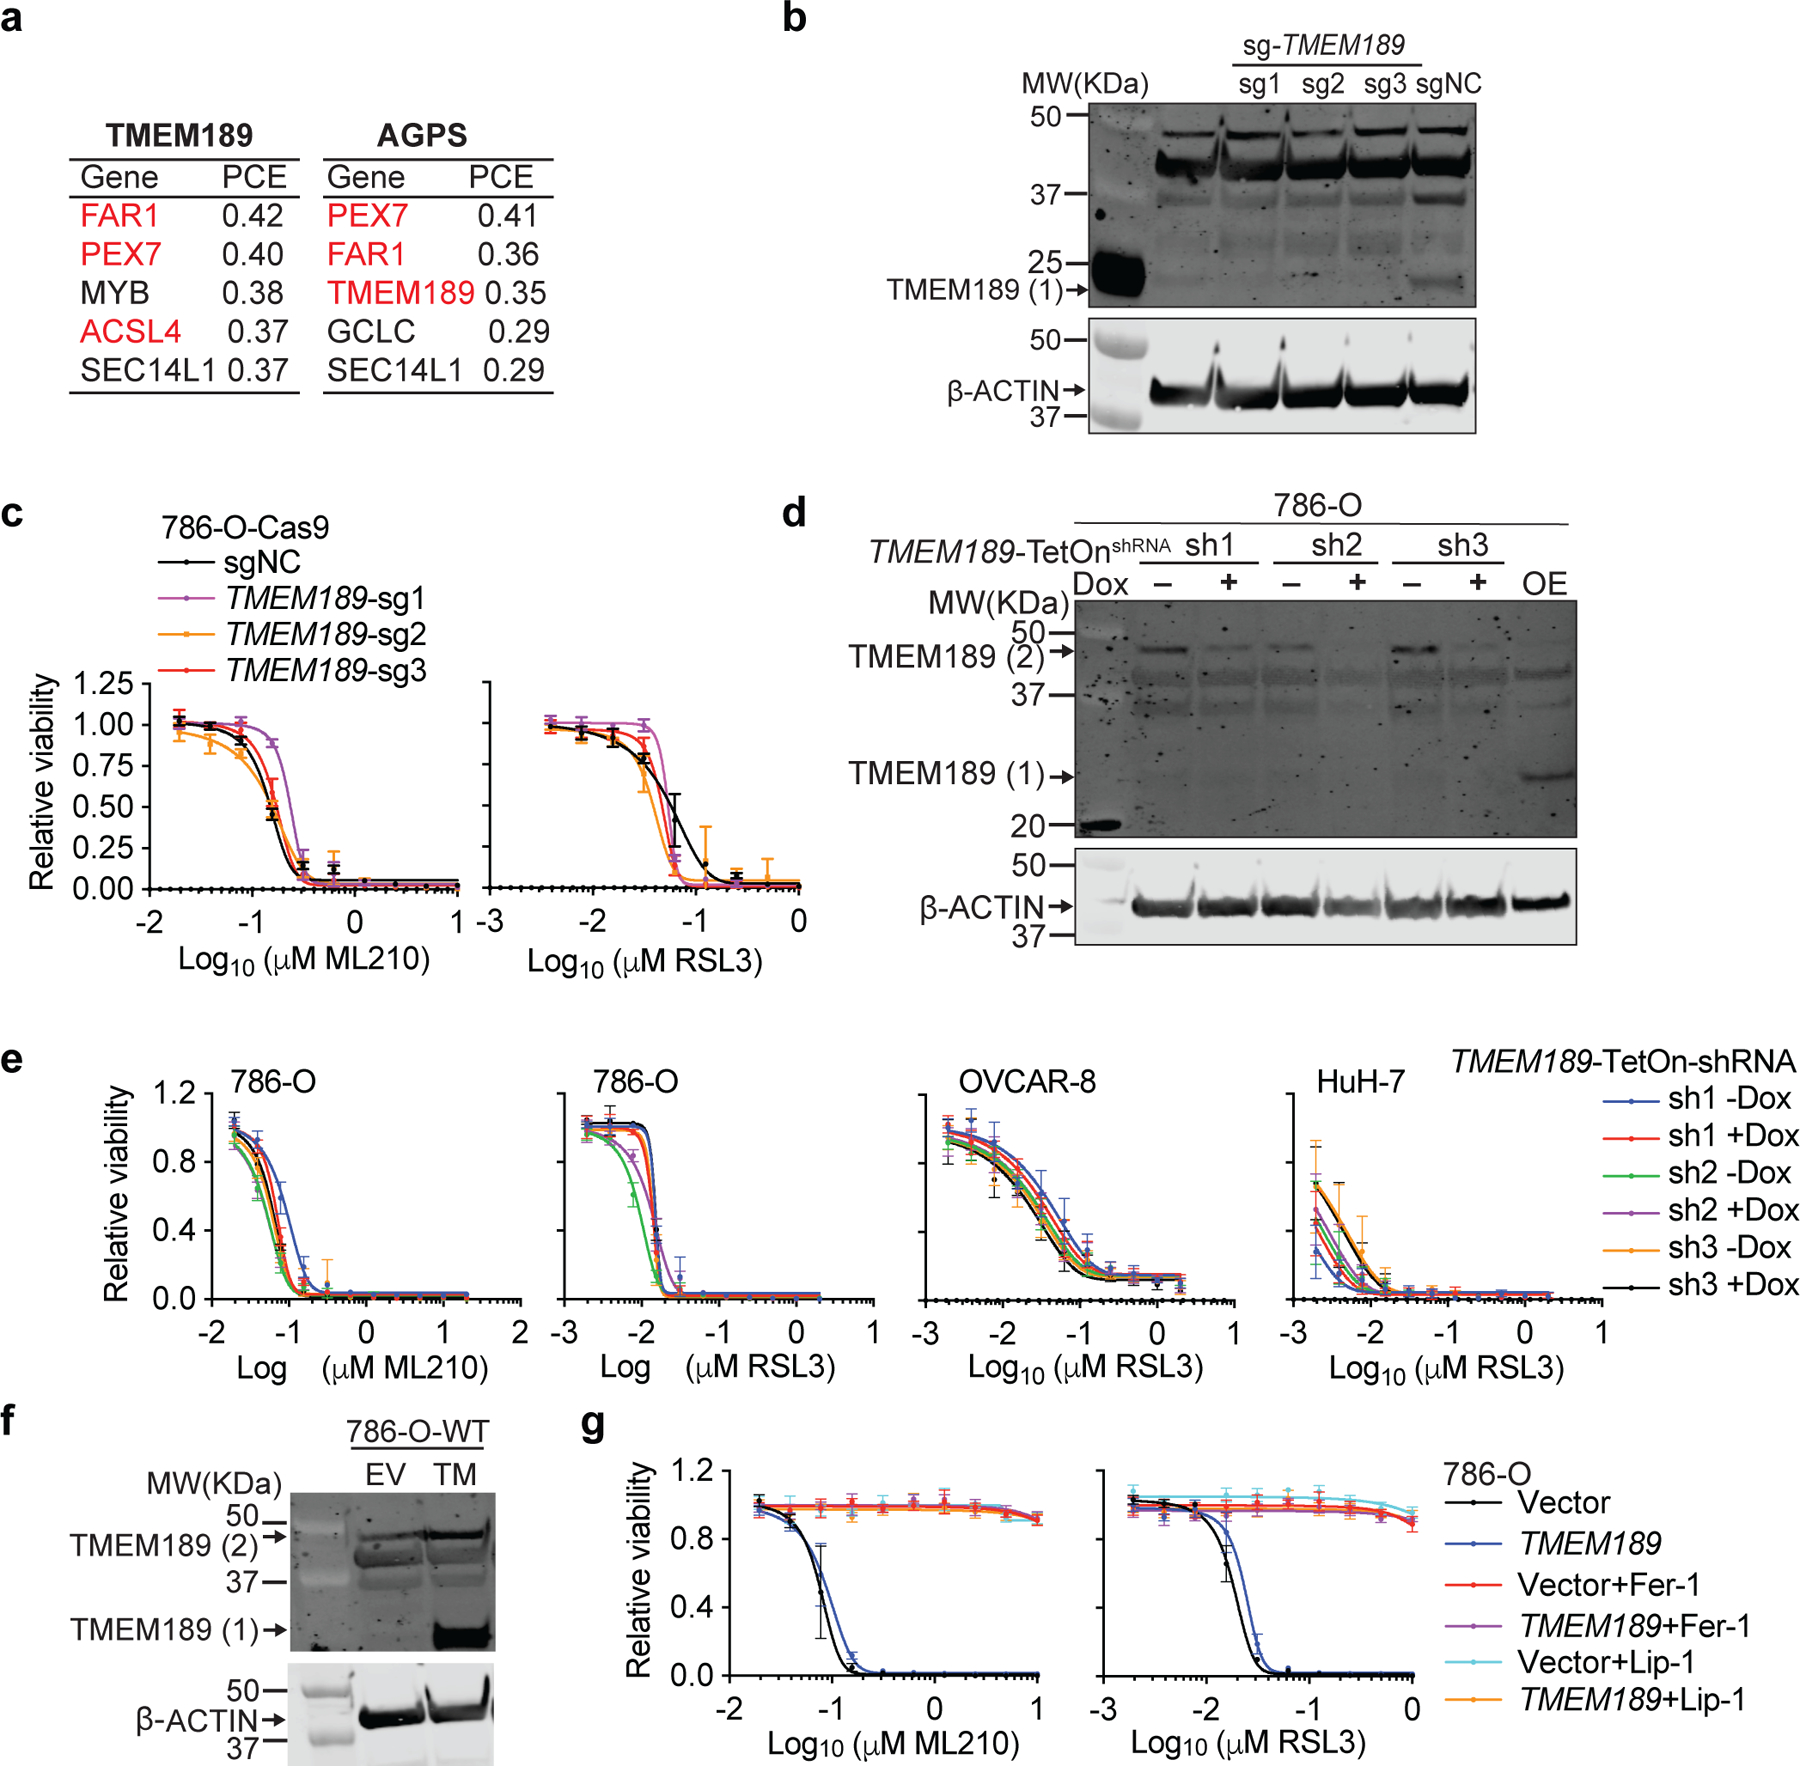
a. Top genes that show co-dependency with TMEM189 (left) or AGPS (right) using the Cancer Dependency Map (DepMap) database. PCE: Pearson correlation coefficient.
b. Immunoblotting analysis of TMEM189 protein levels in 786-O cells expressing sgNC or TMEM189-targeting sgRNAs. Representative results of experiment performed twice.
c. Viability curves for 786-O cells expressing sgNC or TMEM189-targeting sgRNAs and treated with indicated concentrations of ML210 or RSL3 for 48 h. n=4 biologically independent samples. Representative results of experiment performed twice.
d. Immunoblotting analysis of TMEM189 protein levels in 786-O cells expressing doxycycline (dox)-inducible TMEM189-shRNAs. β-ACTIN was used as a loading control. Results from experiment performed once.
e. Viability curves for 786-O, OVCAR-8 and HuH-7 cells expressing dox-inducible TMEM189-targeting shRNAs, pretreated with vehicle (DMSO) or dox, and then treated with indicated concentrations of ML210 or RSL3. n=4 biologically independent samples. Representative results of experiment performed twice.
f. Immunoblotting analysis of TMEM189 protein levels in 786-O cells expressing empty vector (EV) or human TMEM189 cDNA construct. β-ACTIN was used as a loading control. Results from experiment performed once.
g. Viability curves for 786-O cells expressing empty vector or TMEM189 cDNA and treated with indicated concentrations of ML210 or RSL3 for 48 h. n=4 biologically independent samples. Representative results of experiment performed twice.
β-ACTIN was used as a loading control in immunoblots. See Supplementary Information for uncropped immunoblot images. For viability curves, data center and error bars indicate mean±s.d..
Extended Data Figure 12. Neurons and cardiomyocytes acquire increased ether-phospholipid levels and elevated sensitivity to ferroptosis.
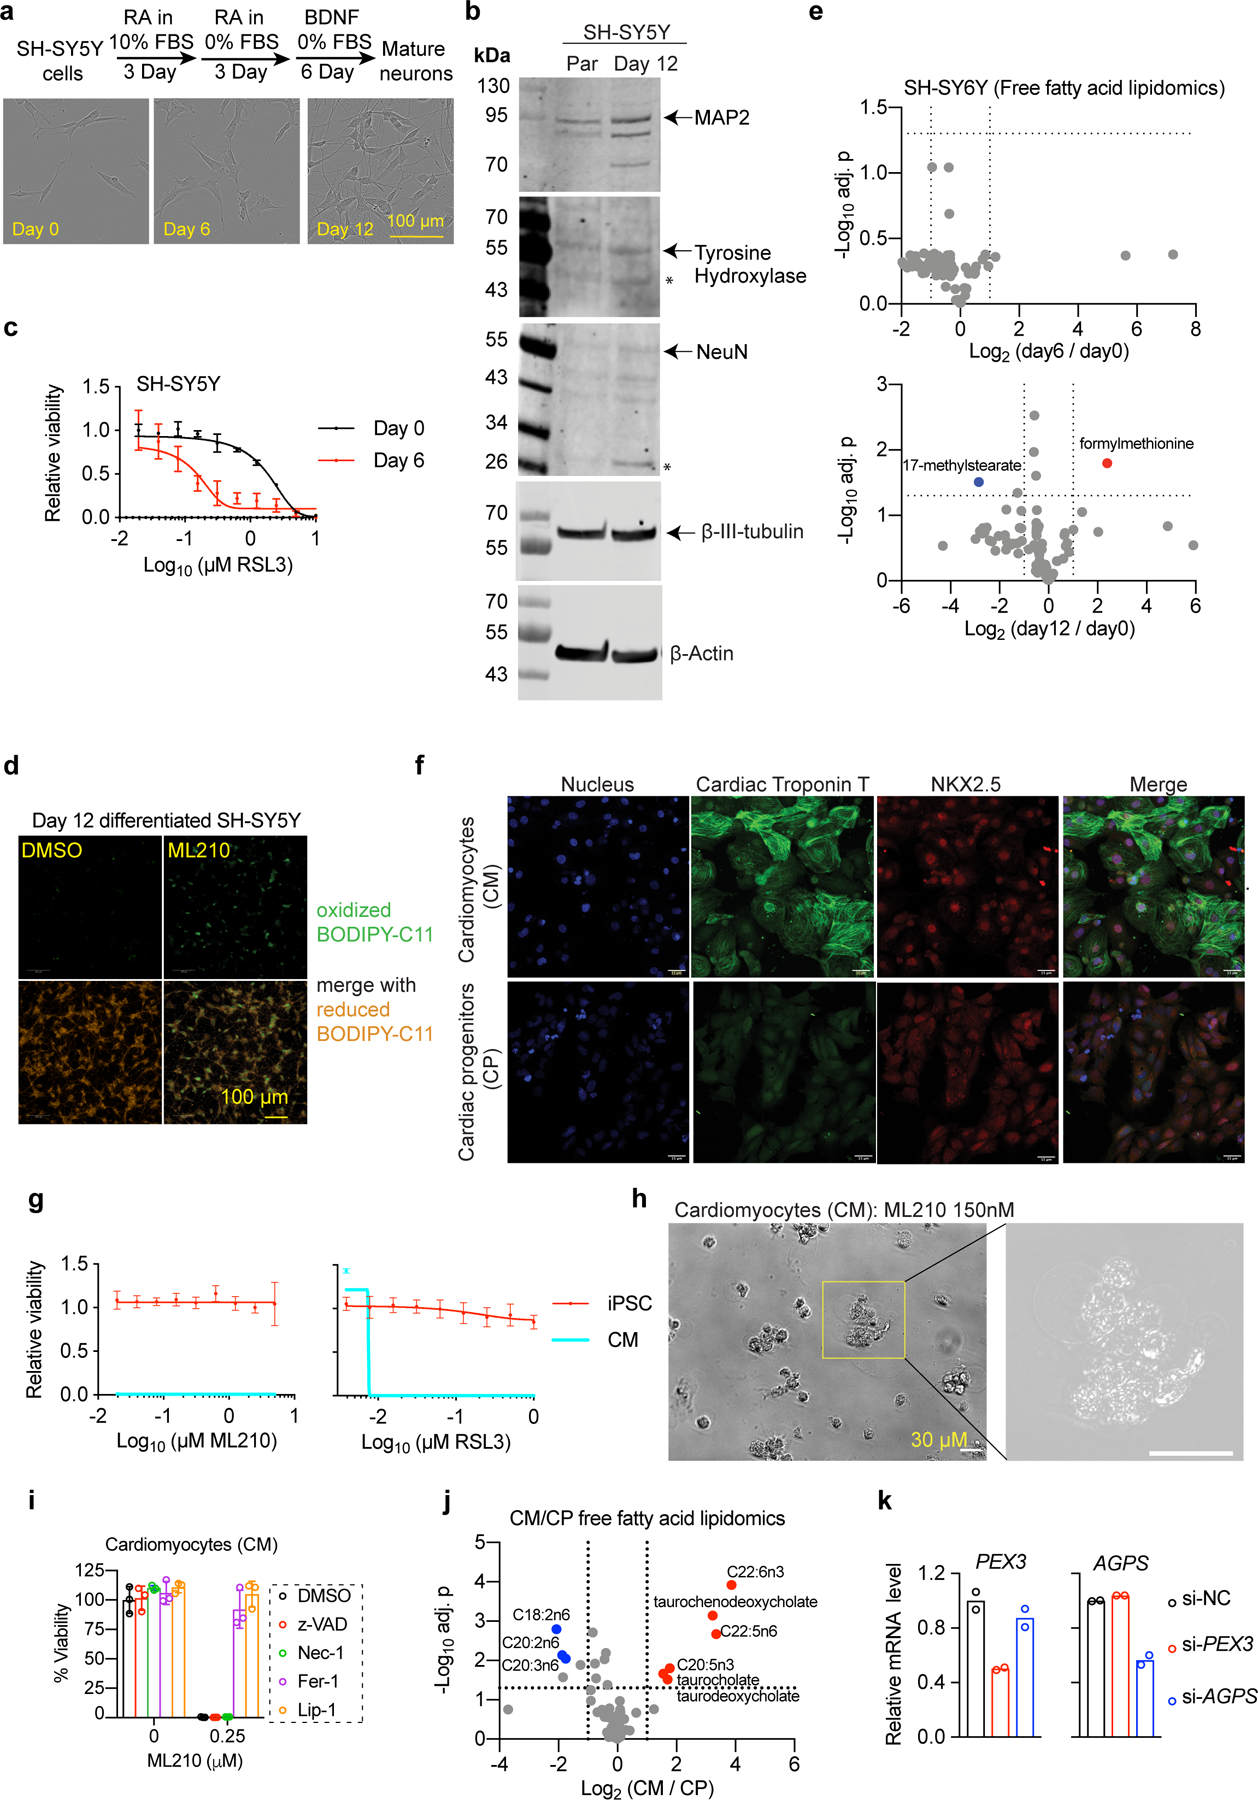
a. Scheme showing the experimental strategy for neuronal differentiation of SH-SY5Y cells, and representative images showing the cell morphology at indicated stages. RA, retinoic acid; BDNF, brain-derived neurotrophic factor; FBS, fetal bovine serum.
b. Immunoblot analysis showing the protein expression levels of relevant neuronal markers including MAP2 (microtubule associated protein 2), tyrosine hydroxylase, NeuN (neuronal nuclei antigen) and β-3-tubulin. Arrows indicate the band for the indicated full length protein, * indicates non-specific bands. β-Actin was used as a loading control. Representative results of experiment performed twice.
c. Viability curves of SH-SY5Y parental cells and cells at day 6 of neuronal differentiation under the treatment of indicated concentrations of RSL3 for 48 h. n=2 biologically independent samples. Representative results of experiment performed twice.
d. Fluorescent images showing lipid peroxidation levels reported by BODIPY-C11 oxidation. Representative images of experiment performed in duplicate.
e. Volcano plot showing free fatty acid lipidomics analysis in parental or differentiated SH-SY5Y cells. n=3 biological replicates for the parental condition, n= 4 biological replicates for the day 6 and day 12 differentiation condition. Two tailed Student’s T test. Multiple-testing adjustment was performed using the Benjamini-Hochberg method.
f. Immunofluorescence images showing the expression of cardiac troponin T, a marker of differentiated human cardiomyocytes, and NKX2.5, a cardiac-lineage specific marker in the cardiac progenitor (CP) cells and cardiomyocytes (CM). Scale bars indicate 15 µm. Representative results of experiment performed twice.
g. Viability curves of iPS cells and differentiated cardiomyocytes (CM) treated with indicated concentrations of ML210 or RSL3 for 24 h. n=4 biologically independent samples. Results from experiment performed once.
h. Bright field images showing cardiomyocytes treated with ML210 undergoing cell death. Scale bars indicate 30 µm. Representative results of experiment performed twice.
i. Bar plots showing relative viability of CMs treated with ML210 and indicated cell death inhibitors. z-VAD, z-VAD-FMK; Nec-1, necrostatin-1. n=3 biologically independent samples. Representative results of experiment performed twice. 0 µM vs 0.25 µM ML210 treated conditions with additional DMSO treatment only, p=0.00011. For 0.25 µM ML210 treated conditions, DMSO vs z-VAD, p=0.089; DMSO vs Nec-1, p=0.125; DMSO vs Fer-1, p=0.00061; DMSO vs Lip-1, p=0.00008. Two tailed Student’s t-Test.
j. Volcano plot showing free fatty acid lipidomics analysis in cardiac progenitors (CP) or differentiated cardiomyocytes (CM). n=2 biological replicates for CP, n=4 biological replicates for CM. Two tailed Student’s t-Test. Multiple-testing adjustment was performed using the Benjamini-Hochberg method.
k. qRT-PCR analysis showing the relative abundances of PEX3 (left) or AGPS (right) mRNAs in cardiomyocytes treated with the indicated siRNAs. n=2 biologically independent samples.
See Supplementary Information for uncropped immunoblot images. For viability curves and bar graphs, data center and error bars indicate mean±s.d..
Supplementary Material
Acknowledgements
We thank Joshua Pan, Elizaveta S. Leshchiner, Haoxin Li, Xin Rong and Xi Wang for insightful discussions, Kim Sigmund for sharing lentiviruses and other reagents, and the Broad Institute Genetic Perturbation Platform for providing gene editing and shRNA reagents. This work is supported in part by the NCI’s Cancer Target Discovery and Development (CTD2) Network (grant number U01CA217848, awarded to S. L. Schreiber). L. A. Boyer was supported by a grant from the Mathers Foundation. R. A. Weinberg received support from the NIH (P01 CA080111), Breast Cancer Research Foundation, Advanced Medical Research Foundation, Samuel Waxman Cancer Research Foundation and Ludwig Center for Molecular Oncology. Y. Zou was supported by the National Cancer Institute of the National Institutes of Health under Award Number K99CA248610. W. S. Henry was supported by a postdoctoral fellowship from the Jane Coffin Childs Memorial Fund. V. V. Phadnis is supported by the New Horizon UROP Fund/MIT. N. Boehnke is supported by a Department of Defense Peer Reviewed Cancer Research Program Horizon Award (W81XWH-19-1-0257).
Footnotes
Competing interests
S.L.S. serves on the Board of Directors of the Genomics Institute of the Novartis Research Foundation (“GNF”); is a shareholder and serves on the Board of Directors of Jnana Therapeutics; is a shareholder of Forma Therapeutics; is a shareholder and advises Kojin Therapeutics, Kisbee Therapeutics, Decibel Therapeutics and Eikonizo Therapeutics; serves on the Scientific Advisory Boards of Eisai Co., Ltd., Ono Pharma Foundation, Exo Therapeutics, and F-Prime Capital Partners; and is a Novartis Faculty Scholar. Kojin Therapeutics in particular explores the medical potential of cell plasticity related to ferroptosis. Other authors declare no conflict of interest relevant to this study.
References
- 1.Stockwell BR et al. Ferroptosis: A Regulated Cell Death Nexus Linking Metabolism, Redox Biology, and Disease. Cell 171, 273–285 (2017). [DOI] [PMC free article] [PubMed] [Google Scholar]
- 2.Matsushita M et al. T cell lipid peroxidation induces ferroptosis and prevents immunity to infection. J. Exp. Med 212, 555–568 (2015). [DOI] [PMC free article] [PubMed] [Google Scholar]
- 3.Zou Y et al. A GPX4-dependent cancer cell state underlies the clear-cell morphology and confers sensitivity to ferroptosis. Nat. Commun 10, 1617 (2019). [DOI] [PMC free article] [PubMed] [Google Scholar]
- 4.Viswanathan VS et al. Dependency of a therapy-resistant state of cancer cells on a lipid peroxidase pathway. Nature 547, 453–457 (2017). [DOI] [PMC free article] [PubMed] [Google Scholar]
- 5.Hangauer MJ et al. Drug-tolerant persister cancer cells are vulnerable to GPX4 inhibition. Nature 551, 247–250 (2017). [DOI] [PMC free article] [PubMed] [Google Scholar]
- 6.Yang WS et al. Regulation of ferroptotic cancer cell death by GPX4. Cell 156, 317–331 (2014). [DOI] [PMC free article] [PubMed] [Google Scholar]
- 7.Eaton JK et al. Selective covalent targeting of GPX4 using masked nitrile-oxide electrophiles. Nature Chemical Biology (2020) doi: 10.1038/s41589-020-0501-5. [DOI] [PMC free article] [PubMed] [Google Scholar]
- 8.Doll S et al. ACSL4 dictates ferroptosis sensitivity by shaping cellular lipid composition. Nat. Chem. Biol 13, 91–98 (2017). [DOI] [PMC free article] [PubMed] [Google Scholar]
- 9.Szklarczyk D et al. STRING v11: protein–protein association networks with increased coverage, supporting functional discovery in genome-wide experimental datasets. Nucleic Acids Res 47, D607–D613 (2019). [DOI] [PMC free article] [PubMed] [Google Scholar]
- 10.Islinger M, Voelkl A, Fahimi HD & Schrader M The peroxisome: an update on mysteries 2.0. Histochem. Cell Biol 150, 443–471 (2018). [DOI] [PMC free article] [PubMed] [Google Scholar]
- 11.Lodhi IJ & Semenkovich CF Peroxisomes: a nexus for lipid metabolism and cellular signaling. Cell Metab 19, 380–392 (2014). [DOI] [PMC free article] [PubMed] [Google Scholar]
- 12.Dean JM & Lodhi IJ Structural and functional roles of ether lipids. Protein Cell 9, 196–206 (2018). [DOI] [PMC free article] [PubMed] [Google Scholar]
- 13.Piano V et al. Discovery of Inhibitors for the Ether Lipid-Generating Enzyme AGPS as Anti-Cancer Agents. ACS Chem. Biol 10, 2589–2597 (2015). [DOI] [PMC free article] [PubMed] [Google Scholar]
- 14.Zou Y et al. Cytochrome P450 oxidoreductase contributes to phospholipid peroxidation in ferroptosis. Nat. Chem. Biol 16, 302–309 (2020). [DOI] [PMC free article] [PubMed] [Google Scholar]
- 15.Saito K et al. Lipidomic Signatures and Associated Transcriptomic Profiles of Clear Cell Renal Cell Carcinoma. Sci. Rep 6, 28932 (2016). [DOI] [PMC free article] [PubMed] [Google Scholar]
- 16.Dixon SJ et al. Human Haploid Cell Genetics Reveals Roles for Lipid Metabolism Genes in Nonapoptotic Cell Death. ACS Chem. Biol 10, 1604–1609 (2015). [DOI] [PMC free article] [PubMed] [Google Scholar]
- 17.Honsho M & Fujiki Y Plasmalogen homeostasis - regulation of plasmalogen biosynthesis and its physiological consequence in mammals. FEBS Lett 591, 2720–2729 (2017). [DOI] [PubMed] [Google Scholar]
- 18.Braverman NE & Moser AB Functions of plasmalogen lipids in health and disease. Biochim. Biophys. Acta 1822, 1442–1452 (2012). [DOI] [PubMed] [Google Scholar]
- 19.Messias MCF, Mecatti GC, Priolli DG & de Oliveira Carvalho P Plasmalogen lipids: functional mechanism and their involvement in gastrointestinal cancer. Lipids Health Dis 17, 41 (2018). [DOI] [PMC free article] [PubMed] [Google Scholar]
- 20.Yuki K, Shindou H, Hishikawa D & Shimizu T Characterization of mouse lysophosphatidic acid acyltransferase 3: an enzyme with dual functions in the testis. J. Lipid Res 50, 860–869 (2009). [DOI] [PMC free article] [PubMed] [Google Scholar]
- 21.Rashba-Step J et al. Phospholipid Peroxidation Induces Cytosolic Phospholipase A2Activity: Membrane Effects versus Enzyme Phosphorylation. Arch. Biochem. Biophys 343, 44–54 (1997). [DOI] [PubMed] [Google Scholar]
- 22.Doll S et al. FSP1 is a glutathione-independent ferroptosis suppressor. Nature (2019) doi: 10.1038/s41586-019-1707-0. [DOI] [PubMed] [Google Scholar]
- 23.Bersuker K et al. The CoQ oxidoreductase FSP1 acts parallel to GPX4 to inhibit ferroptosis. Nature (2019) doi: 10.1038/s41586-019-1705-2. [DOI] [PMC free article] [PubMed] [Google Scholar]
- 24.Gallego-García A et al. A bacterial light response reveals an orphan desaturase for human plasmalogen synthesis. Science 366, 128–132 (2019). [DOI] [PubMed] [Google Scholar]
- 25.Tsherniak A et al. Defining a Cancer Dependency Map. Cell 170, 564–576.e16 (2017). [DOI] [PMC free article] [PubMed] [Google Scholar]
- 26.Alim I et al. Selenium Drives a Transcriptional Adaptive Program to Block Ferroptosis and Treat Stroke. Cell 177, 1262–1279.e25 (2019). [DOI] [PubMed] [Google Scholar]
- 27.Fang X et al. Ferroptosis as a target for protection against cardiomyopathy. Proc. Natl. Acad. Sci. U. S. A 116, 2672–2680 (2019). [DOI] [PMC free article] [PubMed] [Google Scholar]
- 28.Encinas M et al. Sequential treatment of SH-SY5Y cells with retinoic acid and brain-derived neurotrophic factor gives rise to fully differentiated, neurotrophic factor-dependent, human neuron-like cells. J. Neurochem 75, 991–1003 (2000). [DOI] [PubMed] [Google Scholar]
- 29.Engelmann B Plasmalogens: targets for oxidants and major lipophilic antioxidants. Biochem. Soc. Trans 32, 147–150 (2004). [DOI] [PubMed] [Google Scholar]
- 30.Ginsberg L, Rafique S, Xuereb JH, Rapoport SI & Gershfeld NL Disease and anatomic specificity of ethanolamine plasmalogen deficiency in Alzheimer’s disease brain. Brain Res 698, 223–226 (1995). [DOI] [PubMed] [Google Scholar]
Additional References
- 31.Schilder RJ et al. Metallothionein gene expression and resistance to cisplatin in human ovarian cancer. Int. J. Cancer 45, 416–422 (1990). [DOI] [PubMed] [Google Scholar]
- 32.Cholody WM et al. Derivatives of fluorene, anthracene, xanthene, dibenzosuberone and acridine and uses thereof. US Patent (2012). [Google Scholar]
- 33.Shimada K et al. Global survey of cell death mechanisms reveals metabolic regulation of ferroptosis. Nat. Chem. Biol 12, 497–503 (2016). [DOI] [PMC free article] [PubMed] [Google Scholar]
- 34.Paynter NP et al. Metabolic Predictors of Incident Coronary Heart Disease in Women. Circulation 137, 841–853 (2018). [DOI] [PMC free article] [PubMed] [Google Scholar]
- 35.Wang T et al. Identification and characterization of essential genes in the human genome. Science 350, 1096–1101 (2015). [DOI] [PMC free article] [PubMed] [Google Scholar]
- 36.Wang T, Lander ES & Sabatini DM Single Guide RNA Library Design and Construction. Cold Spring Harb. Protoc 2016, db.prot090803 (2016). [DOI] [PMC free article] [PubMed] [Google Scholar]
- 37.Wang T, Lander ES & Sabatini DM Viral Packaging and Cell Culture for CRISPR-Based Screens. Cold Spring Harb. Protoc 2016, db.prot090811 (2016). [DOI] [PMC free article] [PubMed] [Google Scholar]
- 38.Drummen GPC, van Liebergen LCM, den Kamp JAFO & Post JA C11-BODIPY581/591, an oxidation-sensitive fluorescent lipid peroxidation probe: (micro)spectroscopic characterization and validation of methodology. Free Radical Biology and Medicine vol. 33 473–490 (2002). [DOI] [PubMed] [Google Scholar]
- 39.McQuin C et al. CellProfiler 3.0: Next-generation image processing for biology. PLoS Biol 16, e2005970 (2018). [DOI] [PMC free article] [PubMed] [Google Scholar]
- 40.Kedare SB & Singh RP Genesis and development of DPPH method of antioxidant assay. J. Food Sci. Technol 48, 412–422 (2011). [DOI] [PMC free article] [PubMed] [Google Scholar]
Associated Data
This section collects any data citations, data availability statements, or supplementary materials included in this article.
Supplementary Materials
Data Availability Statement
Lists of genes scored significantly in the OVCAR-8 CRISPR screening experiment are provided in Supplementary Dataset 1, raw sequencing data of the CRISPR screening is deposited in Gene Expression Omnibus via accession number GSE151062. Input gene list and output gene sets of GeLiNEA and GSEA analysis are included in Supplementary Dataset 2. Code for the GeLiNEA is available on GitHub [https://github.com/broadinstitute/GeLiNEA]. Lipidomics and metabolomics data are available as Supplementary Datasets 3-7 and 9-10. Raw Exome-sequencing and RNA-sequencing data are available in Gene Expression Omnibus under accession number GSE148297, and processed data, including top variants and differentially expressed genes in the tumor-derived ferroptosis-resistant cells, are listed in Supplementary Dataset 8. Three Supplementary Videos are included. All original data for each figure are provided as source data in Supplementary Information.


