Figure 1. Lateral entorhinal cortex (LEC) and medial entorhinal cortex (MEC) layer Vb (LVb) neurons show distinct morphological features.
(A–C) Expression of tetracycline-controlled transactivator (tTA) in the enhancer-driven gene expression (EDGE) mouse line (MEC-13-53D), which is visualized with mCherry (green) by crossing to a tTA-dependent mCherry line. A horizontal section was immunostained with an anti-Purkinje cell protein 4 (PCP4) antibody (magenta) to label entorhinal LVb neurons. Images of LEC (B) and MEC (C) correspond with the boxed areas in (A) and show from left to right PCP4 expression, mCherry expression, and a merged image. (D) Percentage of tTA-expressing neurons among layers in LEC and MEC. (E) Percentage of tTA-expressing neurons among the total PCP4-positive neurons in LEC and MEC. (F) Percentage of PCP4-positive neurons among the total tTA-expressing neurons in LEC and MEC. Error bars: mean ± standard errors. The tTA-expressing neurons mainly distributed in LVb of EC and colocalized with PCP4. (G–I) Morphology of LVb neurons targeted in MEC-13-53D in MEC (G, H) and LEC (I). tTA-expressing LVb neurons were first labeled with green fluorescent protein (GFP) (green) by injecting AAV2/1-TRE-Tight-EGFP in MEC-13-53D, and then intracellularly filled with biocytin (magenta, G) Images of MEC (H) and LEC (I) show biocytin labeling, which correspond with the boxed area in each inset. The four neurons shown in (G) correspond to the neurons in (H). Double arrowheads show the cell bodies, the single arrowheads show their dendrites, and different neurons are marked in different colors (green, blue, red, and yellow). The distribution of apical dendrites largely differs between MEC-LVb and LEC-LVb neurons. (J) Proportion of morphologically identified cell types of LVb neurons in LEC and MEC. These data were obtained in 10 animals and 22 slices. Scale bars represent 500 μm for (A) and inset of (H) and (I), 100 μm for (H) and (I), 50 μm for (B) and (C), and 20 μm for (G). Figure 1—source data 1. See also Figure 1—figure supplement 1, Figure 1—figure supplement 2, Figure 1—figure supplement 3, and Figure 1—figure supplement 4.
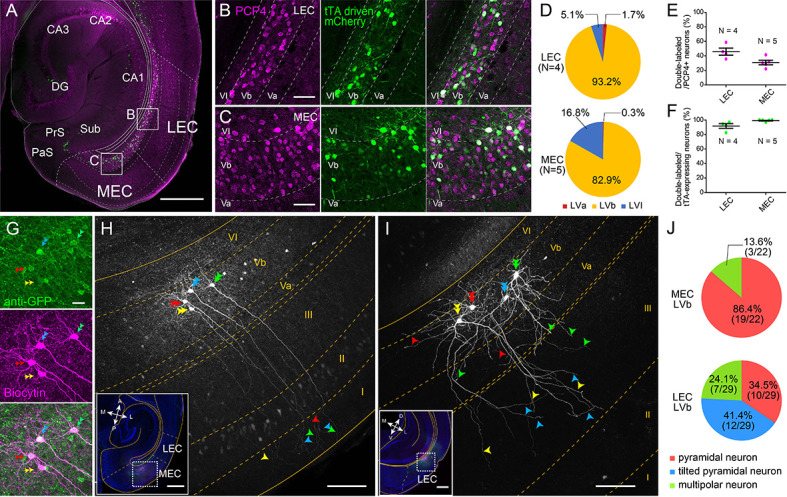
Figure 1—figure supplement 1. Laminar organization of lateral entorhinal cortex (LEC) and medial entorhinal cortex (MEC).
