

Summary
The pleiotropic functions of macrophages in immune defense, tissue repair, and maintenance of tissue homeostasis are supported by the heterogeneity in macrophage sub-populations that differ both in ontogeny and polarization. Although glycans and glycan-binding proteins (GBPs) are integral to macrophage function and may contribute to macrophage diversity, little is known about the factors governing their expression. Here, we provide a resource for characterizing the N-/O-glycomes of various murine peritoneal macrophage sub-populations, demonstrating that glycosylation primarily reflects developmental origin and, to a lesser degree, cellular polarization. Furthermore, comparative analysis of GBP-coding genes in resident and elicited macrophages indicated that GBP expression is consistent with specialized macrophage functions and correlates with specific types of displayed glycans. An integrated, semi-quantitative approach was used to confirm distinct expression patterns of glycans and their binding proteins across different macrophages. The data suggest that regulation of glycan-protein complexes may be central to macrophage residence and recruitment.
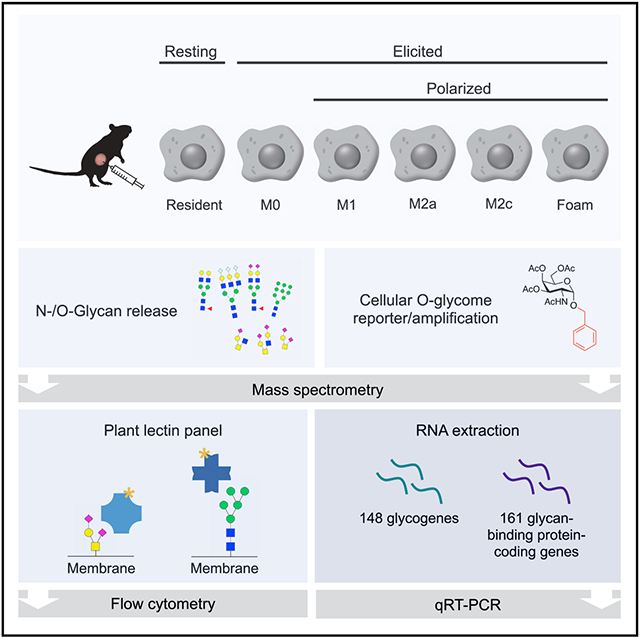
Graphical Abstract
In Brief
Park et al. combines native glycan staining, metabolic tagging, structural glycomics, and transcript analysis to generate a map of glycan and glycan-binding protein expression in primary murine peritoneal macrophage sub-populations. The study serves as a resource to identify distinct molecular differences in macrophages according to cellular ontogeny and polarization.
Introduction
Macrophages are specialized leukocytes that help control the recognition and removal of microbes and foreign material, tissue repair, and clearance of apoptotic cells. The majority of tissue-resident macrophages originate from mesodermal erythro-myeloid progenitors in the yolk sac and are seeded in the embryo, where they populate tissues and assume distinct phenotypes during organogenesis (Perdiguero and Geissmann, 2016). In the peritoneal cavity, two types of macrophages have been described during steady state, large peritoneal macrophages (LPMs), which arise from embryonic precursors, and small peritoneal macrophages, which are derived from bone marrow hematopoietic cells (Ghosn et al., 2010). LPMs represent approximately 90% of resident macrophages and are maintained by self-renewal, independently from terminally differentiated monocytes (Hashimoto et al., 2013). After induction with inflammatory stimuli, LPMs migrate to the omentum and circulating monocyte precursors infiltrate the peritoneal cavity (Cassado et al., 2015). While the mechanisms influencing macrophage population dynamics in various tissues remain unclear, it is generally recognized that tissue-resident and elicited macrophages diverge in development and exhibit functional differences in terms of cytokine secretion, bacterial uptake, and wound-healing responses.
In addition to differences in tissue origin and developmental lineage, macrophages also display significant heterogeneity in polarization states. The local milieu, including fragments from apoptotic cells, microbial products, and immune signals, can dramatically alter their physiology and functional activity. Macrophages are remarkably versatile and different subsets of macrophages with opposing functions and phenotypes can co-reside in the same tissue. While limitations exist in any classification scheme, a framework has been proposed in which macrophages are categorized into two main subtypes along a continuum: classically activated, pro-inflammatory M1 (lipopolysaccharide and interferon-γ activation) and alternatively activated M2. The M2 subset has been further expanded to include M2a (interleukin-4 [IL-4] or IL-13 activation), M2b (immune complex and Toll-like receptor activation), and M2c (IL-10 or adenosine activation) populations involved in tissue repair and resolution (Valledor et al., 2010). Given such multifaceted roles, macrophages have emerged as therapeutic targets in a number of disease settings, including cancer, autoimmune disease, liver disease, cardiovascular disease, metabolic disease, and inflammatory disease (Biessen and Wouters, 2017; Davignon et al., 2013; Noy and Pollard, 2014; Peterson et al., 2018; Tacke, 2017; Wang et al., 2007). Nonetheless, unresolved questions remain as to whether switches in macrophage function are associated with discrete alterations in the molecular landscape and whether these alterations can be exploited as disease-related biomarkers or in the assessment of disease resolution.
Traditionally, protein expression has been considered the key phenotype of a cell. Indeed, a number of characteristic proteins have been surveyed and their expression associated with macrophage subsets (Gratchev et al., 2001; Patel et al., 2009; Ricote et al., 1998). However, the stability, activity, and function of many proteins are contingent on their post-translational modifications (PTMs). Glycosylation, or the covalent attachment of oligosaccharide chains to amino acids of nascent proteins, is one of the most prevalent types of PTM. Differential regulation of glycosylation has been shown to affect processes such as cell differentiation, adhesion, migration, and host protection against bacteria (Isaji et al., 2004; Julien et al., 2007; Park et al., 2016; Struwe et al., 2015). Various mechanisms underlying immunity are regulated by cell-specific and protein-specific glycosylation, including those involving macrophages (Bax et al., 2009; Moody et al., 2001; Morgan et al., 2004; Da Silva et al., 2017; Togayachi et al., 2007; Toscano et al., 2007). These studies show that glycans mediate crucial molecular interactions by controlling receptor avidity and stabilization of immune complexes. In this regard, the unique repertoire of glycans on macrophage sub-populations may facilitate immune functions and assist in recruiting cells to specific anatomic locations.
Although protein glycosylation plays a key role in macrophage cell biology, development, and immunology, there is limited information regarding expression of glycans and glycan-binding proteins (GBPs) in macrophages according to subtype, thus limiting exploration of their functions. Previous studies surveying glycan expression during the differentiation of the human monocyte THP-1 cell line suggest that macrophage-specific glycan changes may occur in vivo (Delannoy et al., 2017; Wang et al., 2016). Murine macrophages express a variety of membrane glycoproteins that are thought to exhibit unique glycosylation patterns and that are restricted to certain macrophage populations (Austyn and Gordon, 1981; Prasad et al., 2002; Rabinowitz and Gordon, 1991). Here, we elucidated key features of glycosylation that are associated with macrophage lineage and polarization in mice. We validated the observed glycan changes by lectin staining and metabolic labeling via cellular O-glycome reporter amplification (CORA) and provide a transcriptomic basis for the altered glycan profiles. In addition, we explored the expression of genes encoding GBPs, as they are presumed to be key participants in the innate immune system, involved in the recognition and removal of pathogens and diseased cells. This study serves as a resource to catalog active glycan pathways in distinct macrophage populations and explore the relationship between the expression of glycogenes and genes encoding GBPs. Subtype-specific glycans may provide targets to modulate macrophage activities, including inflammatory, fibrotic, and reparative responses.
Results
Structural elucidation of glycans using mass spectrometry
N- and O-glycans in glycoproteins from distinct murine macrophage populations, including: resident, elicited (M0), elicited/classically activated (M1), elicited/alternatively activated (M2a, M2c), or elicited/lipid-laden foam cells (Figure S1) were released, permethylated, and analyzed by high-resolution mass spectrometry. Search criteria were established to filter by signal-to-noise ratio and mass tolerance before structural assignment against a reference library (Figure 1A; Table S1). Matches were validated by tandem mass spectrometry, which provided additional evidence of the saccharide compositions and connectivity (Figure S2). In total, a similar number of compositions were found in all sub-populations (Figure 1B). Resident macrophages presented slightly simpler O-glycan compositions than elicited populations.
Figure 1. Global N- and O-glycan analysis.

(A) Representative mass spectra of N- and O-glycans released from resident and elicited/M0 macrophages. Abundant signals are annotated with the corresponding putative glycan structure following symbol nomenclature. See also Figure S2 and Table S1.
(B) The total number of glycan compositions identified in each distinct macrophage population. Data are represented as mean ± SD (n = 3).
(C) Partial least-squares discriminant analysis (PLS-DA) score plots for N- and O-glycan profiles of resident, elicited/M0, and elicited/polarized macrophages. The 95% confidence interval is indicated as an ellipse (n = 3).
(D) Correlation matrices of identified N- and O-glycans. Tables are colored according to the numerical values of the Pearson correlation coefficient r between pairs. See also Figure S3.
Based on the global N- and O-glycan profiles, partial least-squares discriminant analysis indicated that elicited macrophages are closely related to one another while resident macrophages are distinct (Figure 1C). Pairwise Pearson correlation analysis of glycan abundances further supported that resident macrophage glycans were moderately distinguished from those of elicited macrophages (N-glycans, r = 0.722; O-glycans, r = 0.692) (Figures 1D and S3). Conversely, in elicited populations, M0 glycosylation strongly resembled M1 (N-glycans, r = 0.976; O-glycans, r = 0.932), M2a (N-glycans, r = 0.967; O-glycans, r = 0.800), M2c (N-glycans, r = 0.990; O-glycans, r = 0.960), and foam cell (N-glycans, r = 0.978; O-glycans, r = 0.967) glycosylation. To ensure that similarities in glycan profiles were not a result of inadequate technical processing, we compared the N- and O-glycan profiles of M0 macrophages with those of epithelial cells derived from different tissues and found marked differences (HEK293 N-glycans, r = 0.690; O-glycans, r = 0.659; A549 N-glycans, r = 0.772; O-glycans, r = 0.048) (Figure S3).
Comparative N- and O-glycan profiling of murine macrophage sub-populations
Among all macrophage sub-populations, N-glycan structures were predominantly classified as either high mannose (oligomannose)- or complex-type, with paucimannose- and hybrid-type structures identified as minor components of the total glycome (Figure 2A). Complex-type N-glycans exhibited heterogeneity with differentially polarized macrophages expressing a higher proportion of highly branched N-glycans and a lower proportion of biantennary structures than resident macrophages (Figure 2B). Specifically, tetraantennary structures were more abundant in M0 (5%), M2a (7%), and M2c (6%) macrophages, as well as in foam cells (5%), than in resident macrophages (2%). Decoration of complex-type N-glycans with fucose and/or sialic acid was common across all macrophage populations, comprising nearly 60% of the total N-glycans observed (Figure 2C). N-Glycans bearing both fucose and sialic acid were more abundantly expressed (35%–42%) than purely fucosylated (3%–5%) or afucosylated structures bearing sialic acid (17%–20%) (Figure 2D). Among fucosylated N-glycans, mono-fucosylated structures were more common than multi-fucosylated glycans (ratio ~119:1) (Figure 2E). In non-humans, sialic acid can occur as either N-acetylneuraminic acid (NeuAc) or N-glycolylneuraminic acid (NeuGc). N-Glycans bearing NeuAc in the absence of NeuGc were among the most abundant species expressed in elicited macrophages, exhibiting a nearly 2-fold increase in abundance as compared with resident macrophages (Figure 2F). Conversely, NeuGc-containing N-glycans, excluding those with both NeuGc and NeuAc, decreased by 2-fold.
Figure 2. Comparison of N- and O-glycan-specific features among murine macrophage populations using mass spectrometry and lectin staining.

Grouped abundances of N-glycans according to (A) class, (B) degree of branching, (C and D) decoration, (E) extent of fucosylation, and (F) sialic acid form. Data are represented as mean ± SD (n = 3). Grouped abundances of O-glycans according to (G) mucin-type core, (H and I) decoration, and (J) sialic acid form. Data are represented as mean ± SD (n = 3). p values were determined using a one-way ANOVA with post-hoc Holm-Sidak comparisons of all pairs relative to resident macrophages. *p < 0.05, **p < 0.01; Fuc, fucosylated; Sia, sialylated; ND, not detected. See also Table S1.
(K) Lectin staining of resident and elicited/M0 macrophages. Data are represented as mean ± SD (n = 2). p values were determined using a Student’s t test. *p < 0.05, **p < 0.01; MFI, mean fluorescence intensity; Neu, neuraminidase; ND, not detected. See also the STAR methods and Figure S4.
Mucin-type O-glycans can be classified by their core structures, with resident macrophages predominantly expressing core 1 (96%) along with lower levels of core 2 O-glycans (4%) (Figure 2G). Elicited macrophages expressed a higher abundance of core 2-based structures compared with resident macrophages. Among all macrophage sub-populations, the majority (>95%) of O-glycans were extended (Figure 2H), attributed entirely to sialylation (Figure 2I). The majority of sialylated O-glycans were comprised of NeuAc as opposed to NeuGc, with a modest increase in NeuAc-bearing O-glycans lacking NeuGc and a pronounced decrease in NeuGc-bearing O-glycans lacking NeuAc observed in elicited macrophages when compared with resident macrophages (Figure 2J).
As a complementary method, we analyzed surface glycan expression in cells using plant lectins that recognize specific glycan determinants. Given the consistency in all elicited subtypes, lectin-binding studies were performed on resident and elicited/M0 macrophages. Flow cytometry revealed a 2-fold decrease in the binding of AAL and MAL-II lectins to elicited macrophages as compared with resident macrophages due to reduced cell surface expression of α1,6-fucosylation and α2,3-sialylation, respectively. In addition, a modest increase in binding of MAL-I, SNA, and ConA to elicited macrophages was observed, suggesting the presence of higher levels of α2,3-sialylated type 2 N-acetyllactosamine (LacNAc) composed of galactose (Gal)-β1,4-N-acetylglucosamine (GlcNAc), α2,6-linked sialic acid, and α-linked mannose, respectively (Figures 2K and S4A-S4C). LEL binding was 3-fold higher to elicited macrophages than to resident macrophages, indicating higher expression of poly-LacNAc (−3Gal-β1,4-GlcNAc-β1-)n. UEA-1 did not bind to resident or elicited macrophages, indicating that these cells exhibit little to no expression of α1,2-fucosylation (Figure S4D).
In addition to grouped feature analysis, we assessed the significance of glycan compositional changes with a minimum mean relative abundance cutoff of 0.5%. Of 118 N-glycan and 15 O-glycan compositions, 8 N-glycans and 5 O-glycans were differentially expressed between resident and elicited macrophages. One of the most abundant O-glycans observed in elicited macrophages, Hex2HexNAc2NeuAc2 (m/z 1,705.83), was a key distinguishing feature between resident and elicited macrophages (Figure 3A). Otherwise, consistent with the grouped O-glycan analysis, a core 1-based structure (Hex1HexNAc1- NeuGc1; m/z 925.43) decreased by 4-fold in elicited macrophages with a relative shift to sialylated core 2-based structures (m/z 1,140.55, 1,374.66, and 1,578.76), which were present in low abundance or not expressed in resident macrophages. In elicited macrophages, the expression of a high mannose-type N-glycan, GlcNAc2Man6 (m/z 1,783.89), increased by nearly 2-fold in abundance, while among complex-type N-glycans, two mono-NeuGc-containing biantennary structures (m/z 2,461.22 and 2,635.31) decreased and five NeuAc-containing structures (m/z 2,156.07, 2,966.47, 3,776.87, 3,806.88, and 4,226.10) increased (Figure 3B).
Figure 3. Population-associated alterations of N- and O-glycan compositions.

Statistically significant differences between (A) resident and elicited/M0 macrophage O-glycans, (B) resident and M0 macrophage N-glycans, (C) elicited/polarized macrophage O-glycans, and (D) M1, M2a, and M2c macrophage N-glycans. Data are represented as mean ± SD (n = 3) and are ordered by increasing mass (left to right). p values were determined using a one-way ANOVA with post-hoc Holm-Sidak comparisons of all pairs. *p < 0.05, **p < 0.01, ***p < 0.001; ND, not detected. Glycan representations follow symbol nomenclature.
(E) Putative structures of O-glycans identified in macrophage sub-populations using CORA or β-elimination. See also Figure S5 and Table S1.
Differential protein expression and cytokine production have previously been shown in human and murine M1 and M2 macrophage populations (Oishi et al., 2016; Zarif et al., 2017). Among O-glycans, Hex1HexNAc2NeuGc1 (m/z 1,170.56) was displayed in higher abundance in M1 when compared with M2a macrophages (Figure 3C). The abundance of Hex2HexNAc2NeuAc2 (m/z 1,705.83) was significantly higher in M2a and M2c than in M1 macrophages. Among N-glycans, we observed significant differences between M1 and M2a expression of high mannose-type glycans GlcNAc2Man7 (m/z 1,987.98) and GlcNAc2Man8 (m/z 2,192.08) as well as a triantennary glycan, Hex6HexNAc5Fuc1NeuAc3 (m/z 3,776.87) (Figure 3D). In addition, the abundance of the latter glycan was differentially expressed in M2c macrophages.
To examine whether the released O-glycan pool from peritoneal macrophage sub-populations were direct products of the O-glycan biosynthetic pathway, we applied CORA, which excludes possible contributions from intracellular sources that are apparent in cell lysate analysis or products of peeling from reductive β-elimination, allowing exclusive consideration of newly synthesized O-glycans built upon a labeled O-glycan precursor that were secreted into the surrounding medium (Kudelka et al., 2015). Core 1-based structures were secreted by all macrophage sub-populations, while core 2-based structures were only produced by elicited macrophages and absent from resident macrophages (Figures 3E and S5; Table S1). These results demonstrate that the relatively simpler O-glycome in resident macrophages is extracellularly localized and is a reflection of biosynthetic differences between cell subtypes.
Transcriptional basis for altered glycosylation
Glycan assembly requires the coordinated action of glycosyltransferases and glycosidases, which reside within the endoplasmic reticulum and Golgi apparatus. Of the 148 murine glycogenes analyzed, 119 were expressed in resident and elicited/M0 macrophages and significant alterations were observed in 45 genes (Table S2), of which 40 were associated with glycoprotein and glycolipid pathways and 5 associated with the synthesis of lipid-linked oligosaccharides and glycosylphosphatidylinositol-anchored proteins (Figure 4A). Alg2, which encodes an α1,3-mannosyltransferase that facilitates formation of GlcNAc2Man3-dolichol phosphate in the early steps of N-glycan biosynthesis, was significantly upregulated in elicited macrophages (Figure S6). Among genes encoding subunits composing the dolichol phosphate mutase synthase complex, a 3-fold increase in expression of Dpm2 and a 1.5-fold decrease in Dpm3 were observed in elicited macrophages. The expression of Uggt1, responsible for re-glucosylation of Man9GlcNAc2 involved in quality control of protein folding, was elevated 6-fold in elicited macrophages (Figure 4B). Man1a, which is involved in the removal of α-linked mannose in high mannose-type glycans that precedes assembly of hybrid- and complex-type structures, was highly expressed in resident macrophages but decreased in elicited macrophages. In addition, multiple genes responsible for the synthesis of complex/hybrid-type N-glycans were significantly altered in elicited macrophages. Mgat5, responsible for β1,6-branching through the addition of GlcNAc residues, increased by 3.7-fold in expression, whereas Mgat4a, responsible for β1,4-N-glycan branching, decreased by 3.3-fold. GlcNAc branches can be further elongated by galactosyltransferases and expression of the β1,4-galactosyltransferase-coding genes B4galt3, B4galt4, and B4galt5 increased by 3.7-, 14-, and 2.8-fold, respectively, while expression of the β1,3-galactosyltransferase-coding gene B3galt4 decreased by nearly 2-fold. Expression of Mgat3, which is responsible for the placement of terminal bisecting GlcNAc residues, was 4-fold higher in elicited macrophages. Apart from alterations in N-glycan biosynthesis, genes participating in mannose phosphorylation (Gnptab, Gnptg), which target acid hydrolase precursor proteins for transport to the lysosome, were upregulated in elicited macrophages.
Figure 4. Quantitative RT-PCR analysis of glycogenes.

(A) Number of genes that showed statistically significant changes between resident and elicited/M0 macrophages. Venn diagrams organize genes based on the substrates of the proteins they encode. Biosynthetic pathway of (B) N-glycans and (C)O-glycans (top) and the associated changes in the expression of genes involved in each indicated step (bottom), which are numbered in sequence. Data were normalized to the expression of β-actin and are represented as mean ± SD (n = 4). *p < 0.05 (Mann-Whitney U test); -P, phosphorylated; ND, not detected. Glycan representations follow symbol nomenclature. See also Figure S6 and Table S2.
While glycan-processing enzymes often recognize both N- and O-glycans, certain glycans are unique acceptors in O-glycan biosynthesis, particularly during initiation. Expression levels of essential genes (Galnt1, Galnt6, and Galnt7) involved in the transfer of the initial N-acetylgalactosamine (GalNAc) residue to serine or threonine residues of a glycoprotein (GalNAc-α1-Ser/Thr) were significantly higher in elicited than in resident macrophages (Figure 4C). Among subsequent biosynthetic steps, the assembly of core 2 O-glycans showed notable differences between resident and elicited macrophages. In particular, Gcnt2 was detected exclusively in elicited macrophages, and a closely related gene critical for core 2 formation, Gcnt1, increased by more than 7-fold.
Genes that are common to N-/O-glycan modification and glycolipid biosynthetic pathways include those encoding glycosyltransferases that produce extended structures. Fut10, which mediates the attachment of fucose to GlcNAc via an α1,3 linkage, showed a significant increase in elicited as compared with resident macrophages (Figure S6). Sialic acid capping of terminal galactose residues on N- and O-glycans can occur via an α2,3 or α2,6 linkage, but changes in β-galactoside-α2,6-sialyltransferase expression between resident and elicited macrophages were not significant (Figures 4C and S6). In contrast, the β-galactoside-α2,3-sialyltransferase, St3gal1, which is specific for a Gal-GalNAc moiety, and St3gal6, which is specific for a Gal-GlcNAc moiety, were 3.1- and 19-fold higher in expression, respectively, while St3gal5, which is integrated into the synthesis of the ganglioside GM3, was 4.5-fold lower in elicited macrophages (Figure S6). GalNAc residues within N-glycans, O-glycans, and glycolipids can be modified with sialic acid via an α2,6 linkage and among genes that exhibit N-acetylgalactosaminide-α2,6-sialyltransferase activity, reduced expression of St6galnac3 (4-fold) and enhanced expression of St6galnac4 (5-fold) were observed in elicited macrophages (Figures 4C and S6). Further elongation of glycans by polysialylation was evident based on the expression of St8sia1, St8sia4, and St8sia6 in both resident and elicited macrophages. Of these, St8sia6 decreased by 12-fold in elicited macrophages. Collectively, changes among macrophage populations in transcript expression of components of the glycosylation pathways were consistent with glycan structures observed by mass spectrometry and lectin staining (Table 1).
Table 1.
Correlations between glycan feature-related changes as determined by qRT-PCR, lectin staining, and mass spectrometry analysis
| Mass spectrometry (relative quantification) | ||||
|---|---|---|---|---|
| Feature | qRT-PCRa | Lectin panel | N-Glycans | O-Glycans |
| Core 1 | NSb | ⊥ PNA* c (asialylated) |
N/A | T Core 1* (sia/asialylated) |
| Core 2 | ⊥ Gcnt1* |
⊥ PNA* (asialylated) |
N/A | ⊥ Core 2* (sia/asialylated) |
| High mannose | ⊤ Man1a* |
⊢ ConA* |
NS | N/A |
| Branching | ⊥ Mgat5* |
NS | ⊥ tetraantennary* |
N/A |
| ⊤ Mgat4a* |
||||
| ⊤ biantennary* |
N/A | |||
| Poly-LacNAc | ⊥ B3gnt2* |
⊥ LEL* |
NS | ND |
| Bisecting GlcNAc | ⊥ Mgat3* |
NS | NS | N/A |
| Sialylation (form) | ⊥ NeuAc only* |
⊢ NeuAc only* |
||
| ⊤ NeuGc only* |
||||
| (linkage) | ⊤ St6galnac3* (α2,6) |
⊢ SNA* (α2,6) |
||
| ⊥ St6galnac4* (α2,6) |
||||
| ⊤ St3gal5* (α2,3) |
⊤ MAL-II* (α2,3) |
|||
| ⊥ St3gal1*(α2,3); St3gal6* (α2,3) |
||||
| ⊤ St8sia6* (α2,8) |
||||
| Fucosylation (linkage) | ⊤ AAL* (α1,6) |
|||
| ⊥ Fut10* (α1,3) |
||||
| Galactosylation | ⊥ B4galt3*; B4galt4*; B4galt5* |
⊢ MAL-I* |
||
⊥ Increasing (resident to elicited); ⊢, no change; ⊤, decreasing; threshold = 30% change.
N/A, not applicable; ND, not detected; NS, not significant.
p < 0.05.
Expression of GBPs are determinants of specialized macrophage functions
In addition to glycan structures, which often serve as natural receptor ligands, we surveyed the expression of 161 known genes encoding murine GBPs with only those genes showing measurable detection levels in at least 2 of 4 replicates considered for comparative analysis. In total, 139 genes were expressed in both or either groups (Table S3; Figure S7). Enrichment analysis showed that the expressed GBPs are predominantly involved in protein processing, phagocytosis, infection, cell adhesion, and cytotoxicity (Figure 5A). A total of 49 GBPs were differentially expressed, with 38 (78%) relevant to N- and O-glycosylated substrates, 5 (10%) involved in binding to other glycans, and 6 (12%) specific to glycolipid recognition (Figure 5B).
Figure 5. Quantitative RT-PCR analysis of GBP-coding genes.

(A) Bipartite view of enriched gene sets from the KEGG database. Nodes are colored according to p value, sized according to number of genes, and arranged with the Fruchterman-Reingold layout. Nodes with overlapping genes are connected by edges.
(B) Number of statistically significant genes between resident and elicited/M0 macrophages as a fraction of the total number of genes in each group.
(C–F) Log2 transformed mean relative transcript abundances of N-/O-glycan-binding protein-coding genes (n = 4). Box and whisker plots represent fold change of gene expression (resident to elicited). *p < 0.05 (Mann-Whitney U test); X, not detected. See also Figure S7 and Table S3.
Genes of the galectin (S-type) family that bind to β-galactosides, sialic acid-binding immunoglobulin-like lectins (Siglecs, I type), members of the mannose/glucose-specific calreticulin-like and M-type families, and lectin-associated proteins were differentially regulated between resident and elicited macrophages. Notably, Lgals1, Lgals2, and Lgals3 were upregulated, and Lgals4, Lgals6, and Lgals7 downregulated in elicited macrophages (Figure 5C). SiglecG and SiglecE were expressed at lower levels, and SiglecF and Siglec15 at higher levels in elicited macrophages (Figure 5D). Calr was abundantly expressed in resident macrophages and increased by nearly 5-fold in elicited macrophages (Figure 5E). Masp1 increased by more than 7-fold in elicited macrophages.
C-Type lectins, which share conserved calcium-dependent carbohydrate-binding domains and participate in recognition and initiation of immunity to pathogens, were transcriptionally downregulated in elicited macrophages. Decreased expression in Clec1b (Clec-2), Cleg2g, Clec7a (Dectin-1), Klra2, Klri1, and Olr1 of more than 3-fold was observed in elicited macrophages with a reduction in Olr1 of more than 30-fold (Figure 5F). Type 2 receptor expression was observed generally at reduced levels in elicited macrophages, with particularly pronounced reductions in Cd209b (Signr2) (>650-fold) and Clec4n (Dectin-2) (>140-fold) expression. Cd209e (Signr4) was only detected in resident macrophages. Otherwise, natural killer cell receptor-coding genes Klra3, Klra10, and Klra19 were expressed in resident macrophages with a significant increase in elicited macrophages. Expression of Pkd1l2, a member of the polycystin family, increased by 11-fold in elicited macrophages.
Significant differences in expression were also observed for non-Siglec I-type adhesion molecule lectins. For example, expression of Icam1, Icam2, and Pecam1 decreased by 6-, 8-, and 11-fold, respectively, in elicited macrophages, while expression of Ncam1 and Vcam1 increased by 3- and 5-fold, respectively. The expression of Itgam, which encodes another protein implicated in macrophage adhesion, was more than 7-fold lower in elicited macrophages than in resident macrophages.
Glycan-receptor gene expression correlations
A key enigma in cellular glycomics has been the relationship between self-glycans and the types of GBPs a cell expresses, which has seldom been analyzed. We correlated the expression profiles of genes that are related to the processing and recognition of glycans that are N-/O-linked or comprise the head group of glycosphingolipids (Figure 6A). Distance measures based on Pearson correlation were unable to segregate glycan processing from glycan recognition genes, indicating a degree of relatedness between the expression of the two groups of genes in resident and elicited macrophages. Notably, clusters with strong correlations included genes in the Siglec family. While some Siglecs with extended extracellular regions may interact with trans ligands on other cells (e.g., Siglec-1), many have relatively short lengths and can be masked by binding to cis ligands on the same cellular surface (Macauley et al., 2014). The expression of these murine Siglec genes was correlated with that of α2,3- and α2,6-sialyltransferase genes. We defined the 95% confidence limits using bootstrapping (10,000 iterations), which showed positive correlation between the expression of Cd22 and St3gal2, St3gal3, and St6gal1; SiglecG and St3gal2, St3gal3, and St3gal5; Siglec15 and St3gal5; Cd33 and St6galnac2, St6galnac4, and St6galnac6; myelin-associated glycoprotein (Mag) and St6galnac4 and St6galnac6; and SiglecF and St6galnac5 (Figures 6B-6G). In contrast, Siglec15 expression was negatively correlated with that of St3gal1, and SiglecE expression with that of St6galnac3 (Figures 6D and 6H). This analysis suggests that the correlation of Siglec and sialyltransferase gene expression in murine peritoneal macrophages is significant.
Figure 6. Correlation of genes encoding glycan processing and recognition proteins.

(A) Correlation matrix of glycan processing (green) and glycan recognition (purple) gene expression in resident and elicited/M0 macrophages. Colors within the matrix indicate positive (red) or negative (blue) correlation and the intensity represents the value of the correlation coefficient. Genes were clustered based on Pearson distance.
(B–H) Pearson correlations between murine Siglecs and α-2,3/α-2,6-sialyltransferase gene expression. Bootstrap analysis was performed with 10,000 samples.
Discussion
Although plasticity is a well-known characteristic of macrophages, the associated molecular changes remain poorly characterized. Based on the hypothesis that glycosylation is cell type specific and sensitive to environmental changes, we postulated that differences between glycan profiles distinguish macrophage sub-populations from one another. By integrating mass spectrometry- and lectin-based approaches to structural glycomics, we generated a map of cell-specific N- and O-glycosylation patterns to identify structural changes that accompany macrophage activation. According to the glycomes, polarized elicited macrophages mostly resembled unpolarized elicited macrophages, but the latter were only distantly related to resident macrophages. Comparative measurements revealed that the cellular glycome primarily reflects developmental origin and, to a lesser degree, the activation state of murine peritoneal macrophages. Conserved glycan signatures across elicited macrophages support the notion that recruited macrophages, as opposed to tissue-resident macrophages, are programmed to respond to acute inflammatory stimuli, which require the participation of GBPs. Macrophages express a large repertoire of GBPs that are also altered partly upon differentiation. These discoveries suggest that cellular display of N- and O-glycans, shaped by cellular ontogeny, may have functional significance in macrophages.
The glycome of elicited macrophages, which are derived from circulating monocytes, differed from that of embryonic progenitor-derived resident macrophages in a number of ways. Based on the pathogenesis of incomplete N-glycan branching, formation of branched N-glycans in vertebrates has been proposed to have contributed to the ability of immune cell surface GBPs to recognize non-self signals (Green et al., 2007). Intriguingly, macrophages and other nonerythroid cell types express a compensatory glycan-processing enzyme to continue production of complex-type N-glycans when early steps of biosynthesis are disrupted, which is otherwise capable of inducing autoimmunity (Akama et al., 2006; Chui et al., 1997). Tetraantennary branching provides increased opportunity for ligand binding and stabilization, which may be required to mount robust responses to growth factors, cytokines, and chemokines during the onset and resolution of inflammation. Mgat5 deficiency in activated macrophages has been shown to diminish surface receptor binding of transforming growth factor β, reduce cytokine-mediated signaling, and delay cell recruitment in murine models of inflammation (Partridge et al., 2004). In addition to N-glycan branching, lectin staining suggested that poly-LacNAc moieties are highly expressed on elicited macrophages in comparison with resident macrophages, and qPCR confirmed increased expression of B3gnt2 (linear, i-type) and Gcnt2 (branched, I-type), with the former supporting β1,6-GlcNAc branching as a preferred target for poly-LacNAc extension. Notably, the degree of β1,6-branching on poly-LacNAc acceptors has been identified as the rate-limiting factor for poly-LacNAc formation, suggesting that higher levels of poly-LacNAc in elicited macrophages may be attributed to increased Mgat5-driven β1,6-branching (Fukuta et al., 2000). Glycan extension by poly-LacNAc may support cellular recognition by GBPs as well as other immune regulatory functions, including suppression of hyperresponsive macrophages (Togayachi et al., 2007). Specific factors governing the formation of glycans in elicited macrophages need investigation, including Golgi transit, protein accessibility by glycosyltransferases, and substrate specificity. Finally, a prominent difference between resident and elicited macrophages was higher levels of core 2 O-glycans in elicited macrophages, as supported by β-elimination, CORA, and lectin staining. This increase was attributable to the upregulation of Gcnt1 and Gcnt2 in elicited macrophages. Among the diverse functions of O-glycans, core 2 O-glycans have been shown to provide a scaffold for selectin-binding ligands (Li et al., 1996). Loss of core 2 reduces leukocyte rolling activity on immobilized E–, P-, and L-selectin, as well as leukocyte recruitment in thioglycolate-induced peritonitis (Ellies et al., 1998).
Glycan expression patterns that are unique to resident macrophages may be related to their specialized roles within the peritoneal cavity. Core 1 synthase-specific molecular chaperone (Cosmc) deficiency was shown to compromise the ability of resident macrophages to efficiently clear apoptotic cells (Wakui et al., 2017). Unlike elicited macrophages, resident macrophages require the phosphatidylserine receptor Tim4 for efferocytosis and Tim4 function is likely dependent on core 1 O-glycosylation (Wong et al., 2010; Yanagihashi et al., 2017). Given that core 2-based O-glycans are crucial for binding to adhesion receptors, it is possible that, contrary to elicited macrophages, resident macrophages utilize a core 2-independent machinery for tissue recruitment or that they lose the core 2 phenotype over time (Okabe, 2018; Okabe and Medzhitov, 2014). Moreover, peritoneal macrophages are considered to serve as immune sentinels residing within peritoneal fluid in the immediate vicinity of visceral organs, which they can infiltrate after acute injury (Wang and Kubes, 2016). Although the mechanisms underlying resident macrophage reprograming remain unclear, we speculate that local injury results in the release of metabolic products, such as intracellular uridine diphosphate (UDP)-GlcNAc and glucose, which increase precursor availability and have been shown to induce N-glycan branching through cellular uptake. Induction of tetraantennary N-glycans on peritoneal resident cells would facilitate proliferation, activation, and tissue repair (Ryczko et al., 2016).
The machinery to express NeuGc and the Gal-α1,3-Gal epitope is strictly lacking in humans but plays a significant role in murine immunology. As sialylation and α-Gal capping occur on the same position of branched glycans, a nonstatic, competitive interchangeability is thought to exist (Comelli et al., 2006). The apparent decrease in NeuGc-containing structures in elicited compared with resident macrophages may coincide with an increase in α-Gal capping. Concurrently, elicited but not resident macrophages may downregulate cytidine monophosphate (CMP)-NeuAc hydroxylase (encoded by Cmah), which catalyzes the conversion of NeuAc to NeuGc. Disruptions in Cmah expression have been shown to induce B cell hyperresponsiveness (Naito et al., 2007). Reduced expression of NeuGc-containing glycans in macrophages has implications for modulation of murine CD22 (Siglec-2) and SiglecG (ortholog of Siglec-10) activity, which show strong preferences for binding to Gal-β1,4-GlcNAc sequences with terminal NeuGc (Duong et al., 2010). Alternatively in humans, higher levels of fucosylation, a non-dominant feature in murine macrophages, may exhibit similar functions (Antonopoulos et al., 2011).
In this report we used multiple approaches that together offered insight into macrophage functions and phenotypes but a number of limitations warrant comment. While we cannot exclude that structural analysis of whole-cell lysates includes intracellular sources, our findings from the lectin panels, which utilized cell impermeable labeling reagents, and CORA provide support that the observed changes in glycosylation mostly occur on the cell surface. Putative N-/O-glycan structural representations were based on knowledge of the respective biosynthetic pathways. Elucidation of glycosidic linkages, specifically those involving sialic acid, as well as global connectivity, are necessary to fully understand population-specific differences. Moreover, native N-/O-glycans are attached to specific proteins of interest. We anticipate that the initial identification of differentially expressed glycans will facilitate a focused search for the underlying proteins (Zarif et al., 2017). Furthermore, our analysis showed significant changes in pathways that affect the assembly of glycolipids, which are enriched on peritoneal macrophages (Mercurio et al., 1984). Elucidation of their spatial organization and structural heterogeneity on the cell membrane in response to inflammatory conditions is needed. Although transcript abundances are closely integrated into protein synthesis, additional regulatory processes may alter the expression of glycosylation and GBP genes at the protein level, including sugar metabolism, microRNA-mediated post-transcriptional gene silencing, and protein transport (Neelamegham and Mahal, 2016; Petäjä-Repo et al., 2000).
Many immune responses are the outcome of glycan binding by galectins, an evolutionarily conserved, widely expressed, and developmentally regulated GBP. Galectins exist as oligomers capable of forming lattices at the cell surface by crosslinking to glycosylated counter-receptors, which in some cell types is required for organization of discrete membrane microdomains, signal transduction, and stabilization of receptors (Rabinovich et al., 2007). Among galectin genes, Lgals3 exhibited the highest fold increase in elicited macrophages relative to resident macrophages, consistent with previous reports of high levels of galectin-3 (Mac-2 antigen) expression during human monocyte to macrophage differentiation in vitro (Liu et al., 1995). Galectin-3-deficient mice have been shown to yield smaller numbers of inflammatory macrophages that showed low cell spreading, weak nuclear factor κB responses, and higher sensitivity to phagocytosis compared with macrophages from wild-type mice (Hsu et al., 2000). The functional consequences of galectin-3 expression by elicited macrophages during the resolution of inflammation may in part be promoted by lattice-mediated regulation of endocytosis, facilitated by the expression of tetraantennary N-glycans. Galectin-3 plays a role in the phagocytic activity of peritoneal macrophages through intracellular pathways but their intracellular binding partners are not well defined (Sano et al., 2003). In addition to galectin-3, upregulation of galectin-1 was observed in elicited macrophages, which may exert regulatory control of effector functions and trigger death signals to dampen the immune response (Barrionuevo et al., 2007; Rabinovich et al., 1998). Galectin-1 participation in the early stages of the acute inflammatory response may be carbohydrate independent (Rabinovich et al., 2000). The multivalency of galectins enables macrophages to bind to microbial and other cell glycans, which can lead to both pro- and anti-microbial effects (Baum et al., 2014).
Siglecs are GBPs primarily expressed in hematopoietic cells that exhibit a wide range of specificities toward sialic acid forms and linkages. Although the summed abundances of sialylated glycans were comparable in resident and elicited macrophages, differential regulation of Siglecs was clearly observed. Unique regulatory mechanisms may exist for the expression of different Siglecs in murine macrophages (Tateyama et al., 2019). In particular, SiglecF has been shown to modulate its own expression with continuous stimulation, presumably through interactions associated with immunoreceptor tyrosine-based inhibitory motifs. Upregulation of SiglecE in resident macrophages is of particular importance for homeostatic responses as SiglecE has been linked to anti-inflammatory signaling via regulation of reactive oxidative species (McMillan et al., 2014). Siglec expression patterns in murine peritoneal macrophages were highly correlated with those of β-galactoside-α2,3-sialyltransferases and N-acetylgalactosaminide-α2,6-sialyltransferases. While the possibility of co-regulation of these genes requires further evaluation, the relationship between Siglecs and self-ligand availability is important for the formation of cis interactions, which contribute to the biological functions of Siglecs (Crocker et al., 2007). Nonetheless, it has been shown that cis interactions do not preclude formation of trans interactions that serve to promote the uptake of pathogens, many of which have the capacity to incorporate and present sialic acids as molecular mimics of hosts (Vimr and Lichtensteiger, 2002).
STAR★methods
Resource availability
Lead contact
Further information and requests for resources and reagents should be directed to and will be fulfilled by the Lead Contact, Elliot L. Chaikof (echaikof@bidmc.harvard.edu).
Materials availability
This study did not generate new unique reagents.
Data and code availability
The datasets generated during this study are included in Supplemental Information and are available from the corresponding author on request.
Experimental model and subject details
Animal model
Male C57BL/6 mice were purchased from The Jackson Laboratory and housed in groups of five in ventilated cages with ad libitum access to water and chow diet. Resident peritoneal macrophages were collected by lavaging the peritoneal cavity of 8-week-old C57BL/6 mice. Elicited peritoneal macrophages were collected by lavaging the peritoneal cavity with 5 mL of 10 mM EDTA PBS 4 days following intraperitoneal injection of 0.5 mL of 6% sterile thioglycolate broth. The Beth Israel Deaconess Medical Center Institutional Animal Care and Use Committee (IACUC) approved all protocols.
Method details
Macrophage isolation, polarization, and characterization
Macrophages were enriched by plate adherence for 1 h and unattached cells were removed. Macrophages were cultured at 37°C in a humidified incubator with 5% CO2 in complete medium: Dulbecco’s Modified Eagle Media (DMEM) supplemented with 10% fetal bovine serum (v/v). Where indicated, macrophage activation was induced as follows: 100 U/mL IFN-γ, 100 ng/mL LPS (M1); 20 ng/mL IL-4 (M2a); 100 ng/mL IL-10 (M2c) for 24 h or 100 μg/mL medium oxidized low density lipoprotein (oxLDL) (foam) for 48 h. Because in vitro conditions may affect the cellular glycome, polarization was initiated at different time points so that all cells could be harvested consistently after 72 h of culture. Macrophages were dislocated by non-enzymatic buffer and 5x10⁵ cells were stained at 4°C for 30 min with the following fluorochrome conjugated antibodies: anti-F4/80, anti-CD11b, anti-I-A/I-E, anti-CD86, and anti-PD-L2. For staining, cells were cultured in glass slides and polarized to foam cells. Untreated elicited macrophages (M0) were used as a control. Cells were fixed in 10% formalin (v/v), washed with water followed by 60% isopropanol (v/v), and let dry. Freshly prepared Oil Red O working solution was added and incubated at room temperature for 10 min. Samples were mounted in anti-fade mounting medium supplemented with DAPI for nuclear staining and imaged by confocal microscopy (Leica SP5 X MP, 63x oil lens). See also Figure S1.
N-/O-Glycomic analysis
A total of 1x10⁷ macrophages were collected per cell type to generate both N- and O-linked glycan profiles following previously described protocols (North et al., 2010). Cells were washed with PBS, resuspended in ice-cold lysis buffer (25 mM TRIS, 150 mM NaCl, 5 mM EDTA and 1% CHAPS, pH 7.4), and lysed by sonication on ice. Cell lysates were subsequently dialyzed against 50 mM ammonium bicarbonate buffer solution at 4°C for 48 h and lyophilized. The dried glycoproteins were incubated with trypsin at 37°C for 16 h before releasing N-glycans using PNGase F at 37°C for 24 h. Liberated N-glycans were separated from glycopeptides using C18 Sep Pak SPE cartridges and eluted with 5% acetic acid in water (v/v). O-Glycans were released from the retaining glycopeptides via reductive β-elimination with a solution of 1 M KBH4 in 0.1 M KOH, which was quenched with dropwise addition of glacial acetic acid, and purified by co-evaporation with 10% acetic acid in methanol (v/v). Glycans were dried and permethylated by addition of a DMSO/NaOH slurry (100-200 μL) followed by methyl iodide (25-50 μL), which was mixed at room temperature for 20 min, quenched with dropwise addition of water, and partitioned using chloroform and water, discarding the upper aqueous layer five times. The chloroform layer was dried under nitrogen gas and purified using C18 Sep Pak SPE cartridges, eluting stepwise with 15%, 35%, 50%, and 75% acetonitrile in water (v/v) prior to mass spectrometric analysis.
Cellular O-Glycome reporter amplification (CORA)
Resident and elicited/M0 macrophages were cultured in complete medium supplemented with 0.1% DMSO (v/v) or 50 μM peracetylated benzyl α-D-GalNAc (Ac3GalNAc-α-Bn) in 0.1% DMSO (v/v), which was generated from GalNAc-α-Bn and screened at various doses as previously described (Kudelka et al., 2015). Pyridine:acetic anhydride was added to GalNAc-α-Bn (2:1) at 65°C for 1 h, dried in vacuo, resuspended in 1 mL of water, and lyophilized. Media were replaced daily. On day 2, M0 macrophages were polarized to M1, M2a, and M2c for 24 h along with 0.1% DMSO (v/v) or 5 μM Ac3GalNAc-α-Bn in 0.1% DMSO (v/v). Conditioned media were collected after 24 h. For foam cell differentiation, M0 macrophages were supplemented with oxLDL on day 1 and 50 μM Ac3GalNAc-α-Bn on day 2 in 0.1% DMSO (v/v). Conditioned media were collected on day 3. Glycans in the media were permethylated and purified prior to mass spectrometric analysis.
Mass spectrometric analysis
Prepared glycans were solubilized in 10 μL methanol. An aliquot of this suspension (1 μL) was spotted onto a Bruker AnchorChip 384 BC target plate followed by 1 μL of 20 mg/mL 2,5-dihydroxybenzoic acid in 80% methanol and 20% water (v/v), mixed, and dried. Spectra were collected in reflectron positive (RP) mode over a mass range of 700-5000 m/z (N-glycans) or 700-2000 m/z (O-glycans) using a Bruker Daltonics UltrafleXtreme MALDI TOF-TOF mass spectrometer and flexControl 3.4. Five thousand shots were accumulated per spectrum. Molecular ions were detected as [M+Na]+. Mass inaccuracies were corrected using ProteoMass Peptide and Protein MALDI-MS calibration standard. Glycan compositions were manually inspected using MALDI LIFT-TOF/TOF MS/MS.
Data analysis
Glycan compositions were identified according to accurate mass using a library of possible compositions constructed based on the mammalian N- and O-glycan biosynthetic pathways. Signals above a signal-to-noise ratio of 3.5 were filtered and their areas were calculated using flexAnalysis 3.4. Relative abundances were determined by integrating peak areas for observed glycan masses and normalizing to the summed peak areas of all glycans detected per given sample. Spectra were visualized using mMass 5.5.0 (Strohalm et al., 2010). Glycan structures represented by symbol notation were built using GlycoWorkbench 1.1 (Ceroni et al., 2008).
Plant lectin staining
Optimal lectin concentrations were determined by titration and specificity was verified by a small molecule inhibitor or pre-treatment with neuraminidase as follows: Peanut agglutinin (PNA) (0.1 μg/mL ± D-galactose), Maackia amurensis lectin I (MAL-I) (5 μg/mL ± lactose), Erythrina cristagalli lectin (ECL) (1 μg/mL ± lactose), Concanavalin A (ConA) (5 μg/mL ± D-mannose), Aleuria aurantia lectin (AAL) (1 μg/mL ± L-fucose), Ulex europaeus agglutinin I (UEA-I) (1 μg/mL ± L-fucose), Lycopersicon esculentum lectin (LEL) (5 μg/mL ± chitin hydrolysate), Phaseolus vulgaris erythroagglutinin (E-PHA) (1 μg/mL ± bovine thyroglobulin), Phaseolus vulgaris leucoagglutinin (L-PHA) (10 μg/mL ± bovine thyroglobulin), Maackia amurensis lectin II (MAL-II) (10 μg/mL ± neuraminidase) and Sambucus nigra lectin (SNA) (10 μg/mL ± neuraminidase). Addition of inhibitors followed manufacturer’s guidelines. Neuraminidase pre-treatment of cells proceeded at 37°C for 1 h with gentle shaking every 10 min. A total of 5x10⁵ macrophages were resuspended in 100 μL of staining buffer (1 mM CaCl2, 1 mM MgCl2, 1% bovine serum albumin, 0.1% sodium azide in PBS) per well on a 96-well plate and each well was incubated with one of the 11 biotinylated lectins on ice for 30 min. Cells were subsequently washed twice with staining buffer and incubated with streptavidin-PE at 4°C for 30 min in the dark. Experimental control conditions included a no staining group and a streptavidin-PE-only group. After further washing, cells were subjected to flow cytometry analysis using BD LSR II. In addition, cells were stained with only streptavidin-PE as controls to ensure minimal secondary staining. The study was repeated once and an average of replicates is presented.
RNA isolation and cDNA synthesis
Total RNA isolation and cDNA synthesis was carried out with four biological replicates of each cell type as described previously (Nairn et al., 2010). RNA was isolated using the RNeasy Plus Mini RNA Isolation Kit following the manufacturer’s guidelines, and eluted in RNase-free water. If needed, upon removal of genomic DNA (gDNA) using RNase-free DNase, samples were re-isolated with a second RNeasy column and eluted in RNAse-free water. The SuperScript III First-Strand Synthesis System was used to synthesize cDNA from 0.5 μg of total RNA. A 1:10 dilution of each reaction (20 μL) was prepared with DEPC-treated water prior to qRT-PCR reactions.
qRT-PCR reactions
The qRT-PCR reactions were performed in technical triplicates for each gene analyzed, which were then averaged. Each reaction contained 1.25 μL of diluted cDNA or gDNA template, 1.25 μL of primer pair mix (125 μM final), and 2.5 μL of iQ SYBR Green Supermix. Optimized amplification conditions were applied and data analysis was performed as described previously (Nairn et al., 2010). Plates were centrifuged at 2500 rpm for 5 min and the following cycling conditions were applied using a Eppendorf RealPlex2 Master-Cycler: 95°C for 3 min followed by 40 cycles of 95°C for 10 s (denaturing), 65°C for 45 s (annealing), and 78°C for 20 s (data collection). A melt curve program was subsequently applied as follows: 95°C for 1 min, 55°C for 1 min, 0.5°C increase per cycle for 80 cycles of 10 s each. Ct values for each gene were normalized to the control gene, β-actin, prior to calculation of relative transcript abundance. In total, 148 glycosylation genes and 161 glycan-binding protein (GBP) genes along with common macrophage marker genes (Cd14, Cd68, Adgre4) and non-carbohydrate-active protein genes (Epha2, Mogat1, Mogat2, Sppl3) were included in the analysis.
Quantification and statistical analysis
Partial least squares discriminant analysis (PLS-DA) was performed after autoscaling using MetaboAnalyst 4.0 (Chong et al., 2018). Statistical evaluation of significant glycan abundance changes was performed using a Student’s t-test. For multiple comparisons, a one-way analysis of variance (ANOVA) was performed followed by a Holm-Sidak test. For comparisons where a glycan was detected in only one group, a one sample t-test was used. Statistical evaluation of significant transcript abundance changes was performed using a Mann-Whitney U test. P values of less than 0.05 denote statistical significance. Gene expression was analyzed using NetworkAnalyst 3.0 (Zhou et al., 2019). Features with more than 50% missing values were removed and the remaining missing values were replaced by feature mean. StandardScaler was used to standardize the expression of genes encoding glycan processing and glycan-binding proteins in resident and elicited/M0 macrophages. A correlation matrix was constructed by computing the Pearson correlation coefficient between all pairs (Babicki et al., 2016). The 95% confidence limits were determined using bootstrapping with 10,000 replicates.
Supplementary Material
Key resources table
| REAGENT or RESOURCE | SOURCE | IDENTIFIER |
|---|---|---|
| Antibodies | ||
| F4/80 Monoclonal Antibody (BM8) | eBioscience | Cat#17-4801-82; RRID: AB_2784648 |
| CD11b Monoclonal Antibody (M1/70) | eBioscience | Cat#RM2828; RRID: AB_10372795 |
| Anti-Mouse I-A/I-E (M5/114.15.2) | BD Biosciences | Cat#557000; RRID: AB_396546 |
| Anti-Mouse CD86 (GL1) | BD Biosciences | Cat#553692; RRID: AB_394994 |
| Anti-Mouse CD273 (TY25) | BD Biosciences | Cat#557796; RRID: AB_396874 |
| Chemicals, peptides, and recombinant proteins | ||
| Mouse IFN gamma Recombinant Protein | R&D Systems | Cat#485-MI |
| Lipopolysaccharide (LPS) Solution | Sigma-Aldrich | Cat#L8274 |
| Recombinant Mouse IL-4 Protein | R&D Systems | Cat#404-ML |
| Recombinant Mouse IL-10 Protein | R&D Systems | Cat#417-ML |
| Oxidized Low Density Lipoprotein (oxLDL) | Kalen Biomedical | Cat#770202-6 |
| Oil Red O | Sigma-Aldrich | Cat#O0625 |
| SlowFade Gold Antifade Mountant with DAPI | Invitrogen | Cat#S36938 |
| PNGase F (Glycerol-free) | New England BioLabs | Cat#P0705L |
| Sequencing Grade Modified Trypsin | Promega | Cat#V5111 |
| Sep-Pak C18 Cartridge | Waters | Cat#WAT054945 |
| GalNAc-α-Bn | Sigma-Aldrich | Cat#B4894 |
| Peanut agglutinin (PNA), Biotinylated | Vector Laboratories | Cat#B-1075 |
| Maackia amurensis lectin I (MAL-I), Biotinylated | Vector Laboratories | Cat#B-1315 |
| Erythrina cristagalli lectin (ECL), Biotinylated | Vector Laboratories | Cat#B-1145 |
| Concanavalin A (ConA), Biotinylated | Vector Laboratories | Cat#B-1005 |
| Aleuria aurantia lectin (AAL), Biotinylated | Vector Laboratories | Cat#B-1395 |
| Ulex europaeus agglutinin I (UEA-I), Biotinylated | Vector Laboratories | Cat#B-1065 |
| Lycopersicon esculentum lectin (LEL), Biotinylated | Vector Laboratories | Cat#B-1175 |
| Phaseolus vulgaris erythroagglutinin (E-PHA), Biotinylated | Vector Laboratories | Cat#B-1125 |
| Phaseolus vulgaris leucoagglutinin (L-PHA), Biotinylated | Vector Laboratories | Cat#B-1115 |
| Maackia amurensis lectin II (MAL-II), Biotinylated | Vector Laboratories | Cat#B-1265 |
| Sambucus nigra lectin (SNA), Biotinylated | Vector Laboratories | Cat#B-1305 |
| Neuraminidase | Roche | Cat#10269611001 |
| Streptavidin-PE | eBioscience | Cat#12-4317-87 |
| RNeasy Plus Mini RNA Isolation Kit | Qiagen | Cat#74134 |
| RNase-free DNase | Ambion | Cat#AM2222 |
| SuperScript III First-Strand Synthesis System | Invitrogen | Cat#18080051 |
| UltraPure DEPC-treated Water | Invitrogen | Cat#750024 |
| iQ SYBR Green Supermix | BioRad | Cat#1708880 |
| ProteoMass Peptide and Protein MALDI-MS Calibration Standard | Supelco | Cat#MSCAL1 |
| Experimental models: organisms/strains | ||
| C57BL/6 | The Jackson Laboratory | JAX: 000664 |
| Software and algorithms | ||
| Prism 6.0 | GraphPad | https://www.graphpad.com/scientific-software/prism/ |
| GlycoWorkbench 1.1 | Ceroni et al., 2008 | https://code.google.com/archive/p/glycoworkbench/ |
| mMass 5.5.0 | Strohalm et al., 2010 | http://www.mmass.org |
| flexControl 3.4 | Bruker | Part#282595 |
| flexAnalysis 3.4 | Bruker | Part#282592 |
| MetaboAnalyst 4.0 | Chong et al., 2018 | https://www.metaboanalyst.ca |
| NetworkAnalyst 3.0 | Zhou et al., 2019 | https://www.networkanalyst.ca |
Significance.
Lineage-tracing experiments indicate that resident macrophages derive from primitive progenitor cells while elicited macrophages are the product of monocyte infiltration. Protein glycosylation facilitates key processes in both populations and may present an additional lens to differentiate resident from elicited macrophages. We provide a comprehensive analysis of the cellular glycomes of primary murine resident, elicited, and polarized elicited macrophages, as well as expression of genes involved in glycan biosynthetic and recognition pathways. Differences in macrophage glycosylation are consistent with major phenotypic distinctions that contribute to specific macrophage functions. Capturing molecular details with multiple parallel analytical techniques, as described in this resource, will be useful in deciphering the structural uniqueness of proteins presented on macrophage sub-populations. This resource provides a framework to explore specific glycan and GBP relationships and investigate the significance of distinctive glycan signatures among macrophages that reside in a variety of additional host tissues.
Highlights.
Glycan alterations distinguish macrophage populations primarily by lineage
Resident macrophages exhibit a less heterogeneous glycan profile than elicited cells
C-Type lectins are downregulated in elicited macrophages
Siglec expression is correlated with prevalent sialyltransferase expression
Acknowledgments
This work was supported by grants from the NIH, including GM103490 (to K.W.M.), HL110843 (to A.M.P.), K12 HL141953 (to J.C.), P41GM103694 (to R.D.C. and E.L.C.), and R01DK107405 (to E.L.C.). This work was conducted with support from Harvard Catalyst, The Harvard Clinical and Translational Science Center (National Center for Advancing Translational Sciences, NIH award UL 1TR002541).
Footnotes
Supplemental information
Supplemental information can be found online at https://doi.org/10.1016/j.chembiol.2020.12.005.
Declaration of interests
The authors declare no competing interests.
References
- Akama TO, Nakagawa H, Wong NK, Sutton-Smith M, Dell A, Morris HR, Nakayama J, Nishimura SI, Pai A, Moremen KW, et al. (2006). Essential and mutually compensatory roles of α-mannosidase II and α-mannosidase IIx in N-glycan processing in vivo in mice. Proc. Natl. Acad. Sci. U S A 103, 8983–8988. [DOI] [PMC free article] [PubMed] [Google Scholar]
- Antonopoulos A, North SJ, Haslam SM, and Dell A (2011). Glycosylation of mouse and human immune cells: insights emerging from N-glycomics analyses. Biochem. Soc. Trans 39, 1334–1340. [DOI] [PubMed] [Google Scholar]
- Austyn JM, and Gordon S (1981). F4/80, a monoclonal antibody directed specifically against the mouse macrophage. Eur. J. Immunol 11, 805–815. [DOI] [PubMed] [Google Scholar]
- Babicki S, Arndt D, Marcu A, Liang Y, Grant JR, Maciejewski A, and Wishart DS (2016). Heatmapper: web-enabled heat mapping for all. Nucleic Acids Res. 44, W147–W153. [DOI] [PMC free article] [PubMed] [Google Scholar]
- Barrionuevo P, Beigier-Bompadre M, Ilarregui JM, Toscano MA, Bianco GA, Isturiz MA, and Rabinovich GA (2007). A novel function for galectin-1 at the crossroad of innate and adaptive immunity: galectin-1 regulates monocyte/macrophage physiology through a nonapoptotic ERK-dependent pathway. J. Immunol 178, 436–445. [DOI] [PubMed] [Google Scholar]
- Baum LG, Garner OB, Schaefer K, and Lee B (2014). Microbe-host interactions are positively and negatively regulated by galectin-glycan interactions. Front. Immunol 5, 284. [DOI] [PMC free article] [PubMed] [Google Scholar]
- Bax M, van Vliet SJ, Litjens M, García-Vallejo JJ, and van Kooyk Y (2009). Interaction of polysialic acid with CCL21 regulates the migratory capacity of human dendritic cells. PLoS One 4, e6987. [DOI] [PMC free article] [PubMed] [Google Scholar]
- Biessen EAL, and Wouters K (2017). Macrophage complexity in human atherosclerosis: opportunities for treatment? Curr. Opin. Lipidol 28, 419–426. [DOI] [PubMed] [Google Scholar]
- Cassado AA, D’Império Lima MR, and Bortoluci KR (2015). Revisiting mouse peritoneal macrophages: heterogeneity, development, and function. Front. Immunol 6, 225. [DOI] [PMC free article] [PubMed] [Google Scholar]
- Ceroni A, Maass K, Geyer H, Geyer R, Dell A, and Haslam SM (2008). GlycoWorkbench:a tool for the computer-assisted annotation of mass spectra of glycans. J. Proteome Res 7, 1650–1659. [DOI] [PubMed] [Google Scholar]
- Chong J, Soufan O, Li C, Caraus I, Li S, Bourque G, Wishart DS, and Xia J (2018). MetaboAnalyst 4.0: towards more transparent and integrative metabolomics analysis. Nucleic Acids Res. 46, W486–W494. [DOI] [PMC free article] [PubMed] [Google Scholar]
- Chui D, Oh-Eda M, Liao YF, Panneerselvam K, Lal A, Marek KW, Freeze HH, Moremen KW, Fukuda MN, and Marth JD (1997). Alpha-mannosidase-II deficiency results in dyserythropoiesis and unveils an alternate pathway in oligosaccharide biosynthesis. Cell 90, 157–167. [DOI] [PubMed] [Google Scholar]
- Comelli EM, Sutton-Smith M, Yan Q, Amado M, Panico M, Gilmartin T, Whisenant T, Lanigan CM, Head SR, Goldberg D, et al. (2006). Activation of murine CD4+ and CD8+ T lymphocytes leads to dramatic remodeling of N-linked glycans. J. Immunol 177, 2431–2440. [DOI] [PubMed] [Google Scholar]
- Crocker PR, Paulson JC, and Varki A (2007). Siglecs and their roles in the immune system. Nat. Rev. Immunol 7, 255–266. [DOI] [PubMed] [Google Scholar]
- Davignon JL, Hayder M, Baron M, Boyer JF, Constantin A, Apparailly F, Poupot R, and Cantagrel A (2013). Targeting monocytes/macrophages in the treatment of rheumatoid arthritis. Rheumatology (Oxford) 52, 590–598. [DOI] [PubMed] [Google Scholar]
- Delannoy CP, Rombouts Y, Groux-Degroote S, Holst S, Coddeville B, Harduin-Lepers A, Wuhrer M, Elass-Rochard E, and Guérardel Y (2017). Glycosylation changes triggered by the differentiation of monocytic THP-1 cell line into macrophages. J. Proteome Res 16, 156–169. [DOI] [PubMed] [Google Scholar]
- Duong BH, Tian H, Ota T, Completo G, Han S, Vela JL, Ota M, Kubitz M, Bovin N, Paulson J, et al. (2010). Decoration of T-independent antigen with ligands for CD22 and Siglec-G can suppress immunity and induce B cell tolerance in vivo. J. Exp. Med 207, 173–187. [DOI] [PMC free article] [PubMed] [Google Scholar]
- Ellies LG, Tsuboi S, Petryniak B, Lowe JB, Fukuda M, and Marth JD (1998). Core 2 oligosaccharide biosynthesis distinguishes between selectin ligands essential for leukocyte homing and inflammation. Immunity 9, 881–890. [DOI] [PubMed] [Google Scholar]
- Fukuta K, Yokomatsu T, Abe R, Asanagi M, and Makino T (2000). Genetic engineering of CHO cells producing human interferon-γ by transfection of sialyltransferases. Glycoconj. J 17, 895–904. [DOI] [PubMed] [Google Scholar]
- Ghosn EEB, Cassado AA, Govoni GR, Fukuhara T, Yang Y, Monack DM, Bortoluci KR, Almeida SR, Herzenberg LA, and Herzenberg LA (2010). Two physically, functionally, and developmentally distinct peritoneal macrophage subsets. Proc. Natl. Acad. Sci. U S A 107, 2568–2573. [DOI] [PMC free article] [PubMed] [Google Scholar]
- Gratchev A, Guillot P, Hakiy N, Politz O, Orfanos CE, Schledzewski K, and Goerdt S (2001). Alternatively activated macrophages differentially express fibronectin and its splice variants and the extracellular matrix protein βIG-H3. Scand. J. Immunol 53, 386–392. [DOI] [PubMed] [Google Scholar]
- Green RS, Stone EL, Tenno M, Lehtonen E, Farquhar MG, and Marth JDD (2007). Mammalian N-glycan branching protects against innate immune self-recognition and inflammation in autoimmune disease pathogenesis. Immunity 27, 308–320. [DOI] [PubMed] [Google Scholar]
- Hashimoto D, Chow A, Noizat C, Teo P, Beasley MB, Leboeuf M, Becker CD, See P, Price J, Lucas D, et al. (2013). Tissue-resident macrophages self-maintain locally throughout adult life with minimal contribution from circulating monocytes. Immunity 38, 792–804. [DOI] [PMC free article] [PubMed] [Google Scholar]
- Hsu DK, Yang RY, Pan Z, Yu L, Salomon DR, Fung-Leung WP, and Liu FT (2000). Targeted disruption of the galectin-3 gene results in attenuated peritoneal inflammatory responses. Am. J. Pathol 156, 1073–1083. [DOI] [PMC free article] [PubMed] [Google Scholar]
- Isaji T, Gu J, Nishiuchi R, Zhao Y, Takahashi M, Miyoshi E, Honke K, Sekiguchi K, and Taniguchi N (2004). Introduction of bisecting GlcNAc into integrin α5β1 reduces ligand binding and down-regulates cell adhesion and cell migration. J. Biol. Chem 279, 19747–19754. [DOI] [PubMed] [Google Scholar]
- Julien S, Grimshaw MJ, Sutton-Smith M, Coleman J, Morris HR, Dell A, Taylor-Papadimitriou J, and Burchell JM (2007). Sialyl-Lewis x on P-selectin glycoprotein ligand-1 is regulated during differentiation and maturation of dendritic cells: a mechanism involving the glycosyltransferases C2GnT1 and ST3Gal I. J. Immunol 179, 5701–5710. [DOI] [PubMed] [Google Scholar]
- Kudelka MR, Antonopoulos A, Wang Y, Duong DM, Song X, Seyfried NT, Dell A, Haslam SM, Cummings RD, and Ju T (2015). Cellular O-glycome reporter/amplification to explore O-glycans of living cells. Nat. Methods 13, 81–86. [DOI] [PMC free article] [PubMed] [Google Scholar]
- Li F, Wilkins PP, Crawley S, Weinstein J, Cummings RD, and McEver RP (1996). Post-translational modifications of recombinant P-selectin glycoprotein ligand-1 required for binding to P- and E-selectin. J. Biol. Chem 271, 3255–3264. [PubMed] [Google Scholar]
- Liu FT, Hsu DK, Zuberi RI, Kuwabara I, Chi EY, and Henderson WR (1995). Expression and function of galectin-3, a β-galactoside-binding lectin, in human monocytes and macrophages. Am. J. Pathol 147, 1016–1028. [PMC free article] [PubMed] [Google Scholar]
- Macauley MS, Crocker PR, and Paulson JC (2014). Siglec-mediated regulation of immune cell function in disease. Nat. Rev. Immunol 14, 653–666. [DOI] [PMC free article] [PubMed] [Google Scholar]
- McMillan SJ, Sharma RS, Richards HE, Hegde V, and Crocker PR (2014). Siglec-E promotes β2-integrin-dependent NADPH oxidase activation to suppress neutrophil recruitment to the lung. J. Biol. Chem 289, 20370–20376. [DOI] [PMC free article] [PubMed] [Google Scholar]
- Mercurio AM, Schwarting GA, and Robbins PW (1984). Glycolipids of the mouse peritoneal macrophage: alterations in amount and surface exposure of specific glycolipid species occur in response to inflammation and tumoricidal activation. J. Exp. Med 160, 1114–1125. [DOI] [PMC free article] [PubMed] [Google Scholar]
- Moody AM, Chui D, Reche PA, Priatel JJ, Marth JD, and Reinherz EL (2001). Developmentally regulated glycosylation of the CD8αβ coreceptor stalk modulates ligand binding. Cell 107, 501–512. [DOI] [PubMed] [Google Scholar]
- Morgan R, Gao G, Pawling J, Dennis JW, Demetriou M, and Li B (2004). N-Acetylglucosaminyltransferase V (Mgat5)-mediated N-glycosylation negatively regulates Th1 cytokine production by T cells. J. Immunol 173, 7200–7208. [DOI] [PubMed] [Google Scholar]
- Nairn AV, dela Rosa M, and Moremen KW (2010). Transcript analysis of stem cells. Methods Enzymol. 479, 73–91. [DOI] [PMC free article] [PubMed] [Google Scholar]
- Naito Y, Takematsu H, Koyama S, Miyake S, Yamamoto H, Fujinawa R, Sugai M, Okuno Y, Tsujimoto G, Yamaji T, et al. (2007). Germinal center marker GL7 probes activation-dependent repression of N-glycolylneuraminic acid, a sialic acid species involved in the negative modulation of B-cell activation. Mol. Cell. Biol 27, 3008–3022. [DOI] [PMC free article] [PubMed] [Google Scholar]
- Neelamegham S, and Mahal LK (2016). Multi-level regulation of cellular glycosylation: from genes to transcript to enzyme to structure. Curr. Opin. Struct. Biol 40, 145–152. [DOI] [PMC free article] [PubMed] [Google Scholar]
- North SJ, Jang-Lee J, Harrison R, Canis K, Ismail MN, Trollope A, Antonopoulos A, Pang PC, Grassi P, Al-Chalabi S, et al. (2010). Mass spectrometric analysis of mutant mice. Methods Enzymol. 478, 27–77. [DOI] [PubMed] [Google Scholar]
- Noy R, and Pollard JW (2014). Tumor-associated macrophages: from mechanisms to therapy. Immunity 41, 49–61. [DOI] [PMC free article] [PubMed] [Google Scholar]
- Oishi S, Takano R, Tamura S, Tani S, Iwaizumi M, Hamaya Y, Takagaki K, Nagata T, Seto S, Horii T, et al. (2016). M2 polarization of murine peritoneal macrophages induces regulatory cytokine production and suppresses T-cell proliferation. Immunology 149, 320–328. [DOI] [PMC free article] [PubMed] [Google Scholar]
- Okabe Y (2018). Molecular control of the identity of tissue-resident macrophages. Int. Immunol 30, 485–491. [DOI] [PubMed] [Google Scholar]
- Okabe Y, and Medzhitov R (2014). Tissue-specific signals control reversible program of localization and functional polarization of macrophages. Cell 157, 832–844. [DOI] [PMC free article] [PubMed] [Google Scholar]
- Park D, Arabyan N, Williams CC, Song T, Mitra A, Weimer BC, Maverakis E, and Lebrilla CB (2016). Salmonella typhimurium enzymatically landscapes the host intestinal epithelial cell surface glycome to increase invasion. Mol. Cell. Proteomics 15, 3653–3664. [DOI] [PMC free article] [PubMed] [Google Scholar]
- Partridge EA, Le Roy C, Di Guglielmo GM, Pawling J, Cheung P, Granovsky M, Nabi IR, Wrana JL, and Dennis JW (2004). Regulation of cytokine receptors by Golgi N-glycan processing and endocytosis. Science 306, 120–124. [DOI] [PubMed] [Google Scholar]
- Patel PC, Fisher KH, Yang ECC, Deane CM, and Harrison RE (2009). Proteomic analysis of microtubule-associated proteins during macrophage activation. Mol. Cell. Proteomics 8, 2500–2514. [DOI] [PMC free article] [PubMed] [Google Scholar]
- Perdiguero EG, and Geissmann F (2016). The development and maintenance of resident macrophages. Nat. Immunol 17, 2–8. [DOI] [PMC free article] [PubMed] [Google Scholar]
- Petäjä-Repo UE, Hogue M, Lapèrriere A, Walker P, and Bouvier M (2000). Export from the endoplasmic reticulum represents the limiting step in the maturation and cell surface expression of the human δ opioid receptor. J. Biol. Chem 275, 13727–13736. [DOI] [PubMed] [Google Scholar]
- Peterson KR, Cottam MA, Kennedy AJ, and Hasty AH (2018). Macrophage-targeted therapeutics for metabolic disease. Trends Pharmacol. Sci 39, 536–546. [DOI] [PMC free article] [PubMed] [Google Scholar]
- Prasad DVR, Parekh VV, Joshi BN, Banerjee PP, Parab PB, Chattopadhyay S, Kumar A, and Mishra GC (2002). The Th1-specific costimulatory molecule, M150, is a posttranslational isoform of lysosome-associated membrane protein-1. J. Immunol 169, 1801–1809. [DOI] [PubMed] [Google Scholar]
- Rabinovich GA, Iglesias MM, Modesti NM, Castagna LF, Wolfenstein-Todel C, Riera CM, and Sotomayor CE (1998). Activated rat macrophages produce a galectin-1-like protein that induces apoptosis of T cells: biochemical and functional characterization. J. Immunol 160, 4831–4840. [PubMed] [Google Scholar]
- Rabinovich GA, Sotomayor CE, Riera CM, Bianco I, and Correa SG (2000). Evidence of a role for galectin-1 in acute inflammation. Eur. J. Immunol 30, 1331–1339. [DOI] [PubMed] [Google Scholar]
- Rabinovich GA, Toscano MA, Jackson SS, and Vasta GR (2007). Functions of cell surface galectin-glycoprotein lattices. Curr. Opin. Struct. Biol 17, 513–520. [DOI] [PMC free article] [PubMed] [Google Scholar]
- Rabinowitz SS, and Gordon S (1991). Macrosialin, a macrophage-restricted membrane sialoprotein differentially glycosylated in response to inflammatory stimuli. J. Exp. Med 174, 827–836. [DOI] [PMC free article] [PubMed] [Google Scholar]
- Ricote M, Li AC, Willson TM, Kelly CJ, and Glass CK (1998). The peroxisome proliferator-activated receptor-γ is a negative regulator of macrophage activation. Nature 391, 79–82. [DOI] [PubMed] [Google Scholar]
- Ryczko MC, Pawling J, Chen R, Abdel Rahman AM, Yau K, Copeland JK, Zhang C, Surendra A, Guttman DS, Figeys D, et al. (2016). Metabolic reprogramming by hexosamine biosynthetic and Golgi N-glycan branching pathways. Sci. Rep 6, 23043. [DOI] [PMC free article] [PubMed] [Google Scholar]
- Sano H, Hsu DK, Apgar JR, Yu L, Sharma BB, Kuwabara I, Izui S, and Liu FT (2003). Critical role of galectin-3 in phagocytosis by macrophages. J. Clin. Invest 112, 389–397. [DOI] [PMC free article] [PubMed] [Google Scholar]
- Da Silva TA, Zorzetto-Fernandes ALV, Cecílio NT, Sardinha-Silva A, Fernandes FF, and Roque-Barreira MC (2017). CD14 is critical for TLR2-mediated M1 macrophage activation triggered by N-glycan recognition. Sci. Rep 7, 7083. [DOI] [PMC free article] [PubMed] [Google Scholar]
- Strohalm M, Kavan D, Novák P, Volný M, and Havlíček V (2010). MMass 3: a cross-platform software environment for precise analysis of mass spectrometric data. Anal. Chem 82, 4648–4651. [DOI] [PubMed] [Google Scholar]
- Struwe WB, Gough R, Gallagher ME, Kenny DT, Carrington SD, Karlsson NG, and Rudd PM (2015). Identification of O-glycan structures from chicken intestinal mucins provides insight into Campylobacter jejuni pathogenicity. Mol. Cell. Proteomics 14, 1464–1477. [DOI] [PMC free article] [PubMed] [Google Scholar]
- Tacke F (2017). Targeting hepatic macrophages to treat liver diseases. J. Hepatol 66, 1300–1312. [DOI] [PubMed] [Google Scholar]
- Tateyama H, Murase Y, Higuchi H, Inasaka Y, Kaneoka H, Iijima S, and Nishijima KI (2019). Siglec-F is induced by granulocyte-macrophage colony-stimulating factor and enhances interleukin-4-induced expression of arginase-1 in mouse macrophages. Immunology 158, 340–352. [DOI] [PMC free article] [PubMed] [Google Scholar]
- Togayachi A, Kozono Y, Ishida H, Abe S, Suzuki N, Tsunoda Y, Hagiwara K, Kuno A, Ohkura T, Sato N, et al. (2007). Polylactosamine on glycoproteins influences basal levels of lymphocyte and macrophage activation. Proc. Natl. Acad. Sci. U S A 704, 15829–15834. [DOI] [PMC free article] [PubMed] [Google Scholar]
- Toscano MA, Bianco GA, Ilarregui JM, Croci DO, Correale J, Hernandez JD, Zwirner NW, Poirier F, Riley EM, Baum LG, et al. (2007). Differential glycosylation of TH1, TH2 and TH-17 effector cells selectively regulates susceptibility to cell death. Nat. Immunol 8, 825–834. [DOI] [PubMed] [Google Scholar]
- Valledor AF, Comalada M, Santamaría-Babi LF, Lloberas J, and Celada A (2010). Macrophage proinflammatory activation and deactivation: a question of balance. Adv. Immunol 108, 1–20. [DOI] [PubMed] [Google Scholar]
- Vimr E, and Lichtensteiger C (2002). To sialylate, or not to sialylate: that is the question. Trends Microbiol. 10, 254–257. [DOI] [PubMed] [Google Scholar]
- Wakui H, Fuseya S, Suzuki R, Shimbo M, Okada R, Hamada M, Kuno A, Hagiwara K, Sato T, Narimatsu H, et al. (2017). Incomplete clearance of apoptotic cells by core 1-derived O-glycan-deficient resident peritoneal macrophages. Biochem. Biophys. Res. Commun 495, 2017–2023. [DOI] [PubMed] [Google Scholar]
- Wang J, and Kubes P (2016). A reservoir of mature cavity macrophages that can rapidly invade visceral organs to affect tissue repair. Cell 165, 668–678. [DOI] [PubMed] [Google Scholar]
- Wang D, Ozhegov E, Wang L, Zhou A, Nie H, Li Y, and Sun XL (2016). Sialylation and desialylation dynamics of monocytes upon differentiation and polarization to macrophages. Glycoconj. J 33, 725–733. [DOI] [PubMed] [Google Scholar]
- Wang Y, Wang YP, Zheng G, Lee VWS, Ouyang L, Chang DHH, Mahajan D, Coombs J, Wang YM, Alexander SI, et al. (2007). Ex vivo programmed macrophages ameliorate experimental chronic inflammatory renal disease. Kidney Int. 72, 290–299. [DOI] [PubMed] [Google Scholar]
- Wong K, Valdez PA, Tan C, Yeh S, Hongo JA, and Ouyang W (2010). Phosphatidylserine receptor Tim-4 is essential for the maintenance of the homeostatic state of resident peritoneal macrophages. Proc. Natl. Acad. Sci. U S A 107, 8712–8717. [DOI] [PMC free article] [PubMed] [Google Scholar]
- Yanagihashi Y, Segawa K, Maeda R, Nabeshima YI, and Nagata S (2017). Mouse macrophages show different requirements for phosphatidylserine receptor Tim4 in efferocytosis. Proc. Natl. Acad. Sci. U S A 114, 8800–8805. [DOI] [PMC free article] [PubMed] [Google Scholar]
- Zarif JC, Yang W, Hernandez JR, Zhang H, and Pienta KJ (2017). The identification of macrophage-enriched glycoproteins using glycoproteomics. Mol. Cell. Proteomics 16, 1029–1037. [DOI] [PMC free article] [PubMed] [Google Scholar]
- Zhou G, Soufan O, Ewald J, Hancock REW, Basu N, and Xia J (2019). NetworkAnalyst 3.0: a visual analytics platform for comprehensive gene expression profiling and meta-analysis. Nucleic Acids Res. 47, W234–W241. [DOI] [PMC free article] [PubMed] [Google Scholar]
Associated Data
This section collects any data citations, data availability statements, or supplementary materials included in this article.
Supplementary Materials
Data Availability Statement
The datasets generated during this study are included in Supplemental Information and are available from the corresponding author on request.