

SUMMARY
Translation of problematic mRNA sequences induces ribosome stalling, triggering quality control events including ribosome rescue and nascent polypeptide degradation. To define the timing and regulation of these processes, we developed a SunTag-based reporter to monitor translation of a problematic sequence (poly(A)) in real time on single mRNAs. While poly(A)-containing mRNAs undergo continuous translation over the timescale of minutes to hours, ribosome load is increased by ~3-fold compared to a control, reflecting long queues of ribosomes extending far upstream of the stall. We monitor the resolution of these queues in real time and find that ribosome rescue is very slow compared to both elongation and termination. Modulation of pause strength, collision frequency and the collision sensor ZNF598 reveal how the dynamics of ribosome collisions and their recognition facilitate selective targeting for quality control. Our results establish that slow clearance of stalled ribosomes allows cells to distinguish between transient and deleterious stalls.
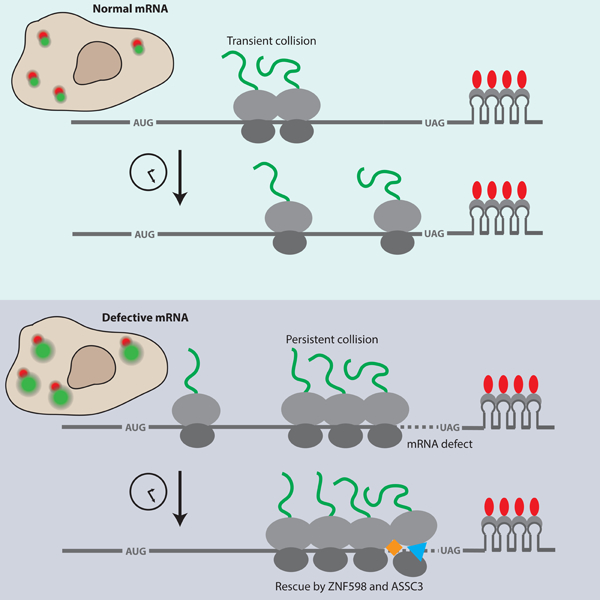
Graphical Abstract
eTOC Blurb:
Goldman et al. monitor ribosome stalling on defective mRNAs and rescue by the cellular quality control machinery using live-cell single-molecule microscopy. They uncover the determinants of selective and efficient rescue of stalled ribosomes, including stall duration, collision frequency and sensing by the E3 ubiquitin ligase ZNF598.
INTRODUCTION
Genetic mutations or errors in gene expression can result in protein misfolding, loss of protein function and proteotoxic stress. Thus, cells have evolved strategies to respond to defective gene expression. At the level of messenger RNA (mRNA), faulty transcripts are degraded by several decay pathways, depending on the defect: Nonsense-mediated decay (NMD) targets mRNAs harboring premature termination codons (PTCs), while nonstop decay (NSD) and no-go decay (NGD) target mRNAs without stop codons or with internally stalled ribosomes, respectively (Shoemaker and Green, 2012). At the protein level, ribosome-associated quality control (RQC) degrades incomplete nascent polypeptides associated with stalled ribosomes (Brandman and Hegde, 2016), while cellular chaperones and the proteasome disassemble and degrade aggregated proteins (Puchades et al., 2020).
The role of the ribosome in monitoring mRNA integrity is well-established. For example, NMD depends on translation of PTC-containing transcripts; inhibition of translation suppresses NMD (Belgrader et al., 1993). Recent single-molecule work revealed tight coupling between translation and NMD, where an average of eight ribosome encounters with a PTC was required for mRNA cleavage by the endonuclease Smg6 (Hoek et al., 2019). Alternatively, slow translation elongation can signal defects in the mRNA or translational machinery. Transcripts harboring strong secondary structure, specific mRNA sequences or nascent polypeptide sequences, or chemical damage can impede ribosome progress along the mRNA (Brandman and Hegde, 2016; Joazeiro, 2017). For example, stretches of consecutive adenosines (poly(A)) induce ribosome stalling through interactions between the ribosome and both poly(A) and the nascent poly-lysine peptide (Chandrasekaran et al., 2019; Koutmou et al., 2015; Tesina et al., 2020). Collisions ensue when upstream translating ribosomes encounter a stalled ribosome. Recent work identified collided ribosomes as the trigger for both a local quality control response (specific to the mRNA on which collisions occur) (Simms et al., 2017) and a global cell-wide response (Sinha et al., 2020; Wu et al., 2020). Failure to resolve stalled ribosomes and degrade the resultant truncated proteins can result in proteotoxic stress and neurodegeneration (Choe et al., 2016; Chu et al., 2009; Ishimura et al., 2014).
At the molecular level, ribosome collisions are detected by an E3 ubiquitin ligase ZNF598 (Hel2 in yeast) (Garzia et al., 2017; Ikeuchi et al., 2019; Juszkiewicz et al., 2018). Upon recognition of a collision, ZNF598 ubiquitylates 40S proteins eS10 and uS10 (Juszkiewicz and Hegde, 2017; Sundaramoorthy et al., 2017). The ASCC complex, containing the helicase ASCC3 (Slh1 in yeast), then splits the 40S and 60S subunits of the 3’-most stalled ribosome from the mRNA (Juszkiewicz et al., 2020; Matsuo et al., 2020). Subsequently, the E3 ligase Listerin (Ltn1 in yeast) ubiquitylates the 60S subunit-associated nascent polypeptide, targeting it for proteasomal degradation (RQC) (Brandman et al., 2012; Shao and Hegde, 2014). Experiments with a reporter coding for GFP followed by RFP revealed substantially reduced RFP levels (relative to GFP) when a poly(A) stalling sequence was inserted in between, compared to a control reporter (Juszkiewicz and Hegde, 2017). Reduced RFP levels reflect ribosome stalling at poly(A) and processing of the stalled ribosomes by the quality control pathways, precluding translation of the downstream sequence. However, RFP levels were partially restored upon depletion of either ZNF598 or ASCC3, suggesting that in the absence of recognition or clearance by these factors, ribosomes eventually bypass the stall site and translate the downstream sequence (Juszkiewicz et al., 2020). Recent work identified EDF1 as an additional, ZNF598-independent sensor of collided ribosomes that can repress translation initiation via recruitment of the protein GIGYF2 and the alternate cap-binding protein 4EHP, thereby reducing ribosome collisions (Juszkiewicz et al., 2020; Sinha et al., 2020). On the global level, environmental stress such as amino acid starvation or ultraviolet (UV) irradiation triggers ribosome stalling, overwhelming the low-abundance quality control factors and resulting in either global inhibition of translation initiation or apoptosis (Wu et al., 2020).
Despite the central role of ribosome collisions in the quality control response, it is unclear how the cellular machinery specifically targets aberrant mRNAs. Two recent studies in mammalian systems revealed widespread ribosome collisions across the transcriptome in the absence of stress, as seen by the presence of double length “disome” footprints in ribosome profiling data (Arpat et al., 2020; Han et al., 2020). Collisions are found on genes that are not known quality control targets and are estimated to involve as many as 10% of ribosomes on highly translated mRNAs. It is not understood how the cell avoids targeting these routine collisions for quality control. In one study, reducing the initiation rate on a reporter containing a poly(A) stalling sequence resulted in a higher fraction of ribosomes bypassing the stall, suggesting that the frequency of ribosome collisions (or possibly the length of the stalled ribosome queue) impacts recognition by the quality control machinery (Juszkiewicz et al., 2018). However, this study did not measure how changes in initiation rate affect the number of stalled ribosomes. Moreover, to date there have been no kinetic studies of ribosome collision-triggered quality control pathways. Thus, it is not known how the relative timing of ribosome stalling, collisions and recognition by ZNF598 contribute to regulation of quality control.
Here, we investigate the dynamics of ribosome stalling and the ensuing quality control response on single mRNAs. Using the SunTag system for live-cell imaging, we first demonstrate that a reporter mRNA harboring a poly(A) stalling sequence is readily translated on the timescale of minutes to hours. Ribosome stalling on this reporter results in large queues of collided ribosomes extending far upstream of the stall site and a ~10-fold reduction in protein output, indicating that most ribosomes are targets of RQC. Using single-molecule harringtonine runoff experiments, we observe the resolution of ribosome queues in real time. Our kinetic measurements indicate that ribosome splitting is very slow compared to translation elongation or termination, explaining how the cell distinguishes between transient and long-lasting collisions. Modulation of the rate of translation initiation elucidates how collision frequency and thus the length of the ribosome queue specify targeting for quality control. Finally, depletion of the collision sensor ZNF598 diminishes the rate of ribosome removal, indicating that ZNF598 functions to accelerate removal of stalled ribosomes. Together, our results reveal how translation quality control is regulated by the dynamics of ribosome stalling, translation initiation and recognition of collided ribosomes.
RESULTS
A SunTag reporter to monitor quality control on single mRNAs in vivo
To monitor translation quality control on single mRNAs in human cells, we implemented the SunTag method (Morisaki et al., 2016; Pichon et al., 2016; Wang et al., 2016; Wu et al., 2016; Yan et al., 2016). In this system, a reporter mRNA encodes tandem repeats of the SunTag epitope near the 5’ end of the open reading frame (Figure 1A). Upon translation of each SunTag epitope, a single chain variable fragment (scFv) of a GCN4 antibody fused to super folder GFP (scFv-sfGFP) binds the nascent polypeptide, reporting on translational activity. The mRNA is labeled red and tethered to the cell membrane through binding of MS2 coat-binding protein fused to Halotag and a CAAX motif (MCP-Halo-CAAX). It was previously demonstrated that tethering the mRNA limits diffusion of the reporter, allowing stable imaging without affecting translational output (Yan et al., 2016). Downstream of the SunTag array, Nano Luciferase (NLuc) allows for measurement of bulk protein output. Additionally, an auxin-inducible degron (AID) coupled with stable expression of the F-box protein OsTIR1 enables controlled depletion of the fully-synthesized polypeptide to reduce fluorescence background during imaging (Nishimura et al., 2009; Wu et al., 2016).
Fig. 1.

SunTag reporters for monitoring translation quality control on single mRNAs. (A) Reporter schematic depicting ribosomes with scFv-GFP-bound nascent polypeptides. The open reading frame of the reporter contains 1253 sense codons. (B) Luciferase assay to measure reporter protein output. NLuc signal is normalized to Firefly Luciferase signal from a co-transfected plasmid and the resulting ratios are normalized to no insert. Bars represent mean +/− standard error of the mean (SEM). (C) Quantification of mRNA levels by RT-qPCR. SunTag mRNA levels are normalized to mRNA levels of the co-transfected Firefly Luciferase plasmid and the resulting ratios are normalized to no insert. Bars represent mean +/− SEM. (D) Example trace of SunTag intensity over time for a no insert mRNA. (E) Example trace of SunTag intensity over time for a poly(A)60 mRNA. See also Figures S1 and S2.
We generated versions of the SunTag reporter without a stalling sequence (“no insert”) or including a stretch of either 36 or 60 adenosines shortly upstream of stop codons in all three frames (“poly(A)36” or “poly(A)60”). We chose to insert poly(A) at the 3’-end of the open reading frame (ORF) to allow maximal upstream sequence for ribosome queueing. Direct mRNA sequencing of the reporters using Oxford Nanopore technology revealed low amounts of cryptic splicing in the repetitive SunTag region; importantly, the features of the most abundant mis-spliced isoforms are incompatible with expression of both NLuc and SunTag, rendering their translation products undetectable by luciferase assay and imaging (Figure S1A and S1B). To measure expression levels, we transfected the reporters and a control plasmid expressing Firefly Luciferase (FLuc) into U-2OS cells and normalized the NLuc signal by FLuc. These measurements reveal that total protein output is ~6- or ~9-fold suppressed on poly(A)36 or poly(A)60, respectively, relative to no insert (Figure 1B). By comparison, mRNA levels of the poly(A) reporters are reduced by only ~30%, suggesting a minor contribution from mRNA loss (Figure 1C). Importantly, mRNA levels of a reporter lacking SunTag features (MS2 stem loops and coding sequence for SunTag epitopes) are not altered by insertion of a poly(A)60 sequence, indicating that these features do not appreciably interfere with mRNA decay (Figure S1C). Together, these observations are broadly consistent with previous work, in which ribosome stalling on poly(A)60 induced a comparable reduction in protein levels (Juszkiewicz and Hegde, 2017).
Although our measurements of protein and mRNA levels are consistent with ribosome stalling leading primarily to ribosome rescue and nascent polypeptide degradation, the data could also be explained by reduced efficiency of translation initiation on the poly(A) reporters. To determine whether this is the case, we introduced a P2A sequence upstream of the poly(A) insertion site (Figure S1D). Translation of P2A causes the ribosome to release the peptide at an intermediate point during ribosome elongation, thus dissociating NLuc from the ribosome prior to reaching the poly(A) stalling site and insulating NLuc from the effects of RQC (Donnelly et al., 2001). If stalled ribosomes on poly(A) trigger RQC, insertion of the P2A sequence should restore protein levels; if the data reflect reduced translation initiation efficiency, the P2A sequence should have no effect. Insertion of the P2A sequence resulted in near complete restoration of protein output from poly(A)60 (to ~80% of no insert levels), indicating that degradation of the nascent polypeptide coincident with stalling is responsible for most of the suppressed protein output (Figure S1D).
We performed additional experiments in HEK293T cells that do not express the scFv-sfGF, MCP-Halo-CAAX or OsTIR1 proteins and found that these results recapitulated those in U2OS cells (Figure S1E). These data demonstrate that protein output is not affected by mRNA tethering, antibody binding, background OsTIR1 activity or the specific cell line. Together, the luciferase and RT-qPCR data indicate that the majority of ribosomes stall on poly(A), resulting in ribosome rescue and nascent polypeptide degradation.
To monitor the translation status of mRNAs in real time, we transfected the no insert and poly(A)60 reporters into cells and imaged for 3 h, observing mRNAs for a median time of ~40–45 min (Figure S2, movies S1 and S2). Translation on both no insert and poly(A)60 exhibits a characteristic bursting pattern, in which mRNAs cycle between a translationally active and inactive state (Figure 1D–E). The no insert and poly(A) mRNAs are similarly active, found in the “on” state approximately 80% of the time. Translating mRNAs are generally observed in one of three phases: ramp-up, in which a previously inactive mRNA is being loaded with ribosomes; steady-state translation, in which ribosome load remains roughly constant over time; ramp-down, in which ribosome load is gradually reduced until complete translation shut-down. Importantly, removal of a ribosome during normal termination or by rescue on poly(A) both result in loss of one SunTag nascent polypeptide and thus a reduction in green fluorescence intensity at the translation site. The observation of both ramp-ups and ramp-downs indicates that both reporters are actively translated, undergoing translation initiation, elongation, and ribosome removal (by either normal termination or rescue of stalled ribosomes by the quality control machinery). Moreover, active translation on the timescale of minutes to hours suggests that poly(A) reporters can undergo many rounds of translation and ribosome rescue in their lifetime.
Ribosome stalling on poly(A) generates long queues of collided ribosomes
While it is widely accepted that ribosomes stall on poly(A), causing a block in elongation and queues of collided ribosomes, the number of accumulated ribosomes caused by a stall has not been directly measured. To quantify ribosome load on the SunTag mRNAs, we first generated cell lines for stable expression from a single locus in order to control the amount of cell to cell variation in mRNA expression. Protein output from these cell lines recapitulated the patterns observed with the transfected reporters characterized above (Figure S3A). We then used single-molecule fluorescence in-situ hybridization (smFISH) for detection of individual mRNAs combined with immunofluorescence (IF) detection of GFP to quantify the SunTag signal (smFISH-IF) (Latallo et al., 2019). Upon inspection of the images, bright green spots in the IF channel co-localize with red spots in the smFISH channel, reflecting translating mRNAs (Figure 2A). These spots appear significantly brighter in the green channel for the poly(A) reporters than for no insert, suggesting that poly(A) mRNAs are loaded with more ribosomes. Relative to no insert, the average number of mRNAs observed per cell is ~25% or ~55% reduced for poly(A)36 and poly(A)60, respectively (Figure S3B), while the fraction of mRNAs observed in a translating state is similar across all three reporters, although slightly higher for poly(A)60 (Figure 2B). In all samples, un-colocalized dim green spots in the IF channel represent single fully synthesized SunTag polypeptides released from the ribosome and bound by scFv-GFP (Wu et al., 2016). Although these single polypeptides are rapidly degraded (mediated by the AID sequence), they are stable enough for some of them to be detected by fixed-cell imaging.
Fig. 2.
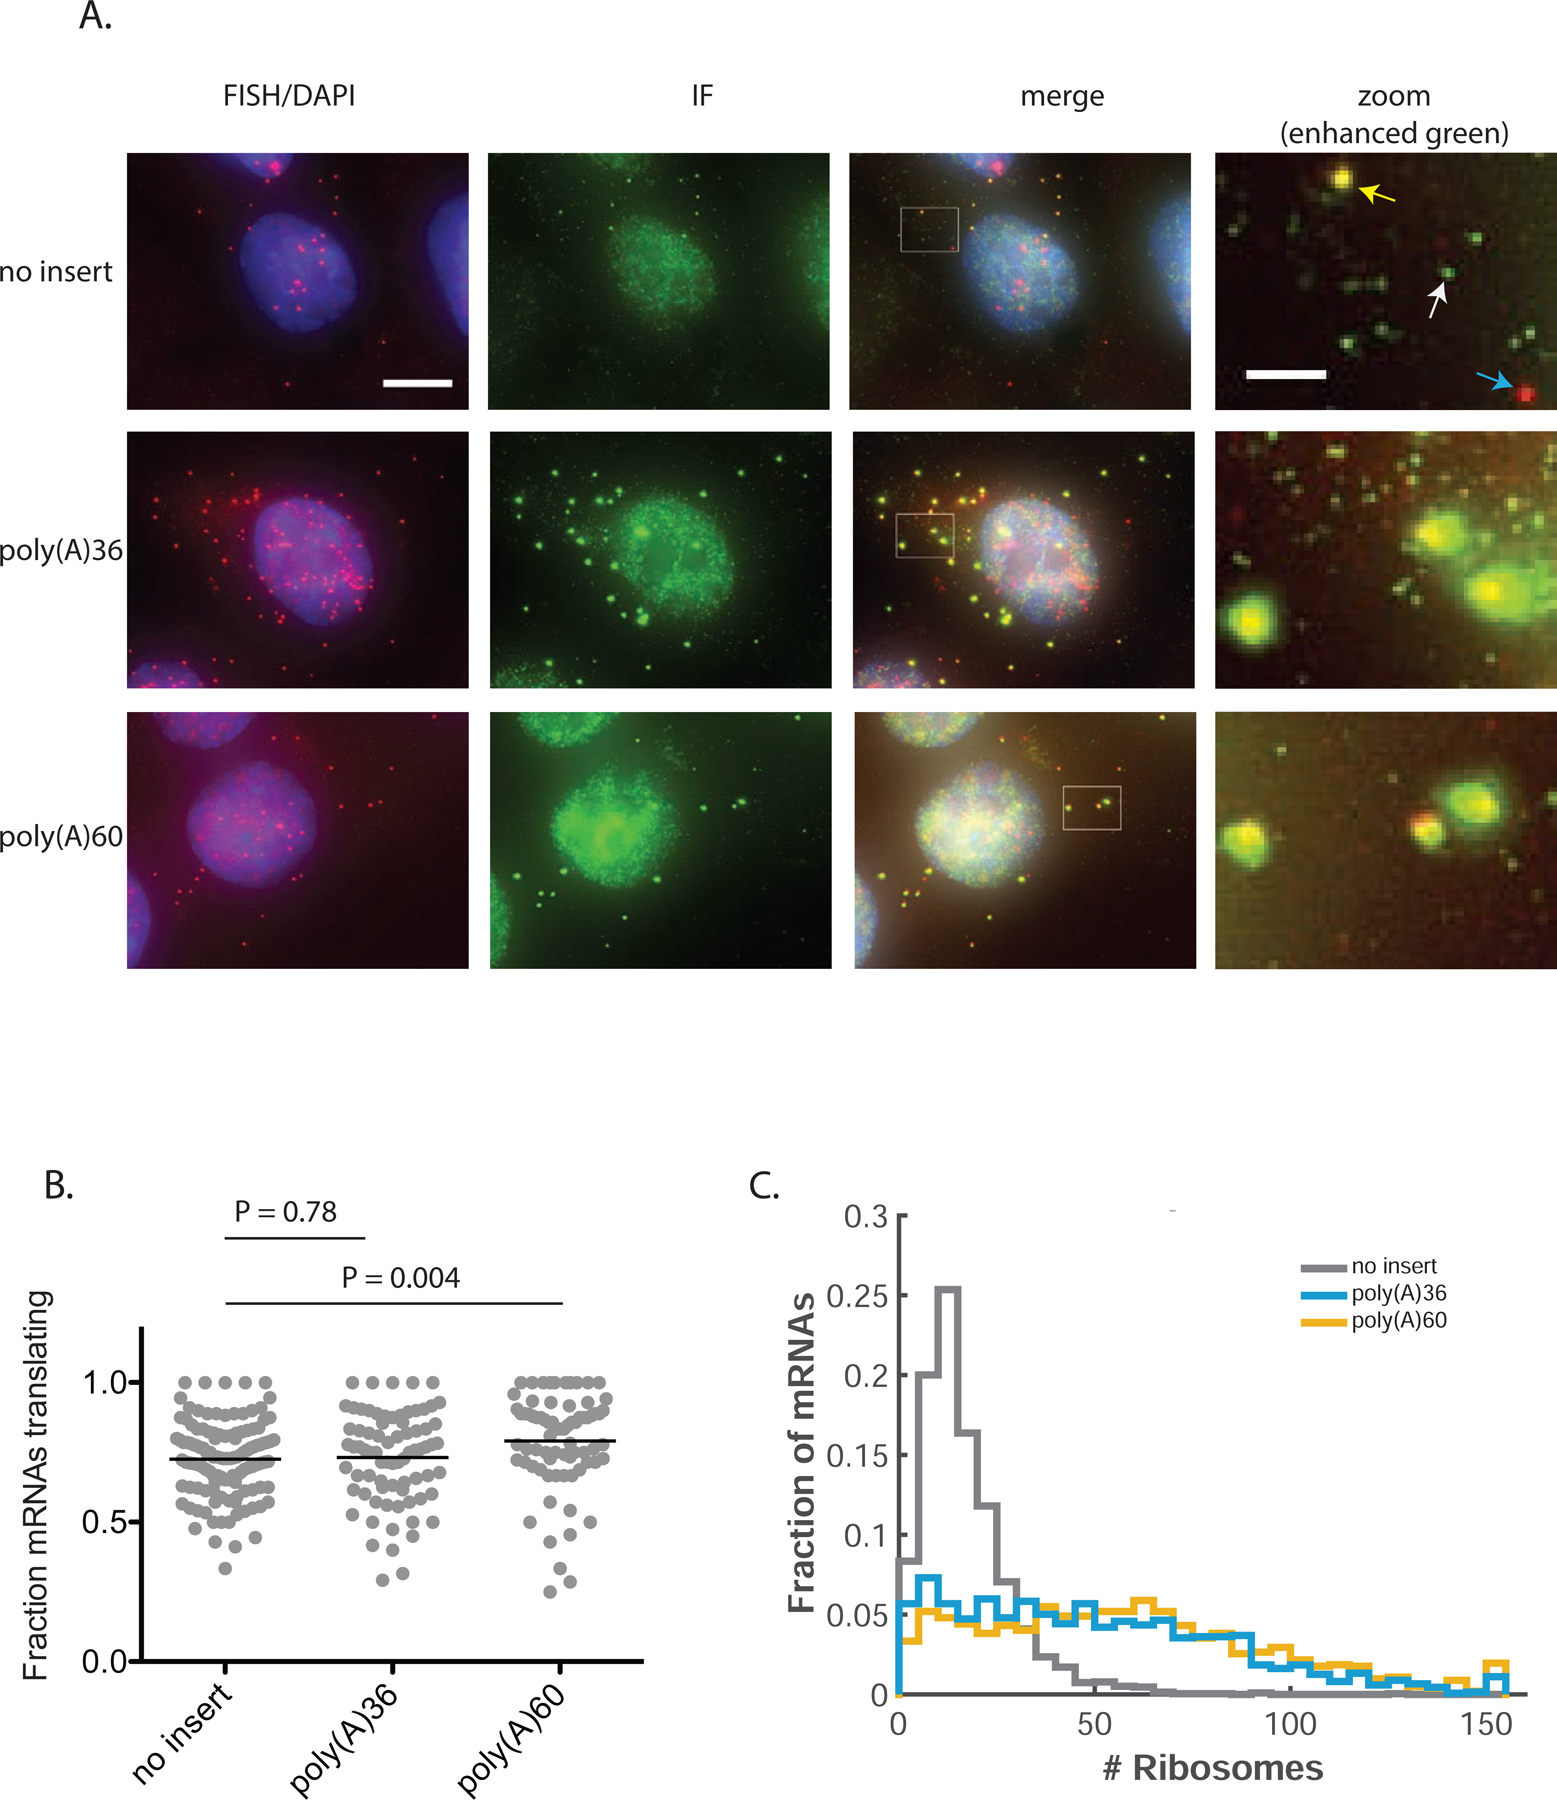
Poly(A) reporters have increased ribosome load relative to no insert. (A) Example cells from smFISH-IF experiment. Red spots that do not colocalize with green reflect un-translating mRNAs (blue arrow in top right panel), red spots that colocalize with green reflect translating mRNAs (yellow arrow), and dim green spots that do not colocalize with red reflect fully-synthesized and released polypeptides (white arrow). Spot intensity is directly comparable among these images. Note that these images are 2-D projections of a 3-D stack of images, and thus mRNAs located above or below the nucleus appear as if they are within the nucleus. White boxes drawn on “merge” images indicate zoom regions for right-most panels. Scale bar in top left image: 10 microns. Scale bar in top right image: 2 microns. (B) Fraction of mRNAs actively translating (calculated only for cells with more than 5 mRNAs). Each dot represents one cell, black lines indicate mean. p-values calculated by two-sample t-test. (C) Quantification of number of ribosomes per mRNA. Data compiled from two independent experiments. mRNAs calculated to have >150 ribosomes are included in the right-most bin. 110–134 cells, 1020–2169 mRNAs per condition. p-value for comparison of no insert to poly(A)36: < 1 × 10−100; p-value for comparison of no insert to poly(A)60: < 1 × 10−100. p-values calculated by two-sample t-test after correction of distribution skewness (STAR methods). See also Figure S3.
To ascertain the number of ribosomes associated with each mRNA, we first quantify the intensity of single SunTag polypeptides and translating mRNAs in the green channel. Single SunTag proteins are detected using the FISH-Quant program (Mueller et al., 2013) as diffraction limited spots. The translation sites (green spots colocalized with mRNA) are fit by a 3D-Gaussian function with both amplitude and beam waist as free parameters. The integrated intensity of the Gaussian is used to determine the total fluorescence intensity of translation site. Importantly, the distributions of single polypeptide intensities are similar across all three samples, indicating that imaging and labeling conditions are comparable (Figure S3C). To estimate the number of nascent peptides associated with each translating mRNA, we divided the fluorescence intensity of each translation site by the average intensity of a single polypeptide. Because the SunTag epitopes are located at the 5’-end of ORF—and thus ribosomes translating in this region will generate a signal less than that of a fully-synthesized polypeptide—the calculated number of nascent polypeptides underestimates the number of ribosomes associated with an mRNA. To correct this discrepancy, we assume a uniform distribution of ribosomes along the mRNA and scale the number of nascent polypeptides by a factor (~1.3) to account for the length of the SunTag sequence and its position within the ORF (STAR Methods).
Quantification of ribosome load by this method reveals that while no insert mRNA is occupied by an average of 17 ribosomes, poly(A)36 and poly(A)60 are occupied by an average of 50 and 58 ribosomes, respectively, indicating queues of tens of stalled ribosomes extending far upstream of the poly(A) sequence (Figure 2C, S3D). The average ribosome load on no insert reflects a density of one ribosome for every ~75 codons, approximately 7.5-fold below the maximum packing density assuming a ribosome footprint of 10 codons (Wolin and Walter, 1988). In contrast, the average density on poly(A)60 is one ribosome for every ~20 codons, only 2-fold below the maximum density. The slight decrease in ribosome load on poly(A)36 relative to poly(A)60 is consistent with the respective increase in luciferase output (Figure 1B) and indicates that slightly more ribosomes are able to read through the shorter poly(A)36 sequence and terminate at the stop codon. We note that a small fraction of mRNAs (3% of poly(A)36 and 4% of poly(A)60) have a calculated occupancy greater than the theoretical maximum of 127 ribosomes. This apparent overloading likely indicates that in certain cases, our assumption of uniform ribosome density along the mRNA is unrealistic. Specifically, on mRNAs with especially long queues, most ribosomes stall near the 3’ end of the ORF, harboring fully-synthesized SunTag arrays. On these mRNAs, scaling the intensity to account for partially synthesized SunTag polypeptides is an overcorrection and thus exaggerates the number of ribosomes. For such mRNAs, the ribosome occupancy is more accurately represented by the unscaled number of SunTag polypeptides. In the absence of scaling, overloaded mRNAs are reduced to ~1%, and the relative differences in occupancy of no insert, poly(A)36 and poly(A)60 are unchanged (Figure S3E).
Ribosome rescue is slow compared to normal elongation and termination
Because the ORF length upstream of poly(A) is identical to the ORF length of no insert mRNA, the accumulation of ribosomes on poly(A) reporters suggests that rescue of stalled ribosomes is slow compared to normal termination at a stop codon. To determine if this is the case, we monitored translation ramp-down events observed during live-cell imaging (for examples, see Figure 1D, starting at ~25 min and ~55 min; also, see Figure 1E, starting at ~25 min and ~85 min). During these ramp-down events, mRNAs initially translating at steady-state are cleared of ribosomes, either by elongation and termination (for the no insert reporter), or by elongation and ribosome rescue (for the poly(A) reporters). If rescue of ribosomes stalled at poly(A) is slow, translational ramp-down should take longer on the poly(A) reporters than on no insert. Indeed, we find that translation ramp-down on poly(A)60 is slower than on no insert, as measured by the time between steady-state translation (the plateau) and complete shut-down (Figure S4A). These data suggest that ribosome clearance from poly(A)60 is limited by the rate of ribosome rescue.
To synchronize translation shut down in a well-defined manner, we performed live-cell imaging after addition of the drug harringtonine, which permits initiation but blocks formation of the first peptide bond during translation (Fresno et al., 1977). Upon treatment with harringtonine, all newly initiated ribosomes are prevented from elongating through the mRNA (remaining bound at the initiation site), while actively elongating ribosomes are able to finish translating (Ingolia et al., 2011). This strategy allows us to synchronize mRNA clearance at the time of drug application and to observe ribosome elongation and termination (or rescue) in real time. In general, treatment with harringtonine resulted in a gradual loss of green fluorescence (Figure 3A, movies S3–S5). Inspection of individual molecules reveals that loss of signal proceeds more slowly on the poly(A) reporters than on no insert (Figure 3A–C). This delay is consistent with the slower translational ramp-down observed on poly(A)60 during steady-state (no drug) experiments (Figure S4A).
Fig. 3.
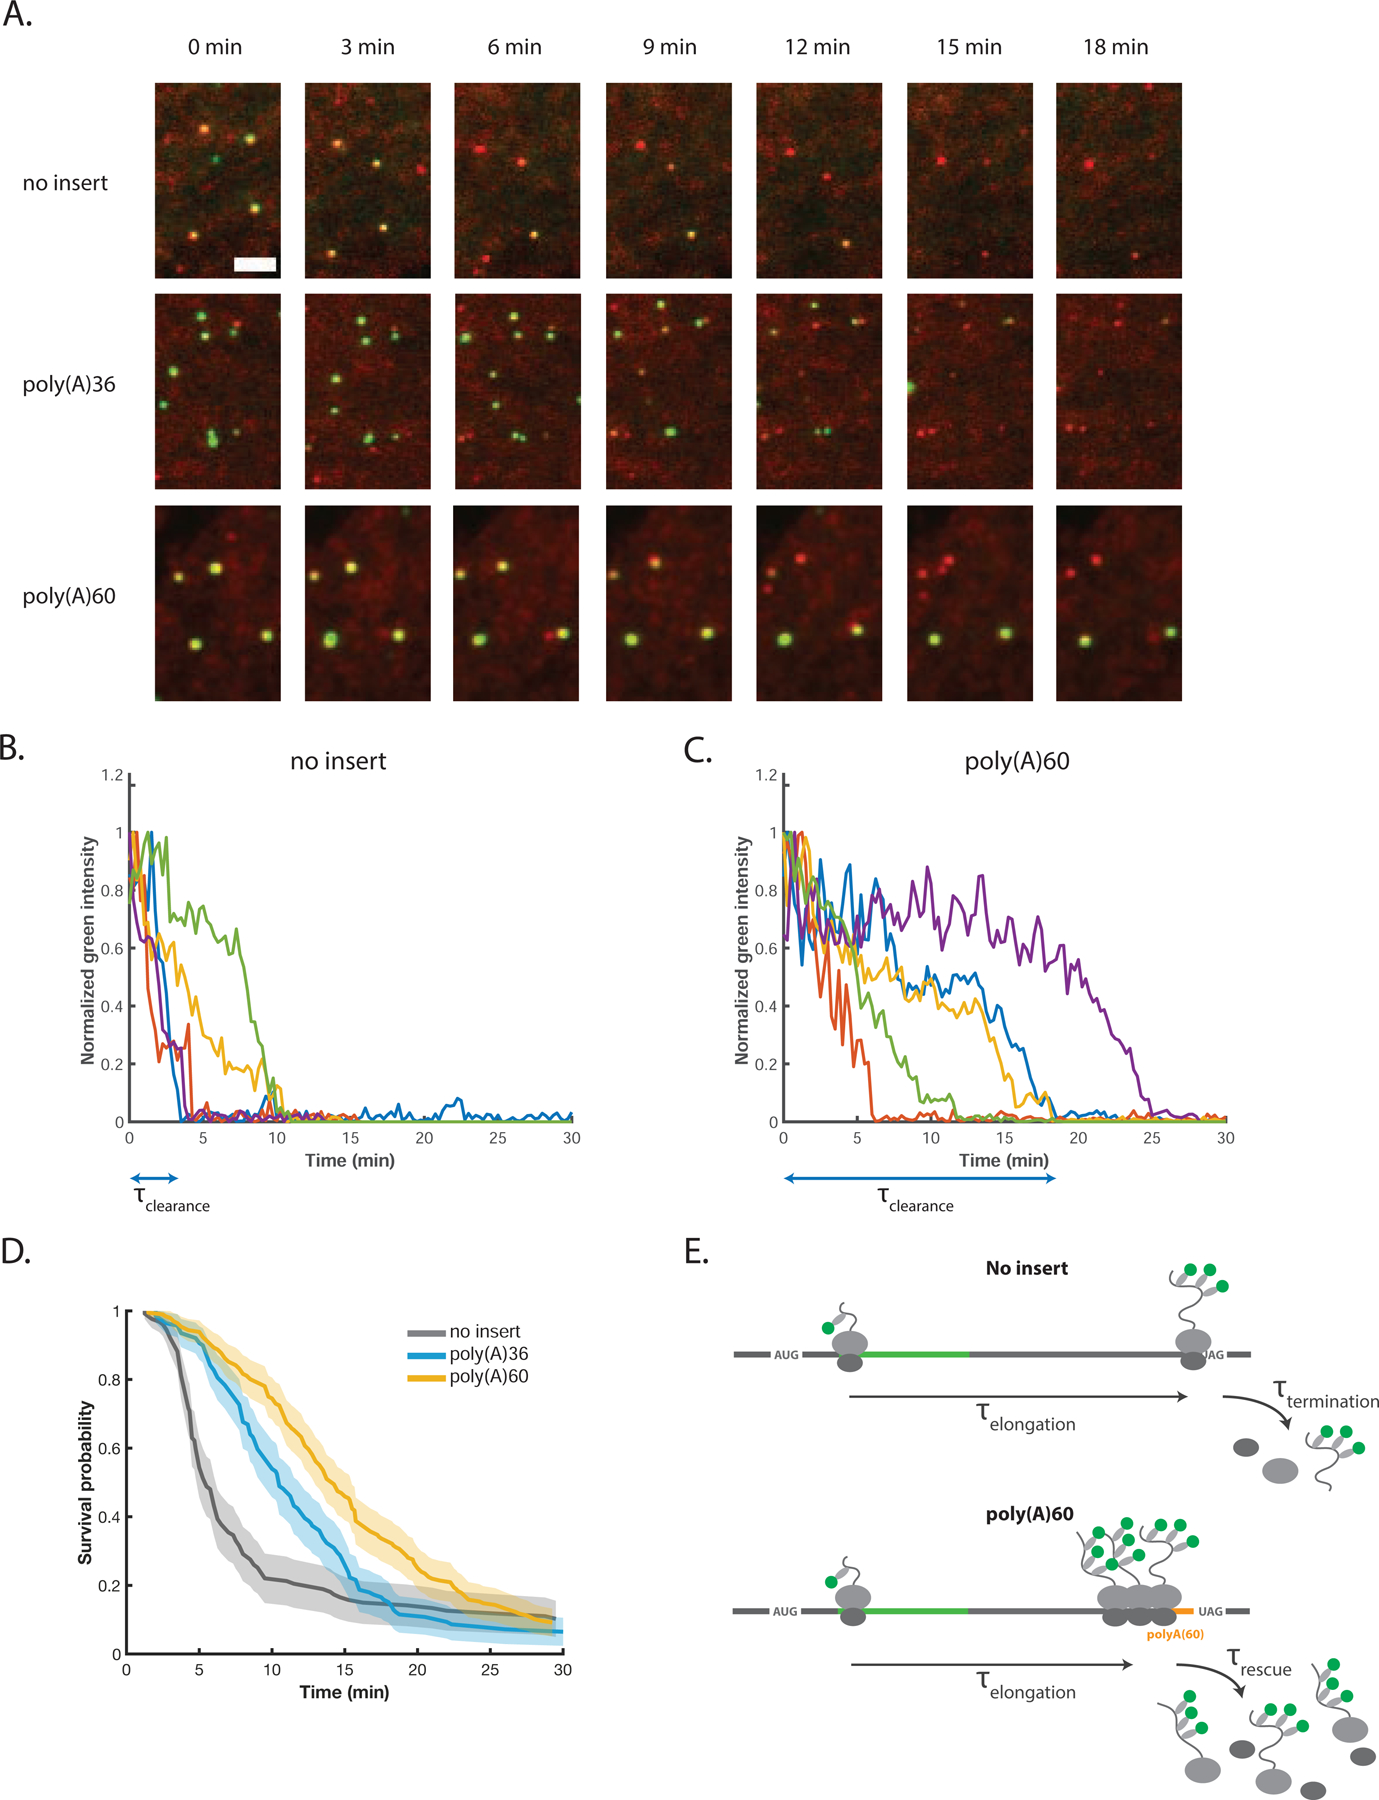
Ribosome clearance is delayed on poly(A) mRNAs. (A) Snapshots from movies at indicated post-harringtonine timepoints. Scale bar in top left image: 3 microns. (B) Example traces of green intensity over time for single no insert mRNAs post-harringtonine treatment. The signal for each molecule is normalized to its maximum intensity. Blue double arrow below the x-axis indicates τclearance for the blue example trace. (C) Same as (B), for poly(A)60 reporter. (D) Cumulative survival probability of green signal on mRNAs post-harringtonine treatment. The earliest timepoint of each curve denotes the time of the first clearance event. Shaded area represents 95% confidence bounds computed using Greenwood’s formula. 8–11 cells, 127–199 mRNAs per condition. (E) Cartoon illustrating the kinetic steps comprising τclearance,no insert (top) and τclearance,poly(A) (bottom). τclearance,no incert = τelongation + τtermination, while τcSearance,poly(A) = τelongation + τrescue. See also Figure S4.
For each mRNA, we measured the time between harringtonine addition and complete loss of green fluorescence (τclearance), corresponding to removal of the final ribosome (for examples of τclearance determination, see blue double arrows in Figures 3B and 3C). To determine the distribution of clearance times, we generated a cumulative survival distribution of τclearance (Figure 3D). For no insert, survival probability drops sharply around a median time of ~5.5 min, consistent with the expected time for a ribosome near the 5’-end of the mRNA to elongate an ORF of this length (1253 codons at 3.5–5.6 codons/s is 3.7–6.0 min) (Ingolia et al., 2011; Wu et al., 2016; Yan et al., 2016). By comparison, loss of green signal is markedly delayed for poly(A)36 and poly(A)60, with a median clearance time ~5 and ~8 min longer than no insert, respectively. Faster τrescue for poly(A)36 relative to poly(A)60 is consistent with shorter ribosome queues measured by smFISH-IF (Figure 2C). Importantly, control experiments with the drug cycloheximide (CHX) indicate that signal loss principally reflects ribosome clearance, as opposed to photobleaching or other artifacts (Figure S4B and S4C). Additionally, experiments performed in the absence of auxin demonstrate that our measurements are not convoluted by the AID system (Figure S4D). The distribution of τclearance for all reporters reflects the stochasticity of underlying processes, including, for example, the location of the 5’-most ribosome. As seen from the non-zero baseline of the survival curves, ~10% of mRNAs do not clear within the 30 min experimental time window for both no insert and poly(A) constructs; although we are unsure why these mRNAs fail to clear, this observation is consistent with previous reports (Yan et al., 2016).
To estimate the time to rescue a queue of stalled ribosomes (τrescue), we considered the difference in τclearance between the no insert and poly(A) reporters. For no insert, τclearance reflects the time for the 5’-most ribosome to elongate and terminate at the stop codon (τclearance,no insert = τelongation + τtermination). For the poly(A) reporters, we assume that the delay in τclearance reflects the time required to rescue stalled ribosomes from the queue and not for ribosomes to read-through the poly(A) sequence. This assumption is supported by our luciferase data, indicating that the majority of ribosomes on the poly(A) reporters are rescued from the mRNA, and their nascent peptides degraded (Figure 1B). In our estimate, we also assume that the time for a ribosome to terminate at the stop codon is small compared to the total time required to elongate the 1253-codon ORF (τtermination ≪ τelongation, and thus τclearance,no insert ≈ τelongation). This assumption is supported by the relative peak heights of ribosome footprinting data at stop codons compared to sense codons, which indicate that termination is at most 10-fold slower than elongation of an average codon (i.e. an upper limit for τtermination is ~3 s) (Ingolia et al., 2011; Mills et al., 2016). Thus, for the poly(A) reporters, τclearance,poly(A) = τelongation + τrescue (Figure 3E). Because the ORF upstream of poly(A) is identical to the ORF of the no insert reporter (both 1253 codons), τclearance,poly(A) ≈ τclearance,no insert + τrescue and thus τrescue ≈ τclearance,poly(A) − τclearance,no insert. Using median values for this calculation, τrescue ≈ 5 min for poly(A)36 and τrescue ≈ 8 min for poly(A)60.
Ribosome queue length impacts RQC efficiency
Previous work has demonstrated that attenuating translation initiation allows a greater fraction of ribosomes to read through a stalling sequence, presumably by decreasing the frequency of collisions (Juszkiewicz et al., 2018; Park and Subramaniam, 2019; Simms et al., 2017). However, the relationship between ribosome queue length and RQC efficiency has not been established. Since the poly(A) reporters used thus far in our study are robustly targeted for quality control, we sought to reduce ribosome load by decreasing the initiation rate. Accordingly, we introduced the 5’UTR of the human gene ATF4 into our reporter constructs (“ATF4-no insert” and “ATF4-poly(A)60”), as it is known to suppress translation initiation on the main ORF through a series of upstream open reading frames (uORFs) (Vattem and Wek, 2004). As anticipated, the ATF4 5’UTR confers a ~30-fold reduction in luciferase activity on the no insert reporter, consistent with a substantial decrease in initiation on the SunTag ORF (Figure 4A). In line with previous work, relative protein output increased ~3-fold on the ATF4-poly(A)60 compared to poly(A)60, indicating substantially decreased RQC efficiency in the context of suppressed initiation (Figure 4B).
Fig. 4.
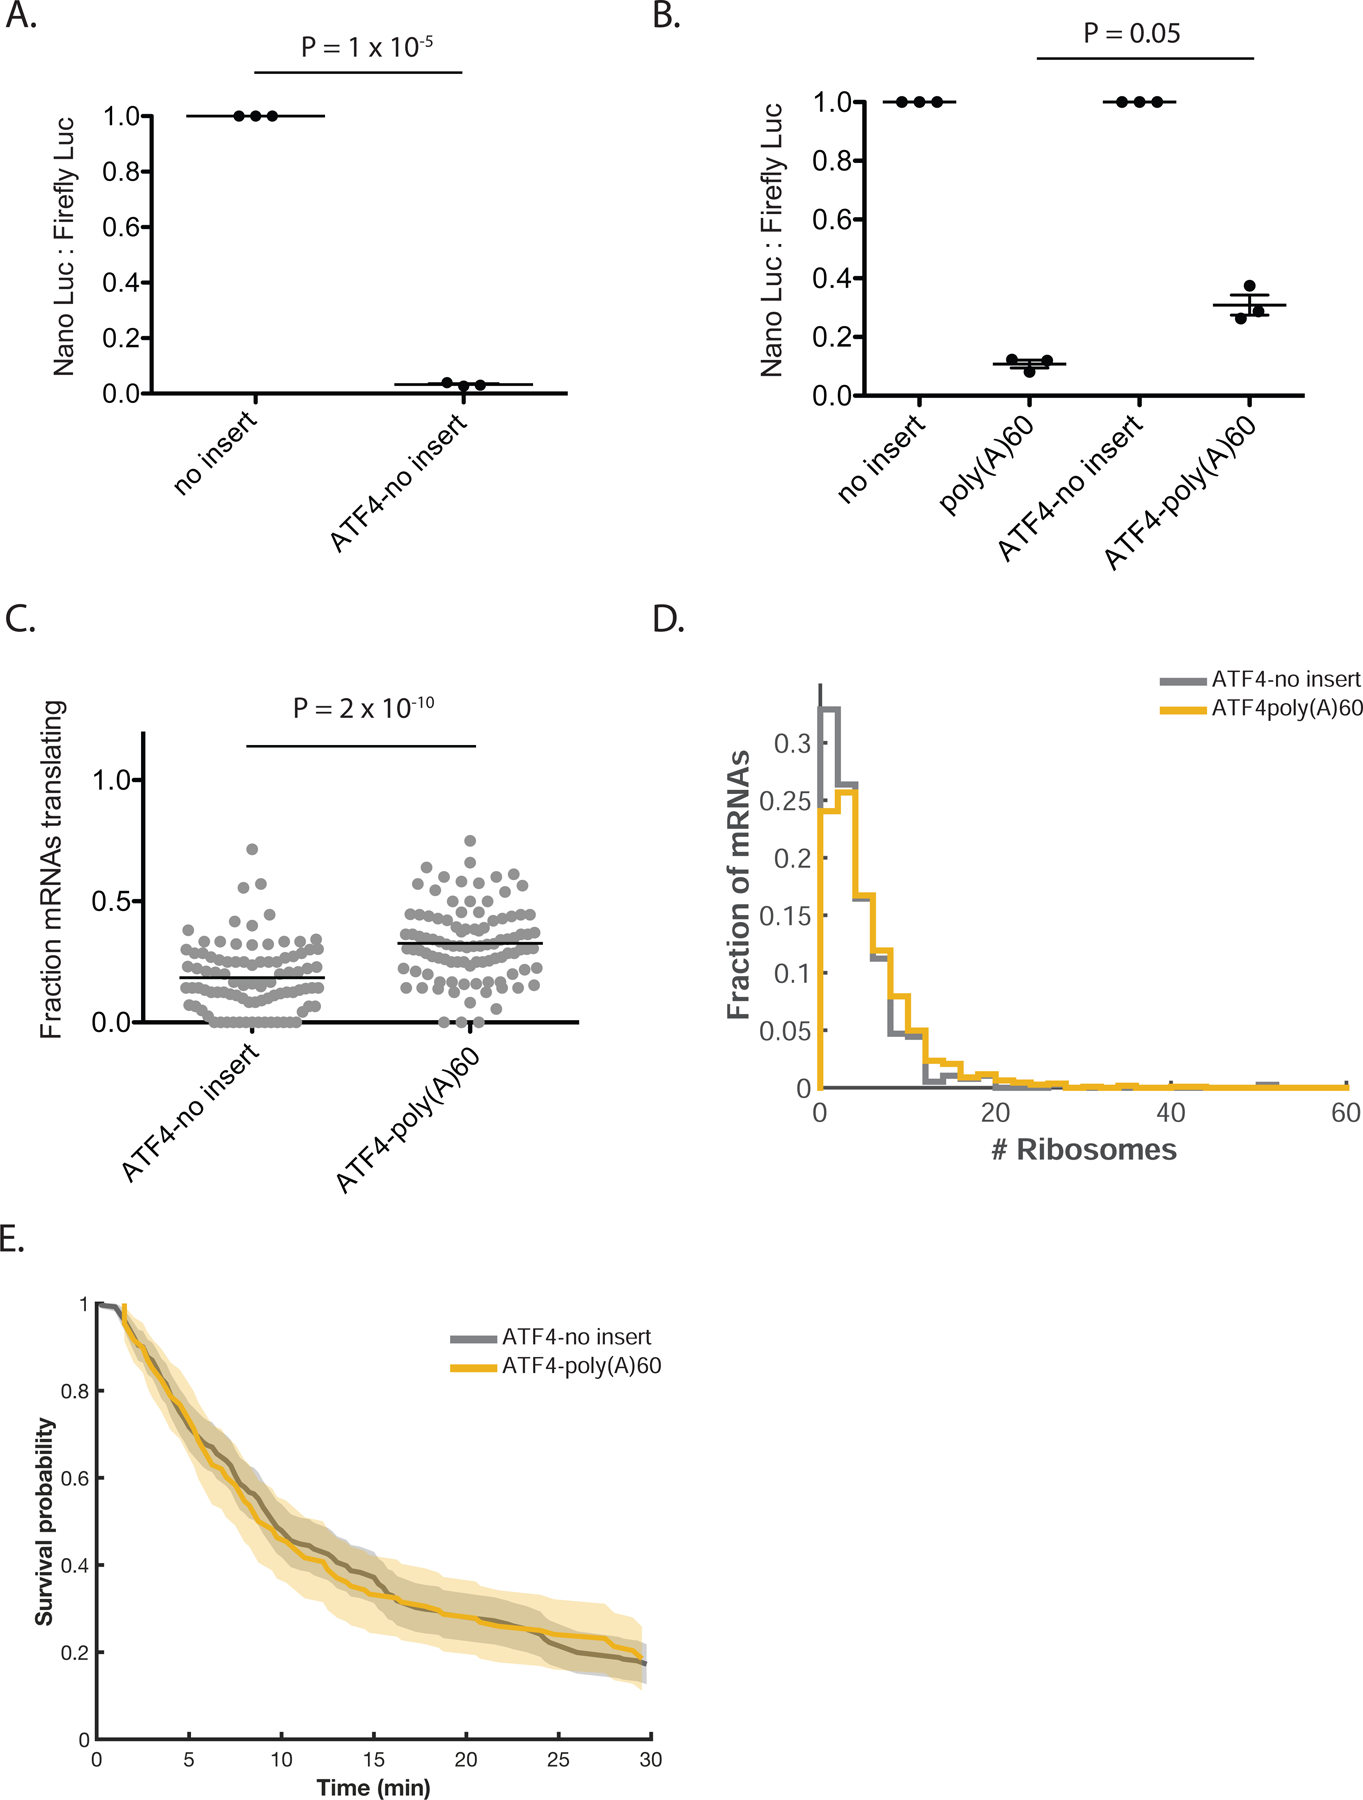
RQC efficiency depends on the number of stalled ribosomes. (A) Luciferase assay to measure the effect of ATF4 5’UTR on protein output of the no insert reporter. NLuc signal is normalized to Firefly Luciferase signal from a co-transfected plasmid and the resulting ratios are normalized to the no insert reporter. Bars represent mean +/− SEM. (B) Luciferase assay to measure the effect of ATF4 5’UTR on RQC efficiency. NLuc signal is normalized to Firefly Luciferase signal from a co-transfected plasmid and the resulting ratios are normalized to the no insert reporter within each 5’UTR context. Bars represent mean +/− SEM. (C) Fraction of mRNAs actively translating on ATF4 reporters (calculated only for cells with more than 5 mRNAs). Each dot represents one cell, black lines indicate mean. p-value calculated by two-sample t-test. (D) Quantification of number of ribosomes per mRNA on ATF4 reporters. Mean number of ribosomes on ATF4-no insert: 4.4. Mean number of ribosomes on ATF4-poly(A)60: 5.6. Data compiled from two independent experiments. No insert: 160 cells, 383 mRNAs. Poly(A)60: 135 cells, 1106 mRNAs. p-value for comparison of no insert to poly(A)60: 1 × 10⁻⁵. p-value calculated by two-sample t-test after correction of distribution skewness (see supplemental text for details). (E) Cumulative survival probability of green signal on ATF4-containing reporter mRNAs post-harringtonine treatment. Shaded area represents 95% confidence bounds computed using Greenwood’s formula. ATF4-no insert: 10 cells, 261 mRNAs. ATF4-poly(A)60: 6 cells, 108 mRNAs.
Measured by smFISH-IF, both ATF4 reporters have a reduced fraction of mRNAs associated with ribosomes (Figure 4C; compare to Figure 2B) and decreased ribosome occupancy (Figure 4D) relative to non-ATF4 reporters, consistent with inhibition of translation initiation. Furthermore, ribosome occupancy on ATF4-no insert and ATF4-poly(A)60 is similar, with ATF4-poly(A)60 occupied by only ~1 additional ribosome (Figure 4D). The lack of substantial ribosome build-up on ATF4-poly(A)60 suggests that initiation is slow enough in the ATF4 context to preclude the formation of long queues of collided ribosomes. This observation also implies that τclearance is similar on ATF4-no insert and ATF4-poly(A)60 (since a clearance delay is what causes ribosome build-up). Indeed, harringtonine runoff experiments revealed a similar τclearance for these constructs, suggesting that the total time to clear far fewer ribosomes (there are ~10-fold fewer ribosomes on ATF4-poly(A)60 than on poly(A)60) is fast compared to the elongation time for the 5’-most ribosome to elongate through the mRNA (Figure 4E; movies S6 and S7). Surprisingly, τclearance is substantially delayed on ATF4-no insert compared to no insert (compare Figure 4E to Figure 3D); we are unsure of the reason for this delay. Together, our data with ATF4-based reporters suggest that the rate of translation initiation modulates RQC efficiency by decreasing queue length.
ZNF598 accelerates clearance of stalled ribosomes
While it is known that ZNF598 impacts the ability of ribosomes to read through a stall sequence, it is unclear how it affects the dynamics of ribosome rescue. Upon ZNF598 depletion using siRNAs (Figure S5A), we find a small but reproducible increase in NLuc signal from poly(A)60 relative to no insert upon ZNF598 depletion, broadly consistent with increased readthrough observed previously (Figure 5A) (Juszkiewicz and Hegde, 2017). In harringtonine runoff experiments, τclearance of poly(A)60 increases by ~14 min, while τclearance of no insert is unaffected (Figure 5B, movies S8–S11). The long delay in τclearance combined with the relatively small increase in luciferase signal (an increase from ~9% of no insert to ~15% of no insert) on poly(A)60 under ZNF598 depletion indicates that most ribosomes are still rescued from the mRNA under these conditions, but that the rate of clearance is greatly diminished. In contrast, τclearance on ATF4-poly(A)60 is not substantially affected by ZNF598 knock-down, underscoring the importance of collisions for recognition by the quality control machinery (Figure S5B). Given the observed delay in ribosome clearance, we predicted that ZNF598 depletion should also cause increased accumulation of stalled ribosomes on poly(A)60. Consistent with this prediction, smFISH-IF measurements indicate a modest increase in ribosome load on poly(A)60 under ZNF598 depletion conditions, while ribosome load is insensitive to ZNF598 levels on no insert mRNA (Figure 5C and 5D, S5C–E). Together, our results indicate that ZNF598 accelerates clearance of ribosomes from the mRNA.
Fig. 5.
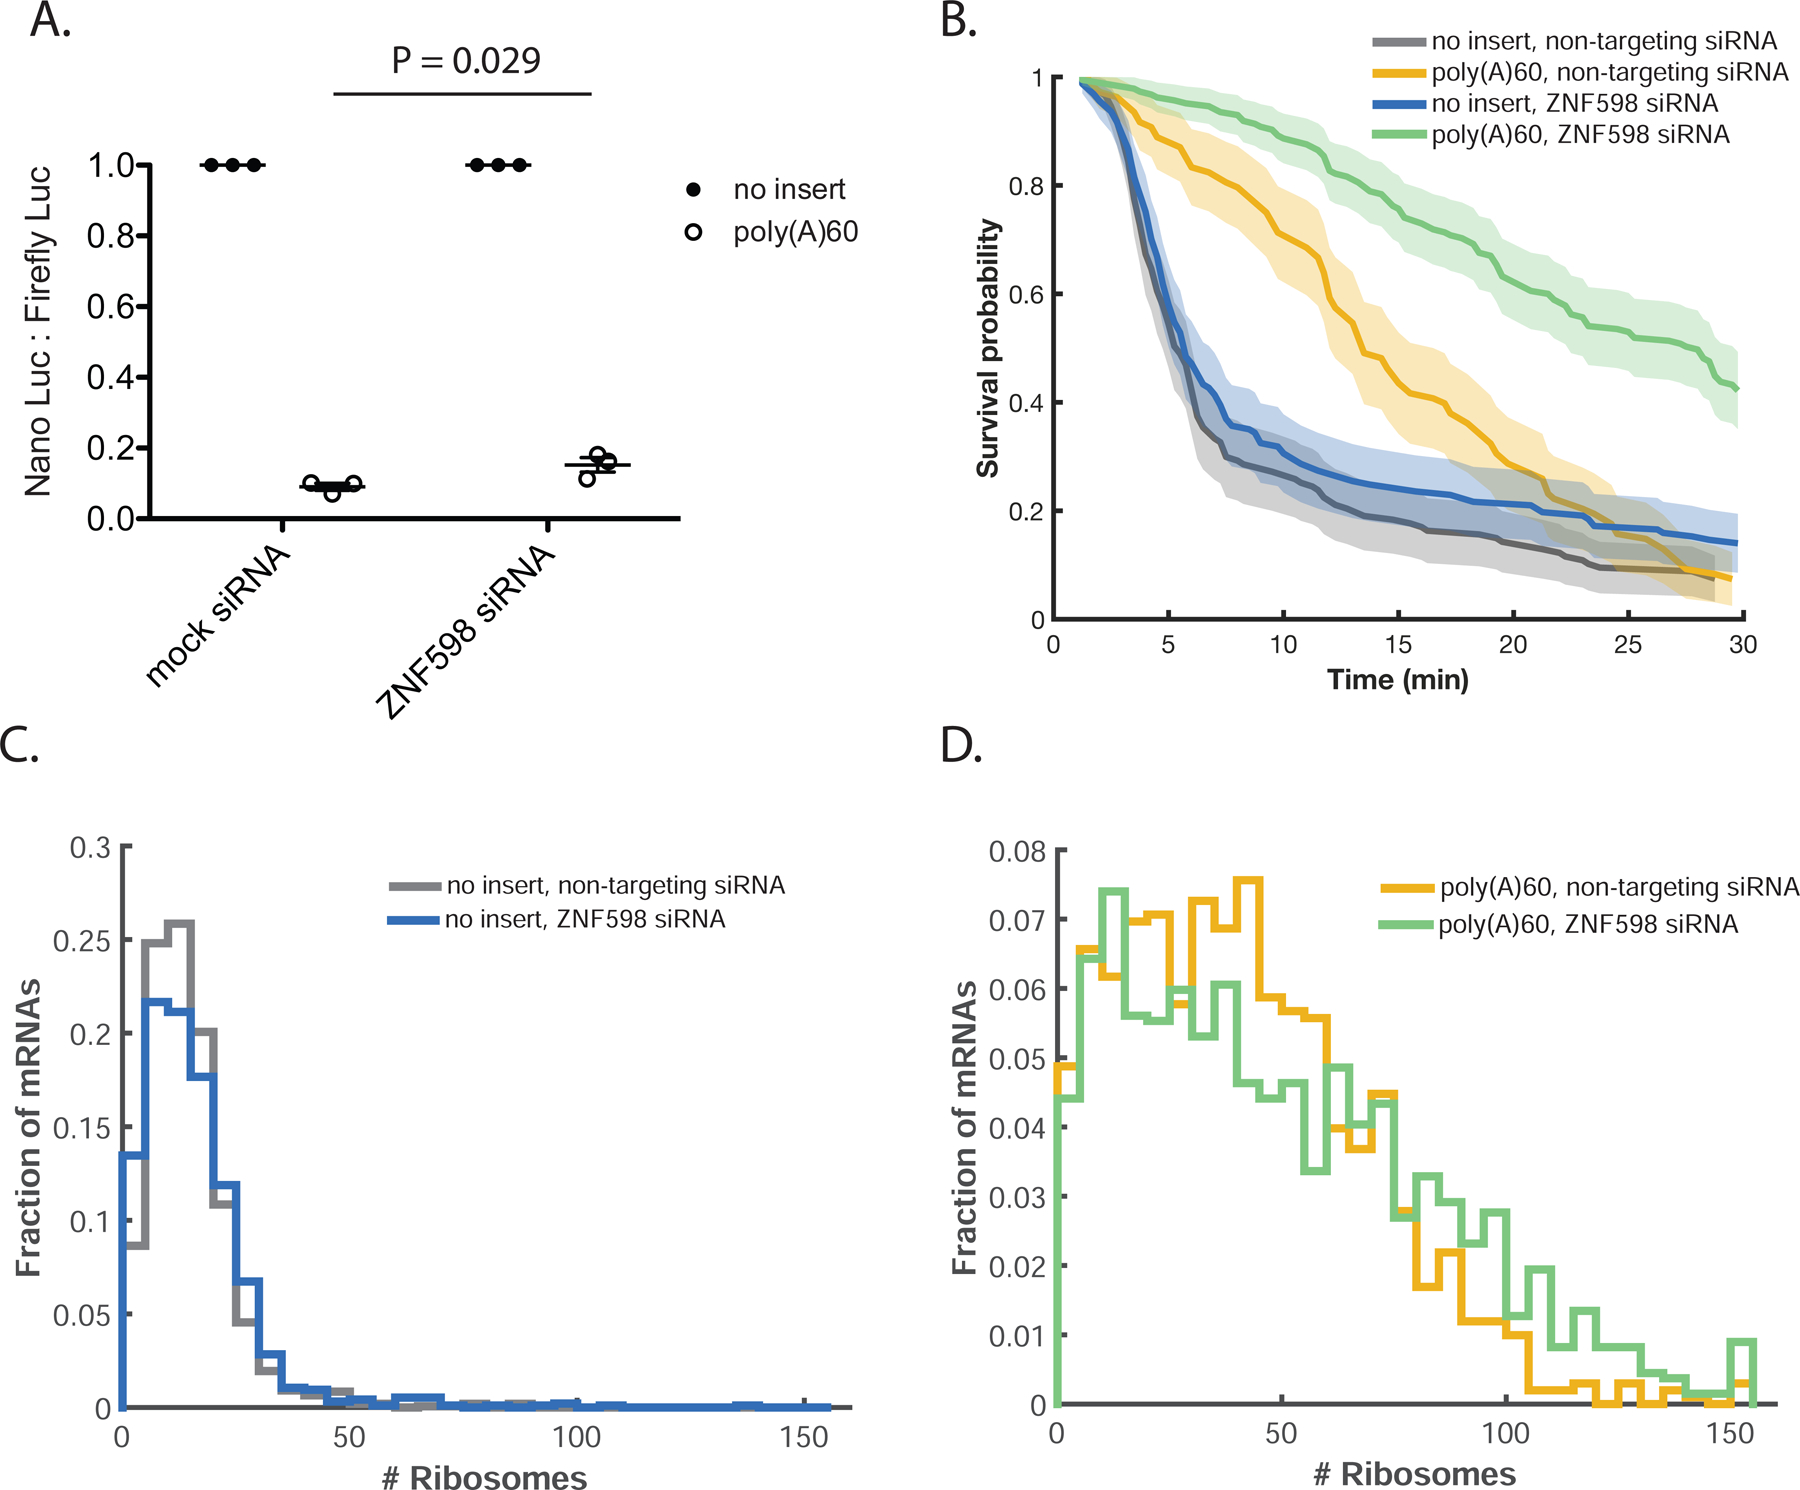
ZNF598 knock-down further delays rescue of stalled ribosomes. (A) Luciferase assay to measure reporter protein output under ZNF598 depletion conditions. NLuc signal is normalized to Firefly Luciferase signal from a co-transfected plasmid and the resulting ratio is normalized to no insert within each siRNA condition. Bars represent mean +/− SEM. (B) Cumulative survival probability for harringtonine runoff experiment under ZNF598 depletion conditions. Shaded area represents 95% confidence bounds computed using Greenwood’s formula. 7 cells, 108–185 mRNAs per condition. (C and D) FISH-IF measurement of number of ribosomes on (C) no insert under non-targeting siRNA (mean: 15 ribosomes) or ZNF598-targeting siRNA (mean: 16 ribosomes) conditions (D) poly(A)60 under non-targeting siRNA (mean: 42 ribosomes) or ZNF598-targeting siRNA (mean: 50 ribosomes) conditions. Data compiled from two independent experiments. mRNAs calculated to have >150 ribosomes are included in the right-most bin. 82–124 cells, 951–1540 mRNAs per condition. p-value for comparison of no insert, non-targeting siRNA to no insert, ZNF598 siRNA: 0.25; p-value for comparison of poly(A)60, non-targeting siRNA to poly(A)60 ZNF598 siRNA: 2.1 × 10⁻⁶. p-values calculated by two-sample t-test after correction of distribution skewness (see supplemental text for details). See also Figure S5.
DISCUSSION
Cellular recognition of stalled ribosomes and the ensuing quality control response is critical to prevent proteotoxic stress (Choe et al., 2016; Chu et al., 2009; Ishimura et al., 2014). While recent work has delineated many of the biochemical steps and protein factors involved in recognition and removal of collided ribosomes and degradation of the nascent polypeptide, key regulatory principles have remained unclear. We find that ribosome stalling on poly(A)60 generates queues comprising tens of collided ribosomes that take ~8 min to be resolved by the quality control machinery. Given that ASCC3 is thought to preferentially target the 3’-most ribosome for rescue (Juszkiewicz et al., 2020; Matsuo et al., 2020), removing only one ribosome at a time, we estimate the rate of individual ribosome rescue events by dividing the average number of ribosomes on a poly(A)60 mRNA by τrescue, resulting in an estimate of ~0.12 ribosomes/s (or ~8 s to rescue each ribosome). The observation that ribosome rescue is very slow compared to both normal elongation (3.5–5.6 codons/s) and termination (lower limit of ~0.35 s−1; estimate provided in the main text) provides a potential basis for the cell to distinguish between innocuous and deleterious collisions: Transient collisions involving actively elongating ribosomes are likely to resolve within seconds, evading detection by the quality control machinery, while persistent collisions are targeted by the quality control machinery.
Our kinetic measurements have important implications for understanding which translation events are recognized as aberrant by the cell. In a recently proposed model, Juszkiewicz et al. use the global average inter-ribosome distance (~66 codons) and elongation rate (~6 codons/s) to estimate how slow a ribosome must elongate to cause a collision (Juszkiewicz et al., 2018). Their calculations suggest that a modest slow-down of elongation to ~1 codon/s within any 10 codon window would cause a collision and qualify as aberrant translation. However, our data establish that the rate-limiting step for ribosome rescue is not the formation of the collision itself, but rather cellular targeting of the collision for quality control. This slow step allows the cell to selectively target long-lasting collisions, while transient collisions resolve on their own (Figure 6A). This selectivity is especially important given the recent finding that collisions are ubiquitous under normal cellular conditions (Arpat et al., 2020; Han et al., 2020).
Fig. 6.
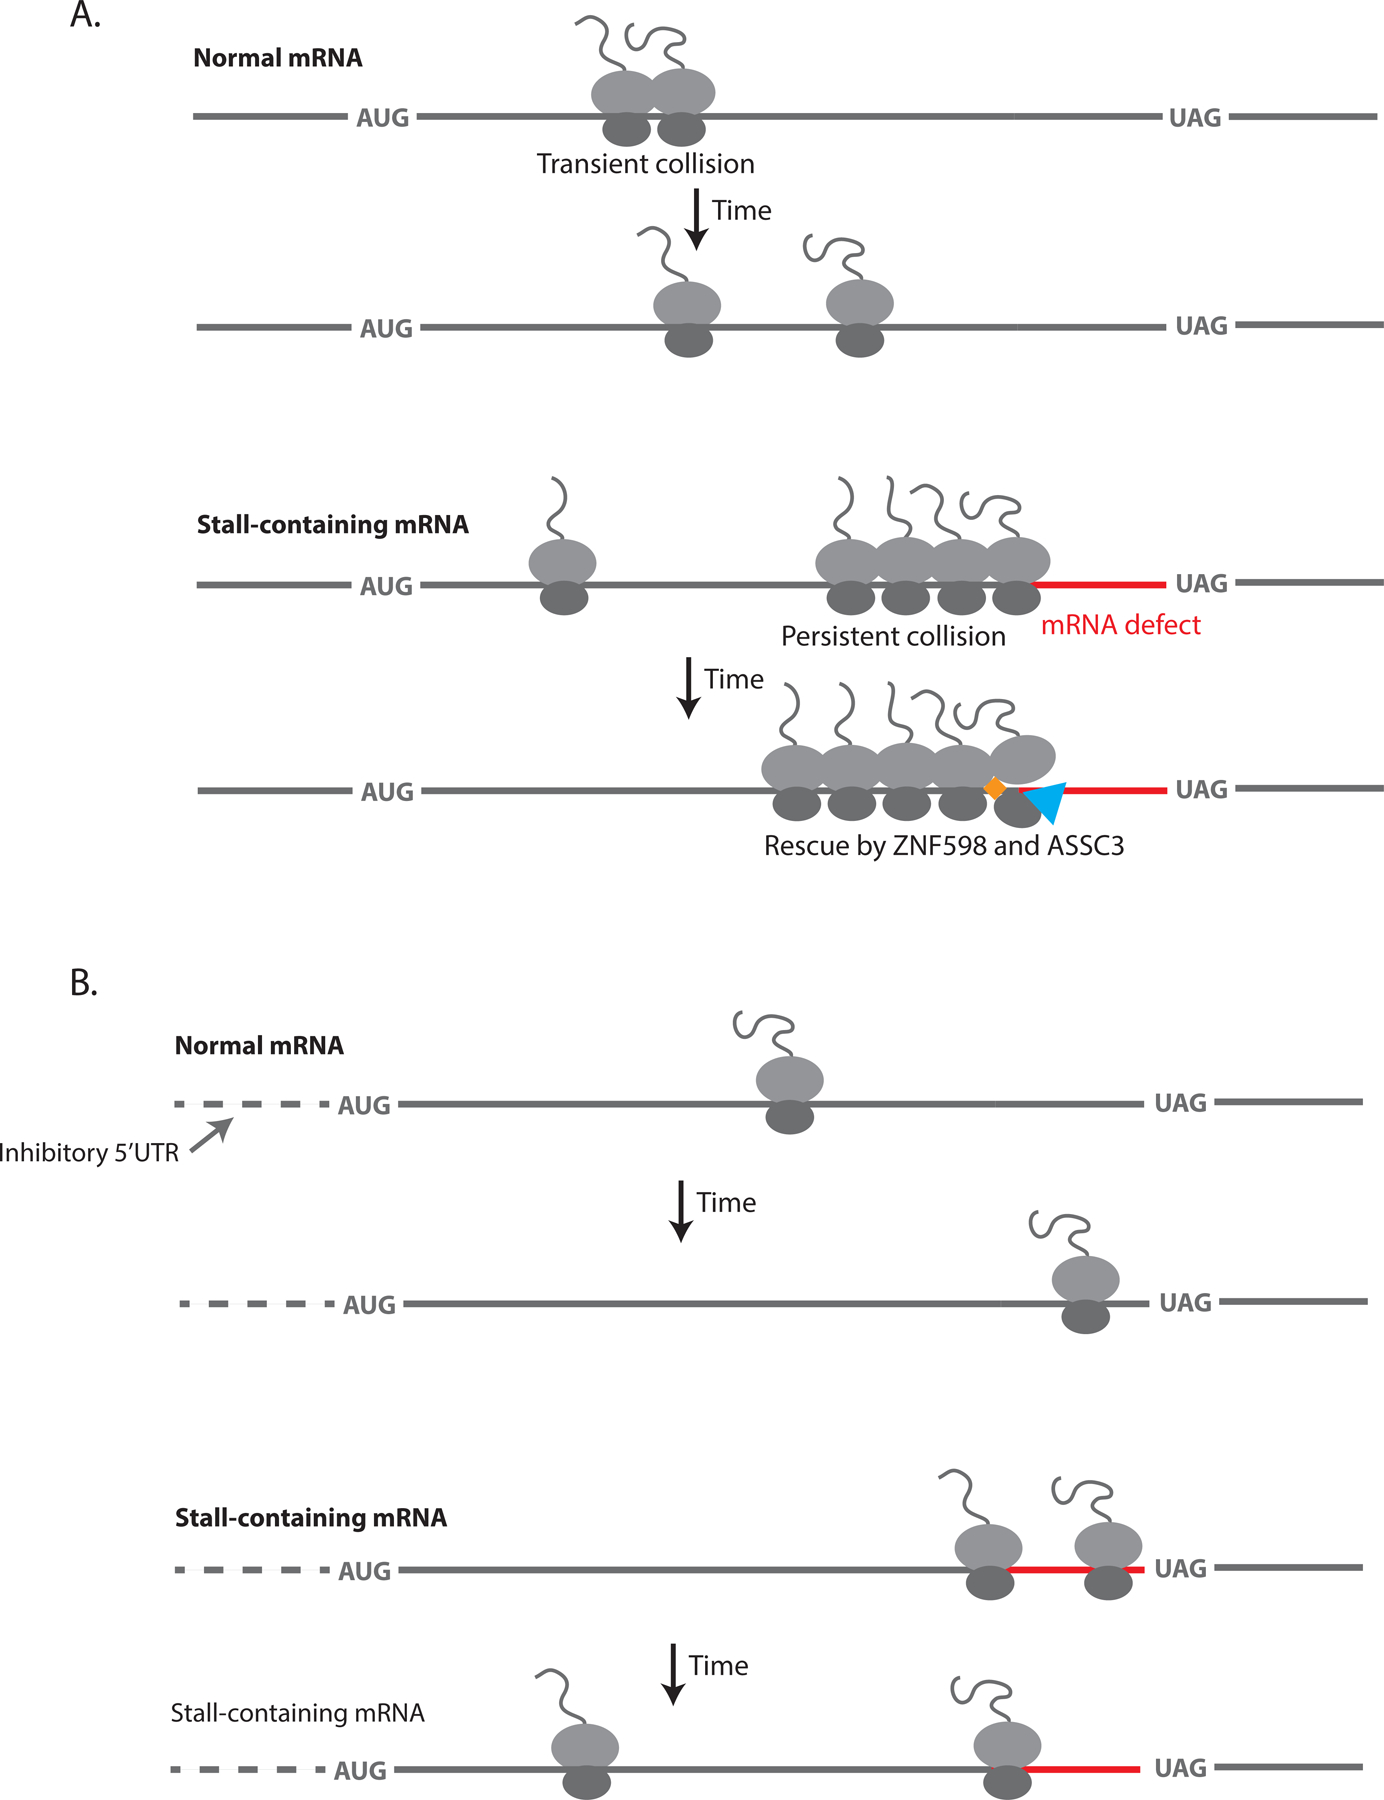
Model for how the timing of ribosome stalling, collision recognition and translation initiation modulate RQC efficiency. (A) Top: A “Normal mRNA” undergoes a transient ribosome collision that resolves on the timescale of normal translation elongation. Bottom: A “Stall-containing mRNA” undergoes persistent ribosome collisions that are not resolved on the timescale of normal elongation and are thus targeted by ZNF598 (orange diamond) and cleared by ASCC3 (blue triangle). (B) Top: A “Normal mRNA” on which translation initiation is suppressed (in this case by an inhibitory 5’UTR indicated by the dashed line) does not experience ribosome collisions because of decreased ribosome load. Bottom: Ribosomes on a “Stall-containing mRNA” with suppressed translation initiation evade quality control by bypassing the stall site before collisions occur.
A comparison of the poly(A)36 and poly(A)60 reporters reveals how pause strength impacts targeting for quality control. Our FISH-IF measurements show that the average number of ribosomes on poly(A)60 is 58, compared with 17 on no insert, indicating that a typical queue comprises tens of ribosomes. By comparison, poly(A)36 harbors fewer ribosomes (50 on average), exhibits a τclearance that is 3 min faster than poly(A)60, and yields higher protein output (17% of no insert for poly(A)36 vs. 11 % of no insert for poly(A)60). Thus, the shorter-lived stall induced by poly(A)36 allows more ribosomes to bypass the stall site and reach the stop codon, decreasing the length of the queue.
In addition to the timing of the pause, the rate of translation initiation also impacts partitioning between RQC and resolution of elongation. Experiments with ATF4 reporters reveal that the initiation context impacts queue length: ribosome queueing is nearly eliminated on the poly(A)60 reporter in ATF4 context and RQC is ~3-fold less efficient. Thus, ribosomes that stall on the poorly-initiated ATF4 mRNA experience collisions less frequently than those on a highly-initiated mRNA, allowing more time to translate through the stall sequence before a collision ensues. In effect, this outcome is analogous to that resulting from the activity of the recently discovered collision sensor EDF1—which represses translation initiation on problematic mRNAs through recruitment of GIGYF2 and 4EHP (Juszkiewicz et al., 2020; Sinha et al., 2020). This EDF1-mediated mechanism may allow the cell to tune initiation rates such that mRNAs that would otherwise elicit stalling and long-lasting collisions can evade quality control. In the cell, both the duration of the pause and the initiation rate influence the degree to which specific mRNAs experience ribosome queuing and are targeted for RQC (Figure 6B).
While it was previously known that ZNF598 recognizes and targets collided ribosomes for quality control, it was not clear how ZNF598 contributes to the dynamics of ribosome clearance. The prior observation that ribosomes more readily read through a poly(A) stalling sequence in the absence of ZNF598 (Juszkiewicz and Hegde, 2017) can be explained by two possible models: 1) ZNF598 accelerates clearance of stalled ribosomes or 2) ZNF598 kinetically stabilizes stalled ribosomes. Our data indicate that depletion of ZNF598 causes a long delay in τclearance, while luciferase data reveal only a small increase in protein levels under these conditions (an increase from ~9% of no insert to ~15% of no insert), suggesting that most ribosomes are rescued from the mRNA. Thus, the delay in τclearance reflects the time to rescue stalled ribosomes, and we conclude that ZNF598 accelerates clearance of collided ribosomes. We propose that recognition of collisions by ZNF598 serves as a molecular timer that tunes the cellular response to stalling. Accordingly, the abundance of ZNF598 in the cell specifies the temporal threshold for targeting of a collision for quality control, perhaps explaining its variation in expression across human tissues (Nusinow et al., 2020).
In this study, we focused primarily on ribosome rescue and nascent polypeptide degradation in the cellular response to ribosome collisions. However, experiments in yeast additionally established mRNA decay as a robust feature of the related quality control response (D’Orazio et al., 2019; Doma and Parker, 2006; Glover et al., 2020). Our work suggests that at least in our human system, the vast majority of the decrease in protein levels can be attributed to nascent polypeptide degradation. This conclusion is supported by multiple lines of evidence. First, the measured decrease in mRNA levels is small compared to the decrease in protein levels (Figure 1). Second, insertion of a P2A sequence upstream of the poly(A) stall sequence restores protein output to 80% of no insert levels (Figure S1D). Third, and most compellingly, we observe active translation on poly(A)60 for a median time of ~45 min, similar to that of no insert. Given that the clearance time of the poly(A)60 (equivalent to the time to turn over all ribosomes at steady state) is ~15 min and there are ~60 ribosomes per mRNA, a typical mRNA will undergo ~180 rounds of translation during 45 min of observation. Thus, individual mRNAs undergo many rounds of translation, ribosome rescue and nascent polypeptide degradation, in the absence of any mRNA degradation.
Limitations
While the SunTag method enabled us to monitor the dynamics of translation quality control in real time on single mRNAs, this approach also has clear limitations. For example, SunTag reporters harbor highly repetitive sequence features in both the ORF and 3’UTR, generating unnatural mRNAs that may be subject to aberrant processing or regulation. Indeed, we found that the repetitive SunTag sequence undergoes unexpected splicing events. While these minority isoforms do not affect the conclusions presented here, it will be important to characterize future SunTag reporters at the same level of caution to avoid potential artifacts and misinterpretations. Additionally, because of the technically challenging nature of these experiments, our study was limited to a single class of translation obstacle: poly(A). It is possible that targeting of an mRNA for decay depends on the type of obstruction, and that chemically damaged mRNAs or other types of stalls are better substrates for mRNA decay. Future studies will determine whether there are scenarios of ribosome stalling in which mRNA decay is a prominent feature in mammalian systems.
STAR METHODS
RESOURCE AVAILABILITY
Lead contact
Requests for resources and reagents should be directed to Rachel Green (ragreen@jhmi.edu).
Materials availability
Reagents generated in this study are available from the Lead Contact with a completed Materials Transfer Agreement.
Data and code availability
Raw sequencing data were deposited in the SRA database under accession number PRJNA659224. Custom code for analysis of smFISH-IF and live-cell imaging data are available at https://github.com/goldmandanielh/.
EXPERIMENTAL MODEL AND SUBJECT DETAILS
Cell lines and culture conditions
U-2 OS or HEK293T cells were cultured in Dulbecco’s Modified Eagle Medium (DMEM; Thermo Fisher, #11995) supplemented with 10% FBS (Thermo Fisher, #A3160401) at 37°C and 5% CO2. For smFISH-IF experiments, cells were cultured in the presence of 100 units penicillin and 0.1 mg/mL streptomycin (Sigma Aldrich, P0781). For steady-state live-cell imaging experiments, cells were cultured beforehand in the presence of pen/strep, but pen/strep was not present during imaging. For all other experiments, cells were cultured (and experiments performed) in the absence of pen/strep.
Generation of stable cell lines
Lentiviral particles were generated by transfecting HEK293T cells with either MCP-Halo-CAAX or scFv-sfGFP plasmids along with viral packaging accessory plasmids. 48 hours following transfection, the viral supernatant was collected, spun down to remove cellular contents, and filtered through a 0.45 µm PVDF filter (Millipore SLHV013SL). The filtered supernatant was applied directly to U-2 OS cells (American Type Culture Collection HTB-96). Viral transduction was performed sequentially by first infecting U-2 OS cells with MCP-Halo-CAAX and performing fluorescence activated cell sorting (FACS) for positive cells. This positive population was then infected in the same manner with scFv-sfGFP and sorted for highly expressing cells.
Cell lines stably expressing the reporter mRNAs were generated by using the Flp-In method. U-2 OS cells containing a single Flp-In locus and stably expressing the T-Rex tet-On system (ThermoFisher) were a kind gift of Andrew Holland. Cells were first virally transduced with scFv-sfGFP as described above and sorted by FACS. The cells were then tranfected 1:1 mass ratio of pcDNA plasmid to pOG44 (ThermoFisher V600520) using X-tremeGENE 9 DNA Transfection Reagent (Roche, #06365787001) at a ratio of a ratio of 4 ul reagent to 1 ug DNA. Negative control plates received only pOG44. 48 hours following transfection, cells were trypsinized and re-plated in media containing 100 µg/mL hygromycin (InvivoGen ant-hg-1) to begin positive selection. Individual colonies began to form ~1 week following transfection. Positive cells were pooled and expanded after complete cell death on the negative control plate.
METHOD DETAILS
Plasmids
The reporters used in this study are derived from that of an initial study demonstrating the SunTag method for monitoring translation, with several modifications (Wu et al., 2016). First, reporters were cloned into a pcDNA5 vector, and thus are expressed from a CMV promoter, instead of a UbC promoter. Additionally, a Nano Luciferase was inserted downstream of the SunTag array, and most of the beta-actin 3’UTR was removed. The original SunTag array comprises 24 repeats; however, we inactivated the second repeat (g to c substitution, swapping valine for alanine) in an effort to mitigate cryptic splicing. The resulting plasmid, pcDNA_CMV_ST (1253 codons), was used to generate the poly(A) reporters: pcDNA_CMV_ST_A36 and pcDNA_CMV_ST_A60. These plasmids differ from pcDNA_CMV_ST by a stretch of 36 or 60 adenosines, respectively, plus two additional codons (coding for alanine and serine) inserted two codons upstream of the stop codon. If frameshifting occurs on the poly(A) sequence, a stop codon is encountered either 4 nt upstream or downstream of the in-frame stop codon. The reporters lacking SunTag features (used for experiments outlined in Figure S1C) consist of an ORF coding for Nano Luciferase, followed by +/−poly(A)60. pcDNA_CMV_ST_ATF4 and pcDNA_CMV_ST_ATF4_A60 contain the 5’UTR of human ATF4, with start codon for the SunTag open reading frame in the same position as the start codon within the endogenous ATF4 gene. scFv-sfGFP (addgene #84563) and MCP-Halo-CAAX (this paper) plasmids were used to generate stable cell lines for imaging.
Luciferase assays
All luciferase assays were performed in the absence of auxin. For experiments in which SunTag reporters were transfected, U-2 OS cells stably expressing MCP-Halo-CAAX and scFv-sfGFP were seeded in a 96-well plate at a density of 7000 cells per well. The following day, wells were transfected with 29 ng of reporter plasmid and 2 ng of firefly luciferase-expressing normalizer plasmid (pcDNA5_FRT_TO_EGFP_AID_Luciferase, a gift from Dr. Andrew Holland) using X-tremeGENE 9 DNA Transfection Reagent (Roche, #06365787001), at a ratio of 5 ul reagent to 1 ug DNA to 125 ul Opti-MEM Reduced Serum Medium (Thermo Fisher, #51985034). Approximately 24 h later, Nano and Firefly Luciferase activities were measured using the NanoGlo Dual-Luciferase Reporter Assay System (Promega, #N1630) in a Synergy H1 microplate reader (BioTek).
For luciferase assays performed using stable cell lines, U-2 OS cells stably expressing scFv-sfGFP and harboring a genomic copy of the SunTag reporters were seeded in a 96-well plate at a density of 7000 cells per well. The following day, wells wells for cells harboring each reporter were induced by adding doxycycline hyclate (Millipore Sigma, #D9891) to a final concentration of 2 ug/ml. Approximately 24 h later, Nano Luciferase activity was measured.
For luciferase experiments performed under ZNF598 depletion, cells were seeded in a 96-well plate at a density of 7000 cells per well. The following day, cells were transfected with a pool of ZNF598-targeting siRNAs (Horizon, #L-007104-00-0005) or a pool of non-targeting siRNA (Horizon, #D-001810-10-05) at a final concentration of 4 nM using RNAiMax (Thermo Fisher, #13778) according to manufacturer protocol. Approximately 24 h later, cells were transfected with a second dose siRNAs. Approximately 4 h later, the media was changed to fresh DMEM + 10% FBS and triplicate wells were transfected with 29 ng of reporter plasmid and 2 ng of firefly luciferase-expressing normalizer plasmid (pcDNA5_FRT_TO_EGFP_AID_Luciferase, a gift from Dr. Andrew Holland) using X-tremeGENE 9 DNA Transfection Reagent (Roche, #06365787001), at a ratio of 5 ul reagent to 1 ug DNA. Approximately 24 h later, Nano and Firefly Luciferase activities were measured.
Quantifying reporter mRNA levels
U-2 OS cells stably expressing MCP-Halo-CAAX and scFv-sfGFP were seeded in a 12-well plate at a density of 60,000 cells per well. The following day, each well was transfected with 290 ng of reporter plasmid and 20 ng of firefly luciferase-expressing normalizer plasmid (pcDNA5_FRT_TO_EGFP_AID_Luciferase, a gift from Dr. Andrew Holland) using X-tremeGENE 9 DNA Transfection Reagent (Roche, #06365787001), at a ratio of 5 ul reagent to 1 ug DNA to 125 ul Opti-MEM Reduced Serum Medium (Thermo Fisher, #51985034). Approximately 24 h later, cells were rinsed with 1 ml PBS and harvested with 500 ul of Trizol (Thermo Fisher, #15596018), according to manufacturer protocol. The recovered aqueous phase was additionally extracted once with 500 ul of Phenol:Chloroform:IAA, 25:24:1, pH 6.6 (Thermo Fisher, #AM9732) and once with 500 ul chloroform. The resulting aqueous phase was then ethanol-precipitated and resuspended in 30 ul 1x Turbo DNase buffer and treated with 2 ul Turbo DNase (Thermo Fisher, #AM1907) for 2 h at 37 °C. DNase was removed using the inactivation reagent from the same kit, according to manufacturer protocol.
RNA was reverse-transcribed using ProtoScript II First Strand cDNA Synthesis Kit (NEB, #E6560), according to manufacturer protocol, using the random primer mix and 4 ul RNA per 20 ul reaction. A duplicate reaction was included for one sample, substituting water for enzyme mix (a control for amplification of DNA). Reactions for qPCR were performed in a 96-well plate using iTaq Universal SYBR Green Supermix (Bio-Rad, #1725121) in a 20 ul volume with 1 ul template cDNA and 500 nM primer. SunTag primers were designed to amplify only intact (unspliced) reporter mRNAs (the primers bind and amplify a region that is spliced out of all cryptically spliced isoforms). Each cDNA sample (including the control for DNA amplification) was probed in triplicate using primers for both the SunTag reporter and the normalizing reporter. A series of 8 2-fold dilutions was generated from one of the samples and probed with each primer pair in duplicate for use as standard curves. qPCR was performed in a QuantStudio 6 Real-Time PCR System from Thermo Fisher.
Microscope
Live cell data were acquired on a custom inverted wide-field Nikon Eclipse Ti-E microscope equipped with three Andor iXon DU897 EMCCD cameras (512×512 pixels), Apochromatic TIRF 100x Oil Immersion Objective Lens/1.49 NA (Nikon MRD01991), linear encoded Stage XY-stage with 150 micron Piezo Z (Applied Scientific Instrumentation), and LU-n4 four laser unit with solid state 405 nm, 488 nm, 561 nm, and 640 nm lasers (Nikon), a TRF89901-EM ET-405/488/561/640nm Laser Quad Band Filter Set for TIRF applications (Chroma), and Nikon H-TIRF system. The x-y pixel size was 160 nm.
Fixed cell data were acquired on a custom wide-field inverted Nikon Ti-2 wide-field microscope equipped with 60× 1.4NA oil immersion objective lens (Nikon), Spectra X LED light engine (Lumencor), and Orca 4.0 v2 scMOS camera (Hamamatsu). The x-y pixel size was 107.5 nm and the z-step size was 300 nm. Both microscopes were under the automated control of the Nikon Elements software.
Imaging steady-state translation
U-2 OS cells stably expressing MCP-Halo-CAAX and scFv-sfGFP were seeded in 35 mm glass-bottom dishes (Cellvis #D35-20-1.5-N) at a density of 60,000 cells per dish. One day later, each dish was transfected with 400 ng reporter plasmid, using X-tremeGENE HP DNA Transfection Reagent (Roche, 6366236001), at a ratio of 4 ul reagent to 1 ug DNA to 100 ul DMEM (Corning, 10-013-CV). Approximately one day after transfection of the reporter, cells were dyed by adding JF-549X halo dye (a gift from Dr. Luke Lavis) to dishes at a final concentration of 10 nM (Grimm et al., 2016, 2017). Approximately 1 h after adding dye, dishes were washed three times with DMEM + 10% FBS, and media was switched to FluoroBrite DMEM (Thermo Fisher #A1896701) + 10% FBS. 3-Indoleacetic acid (Sigma, #I2886) was maintained at a concentration of 0.5 mM throughout dyeing, washing and imaging. During imaging, cells were maintained at 37°C and 5% CO2. Cells were excited simultaneously with 488/561 nm lasers at 4% green/6% red power, respectively. The exposure time was 500 ms, frame rate one every 15 sec, and total imaging time 3 h.
Harringtonine runoff experiments
U-2 OS cells stably expressing MCP-Halo-CAAX and scFv-sfGFP were seeded in 35 mm glass-bottom dishes (Cellvis #D35-20-1.5-N) at a density of 60,000 cells per dish. One or two days later, each dish was transfected with 800 ng reporter plasmid, using X-tremeGENE 9 DNA Transfection Reagent (Roche, #06365787001), at a ratio of 5 ul reagent to 1 ug DNA to 125 ul Opti-MEM Reduced Serum Medium (Thermo Fisher, #51985034). For experiments performed under ZNF598 depletion, cells were transfected the day after seeding with a pool of ZNF598-targeting siRNAs (Horizon, #L-007104-00-0005) or a pool of non-targeting siRNA (Horizon, #D-001810-10-05) at a final concentration of 4 nM using RNAiMax (Thermo Fisher, #13778) according to manufacturer protocol. Approximately 24 h later, cells were transfected with a second dose siRNAs. Approximately 4 h later, the media was changed to fresh DMEM + 10% FBS and cells were transfected with 800 ng reporter plasmid, using X-tremeGENE 9 DNA Transfection Reagent (Roche, #06365787001), at a ratio of 5 ul reagent to 1 ug DNA.
Approximately one day after transfection of the reporter, cells were dyed by adding JF-549 halo dye to dishes at a final concentration of 5 nM (Grimm et al., 2016, 2017). 3-Indoleacetic acid (Sigma, #I2886) was added to the media at a final concentration of 0.5 mM either several hours post-transfection or at the time of dyeing. Approximately 1 h after adding dye, dishes were washed three times with DMEM + 10% FBS, returned to the incubator for approximately 30 min, and washed once more with DMEM + 10% FBS. Immediately prior to imaging, the media was switched to Leibovitz’s L-15 media (Thermo Fisher, #11415) supplemented with 10% FBS. 3-Indoleacetic acid was maintained at a concentration of 0.5 mM throughout dyeing, washing and imaging.
During imaging, cells were maintained at 35–37°C. After identifying a cell to image, 0.75 ml media (1/3 total volume) was removed from the dish and harringtonine (Cayman Chemical, #15361) was added to 9 ug/ml, mixed with a pipet and added back to the dish (3 ug/ml final concentration). Imaging was started 60 sec post-harringtonine addition in order to adjust the focus after mechanical perturbation of the microscope. Cells were excited sequentially with 488 nm laser at 4% or 5% power and 561 nm laser at 5% power. The exposure time was 500 ms, frame rate one every 15 or 20 sec, and total imaging time 30 min.
smFISH probe labeling
smFISH probes were labeled following the protocol described in (Gaspar et al., 2017). Briefly, 20-mer plate DNA oligonucleotide probes ordered from IDT were pooled together and conjugated to amino-11-ddUTP (Lumiprobe A5040) at the 3’-end using terminal deoxynucleotidyl transferase (TdT) (Thermo Fisher EP0162). After purification by Spin-X centrifuge column (Corning 8161) with Bio Gel P-4 Beads (Bio Rad 1504124), the oligonucleotide-amino-11-ddUTP were labeled with Cy3-NHS ester (Lumiprobe 41020). After Cy3-lableing, the oligonucleotides were again purified to remove excessive dyes with Spin-X centrifuge column.
smFISH-immunofluorescence (smFISH-IF)
We performed smFISH-IF on U-2 OS cells stably expressing the mRNA reporters and scFv-sfGFP without MCP-Halo-CAAX. 18 mm #1 coverslips (Fisher 12-545-100) were base etched in 3M sodium hydroxide (Millipore Sigma 221465) for 30 minutes at room temperature. Coverslips were washed 4x with PBS (Corning 21-031-CV) and then coated for 1 hour at 37°C with 0.25 mg/mL rat tail collagen I (Gibco A1048301) diluted in 20 mM sodium acetate (Millipore Sigma S2889). The coverslips were washed 4x with PBS, and 40,000 cells were plated per well in DMEM supplemented with 10% FBS and pen/strep. 24 hours following plating, the media was exchanged and supplemented with 2 ug/mL doxycycline hyclate (Millipore Sigma, #D9891) and 250 uM 3-indole acetic acid (IAA) (Sigma-Aldrich I2886).
24 hours following induction smFISH-IF was performed as described (Latallo et al., 2019). Briefly, all solutions were prepared in nuclease free water (Quality Biological 351-029-131CS). Cells were washed 3x with 1x PBS + 5 mM magnesium chloride (Millipore Sigma M2670-500G) (PBSM). Cell were then fixed for 10 minutes at room temperature in PBSM + 4% paraformaldehyde (Electron Microscopy Sciences 50-980-492). After fixation, samples were washed for 3×5 minutes in PBSM and then permeabilized in PBSM + 5 mg/mL BSA (VWR VWRV0332-25G) + 0.1% Triton-X100 (Millipore Sigma T8787-100mL) for 10 minutes at room temperature. Cells were then washed 3×5 minutes in PBS and incubated for 30 minutes at room temperature in 2xSSC (Corning 46-020-CM), 10% formamide (Millipore Sigma F9037-100ML), and 5 mg/mL BSA. After pre-hybridization incubation, cells were incubated for 3 hours at 37°C in 2xSSC, 10% formamide, 1 mg/mL competitor E. coli tRNA (Millipore Sigma 10109541001), 10% w/v dextran sulfate (Millipore Sigma D8906-100G), 2 mM ribonucleoside vanadyl complex (NEB S1402S), 100 units/mL SUPERase In (Thermo Fisher AM2694), 60 nM SunTag_v4-Cy3 smFISH probes, and 1:1,000 chicken anti-GFP (Aves Labs GFP-1010). After incubation, the coverslips were washed 4x with 2xSSC + 10% formamide. The samples were then incubated with 2×20 minutes with a goat anti-chicken IgY secondary antibody conjugated to Alexa Fluor 488 (Thermo Fisher A-11039). The samples were then washed 3x with 2xSCC before being mounted on pre-cleaned frosted glass cover slides (Fisher 12-552-3) with ProLong Diamond antifade reagent with DAPI (Invitrogen P36962).
For smFISH-IF experiments performed after treatment with siRNAs, 90,000 U-2 OS cells expressing scFv-sfGFP and the corresponding reporter were seeded in a 6-well plate approximately 72 h prior to the experiment. Approximately 16–18 hours following seeding, cells were transfected with a pool of ZNF598-targeting siRNAs, or a pool of non-targeting siRNA at a concentration of either 4 nM or 21 nM using RNAiMax (Thermo Fisher, #13778) according to manufacturer’s protocol. 6 hours following the initial transfection, cells were re-plated onto coverslips as described above. 24 hours prior to the smFISH-IF protocol, cells were transfected with a second dose of siRNA and the media was supplemented with 2 ug/mL doxycycline hyclate and 250 uM 3-indole acetic acid (IAA). From this point, the smFISH-IF protocol was performed as described above.
Determination of ZNF598 knock-down efficacy
To determine knock-down efficacy with siRNA treatment, U-2 OS cells stably expressing MCP-Halo-CAAX and scFv-sfGFP were seeded in a 6-well plate at a density of 90,000 cells per well. The following day, cells were transfected with a pool of ZNF598-targeting siRNAs or a pool of non-targeting siRNA at a final concentration of 4 nM using RNAiMax (Thermo Fisher, #13778) according to manufacturer protocol. Approximately 24 h later, cells were transfected with a second dose of siRNAs. Approximately 4 h later, the media was changed to fresh DMEM + 10% FBS. Approximately 24 h later, media was aspirated, cells washed 1x with 2 ml PBS and scraped in 120 ul of a lysis buffer containing 50 mM Tris pH 8.0, 150 mM KCl, 1% triton X-100, 1 tablet EDTA-free protease inhibitor cocktail (Millipore Sigma, #11873580001), 20 units Turbo DNase (Thermo Fisher, #AM1907). Lysate was centrifuged for 5’ at 21,000 g and the supernatant recovered. Total protein concentration in the lysate was determined using DC Protein Assay (Bio-Rad, #500-0114). Equal concentrations of total protein, along with a Precision Plus Protein Ladder (Bio-Rad, #161-0394) were loaded and resolved on 4–12% Criterion XT Bis-Tris protein gels (Bio-Rad, #3450123) and transferred to a PVDF membrane using Trans-Blot Turbo system (Bio-Rad). The membrane was blocked in TBST with 5% non-fat milk (Santa Cruz, #sc2325) for 1 h at room temperature. The gel was cut between the 50 and 75 kD marker bands, and the top half incubated overnight with a 1:5000 dilution of rabbit polyclonal ZNF598 primary antibody (Bethyl Laboratories, #A305-108A) in TBST with 5% non-fat milk at 4°C. The bottom half was incubated overnight in TBST with 5% non-fat milk at 4°C. Both membranes were washed 3x for 10 min with TBST. The top half of the blot was then incubated at room temperature for 45 min with an anti-rabbit HRP secondary antibody (Santa Cruz, #2357) at a 1:5000 dilution in TBST with 5% non-fat milk, while the bottom half was incubated at room temperature for 45 min with a beta-actin rabbit monoclonal antibody-HRP conjugate (Cell Signaling #5125) at a 1:5000 dilution in TBST with 5% non-fat milk. Both membranes were washed 3x for 10 min with TBST and developed using SuperSignal West Pico Plus ECL Substrate (Thermo Fisher, #34580). The top half of the membrane was supplemented with 10% SuperSignal West Femto Maximum Sensitivity Substrate (Thermo Fisher, #34095). Both membranes were exposed to Amersham Hyperfilm ECL (GE Healthcare, #28906839).
Oxford Nanopore sequencing
Reporters were expressed in HEK293T cells to maximize transfection efficiency and thus sequencing depth of the reporters. This is important since the vast majority of sequencing reads map to endogenous mRNAs, limiting the ability to acquire reads that map to the reporter. 1,500,000 HEK293T cells were seeded in 10 cm dishes, and transfected the following day with 17.5 ug of pcDNA_CMV_ST or pcDNA_CMV_ST_A60, 45 ul Lipofectamine 3000 reagent (Thermo Fisher, #L3000008), 35 ul P3000 reagent and 1.5 ml Opti-MEM Reduced Serum Medium (Thermo Fisher, #51985034). Two days later, cells were washed with 5 ml PBS and harvested in 1 ml Trizol (Thermo Fisher, #15596018), according to manufacturer protocol. The recovered aqueous phase was additionally extracted once with 500 ul of Phenol:Chloroform:IAA, 25:24:1, pH 6.6 (Thermo Fisher, #AM9732) and once with 500 ul chloroform. The resulting aqueous phase was then ethanol-precipitated and resuspended in 50 ul ddH2O. 5.5 ul of 10x Turbo DNase buffer and 2 ul Turbo DNase (Thermo Fisher, #AM1907) were added to each sample and reactions incubated for 10 min at 37 °C. DNase was removed using the inactivation reagent from the same kit, according to manufacturer protocol. The total RNA sample was polyA-selected using NEBNext Poly(A) mRNA Magnetic Isoluation Module (NEB, #E7490), according to manufacturer protocol with two modifications: We used three times the amount of beads recommended and eluted in a 15 ul volume. Library prep was performed using the Nanopore Direct RNA Sequencing Kit (Oxford Nanopore #SQK-RNA002) and sequenced at the Johns Hopkins University Genetic Resources Core Facility on a GridION instrument.
QUANTIFICATION AND STATISTICAL ANALYSIS
Analysis of luciferase data
The ratio of Nano Luciferase to Firefly Luciferase was measured for either two or three technical replicate wells, and a mean value was calculated. This value was then normalized to that of the no insert reporter. Each experiment was performed three times. Error bars reflect the standard error of the mean. P-values were calculated by the paired-sample t-test and are indicated within the figures.
Analysis of RT-qPCR data
To generate a standard curve for each qPCR target, the dilution factor was plotted against the mean of two duplicate CT values. These data were fit by an exponential curve, which was used to convert measured CT values to relative mRNA abundance. Triplicate samples were averaged and the result for the SunTag reporter divided by that of the normalizing reporter. The resulting ratio for each reporter was normalized to that of the no insert reporter. Each experiment was performed three times. Error bars reflect the standard error of the mean. P-values were calculated by the paired-sample t-test and are indicated within the figures.
Analysis of steady-state live-cell imaging data
Data were analyzed using a combination of custom MATLAB code, Airlocalize (Lionnet et al., 2011) and u-track (Jaqaman et al., 2008). Particle detection was performed using AirLocalize, while u-track was used for tracking. Tracks shorter than 5 frames were discarded. A temporal overlap of at least five frames was required in order to link red and green tracks, and only tracks lasting at least 15 minutes were included in the analysis. mRNAs for which tracking was disrupted due to crossing paths with another mRNA were discarded. Sample sizes (number of cells and mRNA molecules) are indicated in figure legends.
Analysis of live-cell harringtonine runoff data
Data were analyzed using a combination of custom MATLAB code, Airlocalize (Lionnet et al., 2011) and u-track (Jaqaman et al., 2008). Particle detection was performed using AirLocalize, while u-track was used for tracking. Tracks shorter than 5 frames were discarded. A temporal overlap of at least five frames was required in order to link red and green tracks. mRNAs for which tracking was disrupted due to crossing paths with another mRNA were discarded.
To calculate the clearance time on each mRNA, we first determined when the green signal reached its maximum value, and then found the time after this point at which the signal fell below 10% of its maximum intensity. We performed the same analysis for the red channel. If loss of signal for red and green were coincident within three or fewer fames, we did not include the molecule for analysis, due to concerns about signal disappearance for reasons other than clearance of ribosomes (e.g. mRNAs leaving the membrane). Because the red signal was more difficult to track for the full 30 min than the green signal, we included molecules in the analysis for which green signal persisted after loss of red signal. mRNAs were not included if the mean signal of the first 4 frames was less than 10% of the maximum intensity (considered to be not translating at the start of the experiment). Sample sizes (number of cells and mRNA molecules) are indicated in figure legends. 95% confidence bounds were estimated using Greenwood’s formula.
Analysis of Oxford Nanopore direct RNA sequencing data
Reads were mapped to reference plasmid sequences using the minimap2 program (Li, 2018). Splicing status was assessed using custom code written in python with the pysam module. The common splice acceptor site for the four spliced isoforms is located at position 2921 of the reference sequence. To calculate the percentage of reads representing each isoform, it was necessary to count the total number of reads with sequence coverage in the vicinity of the splice site. Thus, we counted the number of reads fully spanning the region from position 2870 to 2972 (874 reads for pcDNA_CMV_ST, 463 reads for pcDNA_CMV_ST_A60) and divided the count for each isoform by that number.
Analysis of smFISH-IF data
All fixed cell imaging analysis was performed with existing and custom software packages in MATLAB and as previously described (Latallo et al., 2019). Spot detection of both smFISH and immunofluorescence channels was performed independently using FISH-Quant (Mueller et al., 2013). FISH-Quant uses Gaussian fitting to determine sub-pixel spot localizations and integrated spot intensities. In the mRNA channel, only single transcripts in the cytoplasm were considered. After determining mRNA localizations, FISH-Quant’s transcription site fitting algorithm was used to quantify the integrated intensity of the translation site. In brief, using the mRNA localization, a 11×11 pixel bounding box was drawn around each mRNA and designated as potential translation site. Single mature polypeptides were detected across the entire image outside of the potential translation sites. These single peptides were thresholded based on their Gaussian fitting parameters (width and intensity) and inspected to ensure accuracy. These single peptides were averaged using FISH-Quant to generate an idealized point-spread-function to calculate the integrated intensity for a single peptide. The potential translation sites were fit to a Gaussian centered on the brightest pixel within the bounding box. The fitting results were again filtered based on shape, intensity, and distance from the original mRNA positions. Failure to converge on an accurate fit based on these parameters resulted in an integrated intensity of 0. Translation sites with an integrated intensity of less than one idealized peptide were determined to be not translating. The integrated intensity of the single particle was used to calculate the number of nascent peptides within the translation site. Because not all ribosomes on the mRNA have translated the full SunTag sequence, we imposed a correction factor to determine the number of ribosomes on the mRNA from the raw number of nascent peptides. The correction is based on the relative proportion of the open reading frame that contains the SunTag sequence:
where N is the total length of the protein in either nucleotides or peptides, n is the SunTag length, P is the intensity of the translation site and ISingle is the intensity of the averaged, idealized particle (Latallo et al., 2019). The correction factor for each open reading frame is listed in the table below.
| Reporter | Nascent Peptide Correction Factor |
|---|---|
| no insert | 1.309 |
| poly(A)36 | 1.305 |
| poly(A)60 | 1.303 |
These correction factors assume a uniform density of ribosomes along the mRNA. Because we observed increased ribosome occupancy on poly(A) reporters caused by ribosome queuing, ribosome density on these mRNAs is likely biased towards the 3’-end of the mRNA. Thus, the correction factors listed in the table may result in a slight overestimation of the ribosome load on poly(A) reporters (see Figure S3E).
Statistical significance of differences in ribosome number
To test distributions of number of ribosomes per mRNA for statistically significant differences (Figures 2C, 4D, 5C, 5D), distributions were first transformed by taking the square root of all values to reduce skewness. The two two-sample t-test was then applied to the transformed distributions.
Calculating theoretical brightness of SunTag splice isoforms
To determine the relative brightness of cryptically spliced SunTag isoforms, we calculated the brightness of each translation site as , where θ is the brightness of a single SunTag-labeled epitope, N is the number of SunTag epitopes in the reporter (N = 23 for intact reporter), M is the total number of segments of SunTag length in the reporter (M = 52 for intact reporter), and pi(t) is the probability that a ribosome is located at segment i at time t (Wu et al., 2016). We assumed that pi(t) is constant for all i. For each splice isoform, we determined the number of SunTag epitopes (N) and the total length of the open reading frame (M) to calculate the brightness relative to the intact reporter.
Supplementary Material
Excel Table 1. SunTag_v4-Cy3 smFISH probe sequences, related to STAR Methods.
Movie S1. Imaging of translation on the no insert SunTag reporter, related to Figure 1. Top panel: cropped area of a cell, with one featured mRNA indicated with a green circle. Although imaging was performed for 3 h, the movie spans only 2 h because the featured mRNA was not tracked for the entire experiment. Red channel: mRNA; green channel: SunTag. Bottom panel: Fluorescence intensity over time plotted for the featured molecule.
Movie S2. Imaging of translation on the poly(A)60 SunTag reporter, related to Figure 1. Top panel: cropped area of a cell, with one featured mRNA indicated with a green circle. Although imaging was performed for 3 h, the movie spans only 2 h because the featured mRNA was not tracked for the entire experiment. Red channel: mRNA; green channel: SunTag. Bottom panel: Fluorescence intensity over time plotted for the featured molecule.
Movie S3. Harringtonine runoff experiment with a cell expressing the no insert reporter, related to Figure 3. Top panel: cropped area of a cell, with one featured mRNA indicated with a green circle. Red channel: mRNA; green channel: SunTag. Bottom panel: Fluorescence intensity over time plotted for the featured molecule.
Movie S4. Harringtonine runoff experiment with a cell expressing the poly(A)36 reporter, related to Figure 3. Top panel: cropped area of a cell, with one featured mRNA indicated with a green circle. Red channel: mRNA; green channel: SunTag. Bottom panel: Fluorescence intensity over time plotted for the featured molecule.
Movie S5. Harringtonine runoff experiment with a cell expressing the poly(A)60 reporter, related to Figure 3. Top panel: cropped area of a cell, with one featured mRNA indicated with a green circle. Red channel: mRNA; green channel: SunTag. Bottom panel: Fluorescence intensity over time plotted for the featured molecule.
Movie S6. Harringtonine runoff experiment with a cell expressing the no insert reporter with ATF4 5’UTR, related to Figure 4. Top panel: cropped area of a cell, with one featured mRNA indicated with a green circle. Red channel: mRNA; green channel: SunTag. Bottom panel: Fluorescence intensity over time plotted for the featured molecule.
Movie S7. Harringtonine runoff experiment with a cell expressing the poly(A)60 reporter with ATF4 5’UTR, related to Figure 4. Top panel: cropped area of a cell, with one featured mRNA indicated with a green circle. Red channel: mRNA; green channel: SunTag. Bottom panel: Fluorescence intensity over time plotted for the featured molecule.
Movie S8. Harringtonine runoff experiment with a cell expressing the no insert reporter in mock siRNA-treated cells, related to Figure 5. Top panel: cropped area of a cell, with one featured mRNA indicated with a green circle. Red channel: mRNA; green channel: SunTag. Bottom panel: Fluorescence intensity over time plotted for the featured molecule.
Movie S9. Harringtonine runoff experiment with a cell expressing the poly(A)60 reporter in mock siRNA-treated cells, related to Figure 5. Top panel: cropped area of a cell, with one featured mRNA indicated with a green circle. Red channel: mRNA; green channel: SunTag. Bottom panel: Fluorescence intensity over time plotted for the featured molecule.
Movie S10. Harringtonine runoff experiment with a cell expressing the no insert reporter in ZNF598 siRNA-treated cells, related to Figure 5. Top panel: cropped area of a cell, with one featured mRNA indicated with a green circle. Red channel: mRNA; green channel: SunTag. Bottom panel: Fluorescence intensity over time plotted for the featured molecule.
Movie S11. Harringtonine runoff experiment with a cell expressing the poly(A)60 reporter in ZNF598 siRNA-treated cells, related to Figure 5. Top panel: cropped area of a cell, with one featured mRNA indicated with a green circle. Red channel: mRNA; green channel: SunTag. Bottom panel: Fluorescence intensity over time plotted for the featured molecule.
KEY RESOURCES TABLE.
| REAGENT or RESOURCE | SOURCE | IDENTIFIER |
|---|---|---|
| Antibodies | ||
| ZNF598 antibody | Bethyl Laboratories Inc. | A305-108A, RRID:AB_2631503 |
| anti-rabbit HRP secondary antibody | Santa Cruz Biotechnology | sc-2357, RRID:AB_628497 |
| Rabbit Anti-beta-Actin Monoclonal Antibody | Cell Signaling Technology | 5125, RRID:AB_1903890 |
| anti-GFP antibody | Aves Labs | GFP-1010, RRID:AB_2307313 |
| Goat anti-Chicken IgY (H+L) Secondary Antibody, Alexa Fluor 488 | Thermo Fisher Scientific | A-11039, RRID:AB_142924 |
| Chemicals, Peptides, and Recombinant Proteins | ||
| X-tremeGENE 9 DNA Transfection Reagent | Roche | 06365787001 |
| Hygromycin | InvivoGen | ant-hg-1 |
| Opti-MEM Reduced Serum Medium | Thermo Fisher | 51985034 |
| Dulbecco’s Modified Eagle Medium | Thermo Fisher | 11995 |
| Fetal Bovine Serum | Thermo Fisher | A3160401 |
| Penicillin/Streptomycin | Sigma Aldrich | P0781 |
| Doxycycline Hyclate | Millipore Sigma | D9891 |
| Phenol:Chloroform:IAA | Thermo Fisher | AM9732 |
| Turbo DNase | Thermo Fisher | AM1907 |
| iTaq Universal SYBR Green Supermix | Bio-Rad | 1725121 |
| X-tremeGENE HP DNA Transfection Reagent | Roche | 6366236001 |
| JF-549X dye | Dr. Luke Lavis | N/A |
| FluoroBrite Dulbecco’s Modified Eagle Medium | Thermo Fisher | A1896701 |
| 3-Indoleacetic acid | Millipore Sigma | I2886 |
| JF-549 dye | Dr. Luke Lavis | N/A |
| Leibovitz’s L-15 media | Thermo Fisher | 11415 |
| Harringtonine | Cayman Chemical | 15361 |
| amino-11-ddUTP | Lumiprobe | A5040 |
| Terminal deoxynucleotidyl transferase | Thermo Fisher | EP0162 |
| Cy3-NHS ester | Lumiprobe | 41020 |
| Sodium hydroxide | Millipore Sigma | 221465 |
| PBS | Corning | 21-031-CV |
| Rat tail collagen I | Gibco | A1048301 |
| Sodium acetate | Millipore Sigma | S2889 |
| Doxycycline hyclate | Millipore Sigma | D9891 |
| Nuclease free water | Quality Biological | 351-029-131CS |
| Magnesium chloride | Millipore Sigma | M2670-500G |
| Paraformaldehyde | Electron Microscopy Sciences | 50-980-492 |
| BSA | VWR | VWRV0332-25G |
| Triton-X100 | Millipore Sigma | T8787-100mL |
| SSC buffer | Corning | 46-020-CM |
| Formamide | Millipore Sigma | F9037-100ML |
| E. coli tRNA | Millipore Sigma | 10109541001 |
| Dextran sulfate | Millipore Sigma | D8906-100G |
| Ribonucleoside vanadyl complex | NEB | S1402S |
| SUPERase In | Thermo Fisher | AM2694 |
| ProLong Diamond antifade reagent with DAPI | Invitrogen | P36962 |
| RNAiMax transfection reagent | Thermo Fisher | 13778 |
| EDTA-free protease inhibitor cocktail | Millipore Sigma | 11873580001 |
| Precision plus protein ladder | Bio-Rad | 161-0394 |
| Non-fat milk | Santa Cruz | sc2325 |
| Lipofectamine 3000 reagent | Thermo Fisher | L3000008 |
| Trizol | Thermo Fisher | 15596018 |
| Critical Commercial Assays | ||
| NanoGlo Dual-Luciferase Reporter Assay System | Promega | N1630 |
| ProtoScript II First Strand cDNA Synthesis Kit | NEB | E6560 |
| DC Protein Assay | Bio-Rad | 500-0114 |
| SuperSignal West Pico Plus ECL Substrate | Thermo Fisher | 34580 |
| SuperSignal West Femto Maximum Sensitivity Substrate | Thermo Fisher | 34095 |
| Amersham Hyperfilm ECL | GE Healthcare | 28906839 |
| NEBNext Poly(A) mRNA Magnetic Isoluation Module | NEB | E7490 |
| Nanopore Direct RNA Sequencing Kit | Oxford Nanopore | SQK-RNA002 |
| Deposited Data | ||
| Oxford Nanopore direct RNA seuquencing data | This paper | PRJNA659224 |
| Experimental Models: Cell Lines | ||
| U-2 OS cells | ATCC | RRID: CVCL_0042 |
| U-2 OS cells with Flp-In locus | Dr. Andrew Holland | N/A |
| HEK293T | ATCC | RRID: CVCL_0063 |
| Oligonucleotides | ||
| ZNF598-targeting siRNAs | Horizon | L-007104-00-0005 |
| non-targeting siRNA | Horizon | D-001810-10-05 |
| SunTag forward primer for qPCR: AGGTACCGTCTTCACACTCG | This paper | N/A |
| SunTag reverse primer for qPCR: GGACACACCTCCCTGTTCAA | This paper | N/A |
| Firefly Luciferase forward primer for qPCR: CGCGGTCGGTAAAGTTGTTC | This paper | N/A |
| Firefly Luciferase reverse primer for qPCR: ACCTCTCACACACAGTTCGC | This paper | N/A |
| SunTag_v4-Cy3 smFISH probes | This paper | See Excel Table 1 |
| Nano Luciferase forward primer for qPCR: TGGTAATCGACGGGGTTACG | This paper | N/A |
| Nano Luciferase reverse primer for qPCR: GATCAGGCGCTCGTCGATAA | This paper | N/A |
| Recombinant DNA | ||
| pOG44 plasmid | ThermoFisher | V600520 |
| pcDNA5_FRT_TO_EGFP_AID_Luciferase plasmid | Dr. Andrew Holland | N/A |
| pcDNA_CMV_ST plasmid | This paper | N/A |
| pcDNA_CMV_ST_A36 plasmid | This paper | N/A |
| pcDNA_CMV_ST_A60 plasmid | This paper | N/A |
| pcDNA_CMV_ST_ATF4 plasmid | This paper | N/A |
| pcDNA_CMV_ST_ATF4_A60 plasmid | This paper | N/A |
| scFV-sfGFP | Dr. Bin Wu | Addgene #84563 |
| MCP-Halo-CAAX | This paper | N/A |
| Software and Algorithms | ||
| AirLocalize software | Lionnet et al., 2011 | N/A |
| u-track software | Jaqaman et al., 2008 | https://www.utsouthwestern.edu/labs/danuser/software/ |
| Live-cell track analysis software | This study | https://github.com/goldmandanielh |
| FISH-Quant software | Mueller et al., 2013 | N/A |
| Splice analysis of direct RNA sequencing data | This study | https://github.com/goldmandanielh |
| minimap2 software | Li, 2018 | https://github.com/lh3/minimap2 |
| Software for co-localization analysis of smFISH-IF data | This study | https://github.com/goldmandanielh |
Highlights:
Ribosome stalling on poly(A) results in long queues of collided ribosomes
Slow rescue of stalled ribosomes confers selective targeting for quality control
Rescue efficiency depends on collision frequency and ribosome queue length
The E3 ubiquitin ligase ZNF598 accelerates rescue of stalled ribosomes
ACKNOWLEDGEMENTS
We thank the Johns Hopkins University Genetic Resources Core Facility for sequencing services. R.G. is an investigator of the Howard Hughes Medical Institute. This work is supported by National Science Foundation (MCB 1817447) and Pew Charitable Trust (00030601) to B.W. D.H.G. is a Damon Runyon Fellow supported by the Damon Runyon Cancer Research Foundation (DRG-2280-16). N.M.L. is supported by NIH Training Grant T32 GM007445. We thank Boris Zinshteyn for critical discussions and feedback throughout the duration of the project.
Footnotes
Publisher's Disclaimer: This is a PDF file of an unedited manuscript that has been accepted for publication. As a service to our customers we are providing this early version of the manuscript. The manuscript will undergo copyediting, typesetting, and review of the resulting proof before it is published in its final form. Please note that during the production process errors may be discovered which could affect the content, and all legal disclaimers that apply to the journal pertain.
DECLARATION OF INTERESTS
The authors declare no competing interests.
REFERENCES
- Arpat AB, Liechti A, De Matos M, Dreos R, Janich P, and Gatfield D (2020). Transcriptome-wide sites of collided ribosomes reveal principles of translational pausing. Genome Res 30, 985–999. [DOI] [PMC free article] [PubMed] [Google Scholar]
- Belgrader P, Cheng J, and Maquat LE (1993). Evidence to implicate translation by ribosomes in the mechanism by which nonsense codons reduce the nuclear level of human triosephosphate isomerase mRNA. Proc. Natl. Acad. Sci. U. S. A 90, 482–486. [DOI] [PMC free article] [PubMed] [Google Scholar]
- Brandman O, and Hegde RS (2016). Ribosome-associated protein quality control. Nat. Struct. Mol. Biol 23, 7–15. [DOI] [PMC free article] [PubMed] [Google Scholar]
- Brandman O, Stewart-Ornstein J, Wong D, Larson A, Williams CC, Li G-W, Zhou S, King D, Shen PS, Weibezahn J, et al. (2012). A ribosome-bound quality control complex triggers degradation of nascent peptides and signals translation stress. Cell 151, 1042–1054. [DOI] [PMC free article] [PubMed] [Google Scholar]
- Chandrasekaran V, Juszkiewicz S, Choi J, Puglisi JD, Brown A, Shao S, Ramakrishnan V, and Hegde RS (2019). Mechanism of ribosome stalling during translation of a poly(A) tail. Nat. Struct. Mol. Biol 26, 1132–1140. [DOI] [PMC free article] [PubMed] [Google Scholar]
- Choe Y, Park S, Hassemer T, Körner R, Vincenz-Donnelly L, Hayer-Hartl M, and Hartl FU (2016). Failure of RQC machinery causes protein aggregation and proteotoxic stress. Nature 531, 191–195. [DOI] [PubMed] [Google Scholar]
- Chu J, Hong NA, Masuda CA, Jenkins BV, Nelms KA, Goodnow CC, Glynne RJ, Wu H, Masliah E, Joazeiro CAP, et al. (2009). A mouse forward genetics screen identifies LISTERIN as an E3 ubiquitin ligase involved in neurodegeneration. Proc. Natl. Acad. Sci. U. S. A 106, 2097–2103. [DOI] [PMC free article] [PubMed] [Google Scholar]
- D’Orazio KN, Wu CC, Sinha N, Loll-Krippleber R, Brown GW, and Green R (2019). The endonuclease Cue2 cleaves mRNAs at stalled ribosomes during No Go Decay. Elife 8, 1–27. [DOI] [PMC free article] [PubMed] [Google Scholar]
- Doma MK, and Parker R (2006). Endonucleolytic cleavage of eukaryotic mRNAs with stalls in translation elongation. Nature 440, 561–564. [DOI] [PMC free article] [PubMed] [Google Scholar]
- Donnelly ML, Luke G, Mehrotra A, Li X, Hughes LE, Gani D, and Ryan MD (2001). Analysis of the aphthovirus 2A/2B polyprotein “cleavage” mechanism indicates not a proteolytic reaction, but a novel translational effect: a putative ribosomal “skip”. J. Gen. Virol 82, 1013–1025. [DOI] [PubMed] [Google Scholar]
- Fresno M, Jiménez A, and Vázquez D (1977). Inhibition of translation in eukaryotic systems by harringtonine. Eur. J. Biochem 72, 323–330. [DOI] [PubMed] [Google Scholar]
- Garzia A, Jafarnejad SM, Meyer C, Chapat C, Gogakos T, Morozov P, Amiri M, Shapiro M, Molina H, Tuschl T, et al. (2017). The E3 ubiquitin ligase and RNA-binding protein ZNF598 orchestrates ribosome quality control of premature polyadenylated mRNAs. Nat. Commun 8, 16056. [DOI] [PMC free article] [PubMed] [Google Scholar]
- Gaspar I, Wippich F, and Ephrussi A (2017). Enzymatic production of single-molecule FISH and RNA capture probes. RNA 23, 1582–1591. [DOI] [PMC free article] [PubMed] [Google Scholar]
- Glover ML, Burroughs AM, Monem PC, Egelhofer TA, Pule MN, Aravind L, and Arribere JA (2020). NONU-1 Encodes a Conserved Endonuclease Required for mRNA Translation Surveillance. Cell Rep 30, 4321–4331.e4. [DOI] [PMC free article] [PubMed] [Google Scholar]
- Grimm JB, English BP, Choi H, Muthusamy AK, Mehl BP, Dong P, Brown TA, Lippincott-Schwartz J, Liu Z, Lionnet T, et al. (2016). Bright photoactivatable fluorophores for single-molecule imaging. Nat. Methods 13, 985–988. [DOI] [PubMed] [Google Scholar]
- Grimm JB, Muthusamy AK, Liang Y, Brown TA, Lemon WC, Patel R, Lu R, Macklin JJ, Keller PJ, Ji N, et al. (2017). A general method to fine-tune fluorophores for live-cell and in vivo imaging. Nat. Methods 14, 987–994. [DOI] [PMC free article] [PubMed] [Google Scholar]
- Han P, Shichino Y, Schneider-Poetsch T, Mito M, Hashimoto S, Udagawa T, Kohno K, Yoshida M, Mishima Y, Inada T, et al. (2020). Genome-wide Survey of Ribosome Collision. Cell Rep 31, 107610. [DOI] [PMC free article] [PubMed] [Google Scholar]
- Hoek TA, Khuperkar D, Lindeboom RGH, Sonneveld S, Verhagen BMP, Boersma S, Vermeulen M, and Tanenbaum ME (2019). Single-Molecule Imaging Uncovers Rules Governing Nonsense-Mediated mRNA Decay. Mol. Cell 75, 324–339.e11. [DOI] [PMC free article] [PubMed] [Google Scholar]
- Ikeuchi K, Tesina P, Matsuo Y, Sugiyama T, Cheng J, Saeki Y, Tanaka K, Becker T, Beckmann R, and Inada T (2019). Collided ribosomes form a unique structural interface to induce Hel2-driven quality control pathways. EMBO J 38, e100276. [DOI] [PMC free article] [PubMed] [Google Scholar]
- Ingolia NT, Lareau LF, and Weissman JS (2011). Ribosome profiling of mouse embryonic stem cells reveals the complexity and dynamics of mammalian proteomes. Cell 147, 789–802. [DOI] [PMC free article] [PubMed] [Google Scholar]
- Ishimura R, Nagy G, Dotu I, Zhou H, Yang X-L, Schimmel P, Senju S, Nishimura Y, Chuang JH, and Ackerman SL (2014). RNA function. Ribosome stalling induced by mutation of a CNS-specific tRNA causes neurodegeneration. Science 345, 455–459. [DOI] [PMC free article] [PubMed] [Google Scholar]
- Jaqaman K, Loerke D, Mettlen M, Kuwata H, Grinstein S, Schmid SL, and Danuser G (2008). Robust single-particle tracking in live-cell time-lapse sequences. Nat. Methods 5, 695–702. [DOI] [PMC free article] [PubMed] [Google Scholar]
- Joazeiro CAP (2017). Ribosomal Stalling During Translation: Providing Substrates for Ribosome-Associated Protein Quality Control. Annu. Rev. Cell Dev. Biol 33, 343–368. [DOI] [PubMed] [Google Scholar]
- Juszkiewicz S, and Hegde RS (2017). Initiation of Quality Control during Poly(A) Translation Requires Site-Specific Ribosome Ubiquitination. Mol. Cell 65, 743–750.e4. [DOI] [PMC free article] [PubMed] [Google Scholar]
- Juszkiewicz S, Chandrasekaran V, Lin Z, Kraatz S, Ramakrishnan V, and Hegde RS (2018). ZNF598 Is a Quality Control Sensor of Collided Ribosomes. Mol. Cell 72, 469–481.e7. [DOI] [PMC free article] [PubMed] [Google Scholar]
- Juszkiewicz S, Slodkowicz G, Lin Z, Freire-Pritchett P, Peak-Chew S-Y, and Hegde RS (2020). Ribosome collisions trigger cis-acting feedback inhibition of translation initiation. Elife 9. [DOI] [PMC free article] [PubMed] [Google Scholar]
- Koutmou KS, Schuller AP, Brunelle JL, Radhakrishnan A, Djuranovic S, and Green R (2015). Ribosomes slide on lysine-encoding homopolymeric A stretches. Elife 4, 1–18. [DOI] [PMC free article] [PubMed] [Google Scholar]
- Latallo MJ, Livingston NM, and Wu B (2019). Translation imaging of single mRNAs in established cell lines and primary cultured neurons. Methods 162–163, 12–22. [DOI] [PubMed] [Google Scholar]
- Li H (2018). Minimap2: pairwise alignment for nucleotide sequences. Bioinformatics 34, 3094–3100. [DOI] [PMC free article] [PubMed] [Google Scholar]
- Lionnet T, Czaplinski K, Darzacq X, Shav-Tal Y, Wells AL, Chao JA, Park HY, de Turris V, Lopez-Jones M, and Singer RH (2011). A transgenic mouse for in vivo detection of endogenous labeled mRNA. Nat. Methods 8, 165–170. [DOI] [PMC free article] [PubMed] [Google Scholar]
- Matsuo Y, Tesina P, Nakajima S, Mizuno M, Endo A, Buschauer R, Cheng J, Shounai O, Ikeuchi K, Saeki Y, et al. (2020). RQT complex dissociates ribosomes collided on endogenous RQC substrate SDD1. Nat. Struct. Mol. Biol 27, 323–332. [DOI] [PubMed] [Google Scholar]
- Mills EW, Wangen J, Green R, and Ingolia NT (2016). Dynamic Regulation of a Ribosome Rescue Pathway in Erythroid Cells and Platelets. Cell Rep 17, 1–10. [DOI] [PMC free article] [PubMed] [Google Scholar]
- Morisaki T, Lyon K, DeLuca KF, DeLuca JG, English BP, Zhang Z, Lavis LD, Grimm JB, Viswanathan S, Looger LL, et al. (2016). Real-time quantification of single RNA translation dynamics in living cells. Science 352, 1425–1429. [DOI] [PubMed] [Google Scholar]
- Mueller F, Senecal A, Tantale K, Marie-Nelly H, Ly N, Collin O, Basyuk E, Bertrand E, Darzacq X, and Zimmer C (2013). FISH-quant: automatic counting of transcripts in 3D FISH images. Nat. Methods 10, 277–278. [DOI] [PubMed] [Google Scholar]
- Nishimura K, Fukagawa T, Takisawa H, Kakimoto T, and Kanemaki M (2009). An auxin-based degron system for the rapid depletion of proteins in nonplant cells. Nat. Methods 6, 917–922. [DOI] [PubMed] [Google Scholar]
- Nusinow DP, Szpyt J, Ghandi M, Rose CM, McDonald ER, Kalocsay M, Jané-Valbuena J, Gelfand E, Schweppe DK, Jedrychowski M, et al. (2020). Quantitative Proteomics of the Cancer Cell Line Encyclopedia. Cell 180, 387–402.e16. [DOI] [PMC free article] [PubMed] [Google Scholar]
- Park H, and Subramaniam AR (2019). Inverted translational control of eukaryotic gene expression by ribosome collisions. PLoS Biol 17, e3000396. [DOI] [PMC free article] [PubMed] [Google Scholar]
- Pichon X, Bastide A, Safieddine A, Chouaib R, Samacoits A, Basyuk E, Peter M, Mueller F, and Bertrand E (2016). Visualization of single endogenous polysomes reveals the dynamics of translation in live human cells. J. Cell Biol 214, 769–781. [DOI] [PMC free article] [PubMed] [Google Scholar]
- Puchades C, Sandate CR, and Lander GC (2020). The molecular principles governing the activity and functional diversity of AAA+ proteins. Nat. Rev. Mol. Cell Biol 21, 43–58. [DOI] [PMC free article] [PubMed] [Google Scholar]
- Shao S, and Hegde RS (2014). Reconstitution of a minimal ribosome-associated ubiquitination pathway with purified factors. Mol. Cell 55, 880–890. [DOI] [PMC free article] [PubMed] [Google Scholar]
- Shoemaker CJ, and Green R (2012). Translation drives mRNA quality control. Nat. Struct. Mol. Biol 19, 594–601. [DOI] [PMC free article] [PubMed] [Google Scholar]
- Simms CL, Yan LL, and Zaher HS (2017). Ribosome Collision Is Critical for Quality Control during No-Go Decay. Mol. Cell 68, 361–373.e5. [DOI] [PMC free article] [PubMed] [Google Scholar]
- Sinha NK, Ordureau A, Best K, Saba JA, Zinshteyn B, Sundaramoorthy E, Fulzele A, Garshott DM, Denk T, Thoms M, et al. (2020). EDF1 coordinates cellular responses to ribosome collisions. Elife 9. [DOI] [PMC free article] [PubMed] [Google Scholar]
- Sundaramoorthy E, Leonard M, Mak R, Liao J, Fulzele A, and Bennett EJ (2017). ZNF598 and RACK1 Regulate Mammalian Ribosome-Associated Quality Control Function by Mediating Regulatory 40S Ribosomal Ubiquitylation. Mol. Cell 65, 751–760.e4. [DOI] [PMC free article] [PubMed] [Google Scholar]
- Tesina P, Lessen LN, Buschauer R, Cheng J, Wu CC, Berninghausen O, Buskirk AR, Becker T, Beckmann R, and Green R (2020). Molecular mechanism of translational stalling by inhibitory codon combinations and poly(A) tracts. EMBO J 39, e103365. [DOI] [PMC free article] [PubMed] [Google Scholar]
- Vattem KM, and Wek RC (2004). Reinitiation involving upstream ORFs regulates ATF4 mRNA translation in mammalian cells. Proc. Natl. Acad. Sci. U. S. A 101, 11269–11274. [DOI] [PMC free article] [PubMed] [Google Scholar]
- Wang C, Han B, Zhou R, and Zhuang X (2016). Real-Time Imaging of Translation on Single mRNA Transcripts in Live Cells. Cell 165, 990–1001. [DOI] [PMC free article] [PubMed] [Google Scholar]
- Wolin SL, and Walter P (1988). Ribosome pausing and stacking during translation of a eukaryotic mRNA. EMBO J 7, 3559–3569. [DOI] [PMC free article] [PubMed] [Google Scholar]
- Wu B, Eliscovich C, Yoon YJ, and Singer RH (2016). Translation dynamics of single mRNAs in live cells and neurons. Science 352, 1430–1435. [DOI] [PMC free article] [PubMed] [Google Scholar]
- Wu CC-C, Peterson A, Zinshteyn B, Regot S, and Green R (2020). Ribosome Collisions Trigger General Stress Responses to Regulate Cell Fate. Cell 182, 1–13. [DOI] [PMC free article] [PubMed] [Google Scholar]
- Yan X, Hoek TA, Vale RD, and Tanenbaum ME (2016). Dynamics of Translation of Single mRNA Molecules In Vivo. Cell 165, 976–989. [DOI] [PMC free article] [PubMed] [Google Scholar]
Associated Data
This section collects any data citations, data availability statements, or supplementary materials included in this article.
Supplementary Materials
Excel Table 1. SunTag_v4-Cy3 smFISH probe sequences, related to STAR Methods.
Movie S1. Imaging of translation on the no insert SunTag reporter, related to Figure 1. Top panel: cropped area of a cell, with one featured mRNA indicated with a green circle. Although imaging was performed for 3 h, the movie spans only 2 h because the featured mRNA was not tracked for the entire experiment. Red channel: mRNA; green channel: SunTag. Bottom panel: Fluorescence intensity over time plotted for the featured molecule.
Movie S2. Imaging of translation on the poly(A)60 SunTag reporter, related to Figure 1. Top panel: cropped area of a cell, with one featured mRNA indicated with a green circle. Although imaging was performed for 3 h, the movie spans only 2 h because the featured mRNA was not tracked for the entire experiment. Red channel: mRNA; green channel: SunTag. Bottom panel: Fluorescence intensity over time plotted for the featured molecule.
Movie S3. Harringtonine runoff experiment with a cell expressing the no insert reporter, related to Figure 3. Top panel: cropped area of a cell, with one featured mRNA indicated with a green circle. Red channel: mRNA; green channel: SunTag. Bottom panel: Fluorescence intensity over time plotted for the featured molecule.
Movie S4. Harringtonine runoff experiment with a cell expressing the poly(A)36 reporter, related to Figure 3. Top panel: cropped area of a cell, with one featured mRNA indicated with a green circle. Red channel: mRNA; green channel: SunTag. Bottom panel: Fluorescence intensity over time plotted for the featured molecule.
Movie S5. Harringtonine runoff experiment with a cell expressing the poly(A)60 reporter, related to Figure 3. Top panel: cropped area of a cell, with one featured mRNA indicated with a green circle. Red channel: mRNA; green channel: SunTag. Bottom panel: Fluorescence intensity over time plotted for the featured molecule.
Movie S6. Harringtonine runoff experiment with a cell expressing the no insert reporter with ATF4 5’UTR, related to Figure 4. Top panel: cropped area of a cell, with one featured mRNA indicated with a green circle. Red channel: mRNA; green channel: SunTag. Bottom panel: Fluorescence intensity over time plotted for the featured molecule.
Movie S7. Harringtonine runoff experiment with a cell expressing the poly(A)60 reporter with ATF4 5’UTR, related to Figure 4. Top panel: cropped area of a cell, with one featured mRNA indicated with a green circle. Red channel: mRNA; green channel: SunTag. Bottom panel: Fluorescence intensity over time plotted for the featured molecule.
Movie S8. Harringtonine runoff experiment with a cell expressing the no insert reporter in mock siRNA-treated cells, related to Figure 5. Top panel: cropped area of a cell, with one featured mRNA indicated with a green circle. Red channel: mRNA; green channel: SunTag. Bottom panel: Fluorescence intensity over time plotted for the featured molecule.
Movie S9. Harringtonine runoff experiment with a cell expressing the poly(A)60 reporter in mock siRNA-treated cells, related to Figure 5. Top panel: cropped area of a cell, with one featured mRNA indicated with a green circle. Red channel: mRNA; green channel: SunTag. Bottom panel: Fluorescence intensity over time plotted for the featured molecule.
Movie S10. Harringtonine runoff experiment with a cell expressing the no insert reporter in ZNF598 siRNA-treated cells, related to Figure 5. Top panel: cropped area of a cell, with one featured mRNA indicated with a green circle. Red channel: mRNA; green channel: SunTag. Bottom panel: Fluorescence intensity over time plotted for the featured molecule.
Movie S11. Harringtonine runoff experiment with a cell expressing the poly(A)60 reporter in ZNF598 siRNA-treated cells, related to Figure 5. Top panel: cropped area of a cell, with one featured mRNA indicated with a green circle. Red channel: mRNA; green channel: SunTag. Bottom panel: Fluorescence intensity over time plotted for the featured molecule.
Data Availability Statement
Raw sequencing data were deposited in the SRA database under accession number PRJNA659224. Custom code for analysis of smFISH-IF and live-cell imaging data are available at https://github.com/goldmandanielh/.