

Introductory Paragraph
Initial microbial colonization and later succession in the gut of human infants are linked to health and disease later in life. The timing of the appearance of the first gut microbiome, and the consequences for the early life metabolome, are just starting to be defined. Here we evaluated the gut microbiome, proteome, and metabolome in 88 African American newborns using fecal samples collected in the first few days of life. Gut bacteria became detectable using molecular methods by 16 hours after birth. Detailed analysis of the three most common species, Escherichia coli, Enterococcus faecalis, and Bacteroides vulgatus, did not suggest a genomic signature for neonatal gut colonization. The appearance of bacteria was associated with reduced abundance of approximately 50 human proteins, decreased levels of free amino acids, and an increase in products of bacterial fermentation, including acetate and succinate. Using flux balance modeling and in vitro experiments, we provide evidence that fermentation of amino acids provides a mechanism for the initial growth of Escherichia coli, the most common early colonizer, under anaerobic conditions. These results provide a deep characterization of the first microbes in the human gut and show how the biochemical environment is altered by their appearance.
Introduction
Intense interest has focused on the early infant microbiome because of its linkage to health and disease later in life, but core aspects of its origin and function remain incompletely understood. Studies have characterized the development of the infant gut microbiome through the first several years of life, after which it reaches a state of high richness equivalent to that of an adult1–4. The first fecal material from a newborn—meconium—commonly contains Gammaproteobacteria such as E. coli and Klebsiella, and Bacilli such as Enterococcus, Staphylococcus, and Streptococcus5–25. Several studies have investigated the metabolome and proteome of infant fecal samples26–29, though the mechanisms by which bacteria shape the biochemical environment of meconium remain unknown.
Proteobacteria and other facultative anaerobes in the early gut microbiota are capable of consuming oxygen, and may thereby create an anaerobic environment supporting eventual succession by obligate anaerobes30. Furthermore, the order of arrival for bacterial strains immediately after birth may shape subsequent composition and succession through intermicrobial interactions31. We sought to shed light on these questions by interrogating the microbiota and chemical environment in feces just after birth.
Here, we characterized the organisms of the newborn gut and their biochemical environment with metagenomics, proteomics, and metabolomics. Sequencing of meconium collected within 16 hours of delivery showed a high level of human DNA but low levels of microbial DNA. After 16 hours, most samples contained levels of bacteria sufficient for genome assembly. We characterized the proteome and metabolome to specify the biochemical consequences of microbial presence. The proteome, rich in human proteins, was different in samples where bacteria were detected. The fecal metabolome was correspondingly different, with increased levels of acetate and succinate. With thermodynamic nutrient flux modeling and culture experiments, we determined that the observed order of amino acid consumption for E. coli was consistent with anaerobic and not aerobic conditions. These studies thus specify the nature and action of the microbiome on the central aspects of the biochemistry of the newborn gut.
Results
Shotgun metagenomic sequencing of infant cohort.
We collected fecal samples from 88 healthy African-American term infants from 2 minutes to 176 hours after birth, representing a mix of meconium and very early life fecal samples (Table 1). All but three fecal samples were collected within 70 hours. We refer to all as meconium hereafter for convenience. One sample per infant was collected during this time period. Using shotgun metagenomic sequencing, we found that Escherichia coli, Enterococcus faecalis, and Bacteroides vulgatus were the most common bacterial species detected (Figure 1a). We found a high percentage of Candida albicans in one sample collected 36 hours after birth. We found no animal cell viruses, but did identify bacteriophage sequences. A more comprehensive summary of meconium samples is provided in Supplementary Figure 1.
Table 1: Clinical characteristics of the cohort.
Percentages indicate the fraction of total for each condition in each sample group. Pairs of numbers in parentheses indicate the range of values. The pre-PCR DNA concentration is given in units of ng/μL. Gestational age is given in weeks. Groups were compared using the Kruskal-Wallis test in the case of continuous measures, or Fisher’s exact test in the case of categorical variables. P-values from the comparisons are shown on the right.
| Collected before 16h | Collected after 16h >75% human DNA |
Collected after 16h <75% human DNA |
|||
|---|---|---|---|---|---|
| N | 32 | 21 | 32 | ||
| Mother weight group | Healthy weight | 16 (19%) | 8 (9%) | 11 (13%) | P = 0.42 |
| Obese | 16 (19%) | 13 (15%) | 21 (25%) | ||
| Delivery type | C-Section with labor | 6 (7%) | 3 (4%) | 1 (1%) | P = 0.13 |
| C-Section without labor | 4 (5%) | 5 (6%) | 3 (4%) | ||
| Vaginal delivery | 22 (26%) | 13 (15%) | 28 (33%) | ||
| Infant BMI z-score | −0.4 (−0.7, −0.1) | −0.5 (−0.9, −0.2) | −0.2 (−0.5, 0.1) | P = 0.51 | |
| Gestational age | 39.2 (37.3, 41.6) | 38.9 (37.1, 40.7) | 39.6 (37.1, 41.6) | P = 0.05 | |
| Intrapartum antibiotics | Yes | 13 (15%) | 10 (12%) | 13 (15%) | P = 0.91 |
| No | 18 (21%) | 11 (13%) | 19 (22%) | ||
| Unknown | 1 (1%) | 0 | 0 | ||
| Postpartum antibiotics | Yes | 1 (1%) | 2 (2%) | 0 | P = 0.25 |
| No | 31 (36%) | 19 (22%) | 32 (38%) | ||
| Location of sample collection | Hospital | 30 (35%) | 20 (24%) | 28 (33%) | P = 0.35 |
| Study visit | 2 (2%) | 1 (1%) | 1 (1%) | ||
| Home diaper | 0 | 0 | 3 (4%) | ||
| Vaginal delivery, no antibiotics, exclusive breastfeeding | Yes | 8 (9%) | 3 (4%) | 8 (9%) | P = 0.61 |
| No | 24 (28%) | 18 (21%) | 24 (28%) | ||
| Feeding type in hospital | Breastfed | 19 (22%) | 14 (16%) | 11 (13%) | P = 0.13 |
| Formula fed | 5 (6%) | 4 (5%) | 9 (11%) | ||
| Mixed | 7 (8%) | 3 (4%) | 12 (14%) | ||
| Feeding type at 1 month | Breastfed | 5 (6%) | 8 (9%) | 8 (9%) | P = 0.19 |
| Formula fed | 12 (14%) | 6 (7%) | 8 (9%) | ||
| Mixed | 15 (18%) | 7 (8%) | 16 (19%) | ||
| Pre-PCR DNA concentration | 0.1 (0, 0.1) | 0.6 (0.1, 1.5) | 1.6 (0.7, 2.6) | P = 10−3 | |
| Fraction of Non-human DNA | 10% (0, 10%) | 0% (0, 10%) | 90% (80, 90%) | P = 10−13 |
Figure 1: Bacterial and human DNA in meconium samples.
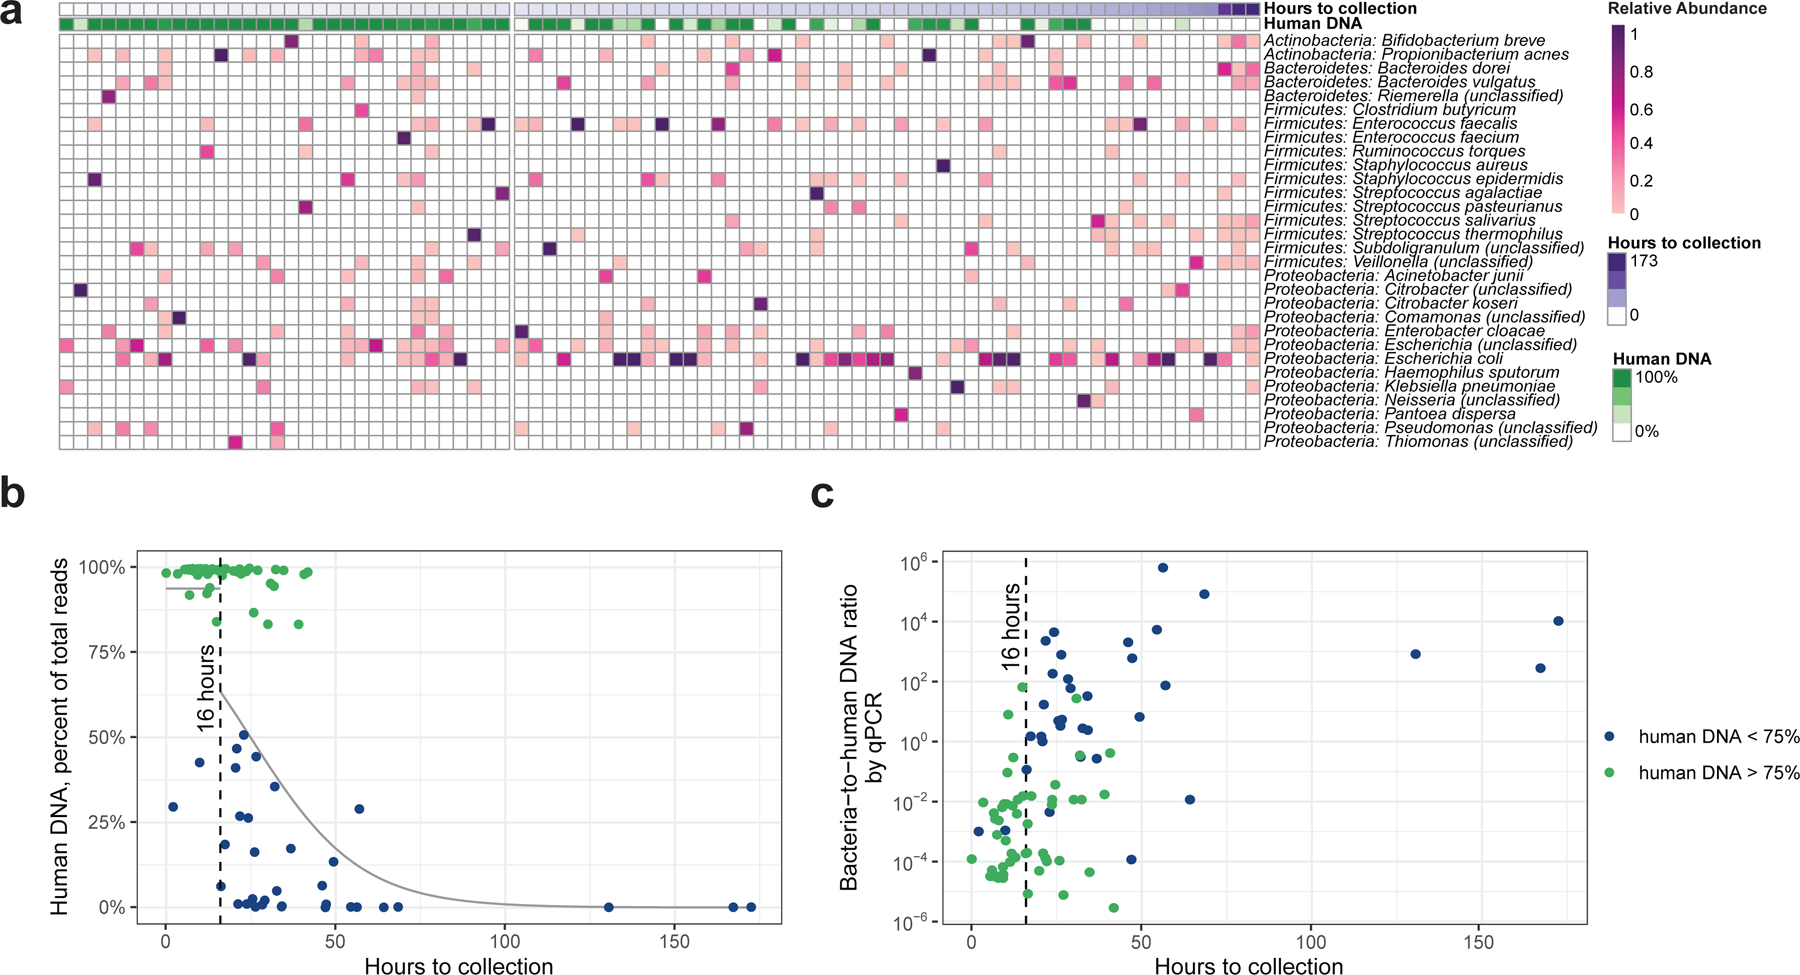
(a) Heatmap of bacterial taxa identified in meconium samples, ordered by time since birth. The gap is positioned at 16 hours. The percentage of human DNA in each fecal sample is indicated at the top. (b) Human DNA percentage as a function of time since birth, showing samples with low levels of human DNA appearing after 16 hours. Grey lines represent the logistic regression estimate on either side of the break point at 16 hours, indicated with a vertical dashed line. (c) Estimation of bacterial-to-human DNA ratio by qPCR.
Fecal samples from the same infants were collected at age 1 month and sequenced to assess the microbiota relative to birth. The number of bacterial species increased at 1 month. The microbiota composition was different by analysis of beta diversity, due to an increased prevalence of Veillonella, Streptococcus, Bifidobacterium, and Enterobacteriaceae (Extended Data Figure 1). Bacterial gene abundance was markedly different at 1 month (Extended Data Figure 2). In particular, glycoside hydrolase genes, used in carbohydrate fermentation, were higher in abundance.
Delivery mode (C-section vs. vaginal delivery) was associated with taxonomic and gene composition at 1 month but not at birth (Extended Data Figure 3). We did not identify any species associated with delivery mode at 1 month, after correction for multiple comparisons. Exposure to breastfeeding in the hospital was not associated with taxonomic or gene composition at birth, but breastfeeding status at 1 month was associated with increased Bifidobacterium (Extended Data Figure 4). We did not observe an effect of maternal obesity, gestational age, or peripartum antibiotics on taxonomic or gene composition at either time point, alone or in combination with delivery mode (Supplementary Figure 2). We analyzed a subgroup of infants from vaginal births with no peripartum antibiotics who were exposed to breastfeeding in the hospital, and found that they behaved similarly to other infants (Supplementary Figure 3).
We sequenced 15 negative control samples to assess sequencing results with no input DNA. Although the total number of reads in negative controls was dramatically lower than the birth samples, the number of reads was not different on average after removal of human DNA (P=0.3, Supplementary Table 1). Species in negative control samples overlapped with some, but not all, of the meconium samples (Extended Data Figure 5). This raised the concern that some species identified in our taxonomic analysis may have been observed even if bacterial DNA was not present in the sample. Therefore, we undertook a more careful investigation of our meconium samples to determine the abundance and identity of organisms present.
Meconium samples collected within 16 hours of birth contain high levels of human DNA.
The proportion of human DNA in meconium samples was bimodally distributed (Gaussian mixture model, P<0.001), with some samples having >80% human DNA, and others having <50% human DNA (Figure 1b). The odds of high human DNA decreased with time since birth (logistic regression, P<0.001). The transition from high to low human DNA occurred earlier in samples collected from vaginal births, relative to samples from C-section births (P=0.002, Supplementary Figure 4). The incidence of labor before C-section did not affect the level of human DNA (P=0.1).
Due to the abrupt change in number of samples with low human DNA over time, we examined whether the probability of high human DNA should be modeled separately at early and late time points (Supplementary Figure 5). We determined that 16 hours constituted a break point (Figure 1c), such that before 16 hours samples were consistently likely to contain high levels of human DNA. After 16 hours, the likelihood of high human DNA dropped and continued to decrease over time.
Using real-time PCR (qPCR), we estimated the ratio of bacterial-to-human DNA present in meconium samples and another set of negative controls (Extended Data Figure 6, Supplementary Table 2). The ratio of bacterial-to-human DNA increased by 1.2 logs per day (P<0.001, Figure 1c). Prior to 16 hours, all but two samples had more bacterial than human DNA by qPCR, whereas samples were evenly divided after 16 hours. Furthermore, samples collected before 16 hours, which exhibited overall high levels of human DNA in sequencing, had a lower bacterial-to-human DNA ratio than samples collected after 16 hours (P<0.001, Extended Data Figure 7). We conclude that the number of bacteria in meconium samples increased over time, and that 16 hours represented a time after which bacterial DNA could increase in concentration to overtake human DNA.
Bacterial strains found in meconium do not exhibit a single genomic signature.
To identify a consistent genomic signature for strains found in meconium samples, we carried out metagenomic assembly and grouped the resultant contigs by bacterial species. We obtained high-quality strain assemblies for 37 meconium samples (Supplementary Table 3). Using an array of 139 single-copy core genes32, we confirmed that a near-complete genome was represented in each sample, and that the assembled contigs did not contain redundant copies of core genes. No high-quality strain assemblies were assembled from negative control samples, suggesting that the assemblies were unlikely to arise from contamination. Thus, we regarded the assembly results as an analytical approach with higher specificity, though potentially modest sensitivity, relative to our taxonomic analysis. Three species were assembled in five or more samples, and subjected to a more detailed analysis: E. coli, E. faecalis, and B. vulgatus.
We assembled E. coli in 17 samples, the most of any species. To determine if multiple strains were present in each sample, we calculated frequencies of sequence polymorphisms over the single-copy core genes. In 10 of 17 samples, the frequencies were consistent with a single underlying nucleotide at each position, taking account of sequencing error (Supplementary Figure 6). After fitting to a Poisson distribution, the estimated rate of sequencing error was λ=10−6. Thus, we had evidence for a single E. coli genome present in 10 of the samples.
In the remaining samples, the nucleotide substitution frequencies were inconsistent with a single genome (Supplementary Figure 7). We assessed whether the frequencies were consistent with two or more underlying gene sequences by applying a beta-binomial model to estimate the rate of substitution at each position. Four samples were consistent with a single rate of substitution, indicating the presence of exactly two unique gene sequences. In the remaining three samples, the nucleotide frequencies were inconsistent with a single substitution rate, implying the presence of three or more unique E. coli genomes.
To place the meconium E. coli strains within the larger context of all E. coli genomes, we compared our assemblies to a set of 269 reference genomes (Figure 2a). The E. coli genomes from meconium were widely dispersed over the phylogenetic tree, and were placed in phylogenetic groups A, B1, B2, and D1 (Figure 2b, Supplementary Figure 8). We analyzed the pan-genome based on presence/absence of accessory genes, and clustered the E. coli genome set into three groups (Figure 2c). Genomes from meconium fell into each group, and were not distributed differently than the reference genomes. A small number of genes with unassigned function were more prevalent in genomes from meconium samples, relative to the reference genomes (Figure 2d). We did not identify a strong genome signature for E. coli strains in meconium, suggesting that many strains can act as pioneers in the neonatal gut, though meconium-specific genes deserve further analysis.
Figure 2: Assembly of E. coli metagenomes from meconium samples.
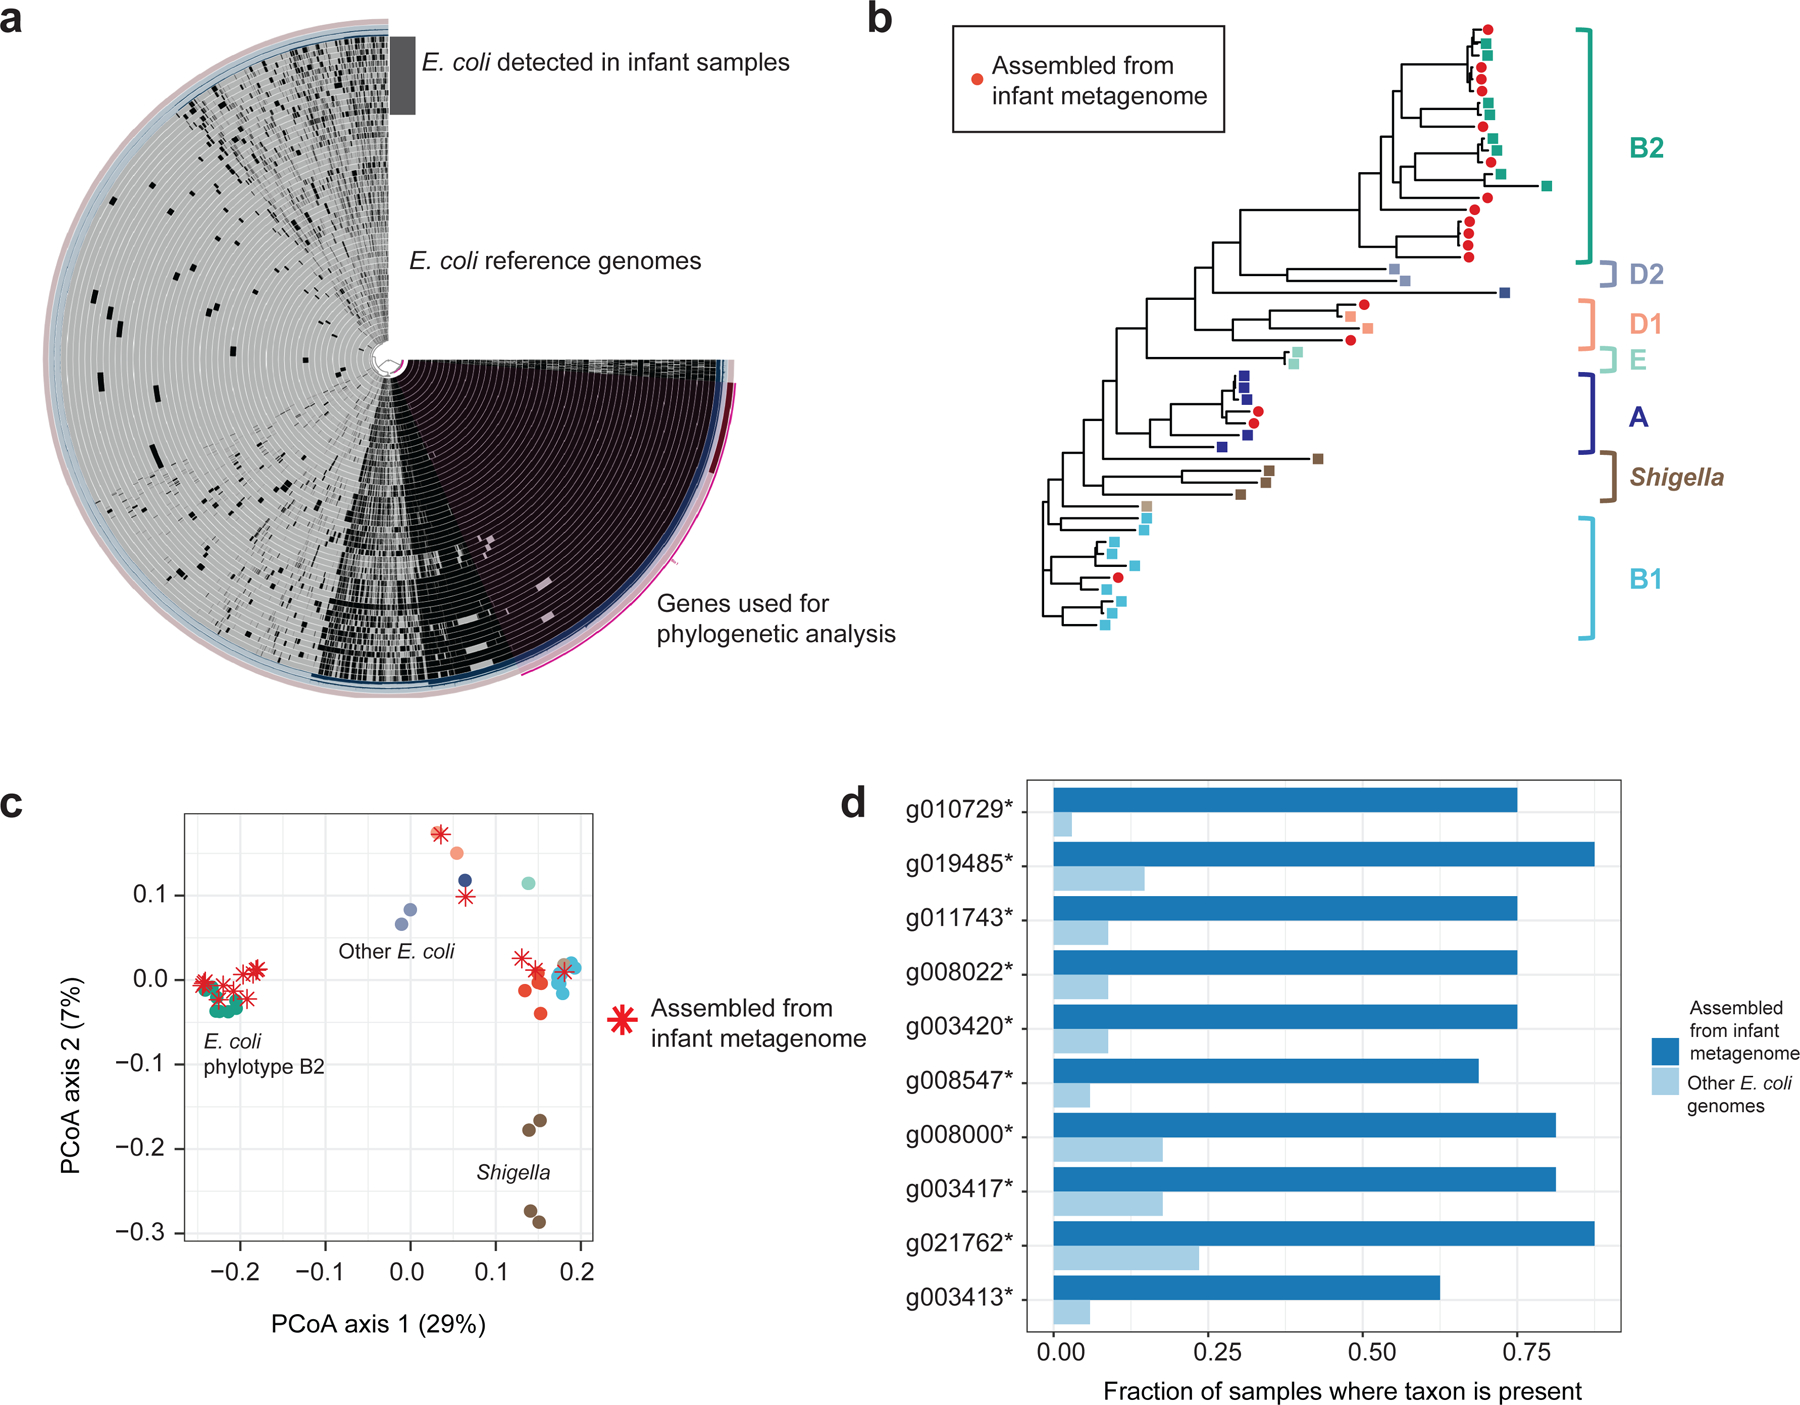
(a) Pan-genome of E. coli detected in meconium, plotted alongside E. coli reference genomes. Each genome is represented as a ring; black areas represent genes present, grey areas represent genes absent. The purple region indicates genes used in the phylogenetic analysis. (b) Phylogenetic tree of E. coli assembled from meconium, showing placement in multiple clades. (c) Principal coordinates ordination of gene content from E. coli pan-genome. (d) Genes found to be more abundant in assemblies from meconium samples. All are of unassigned function. Sample size: n1=17 genomes from this study, n2=33 reference genomes.
Analyses of E. faecalis and B. vulgatus genomes assembled from meconium samples revealed similar results (Supplementary Figures 9 and 10).
The number of bacterial strains in meconium increases with time after birth
We determined the number of unique bacterial core gene sequence sets, an estimate for the number of strains, for each species with high-quality assembly results. Although we were not able to determine the exact number of strains if more than two were present for a single species, only 8 species out of 84 showed evidence for this. The number of bacterial strains increased with time after birth (P<0.001, Figure 3a), accumulating at an estimated rate of 1.2 strains per day (R2=0.46).
Figure 3: Bacterial strains in meconium and their retention at 1 month.
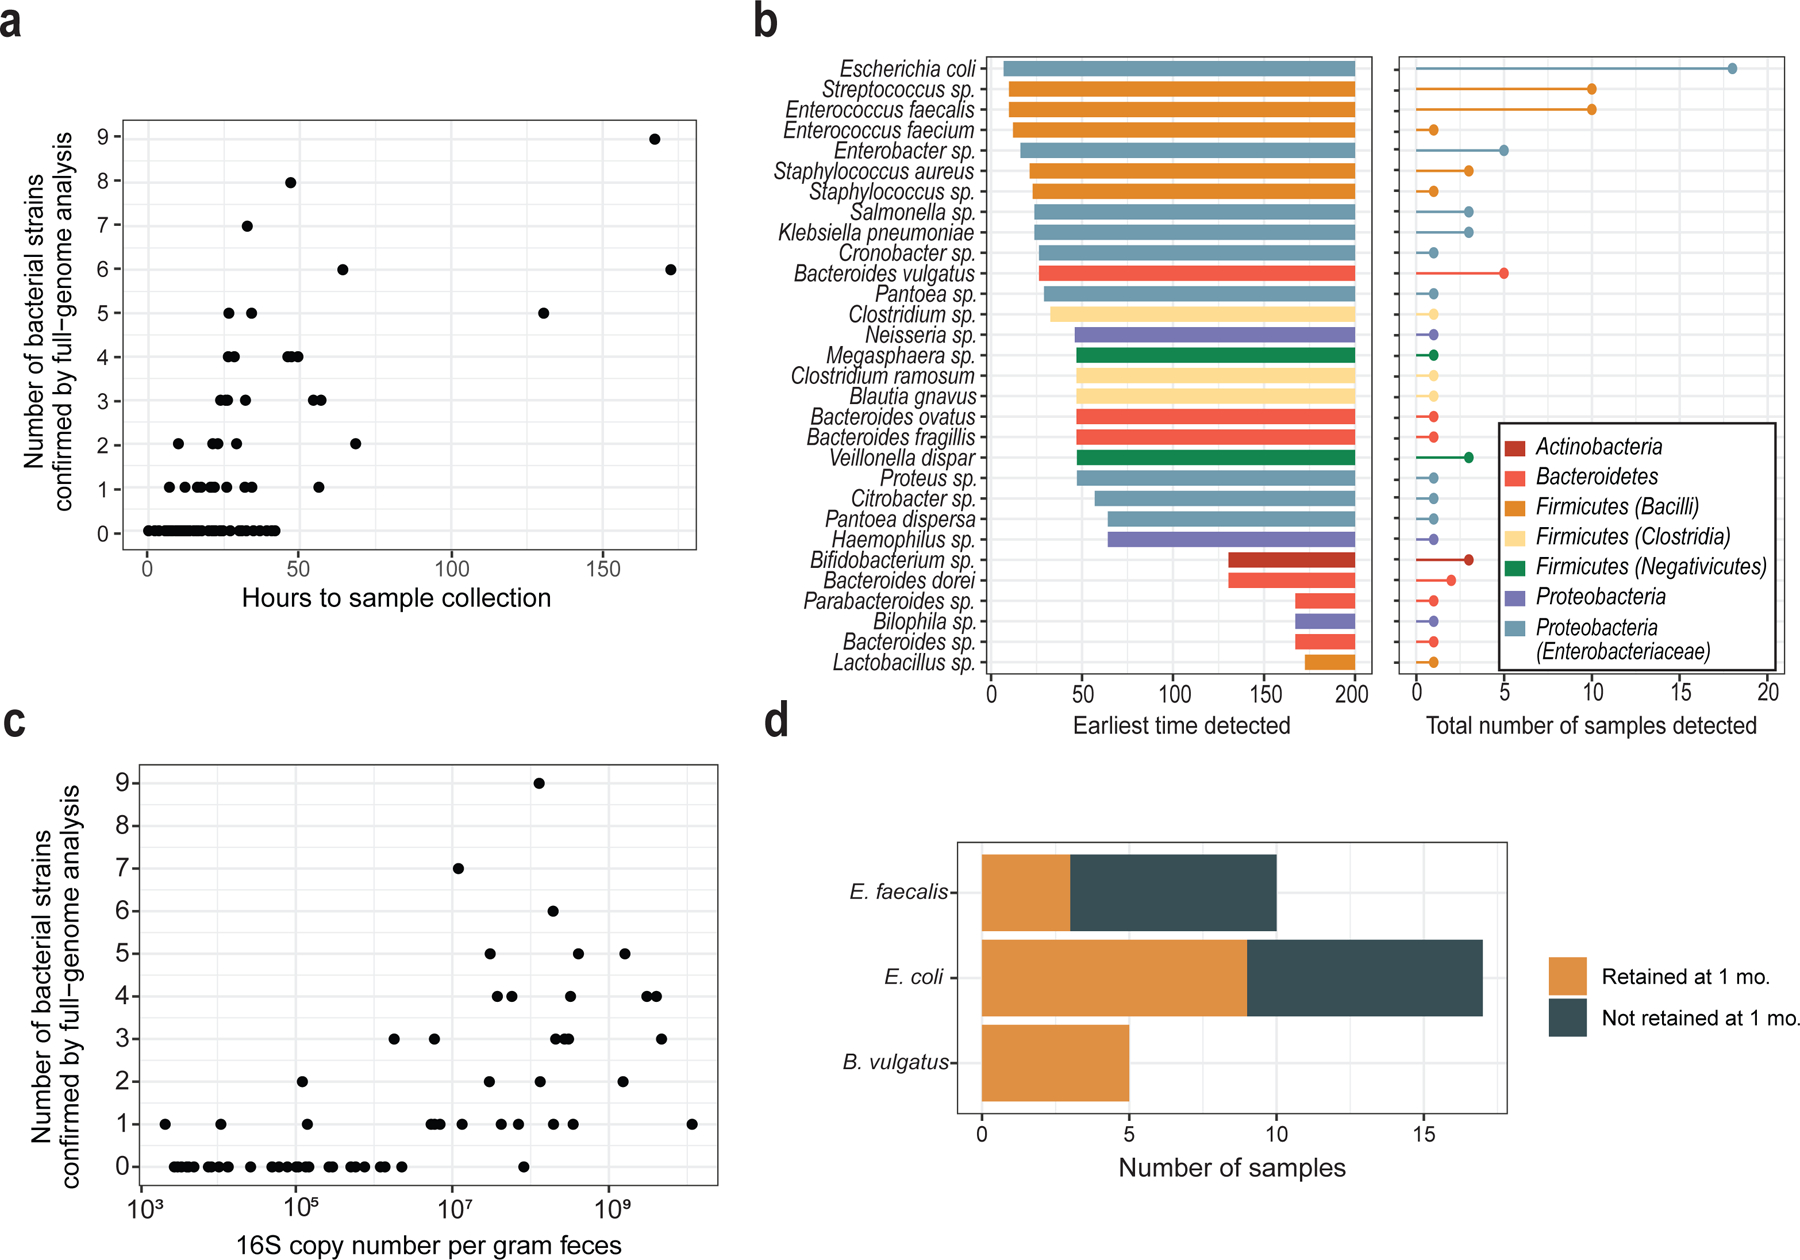
(a) The number of bacterial strains in each sample, as determined by analysis of single-copy core genes in metagenomic assembly results. (b) The time of earliest detection and prevalence of bacterial species in meconium samples. (c) Correlation of bacterial strain number with absolute quantity of bacterial DNA by 16S qPCR. (d) Retention of meconium strains at 1 month.
The earliest species detected were facultative anaerobes from the Enterobacteriaceae and Bacilli, notably Streptococcus and Enterobacter, in addition to E. coli, E. faecalis, and B. vulgatus (Figure 3b). Obligate anaerobes were detected 25 hours after birth, and included B. vulgatus, Clostridia spp., Megasphera, and Veillonella. Bifidobacterium species were found only in samples collected >100 hours after birth.
We were able to assemble high-quality bacterial genomes for only 4 of 26 samples with undetectable levels of 16S gene copies by qPCR, whereas we recovered high-quality assemblies for over half the samples with positive qPCR results (Supplementary Table 4). Conversely, the samples with high-quality assembly results had higher qPCR values than samples where assembly failed (P<0.001), and the number of 16S copies was positively correlated with the number of strains (Spearman’s ρ = 0.7, P<0.001, Figure 3c). Thus, the genome assembly results were consistent with 16S gene copy number.
Retention of strains present in meconium one month later
To determine whether bacterial strains acquired shortly after birth were retained over one month, we again analyzed nucleotide frequencies in the set of single-copy core genes for E. coli, E. faecalis, and B. vulgatus. For each sample, we aligned reads from the 1 month time point to gene sequences assembled from birth samples. Then, we analyzed each position in the alignment to determine if the nucleotide frequencies among reads were consistent with the presence of the nucleotide observed at birth vs. sequencing error alone. We tabulated the number of inconsistent positions for each species in each sample.
For E. coli, 9 of 17 samples from the 1-month time point were consistent with presence of the exact gene sequences assembled in the birth sample (Figure 3d). For E. faecalis, 30% of birth strains were retained at 1 month; B. vulgatus strains were retained in all five subjects. Thus, bacterial strain retention from birth to 1 month was consistent with an underlying rate of approximately 50%, and retention was highest for B. vulgatus.
Alterations in the meconium proteome are associated with the appearance of bacteria after birth.
Having characterized the acquisition of foundational bacterial strains in meconium samples, we sought to understand the biochemical factors underlying their growth. Meconium consists of cellular material, including proteins, that are not expelled in utero and thus accumulate in the gut lumen. Reasoning that the profile of accumulated proteins may be altered by the nascent microbial community, we conducted an untargeted proteomics analysis of the meconium samples.
Using a reference database containing human, E. coli, B. vulgatus, and E. faecalis protein sequences, we identified 1,071 human proteins and 163 bacterial proteins. The relative abundance of bacterial proteins was small, with a mean value of 0.6%, but increased with hours since birth (P=0.01) and with the ratio of bacterial-to-human DNA by qPCR (P=0.01, Figure 4a). Specific bacterial proteins were not correlated with species detected in our taxonomic analysis or genome assemblies, and the overall level did not have a statistically significant correlation with species richness. Alternative approaches utilizing a large reference database or protein sequences drawn from our genome assemblies also yielded a small fraction of bacterial proteins that were uncorrelated with our taxonomic results (Supplementary Figure 11). Further methods development is required to resolve these differences in very early life fecal samples.
Figure 4: Proteomics of meconium samples.
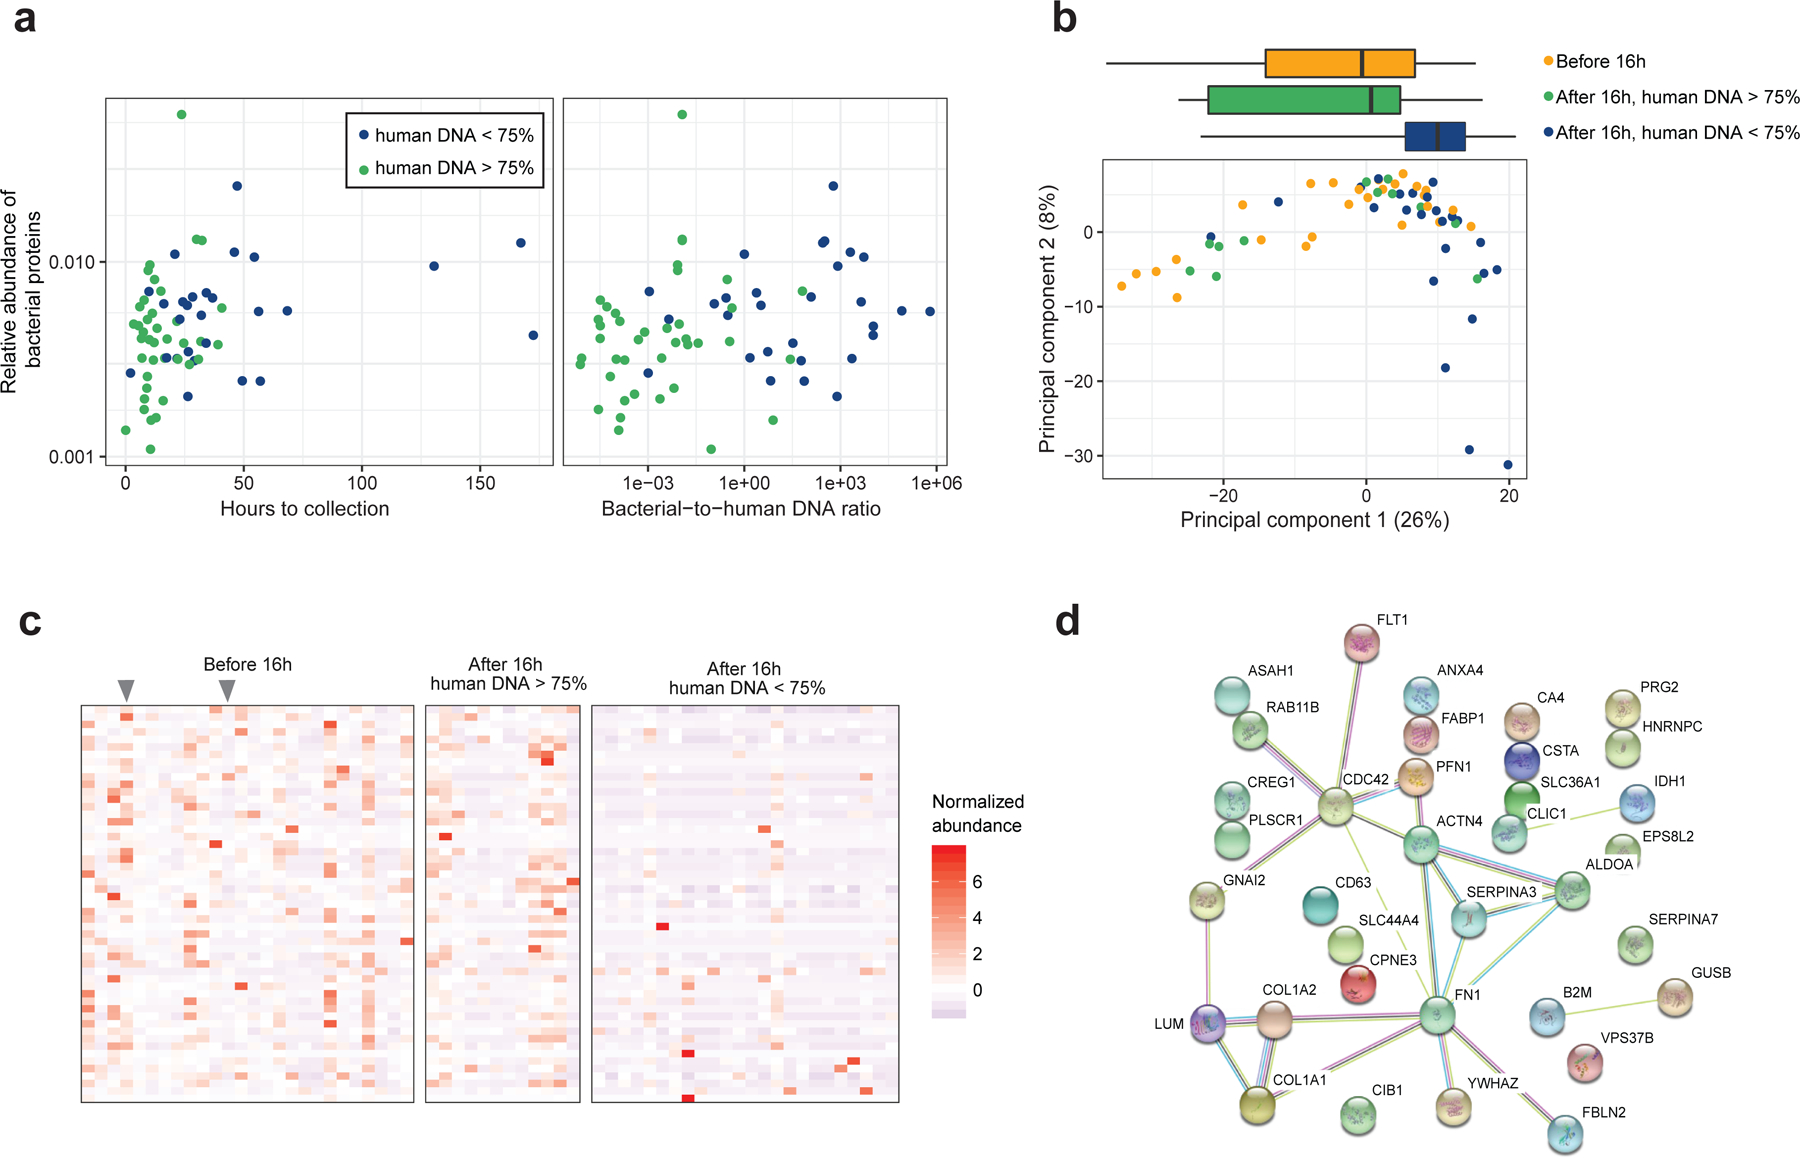
(a) The relative abundance of bacterial proteins increases with time to collection and bacterial-to-human DNA ratio. (b) Principal components analysis of protein concentrations in meconium samples (n1 = 26 before 16h, n2 = 12 after 16h, human DNA > 75%, n3 = 24 after 16h, human DNA < 75%). Boxes above the ordination show the median and interquartile range of groups along the first principal component; whiskers above the ordination extend to the full range of data points. (c) Proteins differing in abundance between the three groups. Grey arrows indicate samples collected before 16 hours with low levels of host DNA. (d) STRING network of differentially abundant proteins. Circles represent proteins. Colored lines connecting proteins indicate interactions from curated databases (cyan), experimentally verified interactions (magenta), and associations based on text mining (yellow), co-expression (black), and homology (slate blue).
We next analyzed human proteins, which constituted the vast majority of proteins in the meconium samples by abundance. A principal components analysis of human protein abundance revealed differences between samples collected after 16 hours with low levels of human DNA and other samples (P<0.001, Figure 4b). Samples collected after 16 hours with high levels of human DNA were not different from samples collected before 16 hours, indicating that time since birth was not correlated with the protein composition when bacterial DNA was low relative to human DNA.
Further analysis identified 53 human proteins that were more abundant in meconium collected before 16 hours than that collected after 16 hours with low levels of human DNA (Figure 4c, Supplementary Figure 12). No proteins were different between samples collected before 16 hours and samples collected after 16 hours with high levels of human DNA, reinforcing the idea that protein abundances changed with presence of detectable microbes, and not time since birth alone. Furthermore, differences between the three groups were not attributable to total protein abundance (P=0.13, Supplementary Figure 13).
To characterize differentially abundant proteins based on known protein-protein interactions, we conducted a protein interaction network analysis (Figure 4d). A substantial number of the proteins reduced with detection of microbes were connected to three nodes: SERPINA3, cell division cycle 42 (CDC42), and fibronectin 1 (FN1). The GTP binding protein CDC42 plays a critical role in the integrity of the intestinal epithelium33,34, and FN1 is an adhesive glycoprotein found in the epithelial basement membrane and connective tissue matrix of the intestine35. The decrease in epithelial-associated proteins may be due to the clearance of proteins that have accumulated in utero during fetal gut development.
Thus, we observed differences in relative protein abundances associated with the detection of bacteria in meconium. The proteomics signature was correlated with the detection of bacteria rather than with time since birth, suggesting that the chemical environment of the gut is modified by the engraftment of bacterial species, involving degradation of human proteins implicated in infant gut development.
Meconium metabolomics reveals differentially abundant features that are predictive of anaerobic microbial metabolism
We next investigated the functional properties of the earliest microbial inhabitants of the human gut. We surveyed the small molecules in meconium and found that samples with high levels of human DNA had similar metabolite profiles. Forty-five metabolites were differentially abundant in samples with microbial colonization and low levels of human DNA (Figure 5a). Several amino acids, including serine and threonine, decreased with the detection of bacteria. Several products of bacterial fermentation increased with the detection of bacteria, including succinate and acetate (Extended Data Figure 8).
Figure 5: Metabolomics of meconium samples and E. coli amino acid utilization.
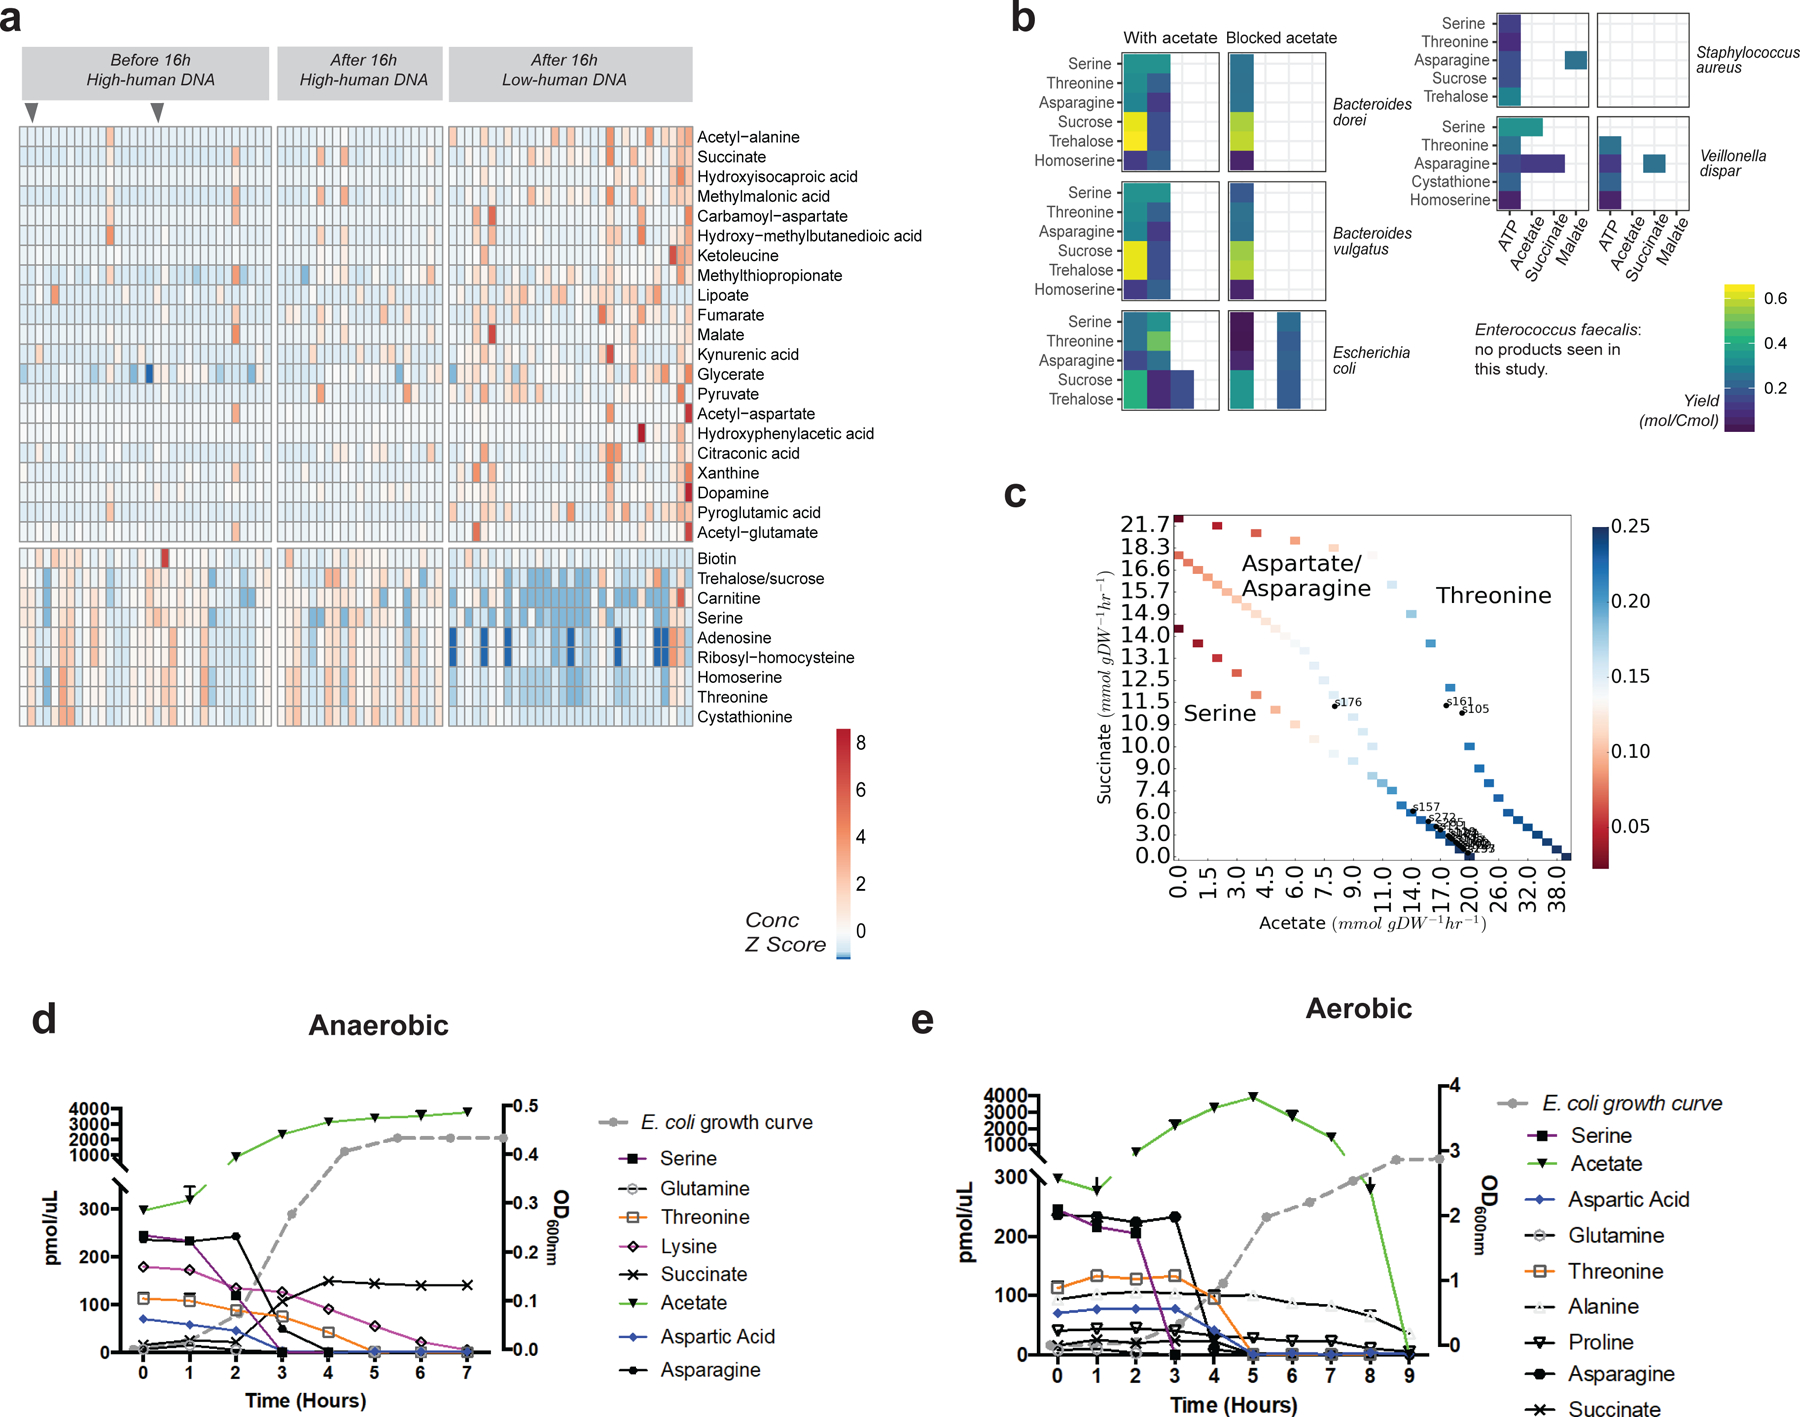
(a) Heatmap of metabolites found to differ in abundance between the three groups. Arrows at top indicate samples collected before 16 hours with low levels of host DNA. The top part of the chart shows metabolites increased in samples collected after 16 hours with low levels of host DNA, such as succinate and pyruvate. The bottom part of the chart shows metabolites decreasing in abundance, such as serine, and threonine. Grey arrows indicate samples collected before 16 hours with low levels of host DNA. (b) Predicted ATP production and metabolite product flux for substrates identified in meconium samples. (c) Predicted amino acid utilization by E. coli at various concentrations of acetate and succinate. (d and e) Amino acid utilization and acetate/succinate production of E. coli grown under (d) anaerobic and (e) aerobic conditions.
We used nutrient flux balance modeling to examine whether metabolite concentration differences could be explained by bacterial metabolism. We modeled six species of bacteria that were detected in two or more samples each, with representatives from Proteobacteria, Firmicutes, and Bacteroidetes (Supplementary Table 5). We computationally identified the maximum ATP yield under anaerobic conditions for seven substrates, and tabulated the amount of 18 molecular products found in our metabolomics results (Figure 5b). Acetate was the primary product in all organisms except Staphylococcus aureus. Succinate was a product for E. coli with several substrates, and for Veillonella dispar with asparagine as a substrate. We blocked acetate efflux to investigate other metabolic products, and found that E. coli and V. dispar produced succinate, while other species produced metabolites such as formate, propionate, and lactate.
To gain further insight on metabolic activity in the newborn gut, we focused on E. coli, which was observed in the greatest number of meconium samples. We reasoned that the pattern of amino acid consumption might provide insight into the mode of bacterial growth, so we computationally identified the maximum ATP yield for each natural amino acid serving as the sole carbon source, and found that serine and threonine gave the highest yield under anaerobic conditions (Supplementary Tables 6 and 7). This matched the metabolomic analysis of meconium. An anaerobic environment was considered likely due to experimentally-observed high succinate levels: in the presence of oxygen, cytochrome oxidase serves as the terminal oxidase in the aerobic respiratory chain of E. coli, while under anaerobic conditions, fumarate (which is reduced to succinate) can serve as a terminal electron acceptor (both in vivo and in silico, Extended Data Figure 9)36,37. A variety of objective functions were tested using amino acids as the sole carbon source (such as maximizing growth or minimizing the total redox potential38); ATP production was found to best replicate the experimentally-observed patterns of metabolite consumption and production.
To further analyze the observed mixed amino acid fermentation, we determined ATP yields at different ratios of acetate-to-succinate production using the nutrient flux model (Figure 5c). By assuming that acetate and succinate detected in the clinical samples was a product of E. coli fermentation alone, the acetate-to-succinate production ratio was estimated for each sample and compared against the ATP yield predicted. In nearly all samples, the metabolism of serine to produce succinate and acetate in the experimentally observed ratios corresponded to the highest ATP yield. Thus, the observed changes in serine, threonine, and succinate levels were consistent with a maximization of ATP yield by E. coli in meconium under anaerobic conditions.
We next sought to further explore the predicted patterns of amino acid metabolism and acetate/succinate production under controlled conditions. We grew E. coli in Luria-Bertani broth and sequentially measured the levels of amino acids in the media via LC-MS/MS. In support of our in silico modeling, E. coli exhibited preferential amino acid use. Serine showed the greatest degree of consumption under anaerobic conditions with a resultant production of acetate as measured by 1H NMR (Figure 5d, Supplementary Figure 14). Threonine, which was also decreased conjunction with the detection of bacteria in meconium (Figure 5a), was also consumed although with slower kinetics than aspartic acid and asparagine, all three of which are also predicted to result in a greater ATP yield when acetate is produced. By contrast, under aerobic conditions, the consumption of amino acids was much more complex, beginning with serine but followed by many other amino acids (Figure 5e), consistent with previous experiments performed in minimal media39. Moreover, the consumption of amino acids under aerobic conditions does not produce succinate, which is inconsistent with our metabolomics results. Thus, the metabolomic profile observed in meconium samples was consistent with anaerobic rather than aerobic growth.
Discussion
We found evidence for a biochemical shift in meconium samples associated with the detection of bacteria by sequencing, summarized in Extended Data Figure 10. Through in silico modeling and culture experiments, we determined that E. coli growth hours after birth was likely occurring under anaerobic conditions. Our findings suggest that the distal gut is anaerobic at birth—contrary to the commonly believed notion that the appearance of facultative anaerobes shortly after birth consume oxygen and facilitate the subsequent engraftment of obligate anaerobes. These results are consistent with our observation that the colonic lumen of germ-free mice is anaerobic likely due to chemical reactions involving lipid oxidation40.
Further work is needed to assess how well these results generalize to larger human populations, and to further characterize the influence of birth mode and postpartum antibiotics. This study employed molecular approaches, and it is likely that microscopy and culture-based approaches will yield additional insight. Our study did not include kit-only negative controls, and we may not have recovered DNA from all microbial species present. In total, our results provide evidence for the dynamic interaction between bacteria and their chemical environment just after birth.
Methods
Subjects and sample collection
Study participants were enrolled in the Infant Growth and Microbiome (IGram) Study, a prospective, longitudinal cohort study of pregnant African American women and their infants. The study protocol was reviewed and approved by the Committee for the Protection of Human Subjects (Internal Review Board) of the Children’s Hospital of Philadelphia, with number 14–010833. Informed consent was obtained from study subjects.
Women were enrolled in the third trimester if they had a pre-pregnancy BMI recorded by 18 weeks that was <25 kg/m2 (healthy weight group) or ≥30 kg/m2 (obese group). Other exclusion criteria for mothers included: routine ingestion of probiotics or dietary supplements, medical conditions associated with obesity or glucose regulation, uncontrolled thyroid disease, treatment with lithium or atypical antipsychotic medications, treatment with medications known to affect weight and/or insulin sensitivity (ex. chronic steroids), immunosuppressant drugs, steroids to maintain pregnancy, chronic inflammatory or autoimmune disease, or pregnancy with twins or other multiples. Infants were eligible if they were: delivered at >37 weeks gestation, not small-for-gestational age, did not have major congenital malformations Other exclusion criteria for infants included: known major fetal abnormality noted on ultrasound, IUGR at less than 5th percentile, chromosomal anomaly, or significant illness that affected growth and development.
Mothers were provided with stool collection materials, including a cooler. Meconium/stool samples were collected within the first four days following birth. They were stored in the cooler on dry ice until they were transferred to the laboratory to be aliquoted and frozen at −80ºC. The sample collection location and time of storage for each sample is noted in Supplementary Table 1. At the 1 month visit, mothers were again provided with stool collection and shipping materials. Infant stool samples were collected at home and stored on dry ice. These samples were brought in or shipped for aliquoting and storage at −80ºC within 48 hours of collection.
At birth, delivery and health information was abstracted from the medical record. Other information was obtained by maternal interview. The feeding mode in the hospital after birth was reported by mothers at their one-month visit (breastfeeding only, both breast and formula feeding, formula feeding only). The time of first breastfeeding relative to sample collection was not recorded. The day of first formula feeding was reported by mothers at their one-month visit. We did not record whether the birth samples represented first-pass meconium or a subsequent early fecal sample. We did not record information on fecal consistency at the time of collection.
Shotgun metagenomic DNA sequencing
DNA was extracted from fecal and negative control samples using the PowerSoil-htp kit (MO BIO Laboratories, Carlsbad, CA), following the manufacturer’s instructions, with the optional heating step included. (MO BIO has since been purchased by QIAGEN; the extraction kit is now sold as the DNeasy PowerSoil HTP 96 Kit.) Shotgun libraries were generated from 1 ng of DNA using the NexteraXT kit (Illumina, San Diego, CA, USA). Libraries were sequenced on the Illumina HiSeq using 2×125 bp chemistry in High Output mode.
Fifteen negative control samples were included: one sample of unsoiled diaper (diaper blank), five unused swab tip samples (blank swabs), and nine samples of DNA-free water added to the NexteraXT library preparation kit instead of DNA (library negative controls). Negative controls for the sequencing kit without DNA-free water were not included.
Quantitative PCR
A quantitative PCR (qPCR) assay targeting the 16S rRNA gene was used to estimate bacterial abundance. Reactions were performed in triplicate with TaqMan(TM) Fast Universal PCR Master Mix (Thermo Fisher Scientific, Waltham, MA) using the following conditions: 20 s at 95C followed by 40 cycles of 3 s at 95C and 30 s at 60C. Primer sequences were 5’-AGAGTTTGATCCTGGCTCAG-3’ and 5’-CTGCTGCCTYCCGTA-3’. The probe sequence was 5’-TAACACATGCAAGTCGA-3’. A plasmid containing the full length 16S rRNA gene from Streptococcus was used to generate the standard curve.
A second qPCR assay was carried out to quantify the absolute abundance of human DNA. We targeted the human beta-actin gene using the Hs03023880_g1 TaqMan Gene Expression Assay (Thermo Fisher Scientific). Reactions were performed in triplicate with TaqMan™Fast Universal PCR Master Mix using the following conditions: 20 s at 95C followed by 40 cycles of 3 s at 95C and 30 s at 60C. A standard curve was generated using TaqMan™ Control Genomic DNA (human) from Thermo Fisher Scientific.
The ratio of bacterial-to-human DNA was calculated as follows. For samples where the 16S or beta-actin qPCR fell below the limit of detection, a value of 1/10 the minimum detected copy number was used as a replacement. Then, we converted to total amount of DNA using the human genome size of 3,234 Mbp, and an approximate value of 5 Mbp for bacterial genome size. We did not attempt to correct for the number of 16S gene copies per bacterial genome.
A separate set of negative control samples were used in the quantitative PCR assays: two samples of DNA-free water, one blank pipette tip, one piece of blank weighing paper. In addition, two assays were carried out without adding any DNA or DNA-free water to the reaction.
Metabolomics
Meconium samples (50 mg) were mixed with 80% methanol containing 5 μM chlorpropamide and homogenized (Precellys, Bertin Technologies, Rockville, MD) at 6500 rpm, 2 cycles, 30 s, with 1.0 mm diameter zirconia/silica beads (BioSpec, Bartlesville, OK). The supernatants were evaporated to dryness and analyzed by LC-MS using a modified version of an ion pairing reversed phase negative ion electrospray ionization method41. Samples (10 uL) were separated on a Phenomenex (Torrance, CA) Hydro-RP C18 column (100 × 2.1 mm 3 um particle size) using a water/methanol gradient with tributylamine and acetic acid added to the aqueous mobile phase. The LC-MS system consisted of a Dionex Ultimate 3000 quaternary HPLC pump, a Dionex 3000 column compartment, a Dionex 3000 autosampler, and an Exactive plus Orbitrap mass spectrometer controlled by Xcalibur 2.2 software (all from Thermo Fisher Scientific, Waltham, MA). The HPLC column was maintained at 30°C, and at flow rate of 200 μl/min. Solvent A was 3% aqueous methanol with 10 mm tributylamine and 15 mm acetic acid; solvent B was methanol. The gradient was 0 min, 0% B; 5 min, 20% B; 7.5 min, 20% B; 13 min, 55% B; 15.5 min, 95% B; 18.5 min, 95% B; 19 min, 0% B; and 25 min, 0% B. The Exactive plus was operated in negative ion mode at maximum resolution (140,000) and scanned from m/z 72 to m/z 1000 for the first 90 sec and then from m/z85 to m/z 1000 for the remainder of the chromatographic run. The AGC target was 3× 10⁶ with a maximum injection time of 100ms, the nitrogen sheath gas was set at 35, the auxiliary gas at 10 and the sweep gas at 1. The capillary voltage was 3.2kV and both the capillary and heater set at 200°C, the S-lens was 55. Metabolites were identified based on retention time and accurate mass using MAVEN software42.
E. coli culture supernatants were extracted with 80% methanol containing 50 μM stable isotopes as internal standards including isoleucine (13C6, 15N), alanine (2,3-13C2), aspartic acid (U-13C4, 15N), glutamine (U-13C5, U-15N2), and succinic acid (1,4-13C2). A Waters ACQUITY™ Ultra Performance Liquid Chromatography system (Waters Corporation, Milford, USA) coupled with a triple quadrupole mass spectrometer (Waters Xevo TQD) was used for UHPLC-MS/MS analysis. Hydrophobic interaction liquid chromatography (HILIC) was achieved on an Acquity UHPLC ™ BEH amide column (2.1*100 mm I.D., 1.7 μm) with solvent A (20 mM ammonium acetate in 90% H2O/ACN) and solvent B (20 mM ammonium acetate in 90% ACN/H2O). The MS was operated in both positive and negative mode. The instrument parameters were as follows: capillary voltage: 2500 V (positive mode) and 2000 V (negative mode); desolvation temperature: 450°C; source temperature: 250°C; cone gas flow: 150 L/h; and, desolvation gas flow: 1000 L/h. Data were processed with MassLynx 4.1 software (Waters) using standard curves of each amino acid. 1H NMR analysis of the E. coli culture supernatants were performed as previously described43.
Bioinformatics analysis
Paired-ends reads from metagenomics shotgun sequencing were processed using the Sunbeam pipeline v1.0.044. Sequence reads were quality-filtered and Illumina adapter sequences were removed using Trimmomatic v0.3345. Low complexity reads that fell below the default threshold were marked and removed using Komplexity v0.3.044. Reads that aligned to the human genome (hg38) or to the genome of phage phiX (which is used in sequencing library prep) using BWA v0.7.346 were removed. With the remaining read pairs, we carried out taxonomic classification using MetaPhlAn v2.0 (MetaPhlAn2)47.
To characterize bacterial genomes in the data set, we carried out de novo assembly of reads for each sample using MEGAHIT v1.048. Sequence reads were mapped back to the contigs to assess coverage. Contigs longer than 2kbp were searched against the nt database. The top hit was used to generate the taxonomic assignment for the contig sequence and to group contigs for further analysis. High quality reference genomes for E. coli, E. faecalis, and B. vulgatus were downloaded from the RefSeq genome collection at NCBI. We used Anvi’o49 v4 to build a phylogenetic tree for each species based on the shared single-copy core gene sets (protein clusters). PanPhlAn v1.2.250 was used to build the pan-genome by identifying which genes were present or absent within different strains of a species. Jaccard distance compares samples based on shared gene family clusters membership and visualized using PCoA plot.
To estimate the number of strains for each sample, we first assessed the number of complete bacterial genomes. A core set of single-copy genes was used to assess the number of complete bacterial genomes in each sample51. Genome completeness was assessed by the number of single-copy genes obtained, and the number of genomes was estimated by the number of unique single-copy gene sequences.
Proteomics analysis
Meconium samples were weighed and re-suspended in a lysis buffer (80 M urea, 0.1 M NaCL, 25 mM tris(hydroxymethyl)aminomethane, pH=8.0, 10 μL buffer/mg sample) supplemented with protease and phosphatase inhibitors and sonicated on ice for 10 s followed by three freeze-thaw cycles. The insoluble portion was removed by centrifugation and the supernatant was assayed for protein content using Bradford assay. About 20 μg of protein was reduced with 10 mM dithiothreitol for 30 min at 60°C and then the newly exposed thiols were alkylated with 50 mM iodoacetamide for 40 min at room temperature in the dark. Subsequently, the protein samples were diluted 5 fold using 50 mM Tris buffer (pH=8.0) and digested with trypsin overnight at 37°C at a 1:20 mass ratio. The digested peptides were acidified to pH=2 and desalted before further analysis. De-salted peptides were separated by Easy nLC™-1000 liquid chromatography system (Thermo Scientific) using 75 μm i.d. × 20 cm fused silica columns packed in house with ReproSil-Pur 120 C18-AQ (3 μm). Peptides were eluted using a gradient of acidified (0.1% formic acid) water and acetonitrile.
Mass spectrometry data were acquired on a Thermo Scientific™ Orbitrap Elite™ Hybrid Ion Trap-Orbitrap Mass Spectrometer using positive-ion mode and data-dependent MS acquisition. Peptides were scanned over a range of 350–1,200 m/z at a resolution of 100,000, and the top 10 most intense precursor ions were fragmented by collision-induced dissociation at a normalized collision energy of 35 followed my mass analysis in the ion-trap.
The spectra were searched against human and bacterial proteome using Proteome Discoverer™ software (Thermo Scientific), with a false discovery rate < 0.01. Carbamidomethylation and oxidation were set as dynamic modification during peptide searches. A targeted bacterial protein database was constructed using reference protein sequences from E. coli (RefSeq assembly GCF_001280385.1), B. vulgatus (GCF_001931845.1), and E. faecalis (GCF_000403235.1). As an alternative approach, we used protein sequences converted from nucleotide sequences in the open reading frames of our bacterial genome assembly results. As a second alternative approach, we used a microbial protein database downloaded from an integrated reference catalogue of the human gut microbiome52. The human protein database was obtained from UniProt53. Sequential database searches were performed following the method published by Zhang et al.54.
A protein-protein interaction network was constructed using STRING55.
Statistical analysis
The Mann-Whitney test was used for comparisons between groups, Spearman correlation was used to test for association between continuous variables, and Fisher’s exact test was used to test for a difference in presence/absence between groups, unless otherwise noted. A Wilcoxon signed-rank test was used to compare microbial richness, number of genes, and gene abundances between birth and 1 month. The PERMANOVA test56 was used to test for group differences in beta diversity. For the comparison of birth and 1 month samples, the permutations were restricted to exchange samples only within a subject.
A two-component Gaussian mixture model with equal variance was used to identify samples with low vs. high human DNA. Parametric bootstrapping was performed to evaluate the statistical significance of a two-component model. We used logistic regression to determine the relationship between fraction of human reads and time since birth. The segmented regression was conducted using a custom function to evaluate a range of breakpoints and optimize the total sum of squared residuals. Correlation of human DNA levels with clinical variables was conducted using a Kruskal-Wallis test or a test of Spearman correlation, as appropriate.
For analysis of bacterial genomes, we used hierarchical clustering with complete linkage to identify groups of genomes based on presence/absence of genes in the pan genome. We tested for genes differentially present or absent in samples using Fisher’s Exact Test. The number of bacterial strains was compared to time since birth using linear regression. The comparison of qPCR values against samples with some vs. no assembly results was performed with a Mann-Whitney test. The correlation of strain number and 16S copy number was assessed with a test of Spearman correlation.
The comparison of protein composition was performed using a linear model along the first principal component. Protein and metabolite abundance were compared among sample groups using a Mann-Whitney test.
Where multiple comparisons were made, we used the Benjamini-Hochberg method to control for a false discovery rate of 5%57. Two-sided tests were employed, except the tests for correlation between gene abundance and richness in Supplementary Figure 1b, and the test for increased Bifidobacterium abundance in Extended Data Figure 4c.
Extended Data
Extended Data Fig. 1. Microbiota differences between birth and 1 month.
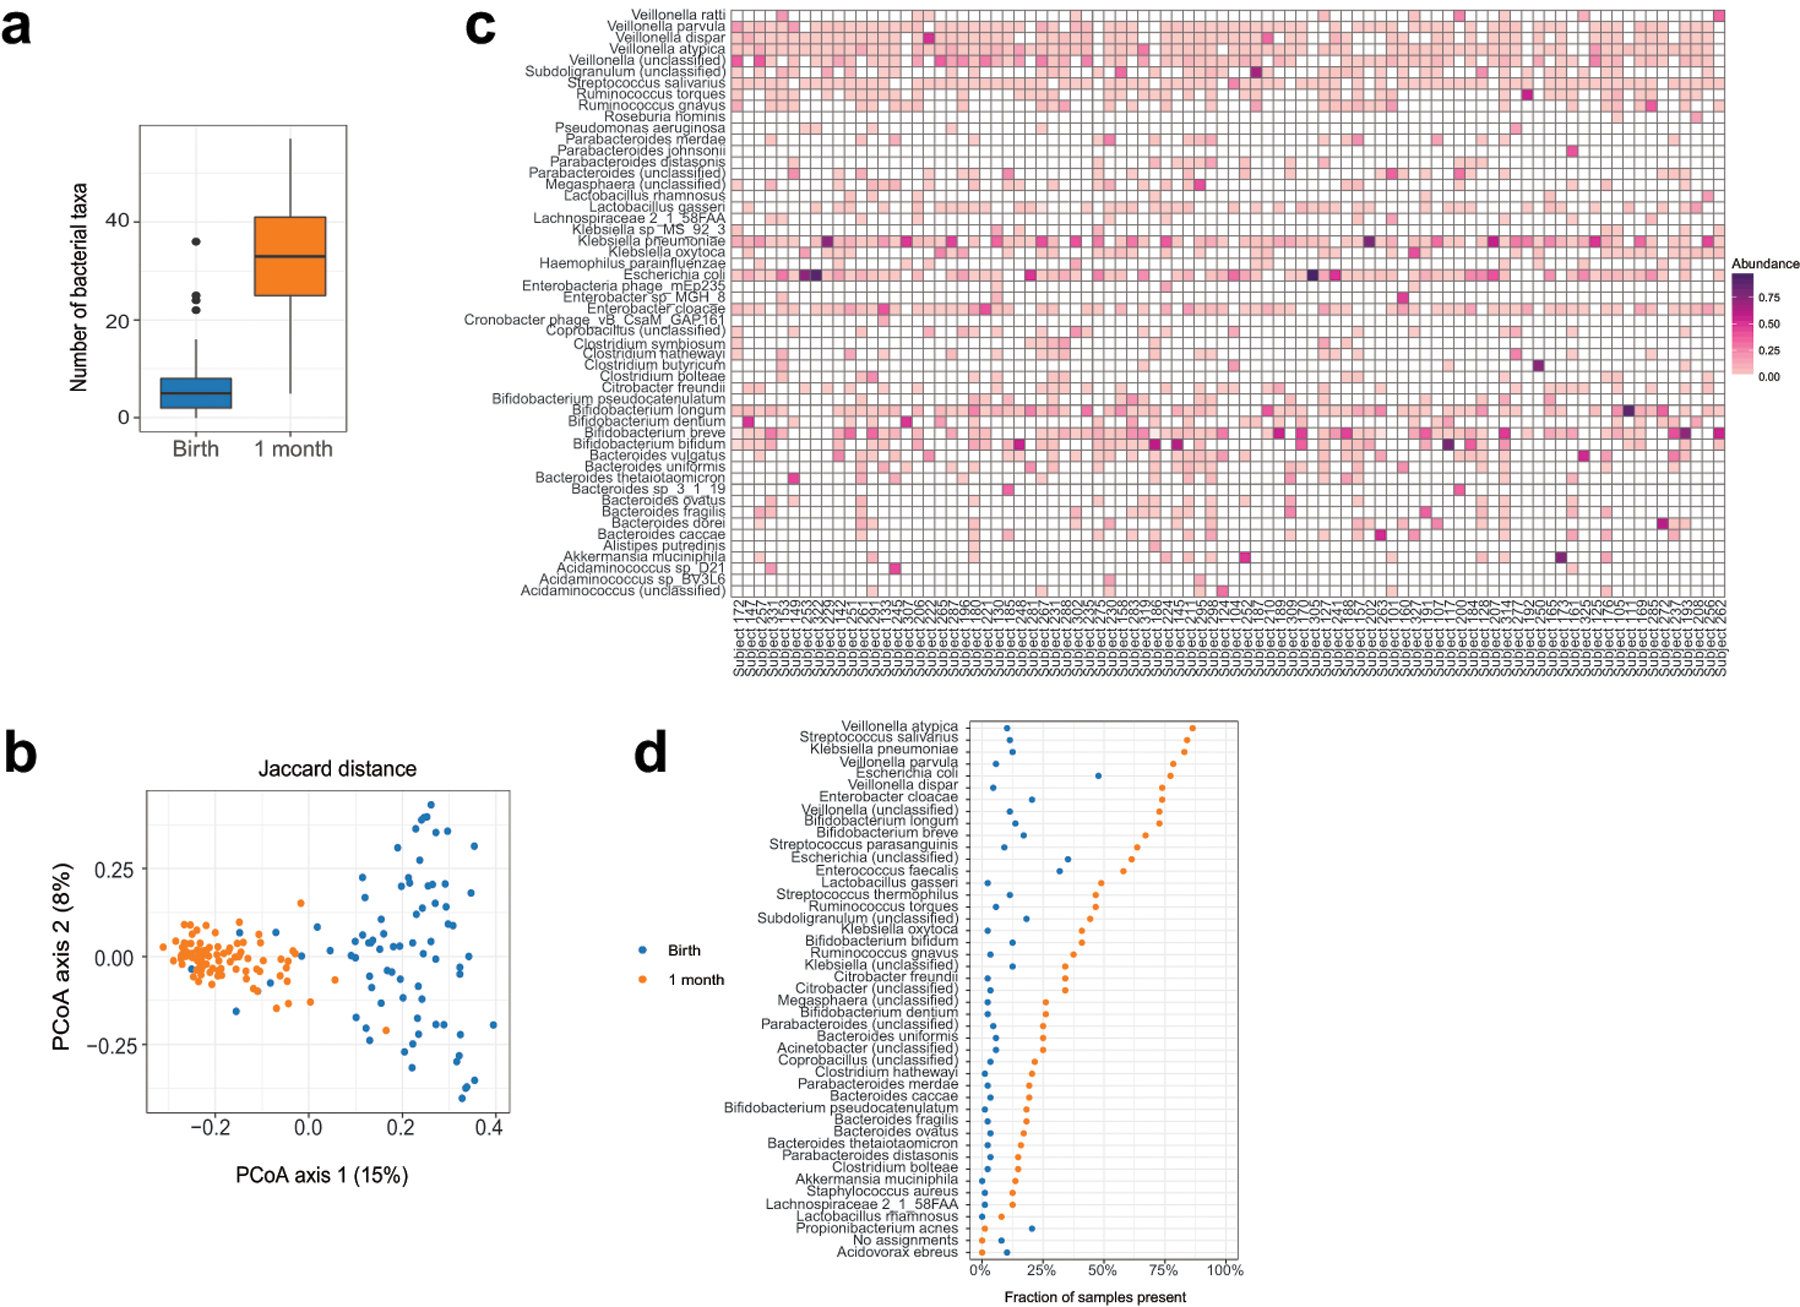
(a) The number of bacterial species increased in the 1 month samples (P = 8×10⁻¹⁶, two-sided Wilcoxon signed-rank test, n = 88 per group). Boxes indicate the median and interquartile distance, whiskers indicate maximum and minimum data points within 1.5 times the interquartile range, points represent values outside this range. (b) The identity of bacterial species was different in samples at 1 month, as quantified by Jaccard distance (R2 = 0.09, P = 0.001, PERMANOVA test with restricted permutations, n1 = 81 samples from birth, n2 = 88 samples from 1 month, 7 birth samples excluded due to no taxonomic assignments). (c) Heatmap of taxa detected in samples collected at 1 month. Taxa were included if the relative abundance was greater than 10% in any sample. (d) Prevalence of bacterial taxa in samples collected at birth and 1 month. Taxa shown were determined to be differentially present or absent by Fisher’s exact test, P < 0.05 after correction for false discovery rate (n = 88 per group, 482 taxa tested, two-sided test).
Extended Data Fig. 2. Abundance of bacterial gene orthologs at birth and 1 month.
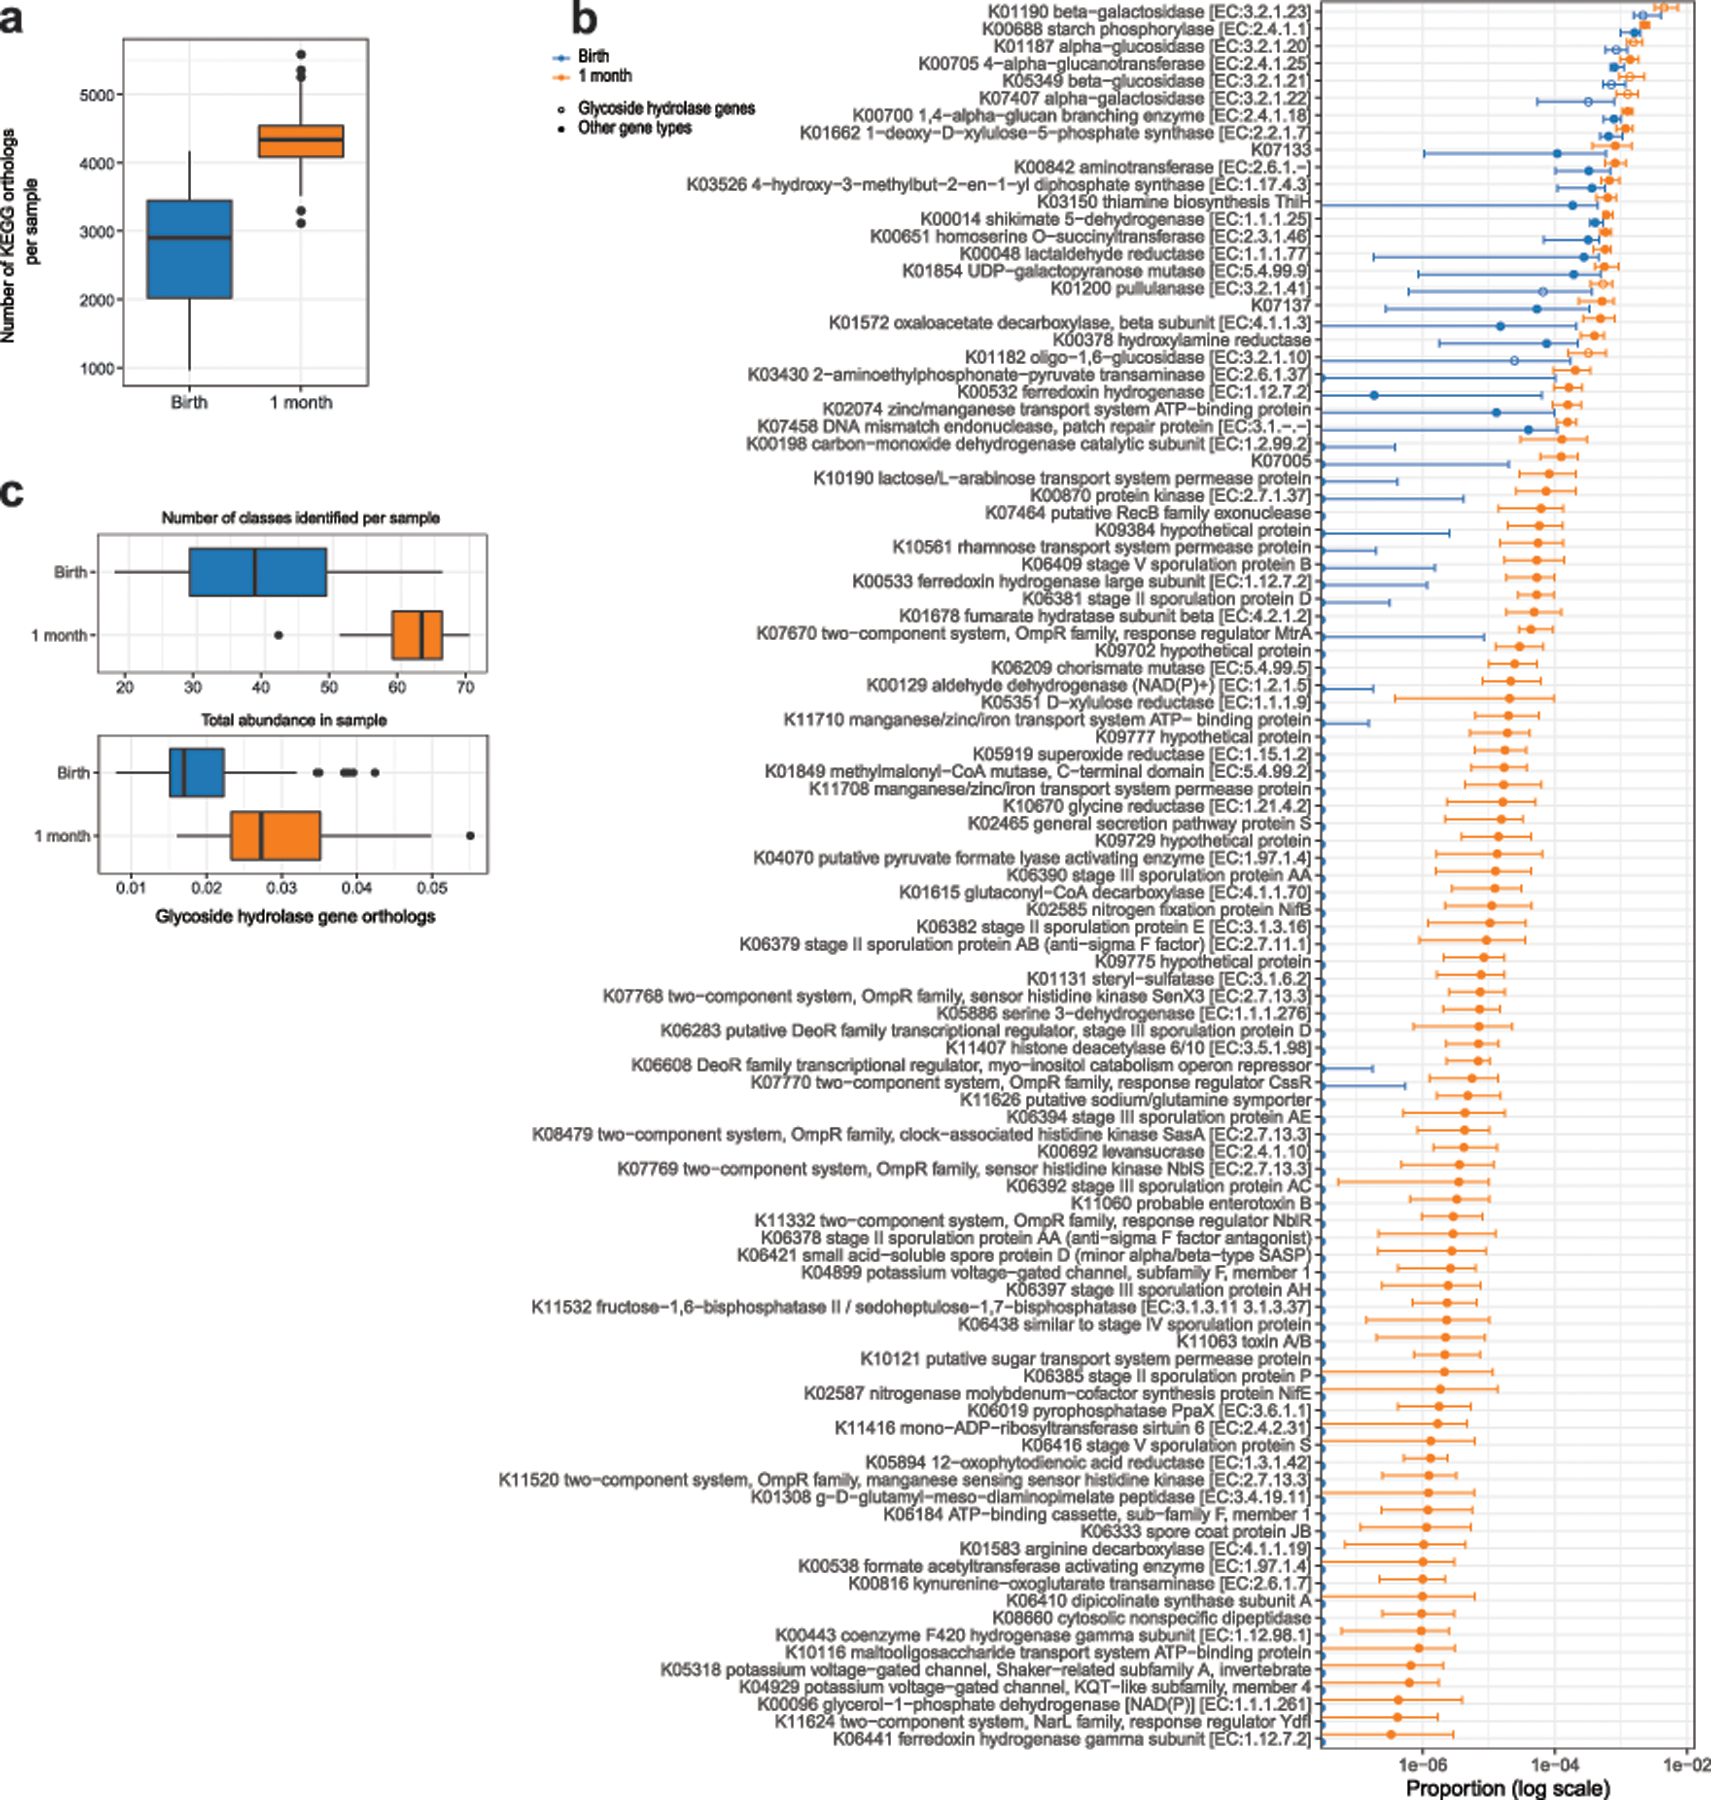
. (a) The total number of KEGG gene orthologs per sample was higher at 1 month relative to birth (P = 9×10⁻¹⁶, two-sided Wilcoxon signed-rank test, n = 88 per group). (b) Genes increasing in abundance at 1 month relative to birth (top 100 shown, P < 0.001 after correction for false discovery rate, two-sided Wilcoxon signed-rank test, n = 88 per group). Points show the median value, error bars show the interquartile range. (c) The number of glycoside hydrolase gene types per sample (P = 9×10⁻¹⁶) and total abundance of glycoside hydrolase genes (P = 7×10⁻¹³) in each sample increased from birth to 1 month (two-sided Wilcoxon signed-rank test, n = 88 per group). Boxes indicate the median and interquartile distance, whiskers indicate maximum and minimum data points within 1.5 times the interquartile range, points represent values outside this range.
Extended Data Fig. 3. Correlation of microbiota with mode of delivery.
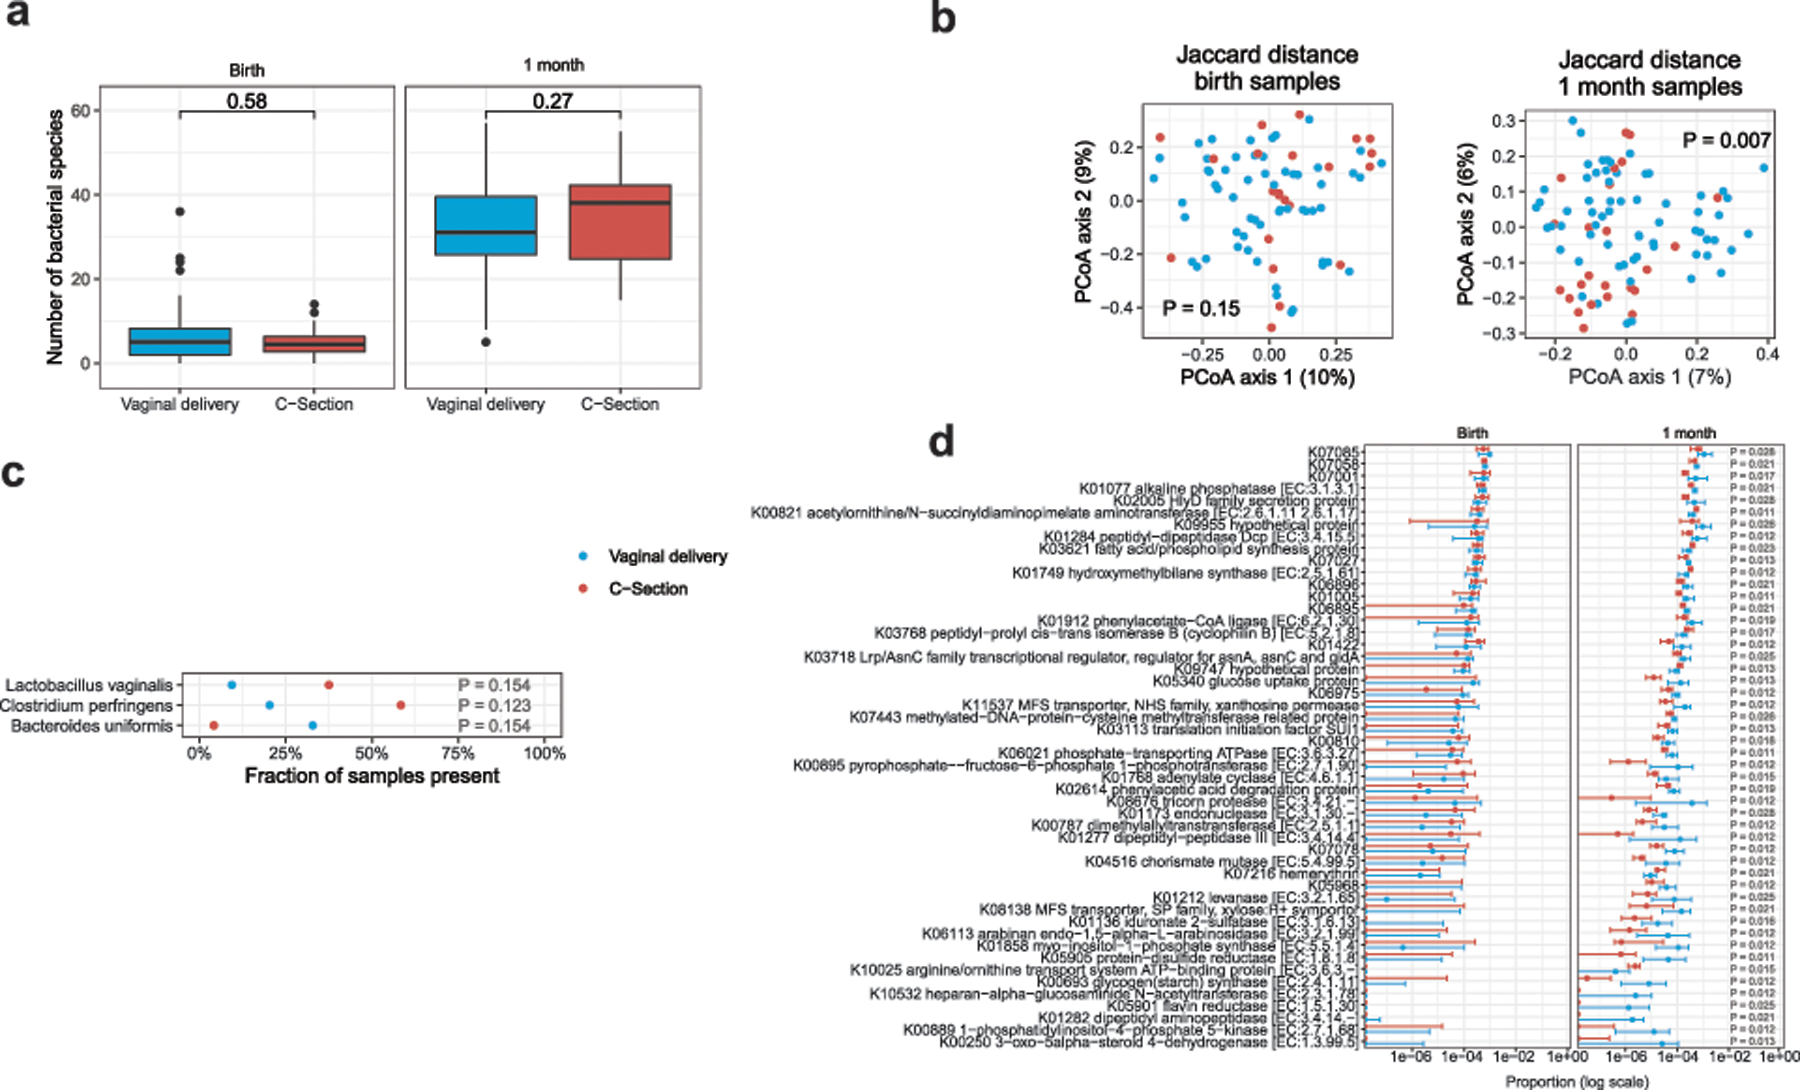
(a) The mode of delivery was not associated with differences in the number of bacterial species per sample at birth or 1 month (two-sided Mann-Whitney test). (b) The mode of delivery had a small effect on the composition of bacteria present at 1 month, as measured by Jaccard distance (R2 = 0.02, PERMANOVA test), but no effect at birth. (c) Several taxa differed in prevalence according to mode of delivery at 1 month, but were not statistically significant after correction for multiple comparisons (two-sided Fisher’s exact test). No taxa differed in abundance at either time point (two-sided Mann-Whitney test). (d) KEGG gene orthologs associated with mode of delivery in 1 month samples (two-sided Mann-Whitney test, P < 0.05 after correction for false discovery rate). Points with error bars in (d) indicate the median and interquartile range. Boxes in (a) and (c) indicate the median and interquartile distance, whiskers indicate maximum and minimum data points within 1.5 times the interquartile range, points represent values outside this range. Sample size in all tests was n1 = 64 vaginal birth, n2 = 24 c-section.
Extended Data Fig. 4. Association of breastfeeding with bacterial taxa and gene function.
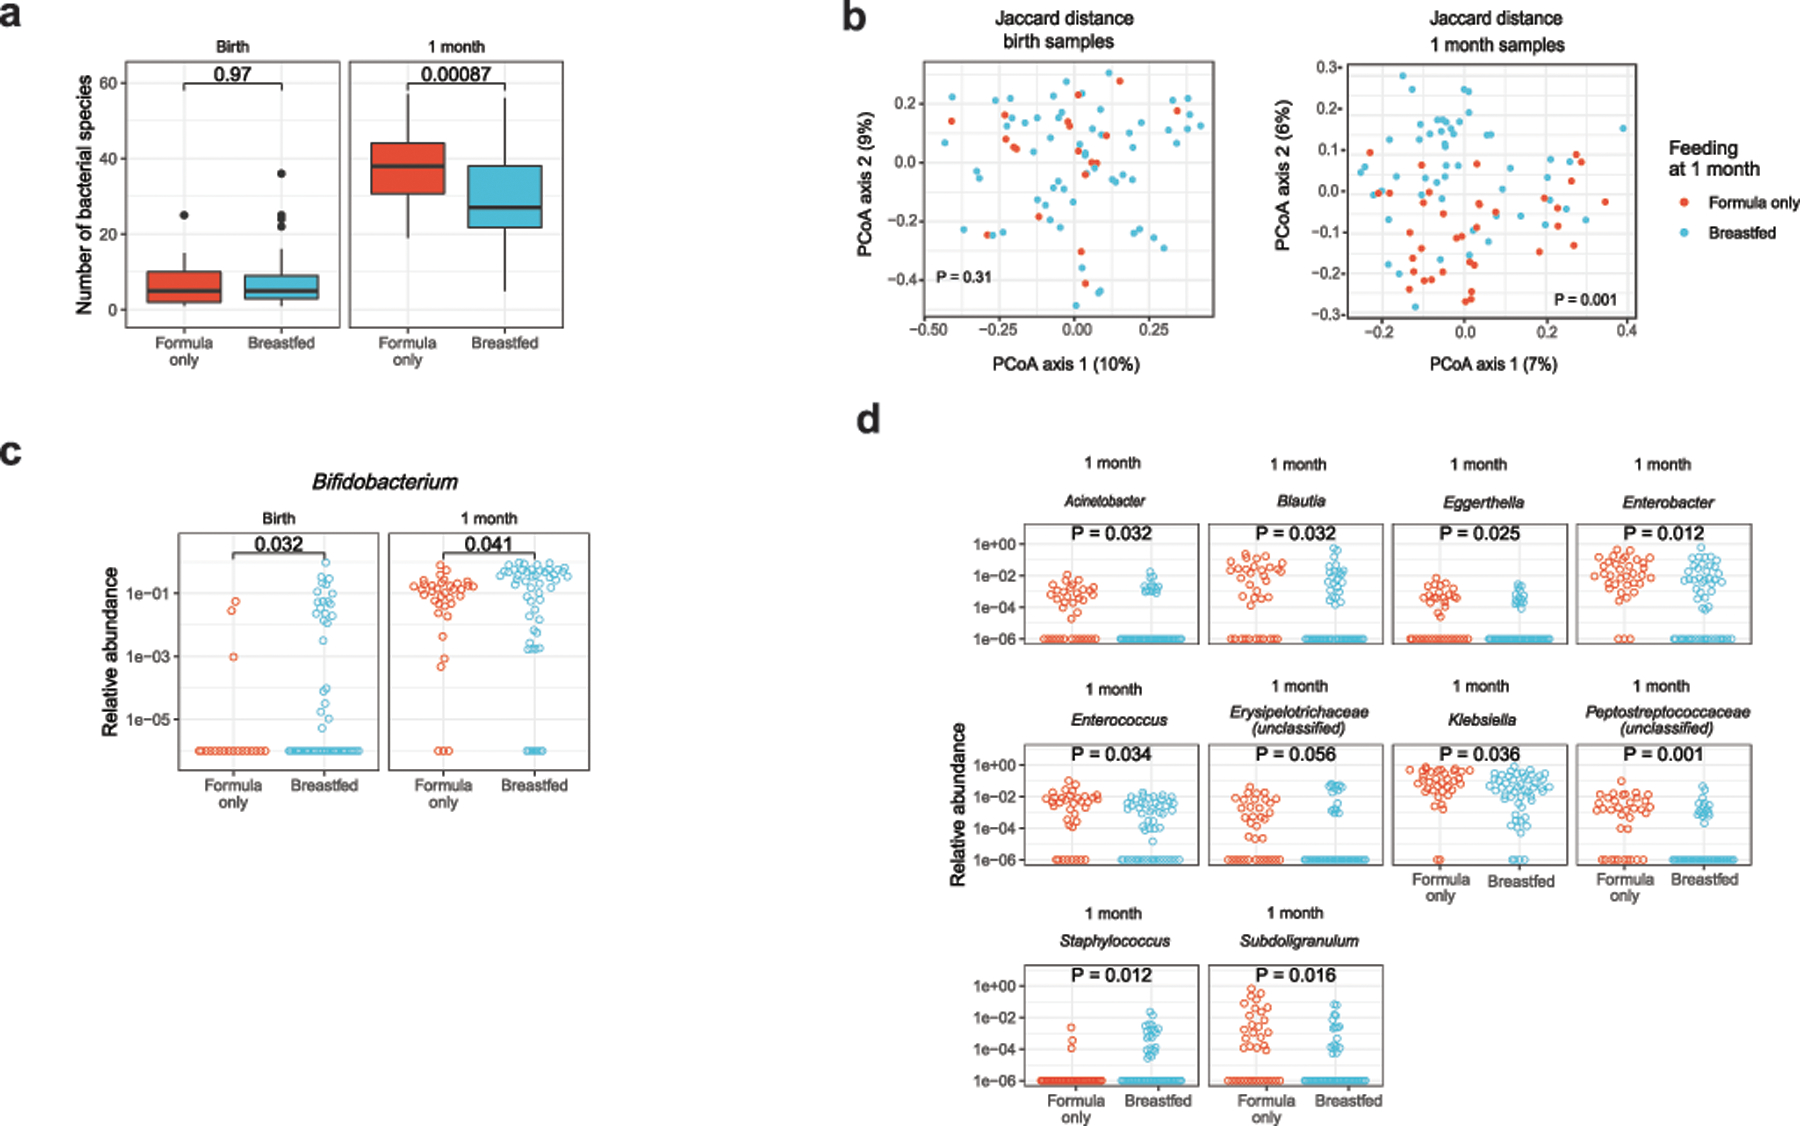
(a) The number of bacterial species decreased with breastfeeding at 1 month, but not at birth (two-sided Mann-Whitney test). Boxes in indicate the median and interquartile distance, whiskers indicate maximum and minimum data points within 1.5 times the interquartile range, points represent values outside this range. (b) Breastfeeding altered the composition of bacterial species present at 1 month but not at birth (PERMANOVA test). (c) The abundance of Bifidobacterium increased with breastfeeding at birth and 1 month (one-sided Mann-Whitney test). (d) Other genera found to differ in abundance with breastfeeding at 1 month (two-sided Mann-Whitney test, corrected for false discovery rate). (e) KEGG gene orthologs differing in abundance with breastfeeding (two-sided Mann-Whitney test, corrected for false discovery rate). Corrected p-values are shown for statistically significant differences. Points with error bars in (e) indicate the median and interquartile range. Sample size at birth was n1 = 19 formula, n2 = 61 breastfed; sample size at 1 month was n1 = 36 formula, n2 = 52 breastfed.
Extended Data Fig. 5. Negative control samples used in metagenomic DNA sequencing.
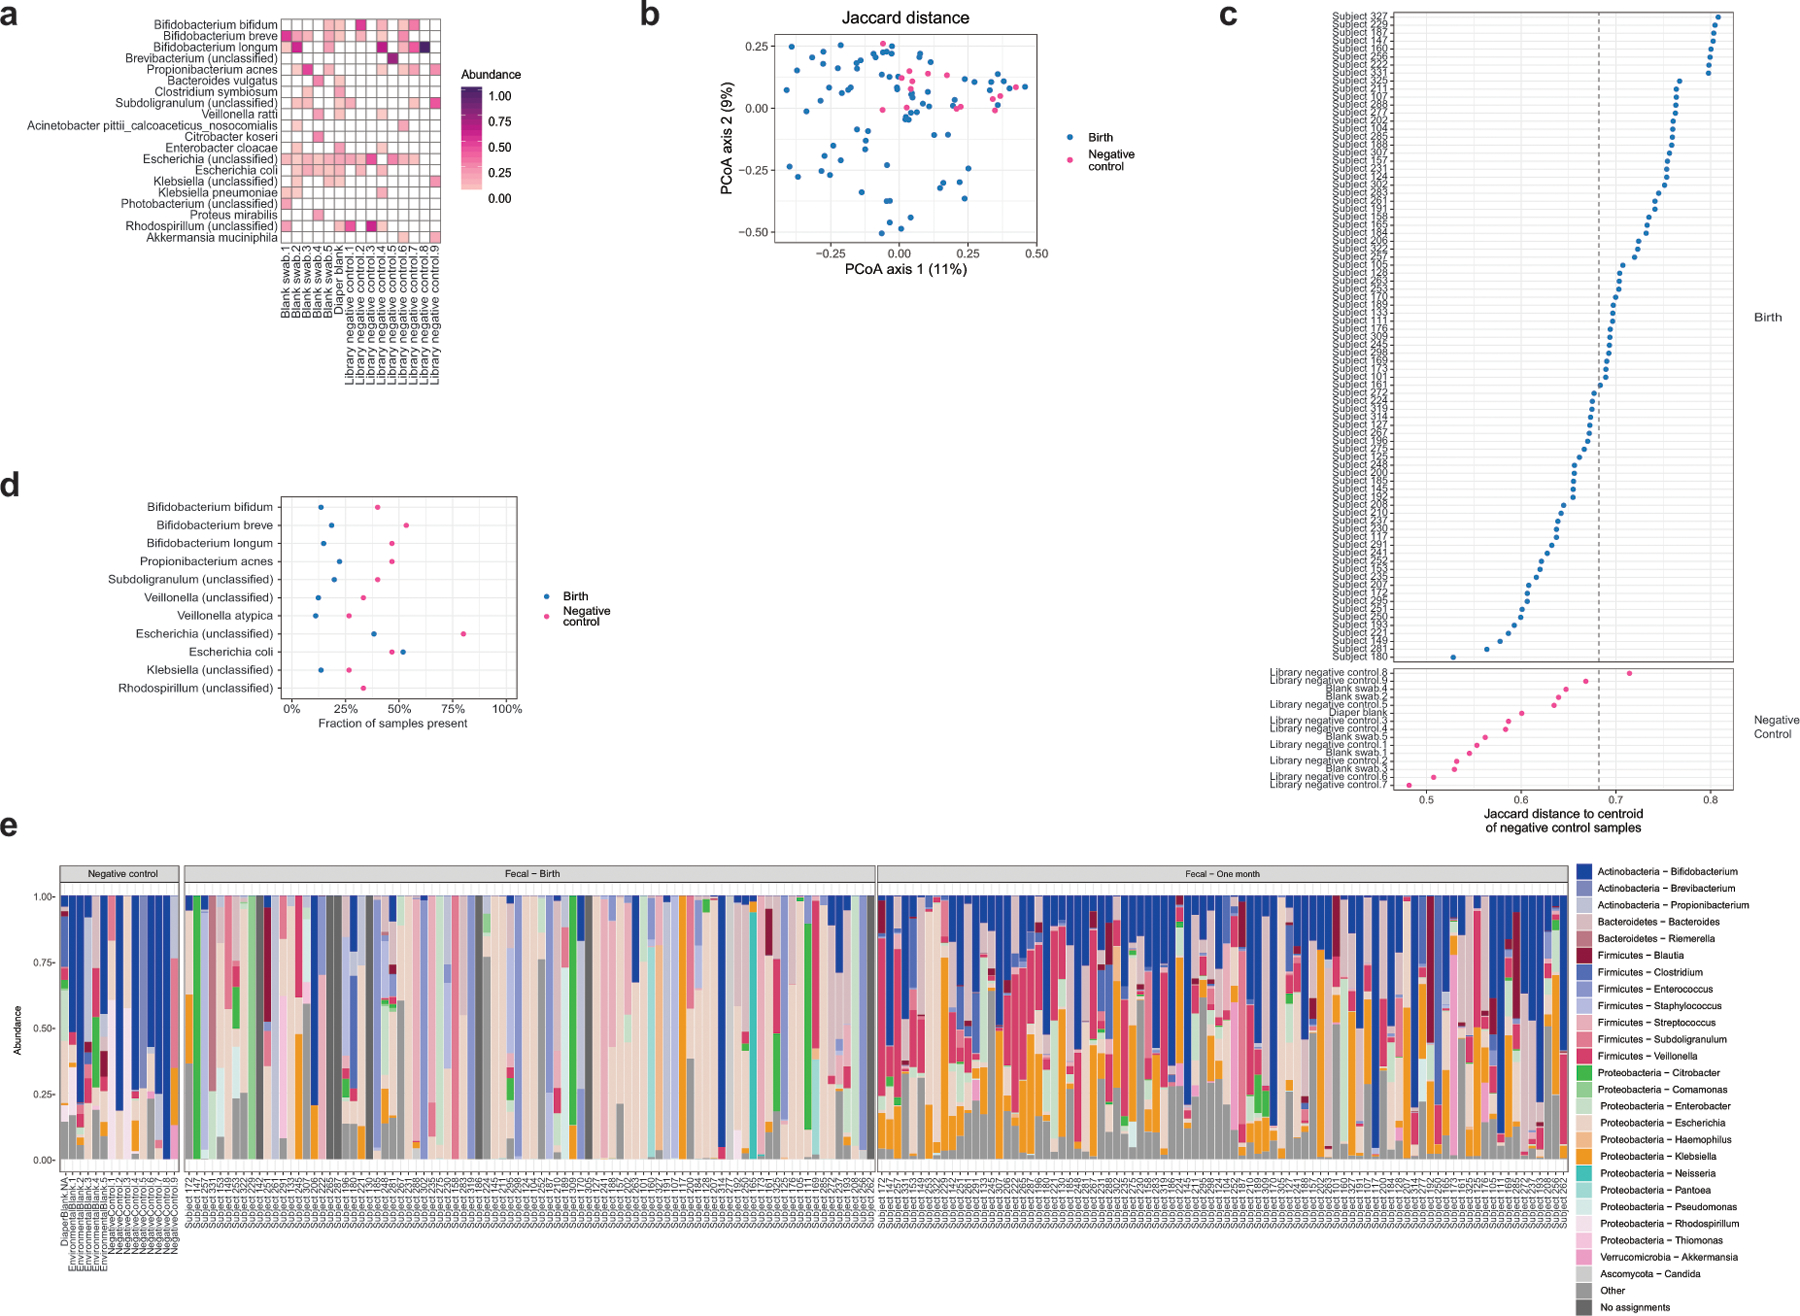
(a) Bacterial species abundance in negative control samples. (b) Jaccard distance between negative control samples and meconium samples (n1 = 81 meconium samples, n2 = 15 negative control samples, 7 meconium samples excluded due to no taxonomic assignments). (c) Jaccard distance to centroid of negative control samples. The 95% quantile for distance of negative control samples to their own centroid is indicated with a dashed line; 32 meconium samples fell within this distance. (d) Prevalence of species commonly detected in negative controls. For all but E. coli, the species were more prevalent in negative controls than in meconium samples. (e) Stacked bar charts showing prominent taxa in negative controls, birth, and 1 month samples.
Extended Data Fig. 6. Estimation of bacterial-to-human DNA ratio by qPCR.
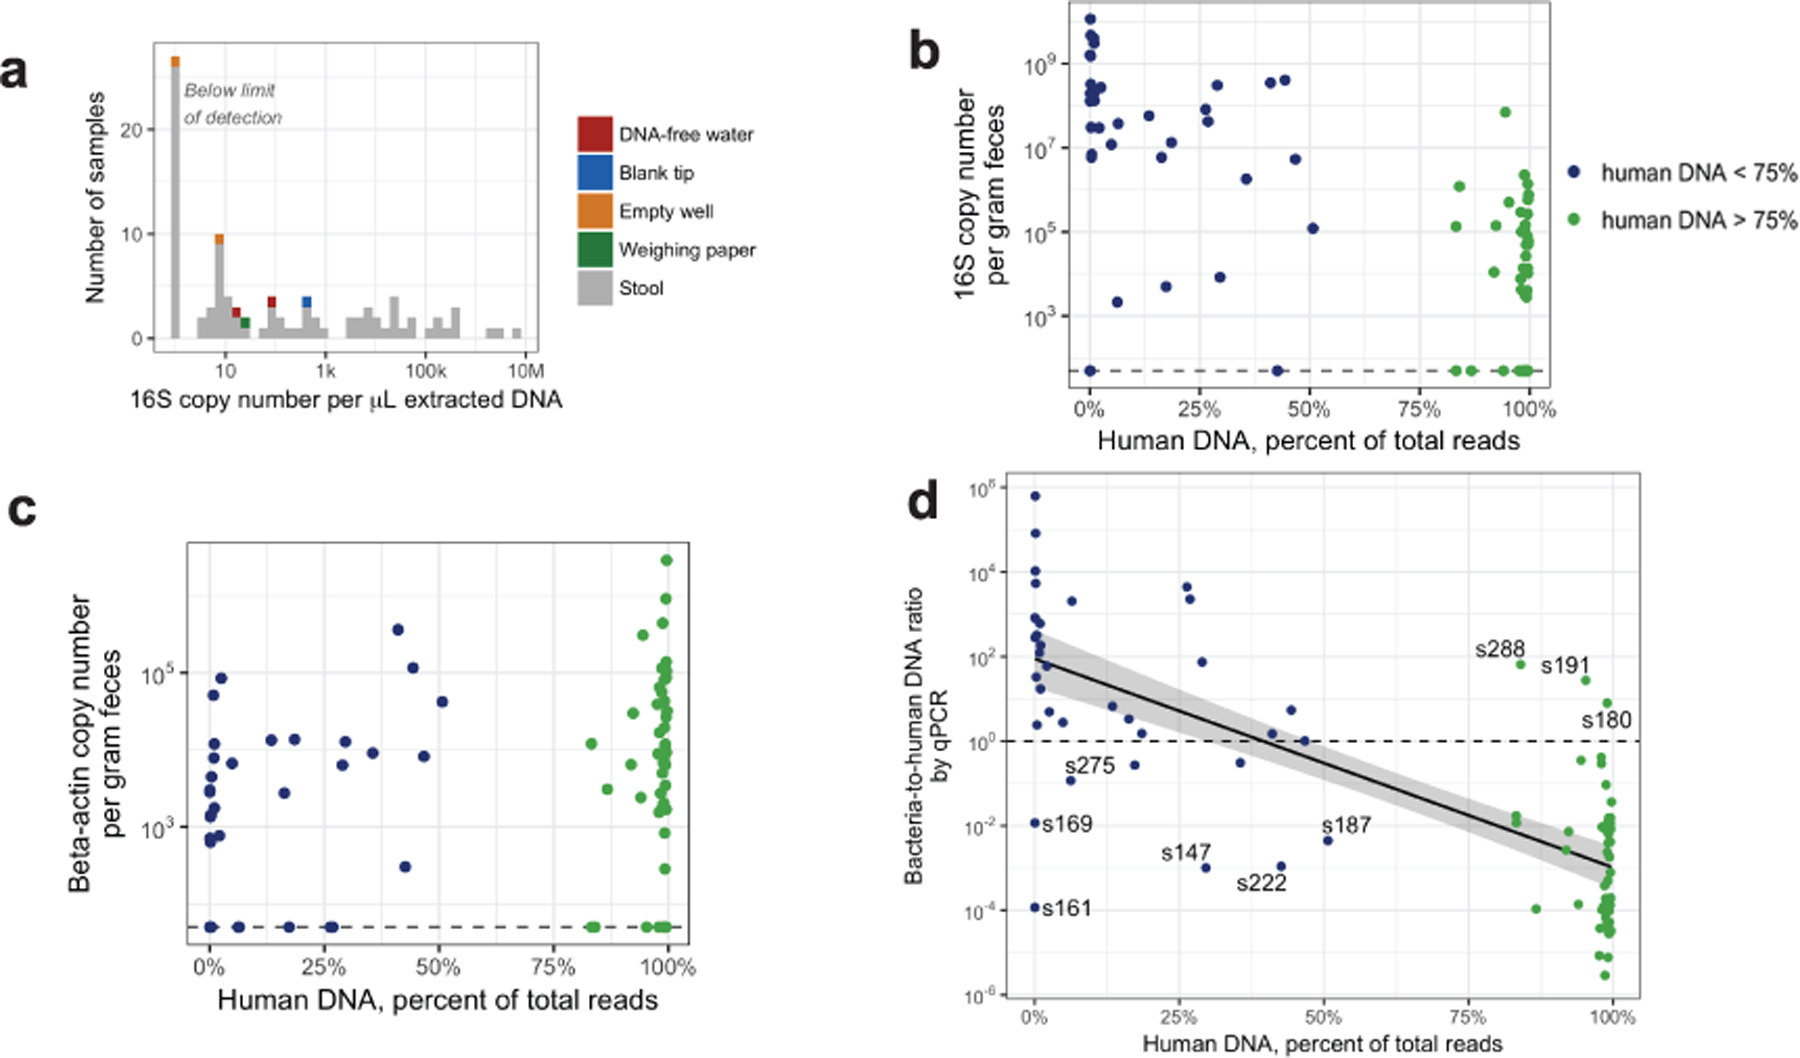
(a) Absolute quantification of bacterial DNA by 16S qPCR in meconium and negative control samples. (b) Negative correlation of 16S copy number and human DNA percentage in metagenomic sequencing (two-sided test of Spearman correlation, ρ = −0.6, P = 2×10⁻⁹, n = 88). (c) Positive correlation between beta-actin copy number and human DNA percentage (two-sided test of Spearman correlation, ρ = 0.4, P = 3×10⁻⁴, n = 88). (d) Negative correlation between estimated bacterial-to-human DNA ratio and human DNA percentage (two-sided test of Spearman correlation, ρ = −0.8, P = 2×10⁻¹⁶, n = 48, samples were excluded if either measurement was below the limit of detection). The linear regression estimate is indicated with a solid black line and the 95% confidence interval is indicated by the grey area.
Extended Data Fig. 7. Bacterial-to-human DNA ratio associated with time since birth.
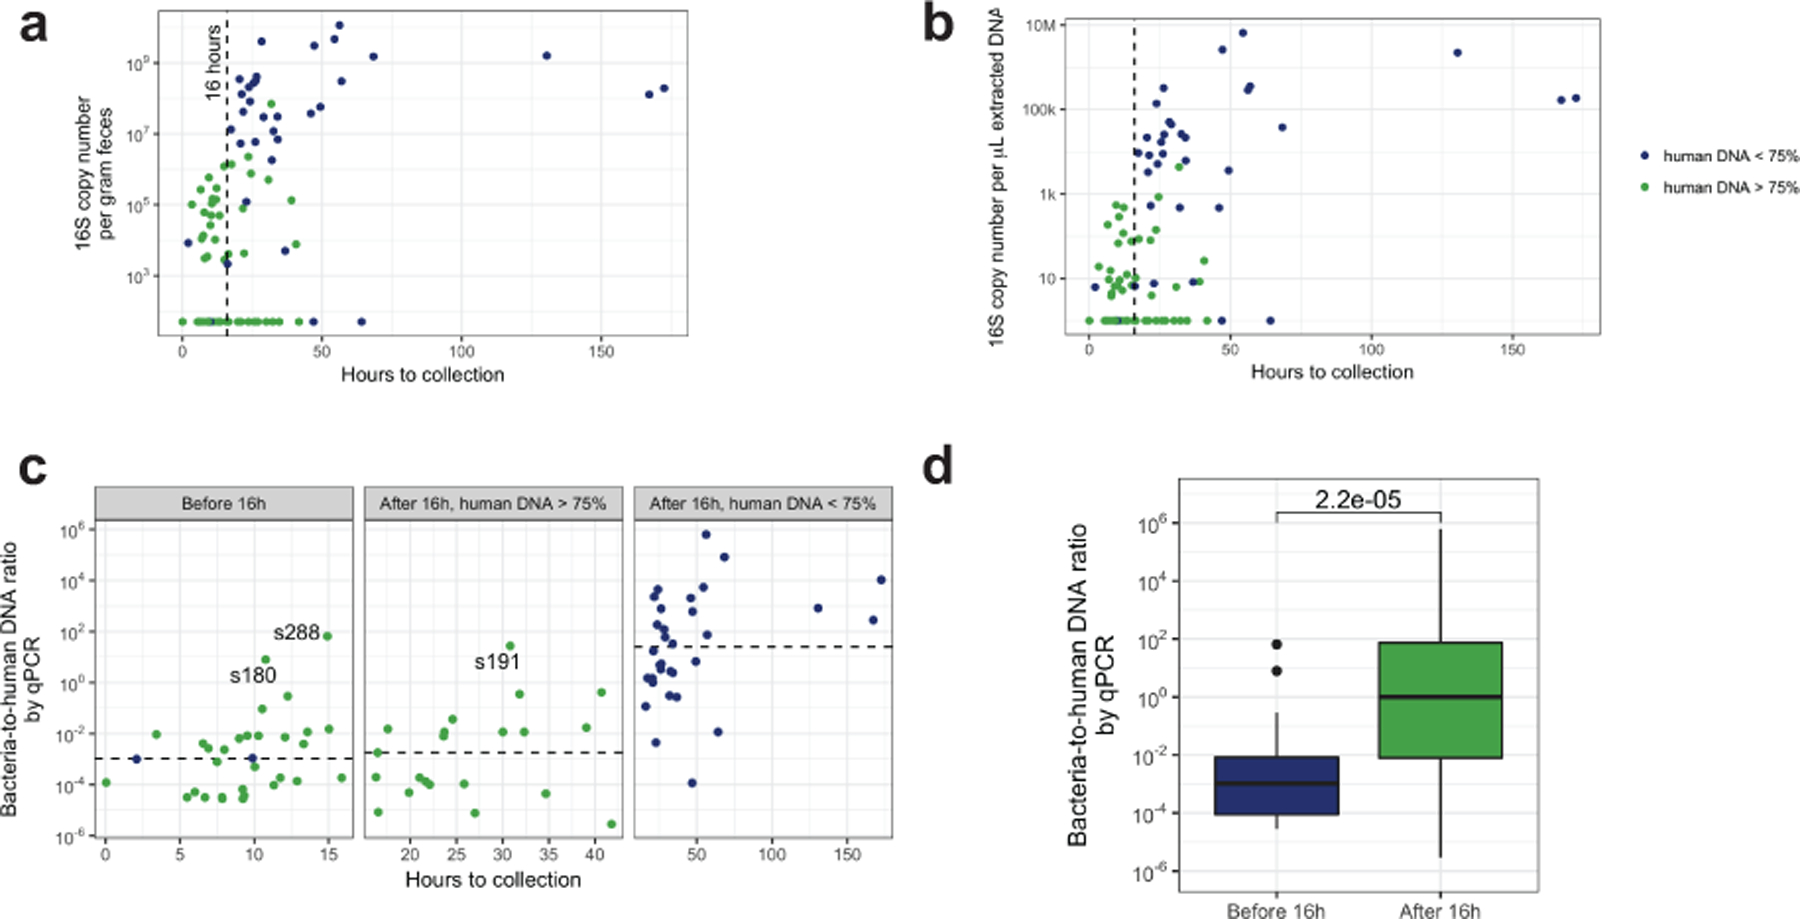
(a) Bacterial 16S copy number per gram feces increased with time since birth (two-sided test of Spearman correlation, ρ = 0.5, P = 6×10⁻⁶, n = 85, 3 samples excluded due to no data on time since birth). (b) Bacterial 16S copy number per μL extracted DNA increases with time since birth (two-sided test of Spearman correlation, ρ = 0.5, P = 7×10⁻⁶, n = 85). (c) The bacterial-to-human DNA ratio is higher in samples collected after 16 hours with low human DNA relative to others (two-sided Mann-Whitney test, P = 4×10⁻¹¹, n1 = 32 samples collected after 16 hours with low human DNA, n2 = 53 others). Samples with a bacterial-to-human DNA ratio above unity are labeled with the subject ID. (d) The bacterial-to-human DNA ratio is higher in samples collected
Extended Data Fig. 8. Acetate concentration in meconium samples.
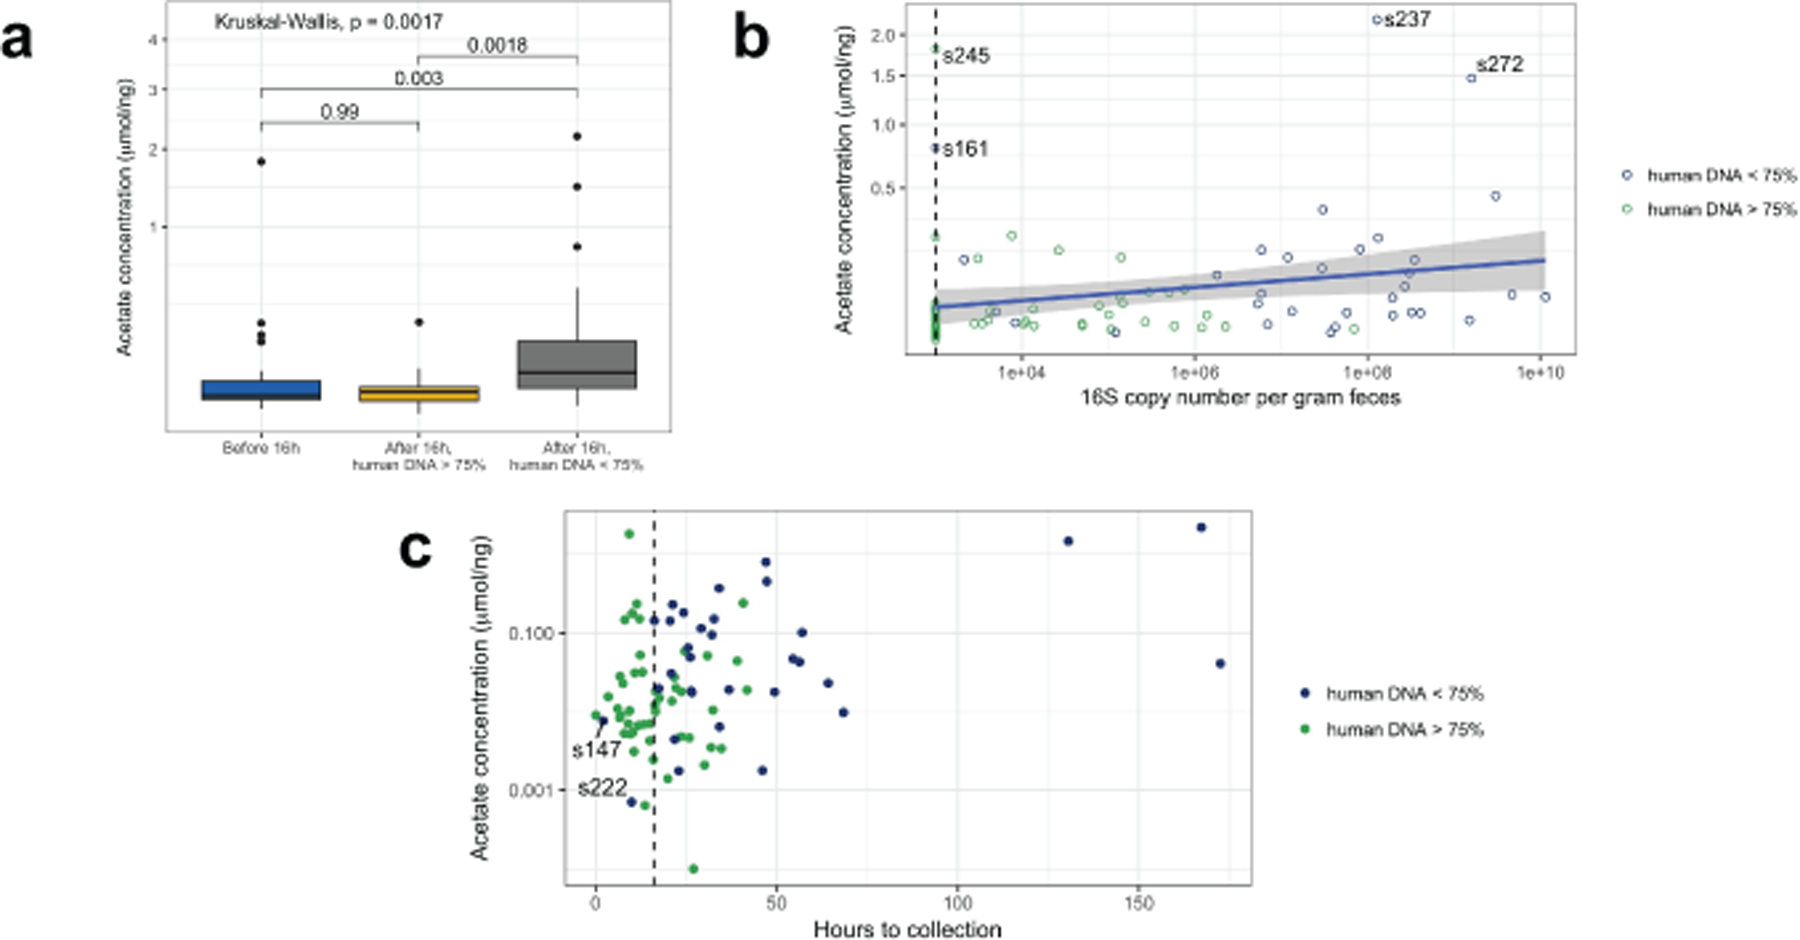
a) The acetate concentration was higher in samples obtained after 16 hours with low human DNA and other groups, and was not different in samples collected before vs. after 16 hours with high human DNA (two-sided Mann-Whitney test, p-values indicated above bars, n1 = 30 collected before 16 hours, n2 = 21 after 16 hours with human DNA > 75%, n3 = 30 after 16 hours with human DNA < 75%). Boxes in indicate the median and interquartile distance, whiskers indicate maximum and minimum data points within 1.5 times the interquartile range, points represent values outside this range. (b) Acetate concentration increased with 16S copy number per gram feces (two-sided test of Spearman correlation, ρ = 0.33, P = 0.002, n = 84). The blue line indicates the linear regression estimate, and the grey area indicates the 95% confidence interval. The dashed vertical line indicates the lower limit of detection for 16S qPCR measurements. Samples with high acetate concentration are labeled. (c) Acetate concentration increased with time since birth (two-sided test of Spearman correlation, ρ = 0.27, P = 0.02, n = 81). The dashed vertical line indicates 16 hours after birth.
Extended Data Fig. 9. Products of aerobic and anaerobic amino acid metabolism in E. coli.
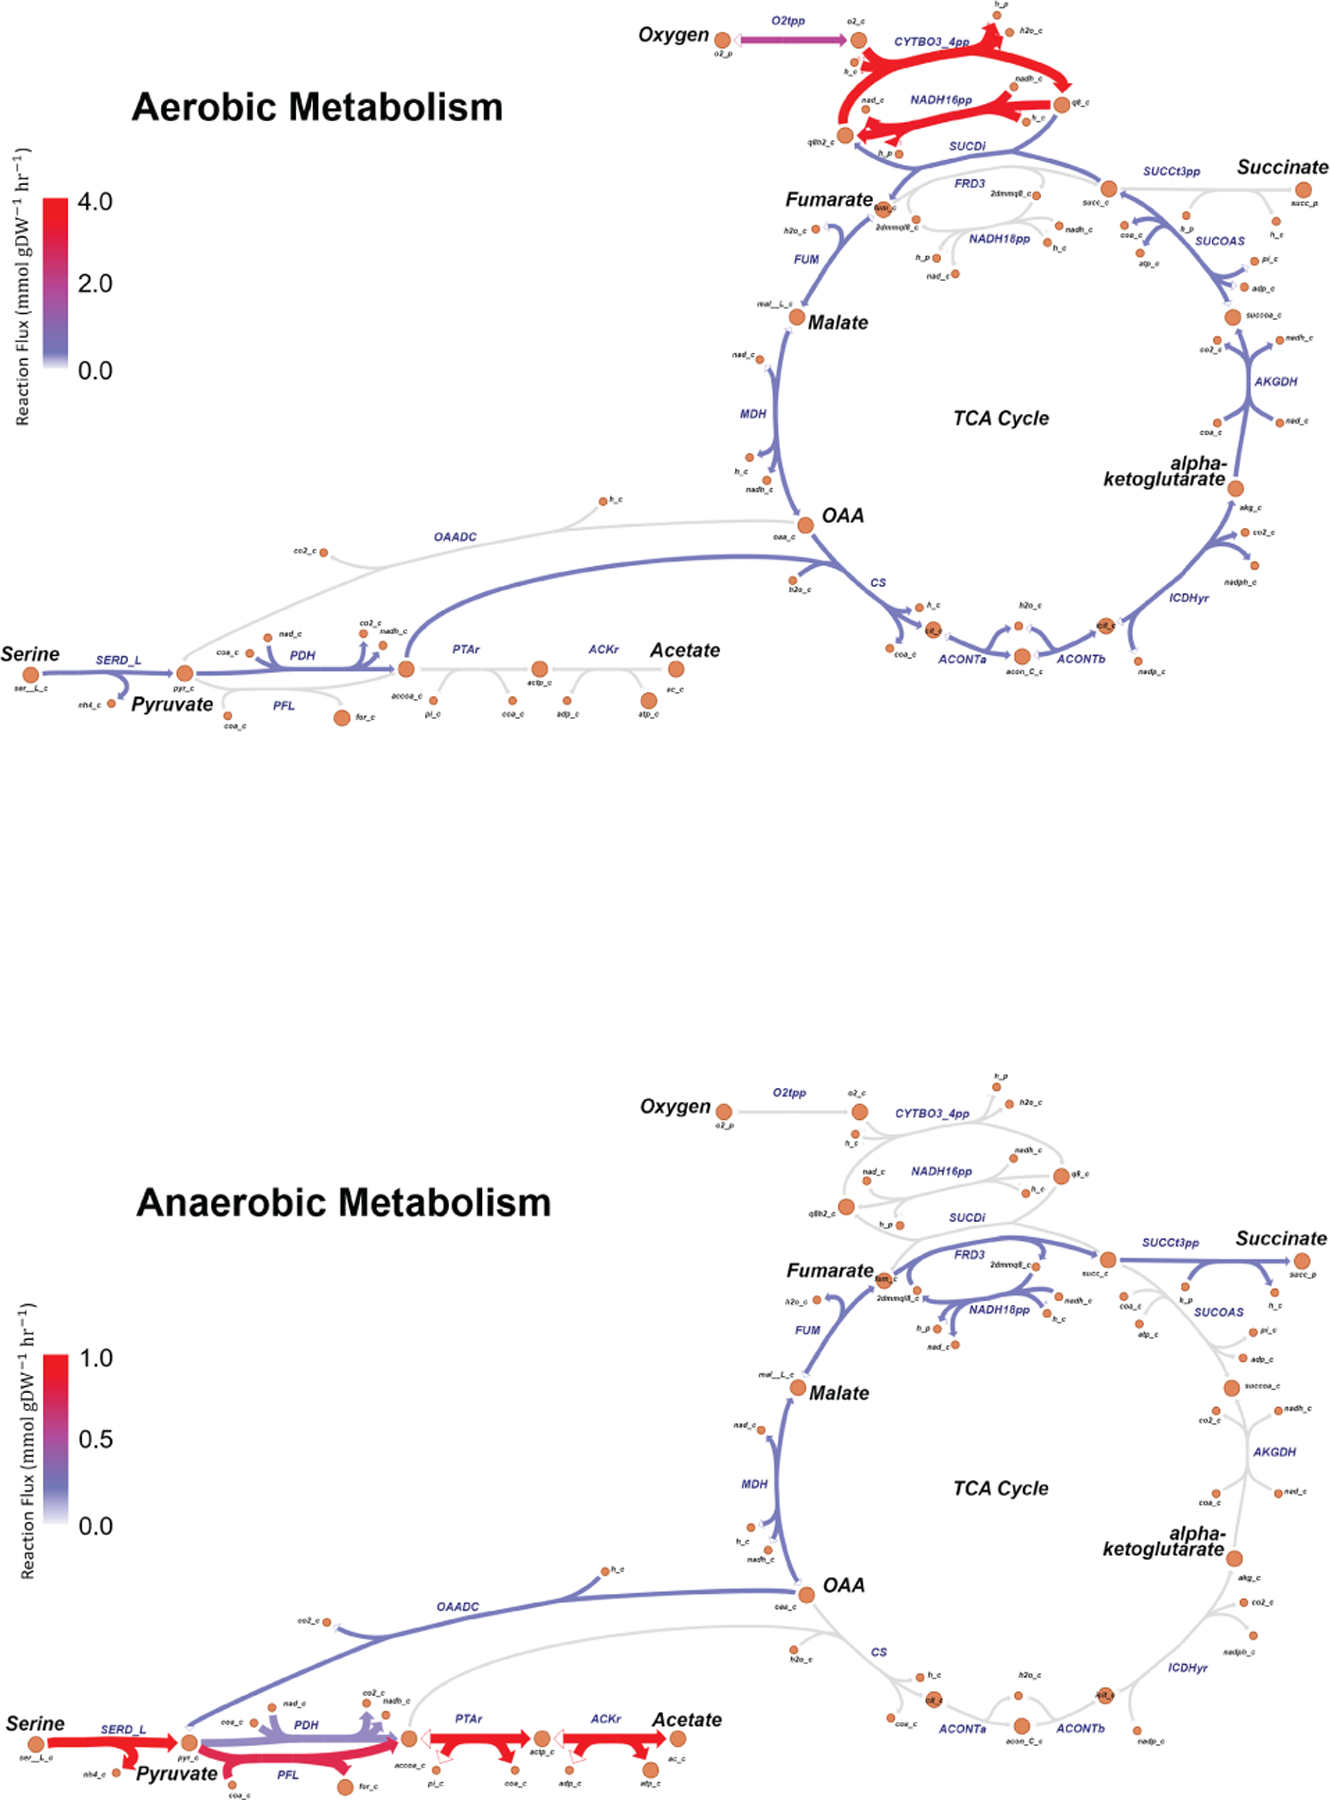
Simulated metabolic flux in E. coli under aerobic and anaerobic conditions. The arrow thickness for a reaction is proportional to the flux flowing through it, with red being the maximum and grey the minimum (equivalent to zero flux).
Extended Data Fig. 10. Summary of data presented for meconium samples and negative controls.
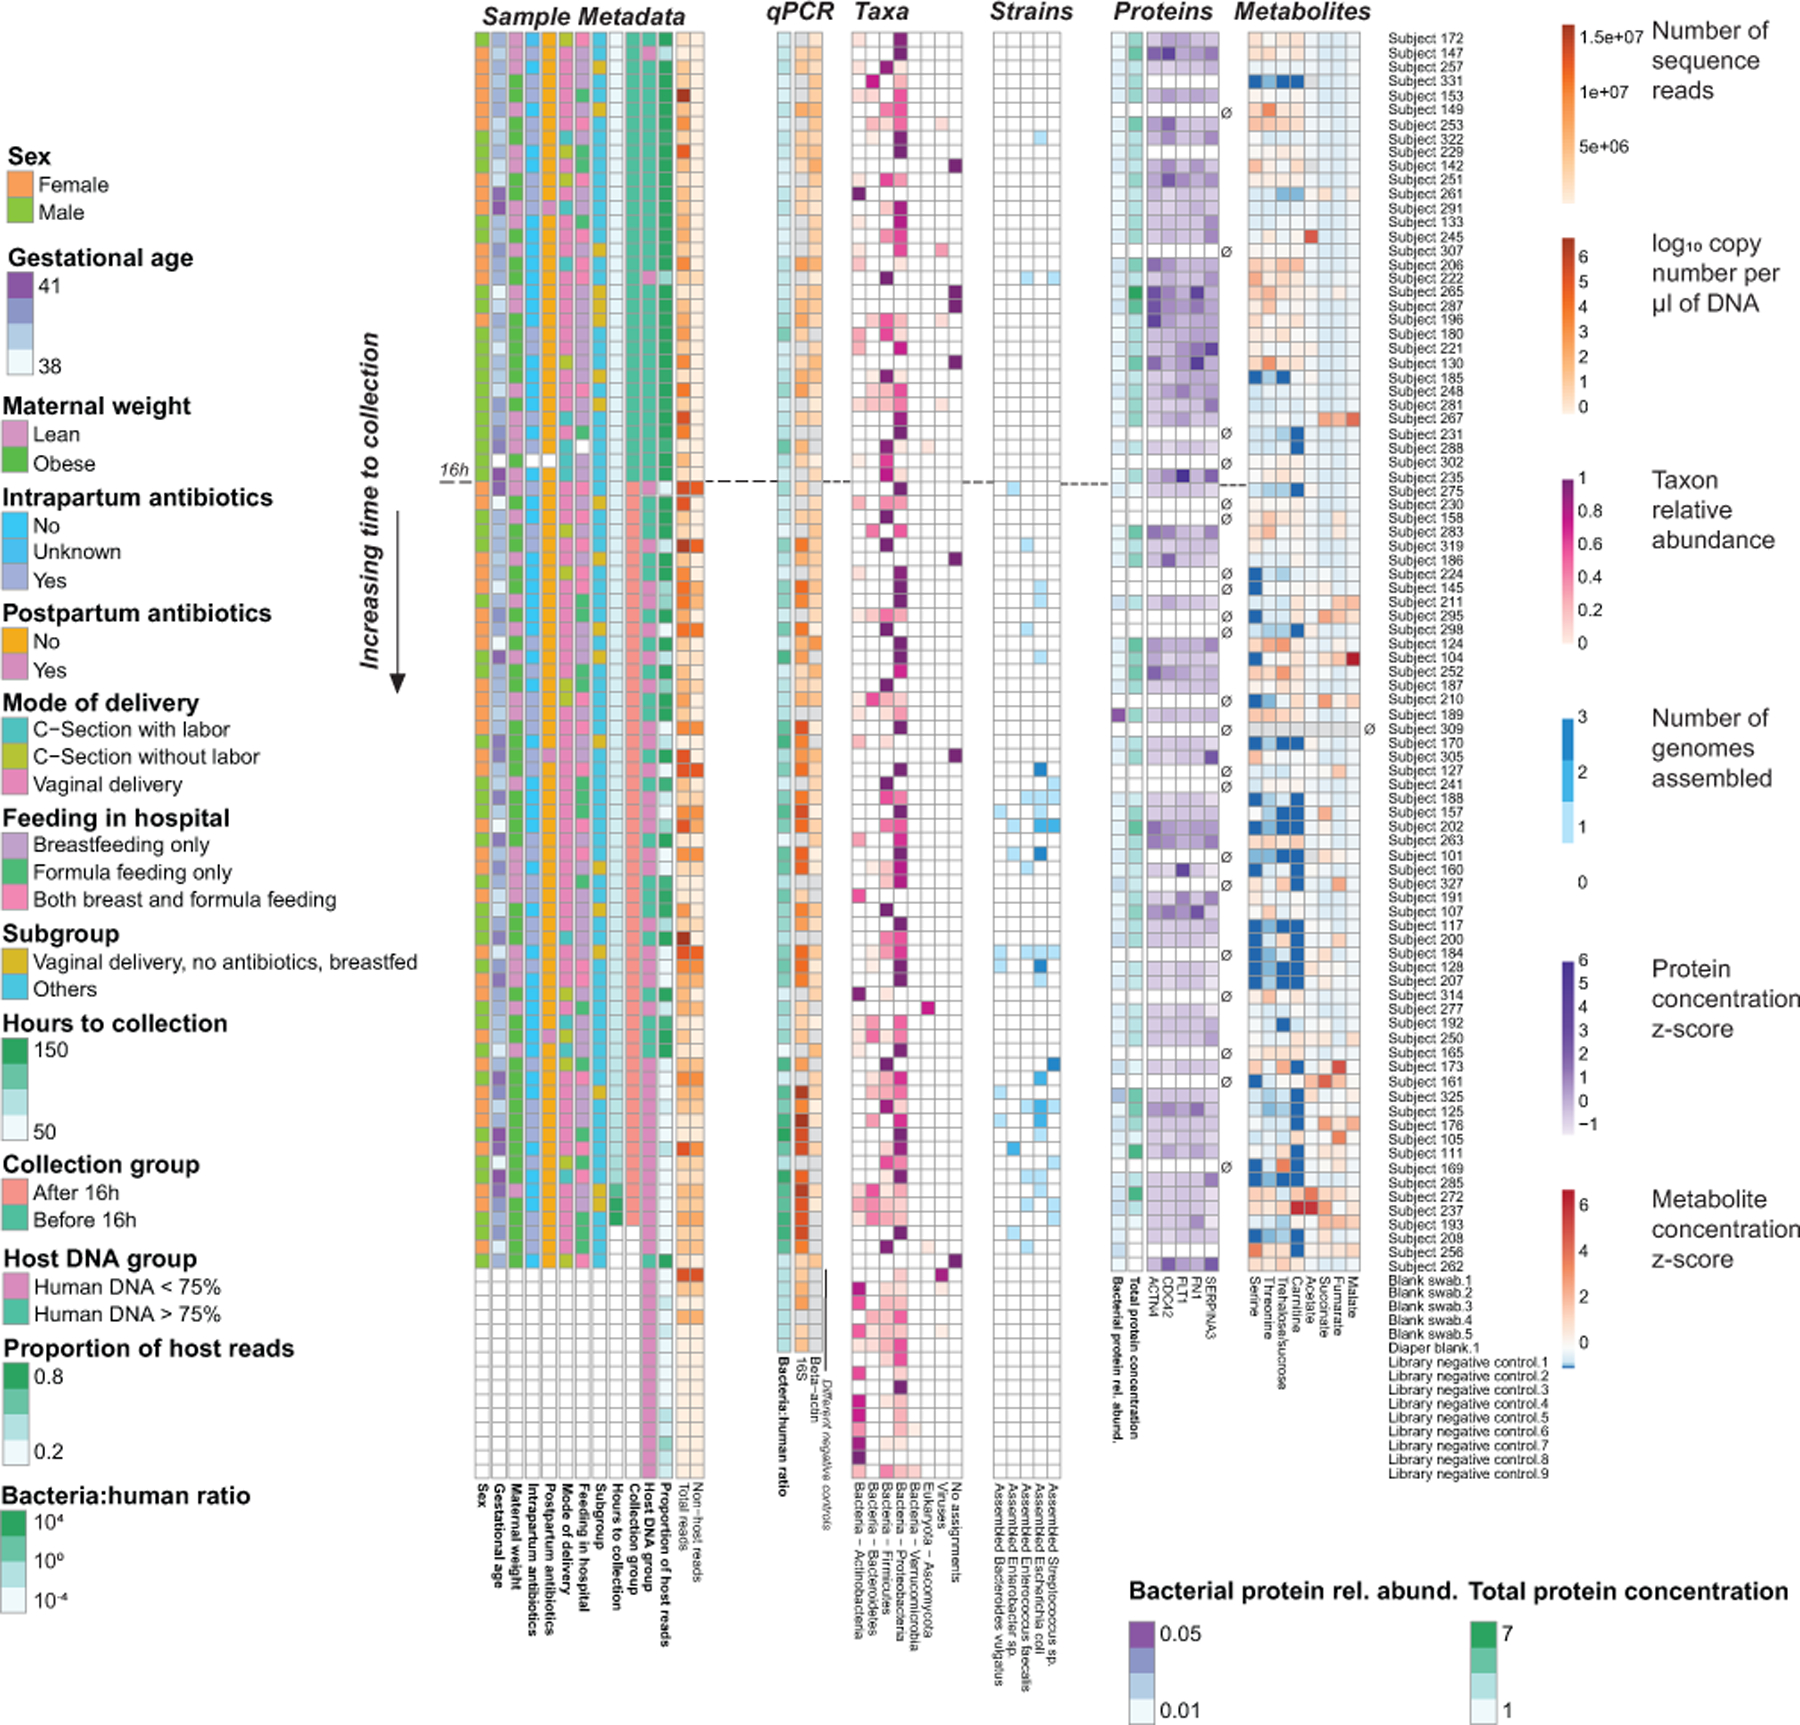
Samples are ordered from top to bottom by time of collection. An empty set symbol (∅) indicates samples that were not submitted for proteomic and metabolomic analysis, due to availability of specimen. The dashed horizontal line indicates 16 hours after birth.
Supplementary Material
Acknowledgements
Partial funding was provided by an unrestricted donation from the American Beverage Foundation for a Healthy America to the Children’s Hospital of Philadelphia to support the Healthy Weight Program. This study was also supported by the Research Institute of the Children’s Hospital of Philadelphia, The PennCHOP Microbiome Program, the Pennsylvania State University Department of Chemical Engineering, the NIH National Center for Research Resources Clinical and Translational Science Program (UL1TR001878), the National Institute of Digestive Diseases and Disorders of the Kidney (R01DK107565), a Tobacco Formula grant under the Commonwealth Universal Research Enhancement (C.U.R.E.) program (SAP # 4100068710), Research Electronic Data Capture (REDCap), the Human-Microbial Analytic and Repository Core of the Center for Molecular Studies in Digestive and Liver Disease (P30 DK050306), the Research Scholar Award from the American Gastroenterological Association (JN), and the Howard Hughes Medical Institute (HHMI) Medical Fellowship (CVK). Special thanks go to the mothers and their infants who participated in this research study.
Footnotes
Code availability
Source code for analysis is available on GitHub at http://github.com/kylebittinger/neonatal-gut-colonization
Competing Interests
The authors declare no competing interests.
Data availability
Shotgun metagenomic sequence data are available from the NCBI Sequence Read Archive under accession SRP217052. Proteomics and metabolomics data are deposited on Zenodo with DOI 10.5281/zenodo.3576595.
References
- 1.Yatsunenko T et al. Human gut microbiome viewed across age and geography. Nature 486, 222–227 (2012). [DOI] [PMC free article] [PubMed] [Google Scholar]
- 2.Stewart CJ et al. Temporal development of the gut microbiome in early childhood from the TEDDY study. Nature 562, 583–588 (2018). [DOI] [PMC free article] [PubMed] [Google Scholar]
- 3.Yassour M et al. Natural history of the infant gut microbiome and impact of antibiotic treatment on bacterial strain diversity and stability. Sci. Transl. Med 8, 343ra81 (2016). [DOI] [PMC free article] [PubMed] [Google Scholar]
- 4.Bokulich NA et al. Antibiotics, birth mode, and diet shape microbiome maturation during early life. Sci. Transl. Med 8, 343ra82 (2016). [DOI] [PMC free article] [PubMed] [Google Scholar]
- 5.Wang J et al. Dysbiosis of maternal and neonatal microbiota associated with gestational diabetes mellitus. Gut 67, 1614–1625 (2018). [DOI] [PMC free article] [PubMed] [Google Scholar]
- 6.Durack J et al. Delayed gut microbiota development in high-risk for asthma infants is temporarily modifiable by Lactobacillus supplementation. Nat. Commun 9, 707 (2018). [DOI] [PMC free article] [PubMed] [Google Scholar]
- 7.Grier A et al. Impact of prematurity and nutrition on the developing gut microbiome and preterm infant growth. Microbiome 5, 158 (2017). [DOI] [PMC free article] [PubMed] [Google Scholar]
- 8.Mueller NT et al. Delivery Mode and the Transition of Pioneering Gut-Microbiota Structure, Composition and Predicted Metabolic Function. Genes 8, (2017). [DOI] [PMC free article] [PubMed] [Google Scholar]
- 9.Dobbler PT et al. Low Microbial Diversity and Abnormal Microbial Succession Is Associated with Necrotizing Enterocolitis in Preterm Infants. Front. Microbiol 8, 2243 (2017). [DOI] [PMC free article] [PubMed] [Google Scholar]
- 10.Brazier L et al. Evolution in fecal bacterial/viral composition in infants of two central African countries (Gabon and Republic of the Congo) during their first month of life. PLoS One 12, e0185569 (2017). [DOI] [PMC free article] [PubMed] [Google Scholar]
- 11.Wampach L et al. Colonization and Succession within the Human Gut Microbiome by Archaea, Bacteria, and Microeukaryotes during the First Year of Life. Front. Microbiol 8, 738 (2017). [DOI] [PMC free article] [PubMed] [Google Scholar]
- 12.Chu DM et al. Maturation of the infant microbiome community structure and function across multiple body sites and in relation to mode of delivery. Nat. Med 23, 314–326 (2017). [DOI] [PMC free article] [PubMed] [Google Scholar]
- 13.Chu DM et al. The early infant gut microbiome varies in association with a maternal high-fat diet. Genome Med 8, 77 (2016). [DOI] [PMC free article] [PubMed] [Google Scholar]
- 14.Collado MC, Rautava S, Aakko J, Isolauri E & Salminen S Human gut colonisation may be initiated in utero by distinct microbial communities in the placenta and amniotic fluid. Sci. Rep 6, 23129 (2016). [DOI] [PMC free article] [PubMed] [Google Scholar]
- 15.Heida FH et al. A Necrotizing Enterocolitis-Associated Gut Microbiota Is Present in the Meconium: Results of a Prospective Study. Clin. Infect. Dis 62, 863–870 (2016). [DOI] [PubMed] [Google Scholar]
- 16.Gómez M et al. Early Gut Colonization of Preterm Infants: Effect of Enteral Feeding Tubes. J. Pediatr. Gastroenterol. Nutr 62, 893–900 (2016). [DOI] [PubMed] [Google Scholar]
- 17.Hansen R et al. First-Pass Meconium Samples from Healthy Term Vaginally-Delivered Neonates: An Analysis of the Microbiota. PLoS One 10, e0133320 (2015). [DOI] [PMC free article] [PubMed] [Google Scholar]
- 18.Dutta S, Ganesh M, Ray P & Narang A Intestinal colonization among very low birth weight infants in first week of life. Indian Pediatr 51, 807–809 (2014). [DOI] [PubMed] [Google Scholar]
- 19.Ardissone AN et al. Meconium microbiome analysis identifies bacteria correlated with premature birth. PLoS One 9, e90784 (2014). [DOI] [PMC free article] [PubMed] [Google Scholar]
- 20.Hu J et al. Diversified microbiota of meconium is affected by maternal diabetes status. PLoS One 8, e78257 (2013). [DOI] [PMC free article] [PubMed] [Google Scholar]
- 21.Moles L et al. Bacterial diversity in meconium of preterm neonates and evolution of their fecal microbiota during the first month of life. PLoS One 8, e66986 (2013). [DOI] [PMC free article] [PubMed] [Google Scholar]
- 22.Nagpal R et al. Sensitive Quantitative Analysis of the Meconium Bacterial Microbiota in Healthy Term Infants Born Vaginally or by Cesarean Section. Front. Microbiol 7, (2016). [DOI] [PMC free article] [PubMed] [Google Scholar]
- 23.Lim ES et al. Early life dynamics of the human gut virome and bacterial microbiome in infants. Nat. Med 21, 1228–1234 (2015). [DOI] [PMC free article] [PubMed] [Google Scholar]
- 24.Bäckhed F et al. Dynamics and Stabilization of the Human Gut Microbiome during the First Year of Life. Cell Host Microbe 17, 690–703 (2015). [DOI] [PubMed] [Google Scholar]
- 25.La Rosa PS et al. Patterned progression of bacterial populations in the premature infant gut. Proc. Natl. Acad. Sci. U. S. A 111, 12522–12527 (2014). [DOI] [PMC free article] [PubMed] [Google Scholar]
- 26.Del Chierico F et al. Phylogenetic and Metabolic Tracking of Gut Microbiota during Perinatal Development. PLoS One 10, e0137347 (2015). [DOI] [PMC free article] [PubMed] [Google Scholar]
- 27.Zwittink RD et al. Metaproteomics reveals functional differences in intestinal microbiota development of preterm infants. Mol. Cell. Proteomics 16, 1610–1620 (2017). [DOI] [PMC free article] [PubMed] [Google Scholar]
- 28.Xiong W, Brown CT, Morowitz MJ, Banfield JF & Hettich RL Genome-resolved metaproteomic characterization of preterm infant gut microbiota development reveals species-specific metabolic shifts and variabilities during early life. Microbiome 5, 72 (2017). [DOI] [PMC free article] [PubMed] [Google Scholar]
- 29.Young JC et al. Metaproteomics reveals functional shifts in microbial and human proteins during a preterm infant gut colonization case. Proteomics 15, 3463–3473 (2015). [DOI] [PMC free article] [PubMed] [Google Scholar]
- 30.Dominguez-Bello MG, Blaser MJ, Ley RE & Knight R Development of the human gastrointestinal microbiota and insights from high-throughput sequencing. Gastroenterology 140, 1713–1719 (2011). [DOI] [PMC free article] [PubMed] [Google Scholar]
- 31.Sprockett D, Fukami T & Relman DA Role of priority effects in the early-life assembly of the gut microbiota. Nat. Rev. Gastroenterol. Hepatol 15, 197–205 (2018). [DOI] [PMC free article] [PubMed] [Google Scholar]
- 32.Campbell JH et al. UGA is an additional glycine codon in uncultured SR1 bacteria from the human microbiota. Proc. Natl. Acad. Sci. U. S. A 110, 5540–5545 (2013). [DOI] [PMC free article] [PubMed] [Google Scholar]
- 33.Sakamori R et al. Cdc42 and Rab8a are critical for intestinal stem cell division, survival, and differentiation in mice. J. Clin. Invest 122, 1052–1065 (2012). [DOI] [PMC free article] [PubMed] [Google Scholar]
- 34.Melendez J et al. Cdc42 coordinates proliferation, polarity, migration, and differentiation of small intestinal epithelial cells in mice. Gastroenterology 145, 808–819 (2013). [DOI] [PMC free article] [PubMed] [Google Scholar]
- 35.Kolachala VL et al. Epithelial-derived fibronectin expression, signaling, and function in intestinal inflammation. J. Biol. Chem 282, 32965–32973 (2007). [DOI] [PubMed] [Google Scholar]
- 36.Cotter PA, Chepuri V, Gennis RB & Gunsalus RP Cytochrome o (cyoABCDE) and d (cydAB) oxidase gene expression in Escherichia coli is regulated by oxygen, pH, and the fnr gene product. J. Bacteriol 172, 6333–6338 (1990). [DOI] [PMC free article] [PubMed] [Google Scholar]
- 37.Unden G & Bongaerts J Alternative respiratory pathways of Escherichia coli: energetics and transcriptional regulation in response to electron acceptors. Biochim. Biophys. Acta 1320, 217–234 (1997). [DOI] [PubMed] [Google Scholar]
- 38.Knorr AL, Jain R & Srivastava R Bayesian-based selection of metabolic objective functions. Bioinformatics 23, 351–357 (2007). [DOI] [PubMed] [Google Scholar]
- 39.Yang Y et al. Relation between chemotaxis and consumption of amino acids in bacteria. Mol. Microbiol 96, 1272–1282 (2015). [DOI] [PMC free article] [PubMed] [Google Scholar]
- 40.Friedman ES et al. Microbes vs. chemistry in the origin of the anaerobic gut lumen. Proc. Natl. Acad. Sci. U. S. A 115, 4170–4175 (2018). [DOI] [PMC free article] [PubMed] [Google Scholar]
- 41.Lu W et al. Metabolomic analysis via reversed-phase ion-pairing liquid chromatography coupled to a stand alone orbitrap mass spectrometer. Anal. Chem 82, 3212–3221 (2010). [DOI] [PMC free article] [PubMed] [Google Scholar]
- 42.Clasquin MF, Melamud E & Rabinowitz JD LC-MS data processing with MAVEN: a metabolomic analysis and visualization engine. Curr. Protoc. Bioinformatics Chapter 14, Unit 14.11 (2012). [DOI] [PMC free article] [PubMed] [Google Scholar]
- 43.Cai J et al. Orthogonal Comparison of GC-MS and H NMR Spectroscopy for Short Chain Fatty Acid Quantitation. Anal. Chem 89, 7900–7906 (2017). [DOI] [PMC free article] [PubMed] [Google Scholar]
- 44.Clarke EL et al. Sunbeam: an extensible pipeline for analyzing metagenomic sequencing experiments. Microbiome 7, 46 (2019). [DOI] [PMC free article] [PubMed] [Google Scholar]
- 45.Bolger AM, Lohse M & Usadel B Trimmomatic: a flexible trimmer for Illumina sequence data. Bioinformatics 30, 2114–2120 (2014). [DOI] [PMC free article] [PubMed] [Google Scholar]
- 46.Li H & Durbin R Fast and accurate short read alignment with Burrows-Wheeler transform. Bioinformatics 25, 1754–1760 (2009). [DOI] [PMC free article] [PubMed] [Google Scholar]
- 47.Truong DT et al. MetaPhlAn2 for enhanced metagenomic taxonomic profiling. Nat. Methods 12, 902–903 (2015). [DOI] [PubMed] [Google Scholar]
- 48.Li D, Liu C-M, Luo R, Sadakane K & Lam T-W MEGAHIT: an ultra-fast single-node solution for large and complex metagenomics assembly via succinct de Bruijn graph. Bioinformatics 31, 1674–1676 (2015). [DOI] [PubMed] [Google Scholar]
- 49.Eren AM et al. Anvi’o: an advanced analysis and visualization platform for ‘omics data. PeerJ 3, e1319 (2015). [DOI] [PMC free article] [PubMed] [Google Scholar]
- 50.Scholz M et al. Strain-level microbial epidemiology and population genomics from shotgun metagenomics. Nat. Methods 13, 435–438 (2016). [DOI] [PubMed] [Google Scholar]
- 51.Delmont TO & Eren AM Identifying contamination with advanced visualization and analysis practices: metagenomic approaches for eukaryotic genome assemblies. PeerJ 4, e1839 (2016). [DOI] [PMC free article] [PubMed] [Google Scholar]
- 52.Li J et al. An integrated catalog of reference genes in the human gut microbiome. Nat. Biotechnol 32, 834–841 (2014). [DOI] [PubMed] [Google Scholar]
- 53.Apweiler R et al. UniProt: the Universal Protein knowledgebase. Nucleic Acids Res 32, D115–9 (2004). [DOI] [PMC free article] [PubMed] [Google Scholar]
- 54.Zhang X et al. MetaPro-IQ: a universal metaproteomic approach to studying human and mouse gut microbiota. Microbiome 4, 31 (2016). [DOI] [PMC free article] [PubMed] [Google Scholar]
- 55.Szklarczyk D et al. The STRING database in 2017: quality-controlled protein-protein association networks, made broadly accessible. Nucleic Acids Res 45, D362–D368 (2017). [DOI] [PMC free article] [PubMed] [Google Scholar]
- 56.Anderson MJ A new method for non-parametric multivariate analysis of variance. Austral Ecol 26, 32–46 (2008). [Google Scholar]
- 57.Benjamini Y & Hochberg Y Controlling the false discovery rate: a practical and powerful approach to multiple testing. J. Royal Stat. Soc, Series B 57, 289–300 (1995). [Google Scholar]
Associated Data
This section collects any data citations, data availability statements, or supplementary materials included in this article.
Supplementary Materials
Data Availability Statement
Shotgun metagenomic sequence data are available from the NCBI Sequence Read Archive under accession SRP217052. Proteomics and metabolomics data are deposited on Zenodo with DOI 10.5281/zenodo.3576595.