

Abstract
The understanding and treatment of psychiatric disorders with neurobiological and clinical heterogeneity could benefit from the identification of disease subtypes on the basis of data acquired with established neuroimaging technologies. Here, we report the identification of two clinically relevant subtypes of post-traumatic stress disorder (PTSD) and major depressive disorder (MDD) on the basis of robust and distinct functional-connectivity patterns, prominently within the frontoparietal-control and default-mode networks. We identified the disease subtypes by analysing, via unsupervised and supervised machine learning, the power-envelope-based connectivity of signals reconstructed from high-density resting-state electroencephalography in four datasets from patients with PTSD and MDD, and show that the subtypes are transferable across independent datasets recorded under different conditions. The subtype whose functional connectivity differed most from those of healthy controls was less responsive to psychotherapy treatment for PTSD and failed to respond to an antidepressant medication for MDD. By contrast, both subtypes responded equally well to two different forms of repetitive transcranial magnetic stimulation therapy for MDD. Our data-driven approach may constitute a generalizable solution for connectome-based diagnosis.
One-sentence editorial summary
The analysis of functional-connectivity patterns in resting-state electroencephalography data via machine learning led to the identification of two clinically relevant subtypes of post-traumatic stress disorder and major depressive disorder.
Psychiatric diagnoses are defined based on constellations of symptoms that seek to characterize a particular condition with respect to both healthy individuals and other diagnoses. For example, posttraumatic stress disorder (PTSD) involves a range of emotional, cognitive, and somatic symptoms that can develop after a person has experienced or witnessed a traumatic event in which serious harm to the individual occurred or was threatened1. Likewise, major depressive disorder (MDD) is characterized by sustained negative mood, often associated with biological, psychological, or social sources of stress2. The traditional approach for studying the neurobiology of psychiatric conditions has followed this diagnostic framework through case-control studies whereby all patients with a given diagnosis are compared to healthy individuals. However, this approach has failed to deliver on hoped-for biomarkers due to high biological heterogeneity among patients with the same diagnosis and among healthy controls3–6. More importantly, such biological heterogeneity has substantial effects on treatment outcome, even while often being independent of pre-treatment clinical symptoms. For example, while antidepressants have only modest superiority over placebo, this is in part because the clinical diagnosis of MDD encompasses biologically heterogeneous conditions that relate differentially to treatment outcome7–9. Likewise, even though psychotherapy is presently the most effective treatment for PTSD10, many patients are nonetheless non-responsive and display differences in brain function relative to responsive patients8,11. In neither case, however, are neurobiological differences related to clinical features, supporting the potential unique value of neurobiology in defining clinically-relevant “disease subtypes”. These subtypes may furthermore exist within or between traditional psychiatric diagnoses12–16.
Most of the existing neuroimaging studies investigating disease subtypes, however, have used functional magnetic resonance imaging (fMRI)17–19, an important neuroimaging technology for studying the functional pathophysiology of brain disorders. Despite its popularity and success in early proof-of-concept subtyping efforts, the clinical utility of fMRI is limited due to substantial requirements in terms of expertise, specialized equipment and high cost, as well as persistent challenges harmonizing fMRI acquisition across scanners. By contrast, electroencephalography (EEG), is a less expensive neuroimaging technique, is easier to use in a variety of clinical environments and is thus a more practical tool for guiding clinical care. In this study, we therefore adopted EEG for subtyping analyses.
One challenge to analysis of functional connectivity using EEG, however, is the fact that nearby channel-space EEG signals, or their source estimates, typically share similar artifactual variance caused by electric field spread (i.e. volume conduction), along with the limited spatial resolution of source localization methods20–22. This interferes with the extraction of neural patterns, such as functional connectivity, in an accurate manner using resting-state EEG (rsEEG) collected at the scalp23. To address this issue, a new method, power envelope connectivity (PEC), has been recently developed for estimating accurately the correlation structure of spontaneous oscillatory activity in magnetoencephalography (MEG)24,25 and then validated for EEG26. PEC estimation mitigates spurious correlations resulting from volume conduction by removing signals with zero phase lag (i.e. occurring non-physiologically simultaneously) through orthogonalization25–27. Of note, PEC was among the most reliable connectivity measures using MEG28. To this end, we sought biomarkers in PEC features extracted from source signals reconstructed from high-density resting-state EEG recordings.
As our primary goal was to delineate neurobiological heterogeneity in PTSD and MDD, rather than maximizing the differentiation of patients from healthy controls, we first defined EEG connectivity subtypes in patients. We then contrasted these connectivity patterns to healthy control connectivity, as well as assessed clinical significance with respect to prediction of clinical outcome with a variety of treatments. We used an unsupervised sparse clustering approach29 as a data-driven subtyping strategy that accomplished simultaneous feature selection and sample clustering on the high-dimensional PEC features (Supplementary Figure 1). We implemented the same subtyping analysis on four independent datasets, including two different psychiatric disorders, PTSD and MDD. Discovery of these clinically-relevant subtypes was first carried out on a PTSD discovery dataset involving 201 participants (106 with PTSD and 95 healthy controls), wherein a minority of patients were on concurrent psychiatric medications. This sample was chosen for discovery as it had the largest number of healthy controls, and it was the only data set without clinical outcome data (which we used for determination of subtyping clinical significance). We then performed several replication analyses of the discovered subtypes: first, using two independent PTSD datasets with 72 and 63 patients each (many with concurrent medication use); and second, using two MDD datasets (with 228 medication-free patients and 179 patients many with concurrent medication use, respectively) to determine the transdiagnostic potential of our subtyping results. We also examined fMRI connectivity correlates of our subtypes across datasets in order to assess for convergent validation using a distinct neuroimaging modality. Finally, we tested for the clinical significance of our subtyping findings using a diverse range of clinical interventions, including PTSD patients undergoing psychotherapy with either prolonged exposure (PE) or cognitive processing therapy (CPT), MDD patients who were randomized to receive the selective serotonin reuptake inhibitor sertraline or placebo, and MDD patients who received one of two repetitive transcranial magnetic stimulation (rTMS) treatment protocols as part of their clinical care along with psychotherapy.
Results
Resting-state EEG functional connectivity defines two clinically relevant subtypes.
To achieve data-driven subtyping on the discovery PTSD dataset (dataset 1), we combined PEC features from all eight EEG conditions (four frequency bands across eyes open/eyes closed conditions) and submitted these to a sparse clustering algorithm. Overwhelmingly, the selected features were from the beta frequency band and eyes-open condition (Figure 1a). The two subtypes were characterized by strong connectivity differences in the frontal and posterior regions (Figure 1b). The interhemispheric connectivity between homologous regions was also notable.
Fig. 1 |. Resting-state EEG power-envelope connectivity (PEC) biomarkers define two subtypes in the discovery PTSD dataset.
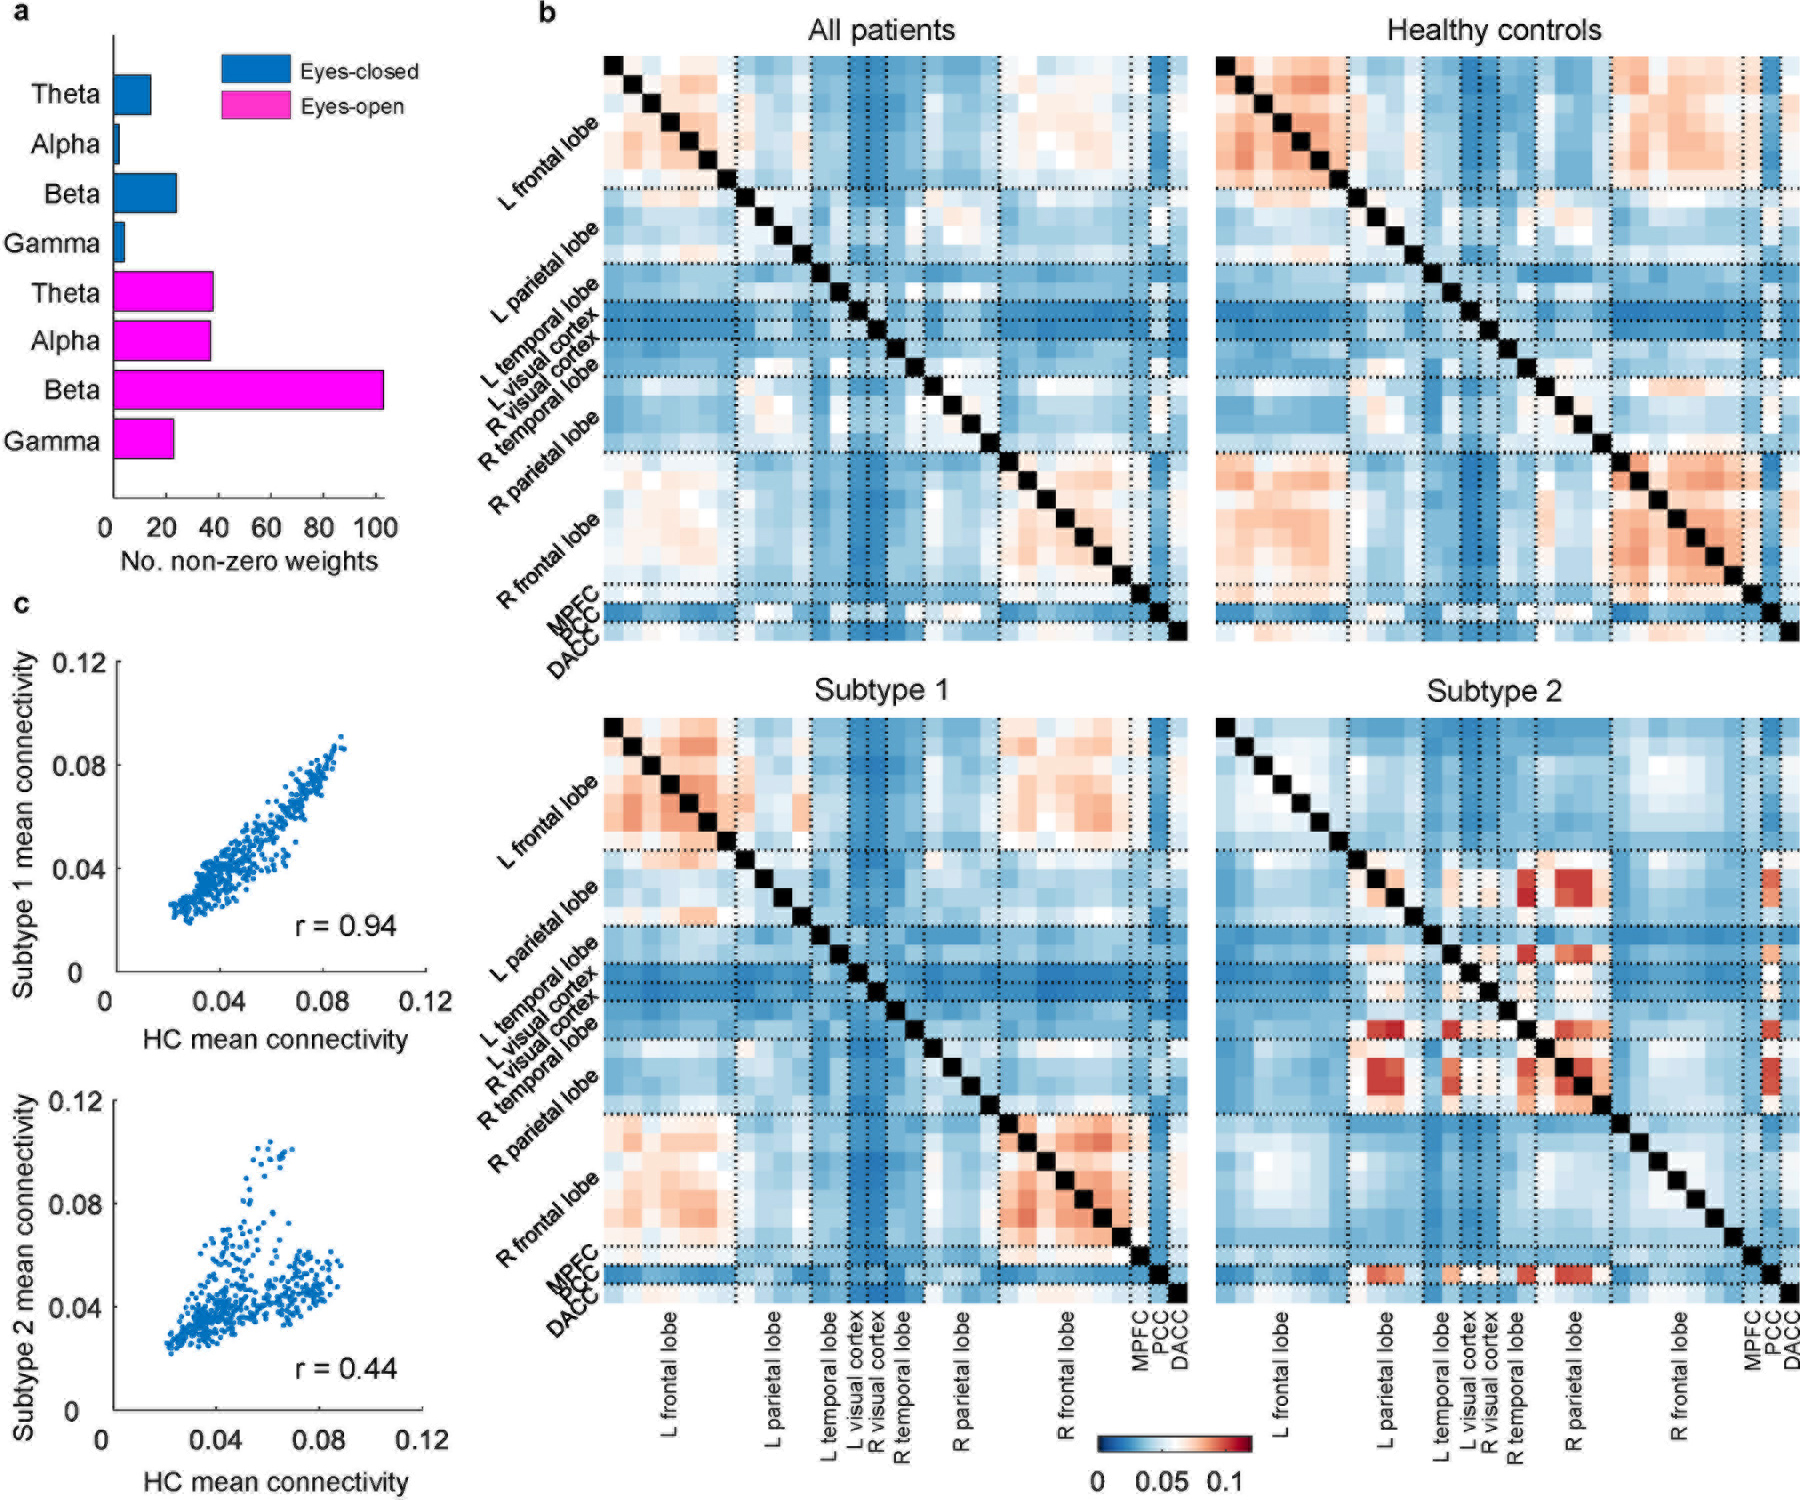
PEC was calculated across pairs of 31 regions of interest (ROIs), separately for four frequency bands (theta, alpha, beta, and gamma), as well as two resting conditions (eyes-open and eyes-closed). a, Number of non-zero feature weights for different conditions as a result of sparse clustering. Each feature weight corresponds to a PEC feature. Selected features are primarily from the beta frequency band and eyes-open condition. b, Mean connectivity matrices of all patients, healthy controls (HC), and two subtypes for the beta band eyes-open condition. The error bar indicates mean connectivity values. c, Correlation of mean connectivity between HC and subtype 1, and between HC and subtype 2, respectively. Each dot corresponds to the PEC between two ROIs. The scatterplots show that the mean connectivity patterns are highly similar between HC and subtype 1, but less so between HC and subtype 2.
The most frequently occurring PEC differences involved regions located in the frontoparietal control network (FPCN) and default mode network (DMN). Specifically, subtype 1 had stronger PEC between the frontal cortex and other regions but weaker PEC between the parietal cortex and other regions, compared to subtype 2 (Figure 2a–b). A similar PEC feature pattern was observed for the subtypes when compared with those from other datasets (Supplementary Figure 2). Importantly, no significant differences were observed in clinical severity between the two subtypes (Supplementary Figure 3a). The only demographic difference was a higher percentage of males in subtype 1 (Supplementary Table 1).
Fig. 2 |. PEC difference between the two subtypes.
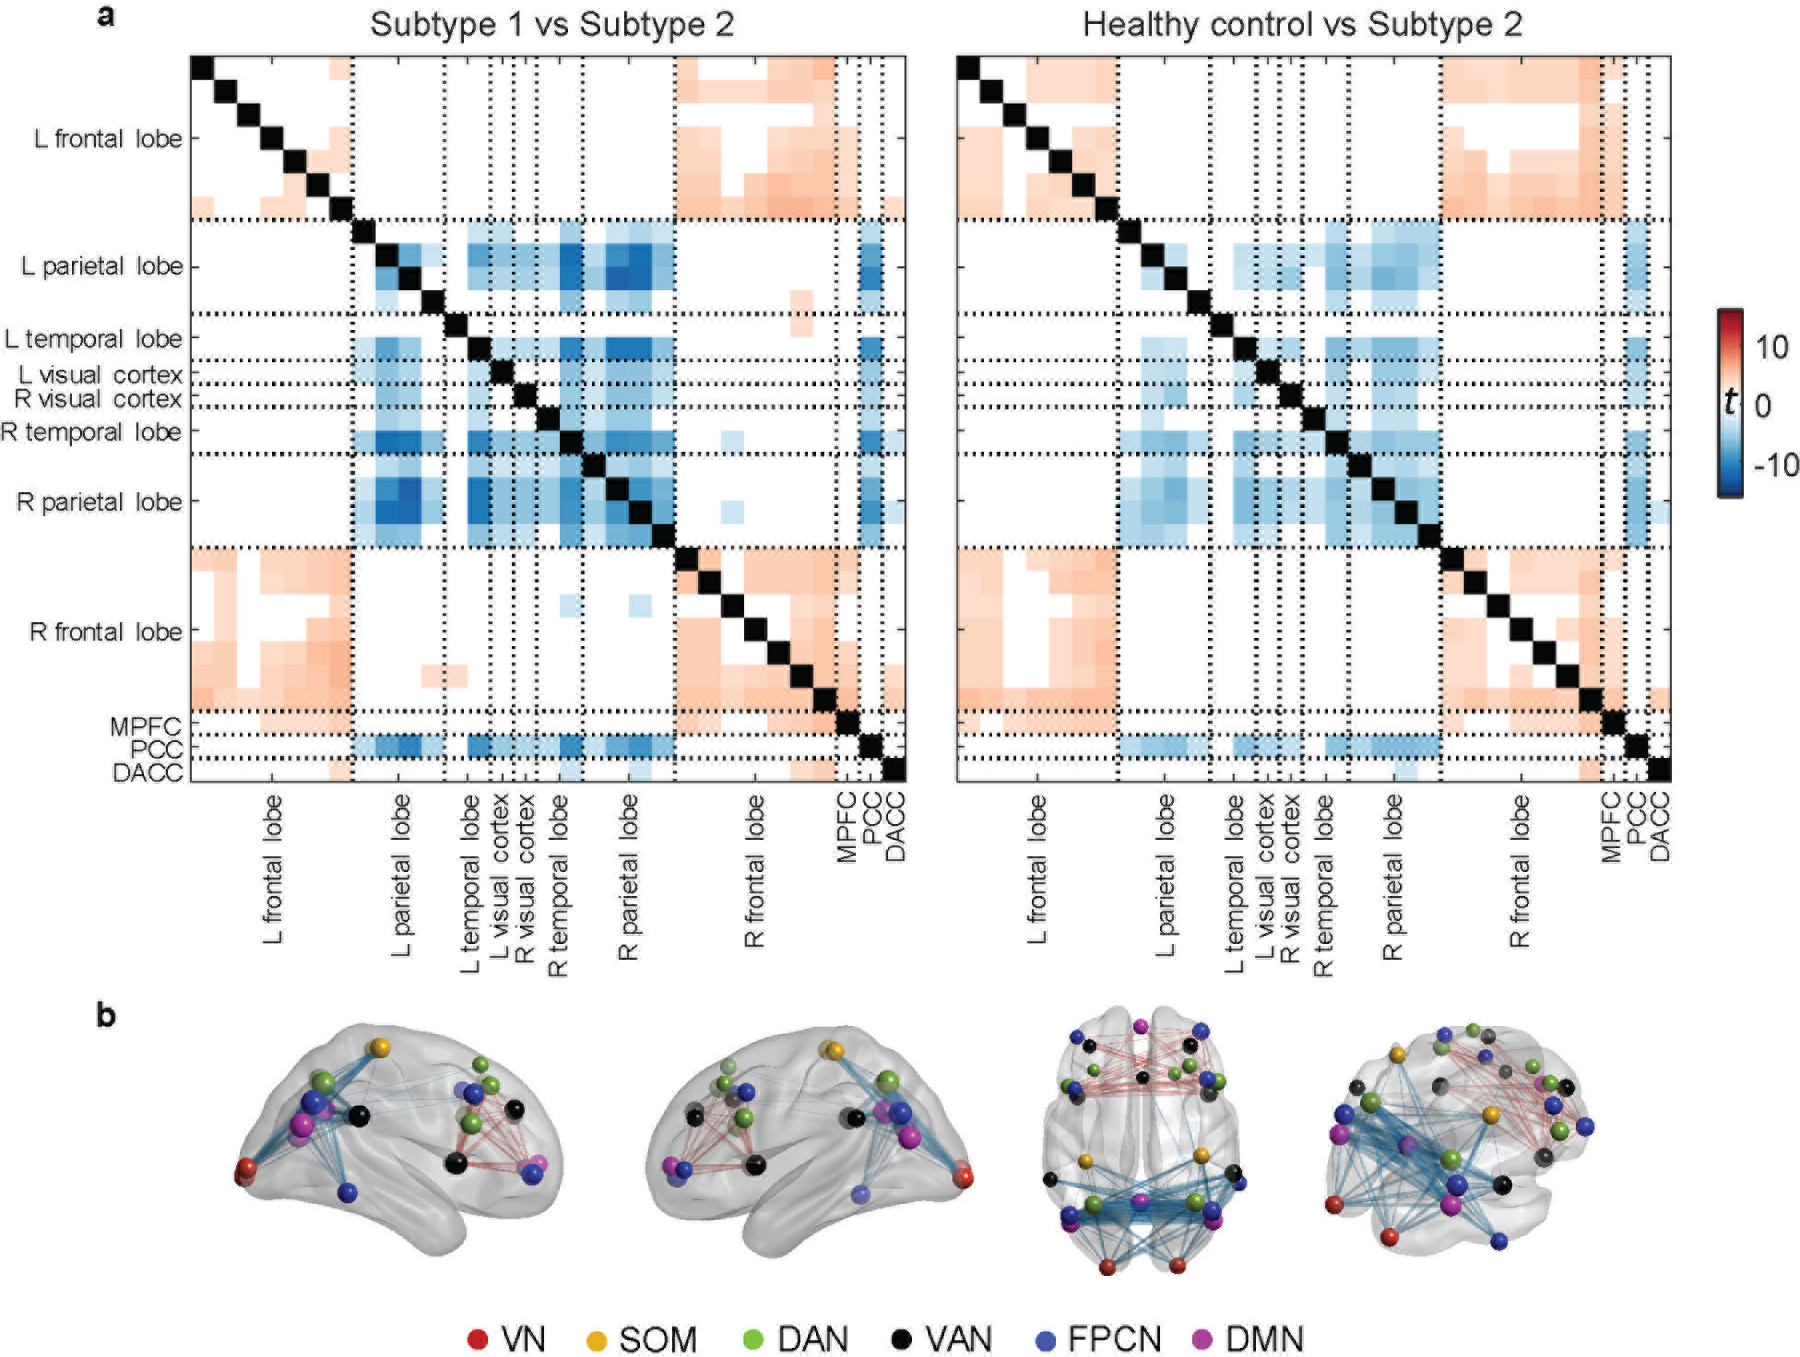
a, Connectivity difference matrices for the beta band eyes-open condition between the two subtypes and between healthy controls and subtype 2, assessed in a two-sample t-test (showing t-values with FDR corrected p<0.05). b, Visualization of connectivity difference (subtype 1 vs. subtype 2) patterns on the brain. The size of the sphere at each ROI represents the average t-value across all PEC features from that ROI to all others. Each edge represents the connectivity difference strength between two ROIs. VN = visual network, SOM = sensorimotor network, DAN = dorsal attention network, VAN = ventral attention network, FPCN = fronto-parietal control network, DMN = default-mode network.
On the entire patient population level, the mean connectivity matrix was highly correlated with that of the healthy controls (r=0.96, p<10−5). However, when each subtype was inspected separately, while the mean connectivity matrices were highly similar between healthy controls and subtype 1 (r=0.94, p<10−5), the similarity was considerably lower between healthy controls and subtype 2 (r=0.44, p<10−5) (Figure 1c).
Replication in an independent PTSD dataset.
To test whether our subtype findings could be replicated, we implemented the same analysis on an independent rsEEG dataset consisting of 135 PTSD patients who underwent rsEEG prior to receiving psychotherapy treatment (dataset 2). Dataset 2 contained two cohorts: 72 participants used for the initial submission of this paper, and 63 participants who completed the study after our initial submission. The latter group thus allowed a further independent replication of clinical prediction effects tested for in the first cohort.
We first conducted a replication analysis for the identified subtype PEC pattern with each of the two cohorts, separately. Our subtyping method, using the same feature selection process as above, was again able to yield two clusters with differential functional connectivity in the beta-band eyes-open condition, consistent with results from the discovery PTSD dataset (Figure 3a–d). Also, a similar PEC feature pattern was observed for the subtypes when compared with those from other datasets (Supplementary Figure 2). In line with the discovery dataset, no significant difference in clinical severity was observed between the two subtypes (Supplementary Figure 3b), and no differences in proportion of males (Supplementary Table 1). Furthermore, in neither dataset 1 nor 2 did concurrent use of psychiatric medications impact the subtyping result (Supplementary Figure 4).
Fig. 3 |. Replication of the identified PEC subtypes in the two cohorts within dataset 2 (PTSD replication).
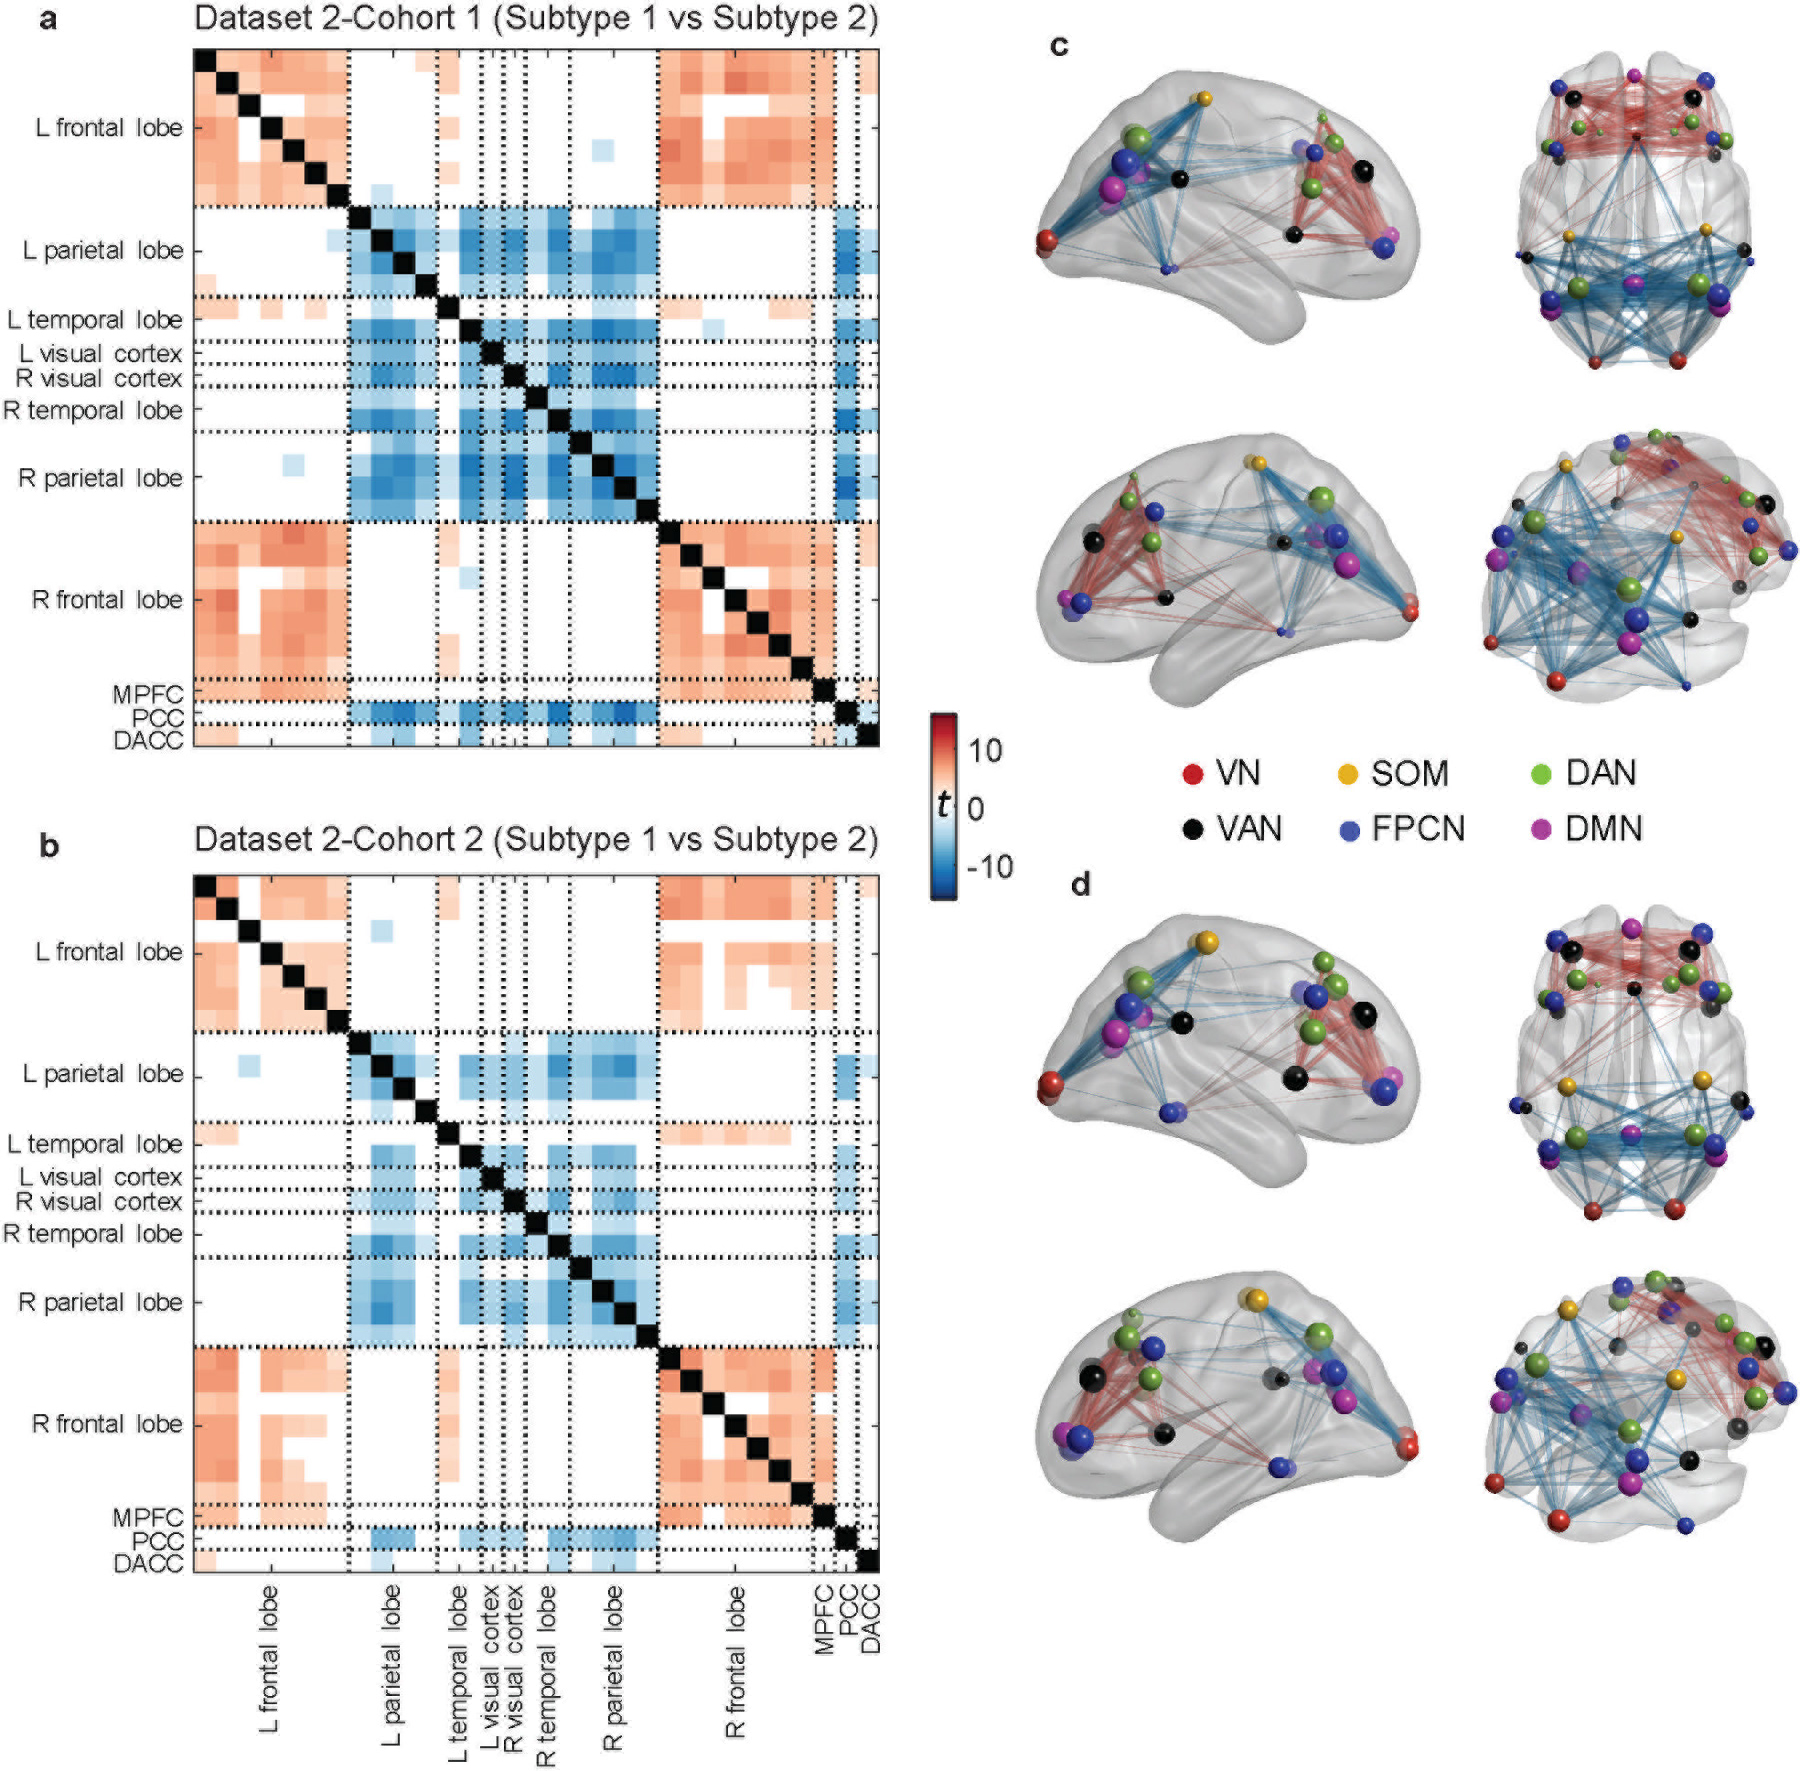
For each cohort, connectivity difference was assessed in a two-sample t-test with subtype 1 versus subtype 2 (showing t-values with FDR corrected p<0.05). a, Connectivity difference matrix obtained from the first cohort. b, Connectivity different matrix obtained from the second cohort. c–d, Visualization of connectivity difference patterns on the brain for the first and the second cohorts, respectively. For both cohorts in dataset 2, two subtypes were found with highly similar patterns of functional connectivity differences to those in the discovery dataset. VN = visual network, SOM = sensorimotor network, DAN = dorsal attention network, VAN = ventral attention network, FPCN = fronto-parietal control network, DMN = default-mode network.
Replication in two independent depression datasets.
We next investigated whether the discovered subtypes could serve as a potential transdiagnostic biomarker by applying the subtyping approach to two independent MDD datasets, involving either unmedicated MDD patients (N=228; dataset 3) or clinic-recruited MDD patients, some of whom were on psychiatric medications (N=179; dataset 4). Once again, two subtypes were observed with distinct functional connectivity patterns (Figure 4a–d) that were consistent with those discovered in the two PTSD datasets. Consistent with the findings in the two PTSD datasets, a similar PEC feature pattern was observed for the subtypes when compared with those from other datasets (Supplementary Figure 2). Likewise, no significant differences were observed in clinical severity between the two subtypes in either dataset (Supplementary Figure 3c–d). Only in dataset 4 were males more common for subtype 2 (Supplementary Table 1). The transdiagnostic relevance of our subtyping findings were also seen when conducting clustering across all patients by pooling all four datasets (Supplementary Figure 5).
Fig. 4 |. Replication of the identified PEC subtypes in the two MDD datasets.
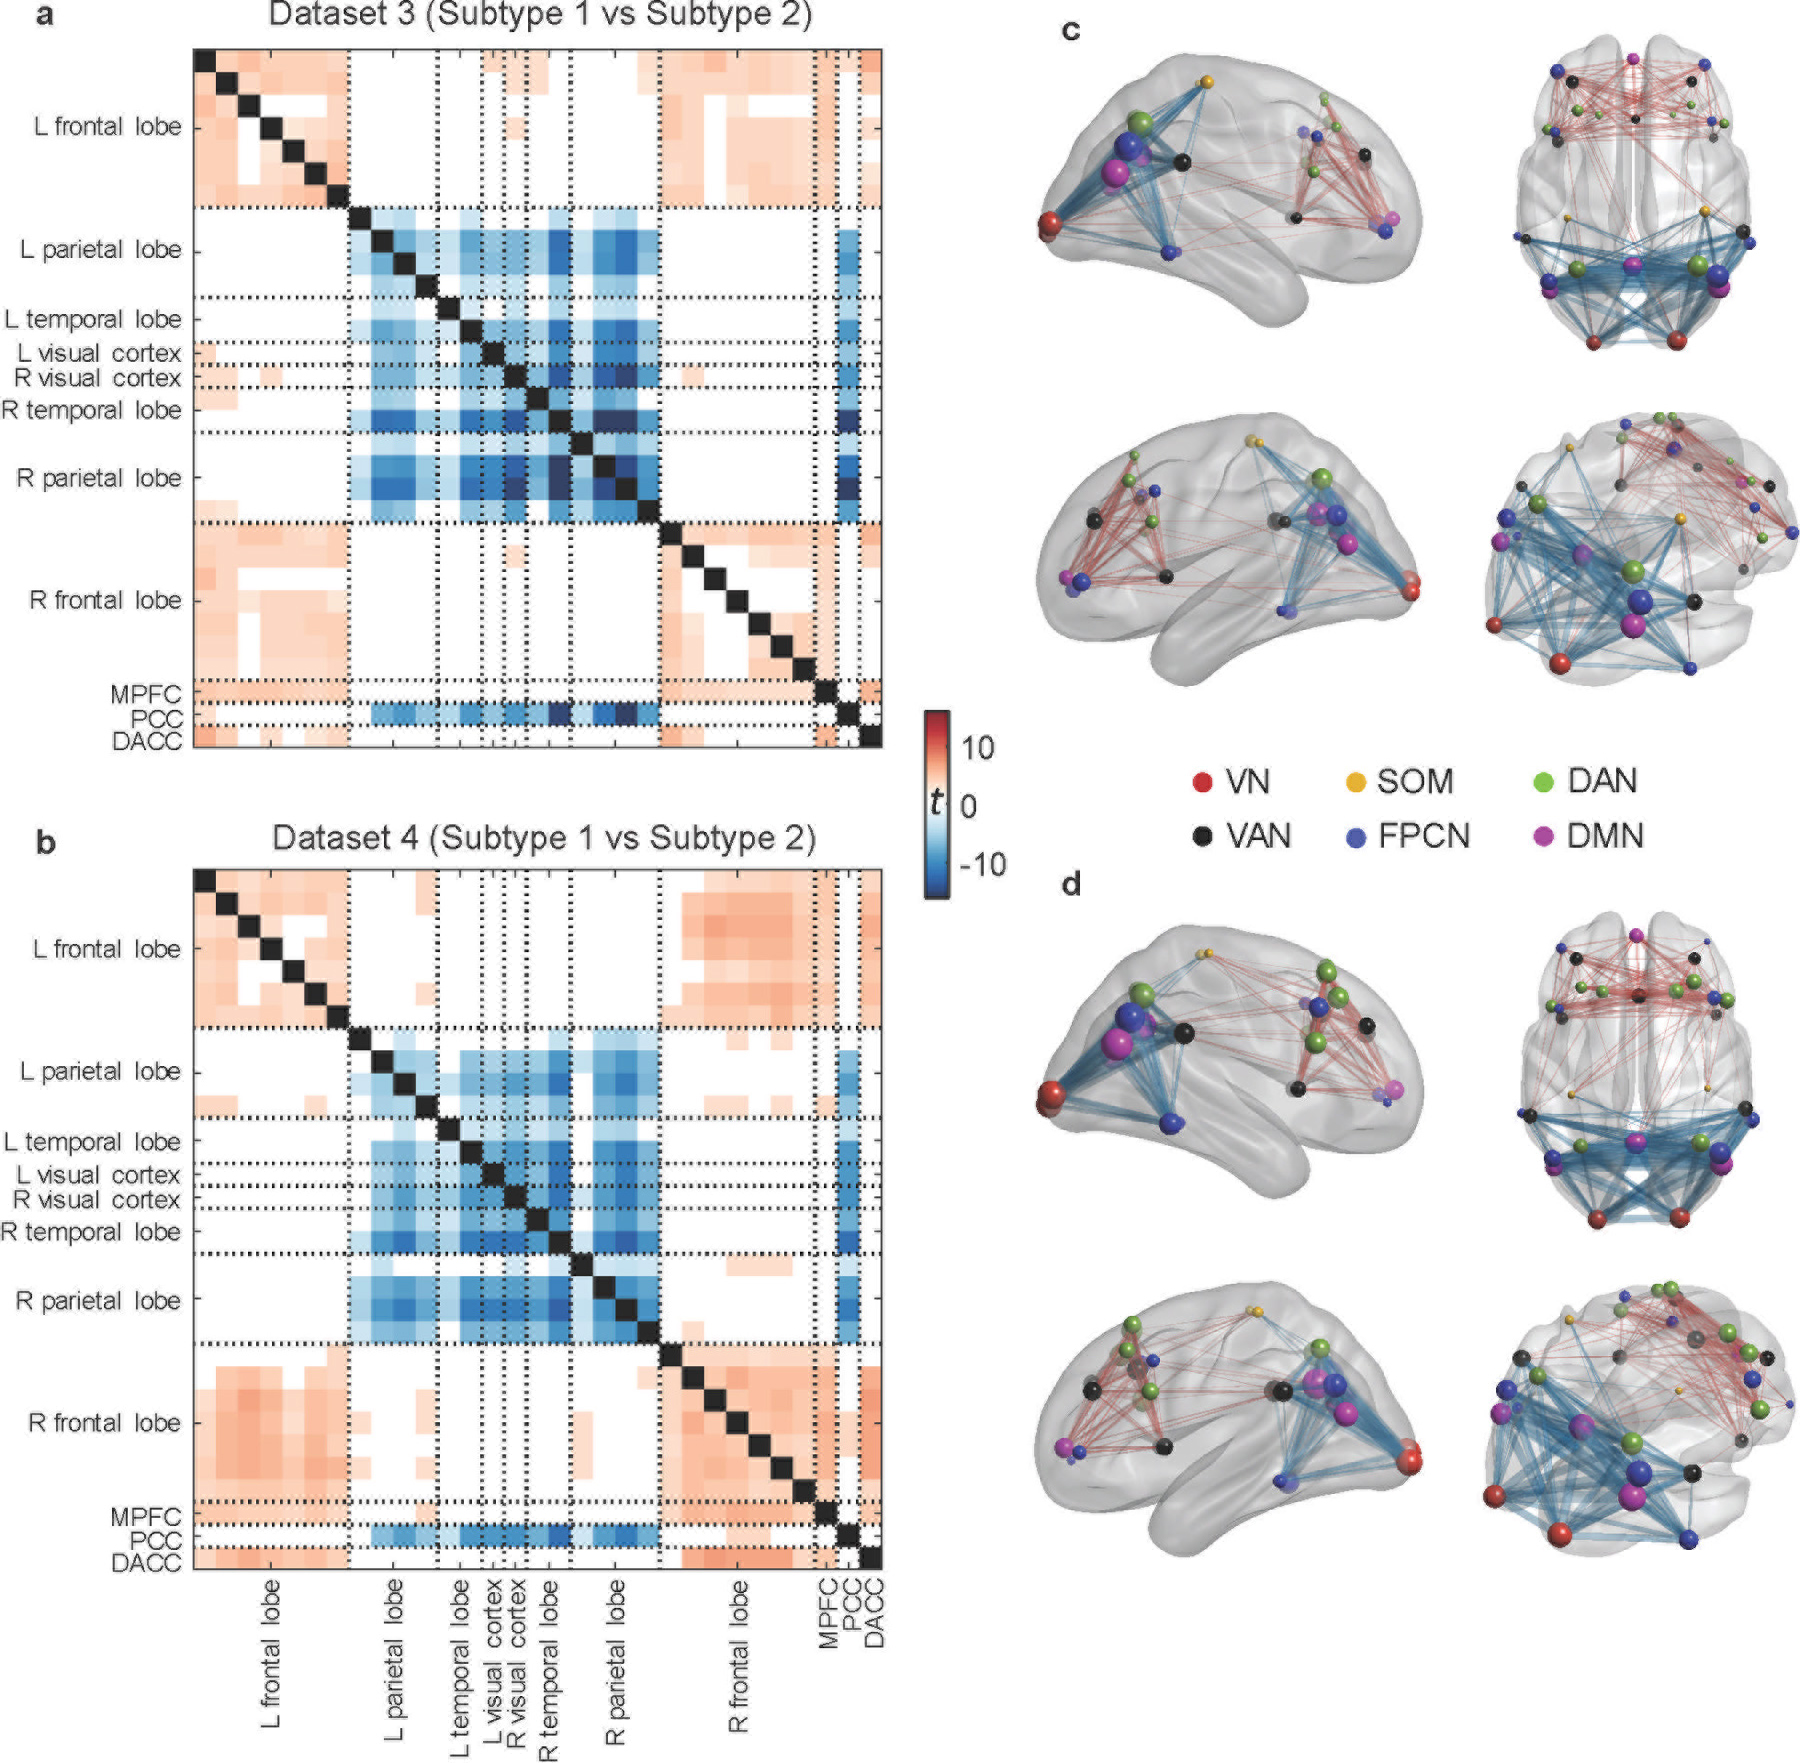
For each dataset, connectivity difference was assessed in a two-sample t-test with subtype 1 versus subtype 2 (showing t-values with FDR corrected p<0.05). a, Connectivity difference matrix obtained from dataset 3. b, Connectivity matrix difference obtained from dataset 4. c–d, Visualization of connectivity difference patterns on the brain for datasets 3 and 4, respectively. Two subtypes were discovered with distinct functional connectivity patterns that were consistent with those found in the two PTSD datasets. VN = visual network, SOM = sensorimotor network, DAN = dorsal attention network, VAN = ventral attention network, FPCN = fronto-parietal control network, DMN = default-mode network.
Validation of subtype transferability across datasets.
To assess the transferability of the discovered neurophysiological subtypes, we applied a cluster centroid-based pattern classifier derived from the subtypes of one dataset to PEC features of another and compared the predicted subtype labels from the classifier with those obtained from clustering analysis of the second dataset. The classification accuracies averaged 90.6% and in all cases were greater than 86% (Figure 5a). Furthermore, we iteratively trained the classifier on three of the datasets and tested on the fourth, which yielded an average of 89.9% accuracy, with all datasets greater than 88% (Figure 5b). These results demonstrate that the discovered subtypes were transferable across independent datasets acquired using different EEG equipment, using differing clinical diagnoses and patient identification methods, and recorded for different amounts of time. This conclusion was further supported by a permutation test of each dataset, which failed to reveal the observed subtypes in the original data (Supplementary Figure 6). Additionally, use of both the gap statistic criterion and Calinski-Harabasz criterion confirmed that two clusters are the optimal solution across datasets (Supplementary Figure 7a–b). On the other hand, we implemented a comparison analysis with the 26 channels that were comparable across all datasets (to match dataset 4). For each of datasets 1 – 3, we down-sampled the channels to a subset (Supplementary Figure 8a) and used the 26 channels that were most close to those of dataset 4 to rerun the source localization and PEC calculation. Then, we compared how consistent the subtype PEC pattern was between using all channels and the selected 26 channels. The results indicated that the subtype PEC pattern derived by the down-sampled 26 channels was similar with that obtained using all channels for each of datasets 1 – 3 (Supplementary Figure 8b). However, we still used all available channels for the experimental analysis since penalizing the three high-density datasets by the number of channels in the lowest density dataset may discard potentially useful information.
Fig. 5 |. Validation of subtype transferability across independent datasets.
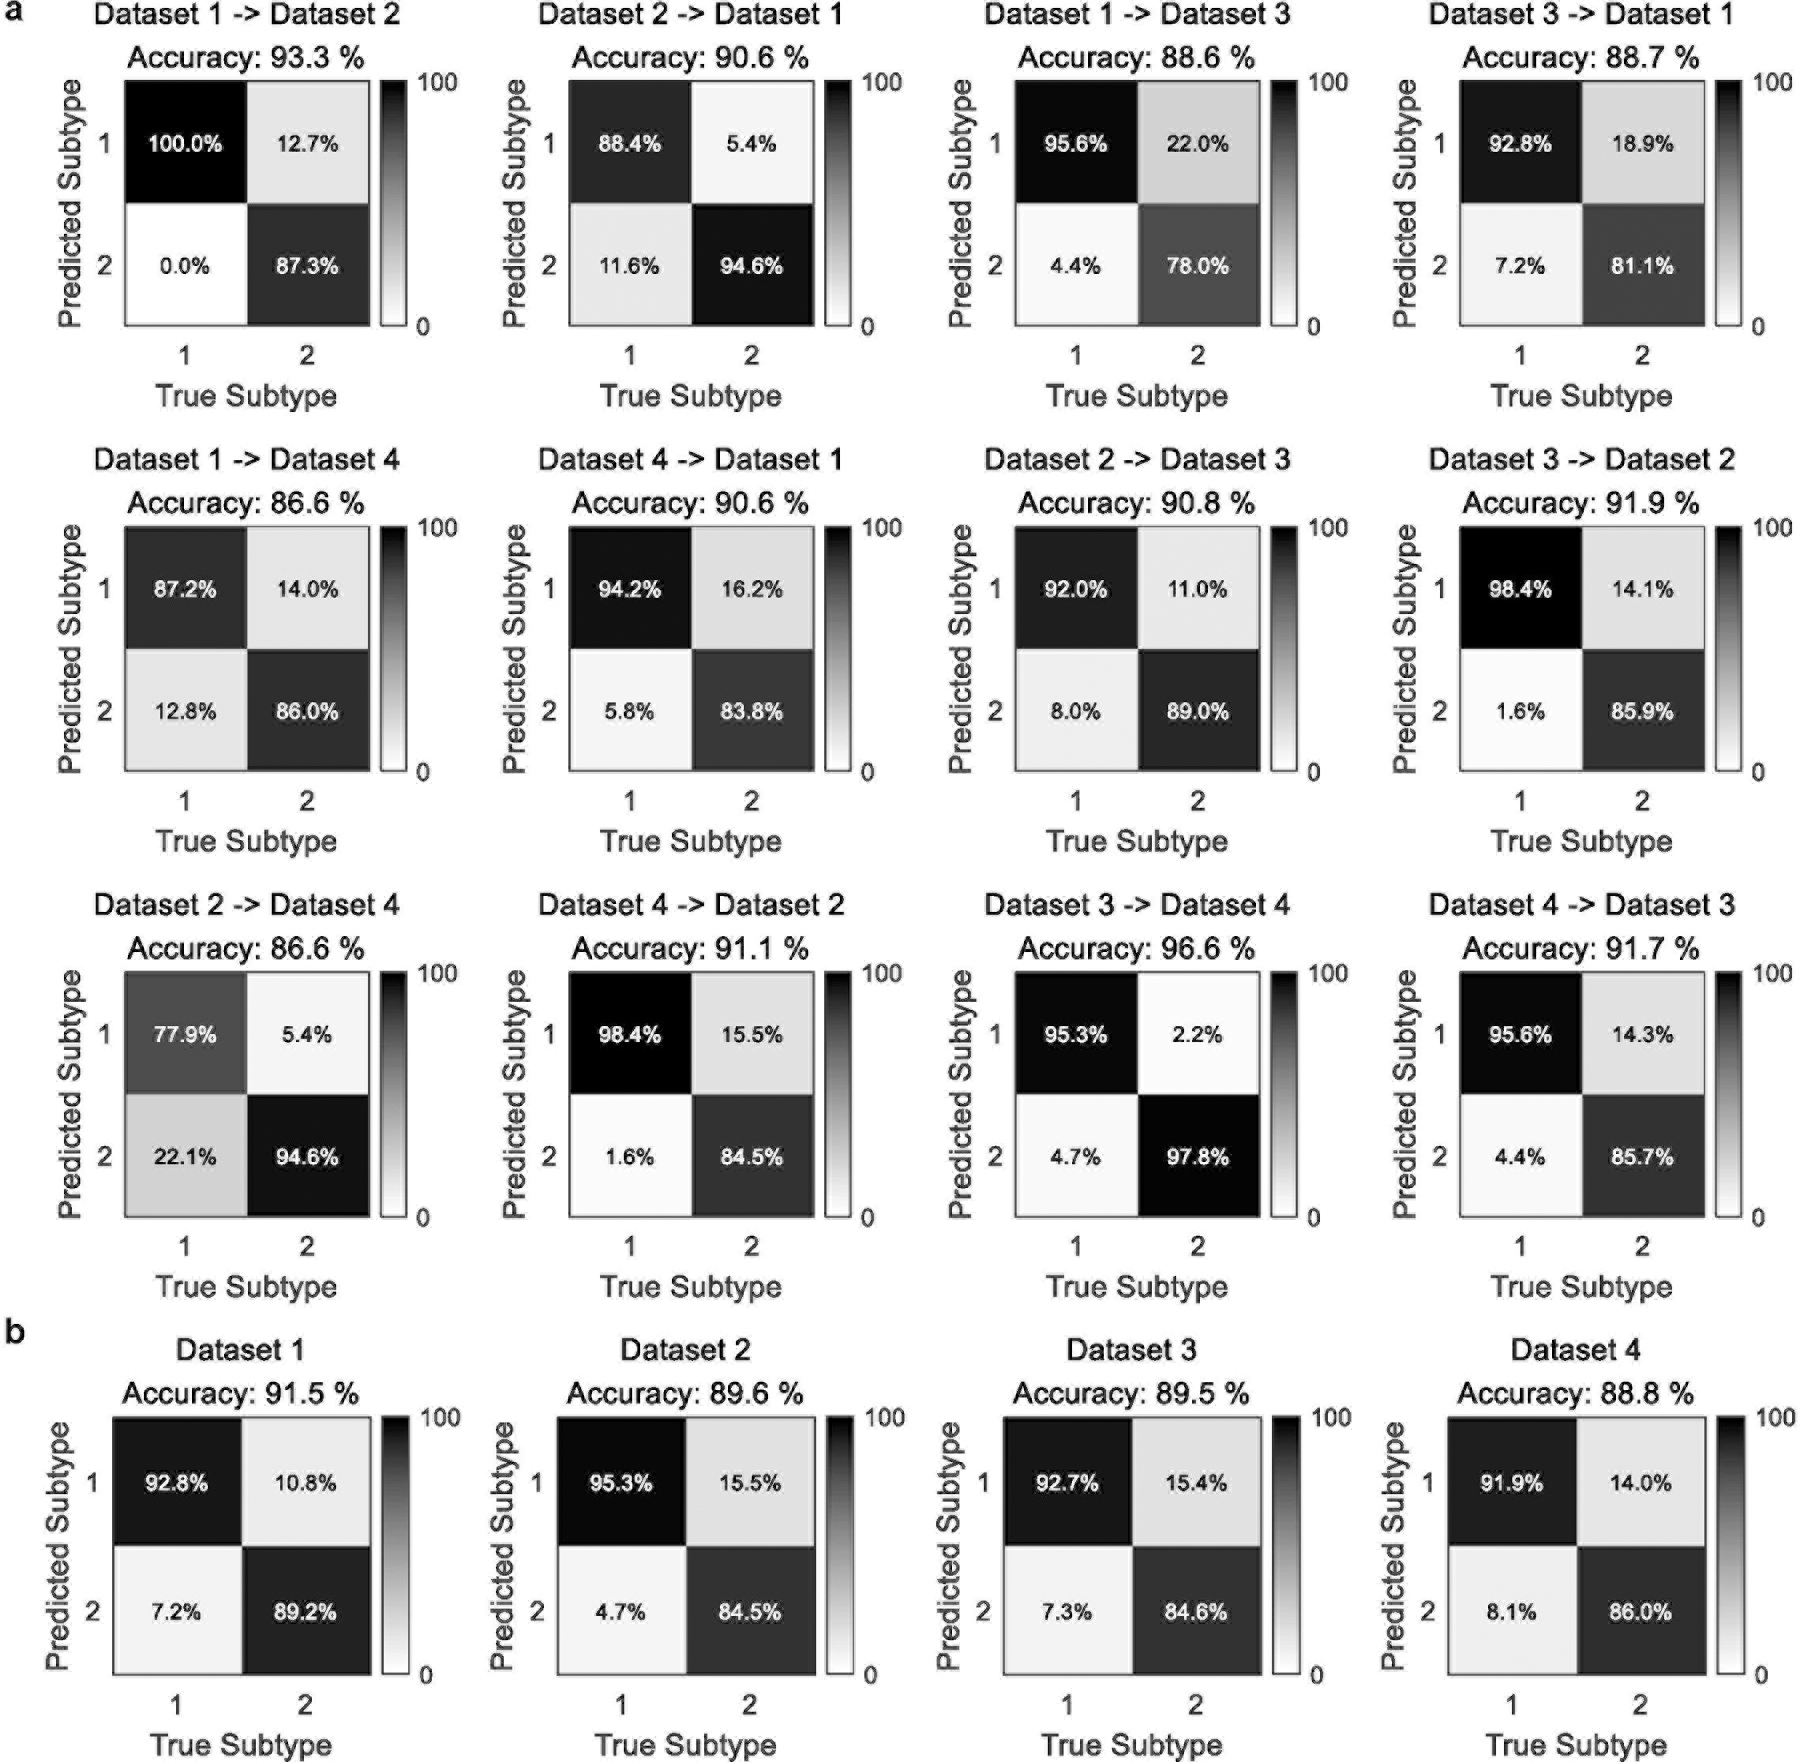
A cluster-centroid-based classifier was derived from the sparse clustering analysis from one dataset (using PEC features from beta band eyes open condition) and then applied to data from another independent dataset, resulting in predicted class labels. Classification accuracy was then calculated by comparing the predicted class labels with those obtained from the sparse clustering analysis on the second dataset. a, Training on one dataset and tested on one other. b, Training on three datasets and tested on the fourth.
Clustering on healthy controls.
In addition to the patient subtyping analysis, we also implemented clustering on PEC features extracted from healthy controls of dataset 1. Similar subtype PEC patterns were observed in healthy control group as those found in patient group (Supplementary Figure 9a–b). However, subtype identity was less stable and more variable amongst healthy control compared to patient data (Supplementary Figure 9c). In addition, it should be noted that the purpose of this study was to understand heterogeneity in patients, where it would have clinical significance. At present, the significance of these subtypes in healthy controls is unknown but may represent an underlying trait-like neurobiological feature.
Subtype-based diagnostics.
In order to investigate how the discovered subtypes could mitigate heterogeneity and improve the diagnosis-based comparisons for a certain subtype, we applied the classifier derived from the sparse clustering solution (Supplementary Methods) on datasets 2, 3, and 4 to PEC features of healthy controls from dataset 1, the only dataset where enough healthy controls are available, and investigated the misidentification rate of healthy controls for each subtype. The rate of healthy controls misidentified as subtype 2 was 21.0%, which was much lower than being mis-identified as subtype 1 (79.0%). When both healthy controls and patients were considered, the overall rate of a participant misidentified as subtype 2 was 15.2%, achieving an identification rate of subtype 2 with a sensitivity of 89.2% (Figure 5b). These results suggest that identifying heterogeneous EEG-based subtypes in psychiatric patients might enhance differentiation from healthy controls, though this was not the primary goal of this study.
Further validation based on fMRI connectivity.
To further validate that our identified subtypes indeed represent internally valid and neurobiologically meaningful phenotype related to brain connectivity, we carried out a classification analysis to distinguish the two EEG-connectivity defined subtypes using resting-state fMRI connectivity features, pooling across fMRI data in datasets 1 – 3. Our classifier with resting-state fMRI was able to distinguish the two EEG-connectivity driven subtypes with an accuracy of 83.9% (permutation test, p<0.0001), a sensitivity of 85.7% in detecting subtype 1 and 81.2% in detecting subtype2 (Supplementary Figure 10a). The most discriminative features involved regions of FPCN, VAN, and visual network (Supplementary Figure 10b). By comparing the PEC difference and fMRI connectivity classifier profiles, we observed a consistent pattern between PEC and fMRI connectivity in distinguishing the two EEG subtypes (Supplementary Figure 10c). Here, 90 out of 465 connections are overlapping and a consistent pattern is observed between EEG and fMRI, mainly involving FPCN, DMN, and VAN regions. These results further provide strong evidence to support the convergent validation of our PEC-defined subtype findings.
Responsiveness of subtypes to treatment.
Finally, and especially considering the lack of clinical severity differences between the subtypes prior to treatment, we sought to determine whether the two subtypes held clinical significance by examining treatment outcome data, which was available in the three replication datasets.
Patients in the PTSD replication cohort (dataset 2) received either prolonged exposure (PE) or cognitive processing therapy (CPT), which are presently the most evidence-based treatments for PTSD. We divided the dataset into two cohorts: 72 participants used for the initial submission of this paper and 63 participants who completed the study after the initial submission (and thus information on which was not available with our first submission). Using linear mixed-models in an intent-to-treat analysis on clinician-rated PTSD severity (Clinician-administered PTSD Scale (CAPS)) that incorporated both completers and dropouts, we found that subtype 1 had a better treatment outcome compared to subtype 2 (group x time interaction: F(1,123)=9.04, p=0.0032, Cohen’s d=0.80 for CAPS-IV and F(1,123)=4.38, p=0.039, Cohen’s d=0.59 for CAPS 5; Figure 6a). If further dividing by psychotherapy type, subtype 1 had significantly better outcome across both treatments, as well as separately for PE (F(1,38)=7.23, p=0.011 for CAPS-IV and F(1,38)=2.90, p=0.097 for CAPS 5) and for CPT (F(1,81)=4.75, p=0.032 for CAPS-IV and F(1,81)=2.41, p=0.12 for CAPS 5). To further replicate the response of the subtypes to psychotherapy treatment, we applied the subtyping analysis to the second cohort followed by linear mixed-model effect analyses. Consistent with those observed on the first cohort, subtypes status in the second cohort similarly predicted responsiveness to the psychotherapy treatment, with subtype 1 responding significantly better than subtype 2 (group x time interaction: F(1,109)=4.76, p=0.031, Cohen’s d=0.56 for CAPS-IV and F(1,109)=4.46, p=0.037, Cohen’s d=0.55 for CAPS 5; Figure 6b). When separating patients by treatment arms, we observed a significant response difference between the subtypes for PE (F(1,34)=3.09, p=0.088 for CAPS-IV and F(1,34)=9.31, p=0.0044 for CAPS 5) and a marginally difference in the expected direction for CPT (F(1,71)=2.13, p=0.15 for CAPS-IV and F(1,71)=0.74, p=0.39 for CAPS 5). To assess the strength of our subtype findings on predicting treatment response, we compared the percentage of responders between the two subtypes. Subtype 1 included significantly more responders with PTSD than those in subtype 2 for psychotherapy treatment (X2=4.07, p=0.044, with a number needed to treat of 5.1 for CAPS-IV; Supplementary Figure 11a).
Fig. 6 |. Responsiveness of subtypes to treatment across diagnoses and treatment modalities.
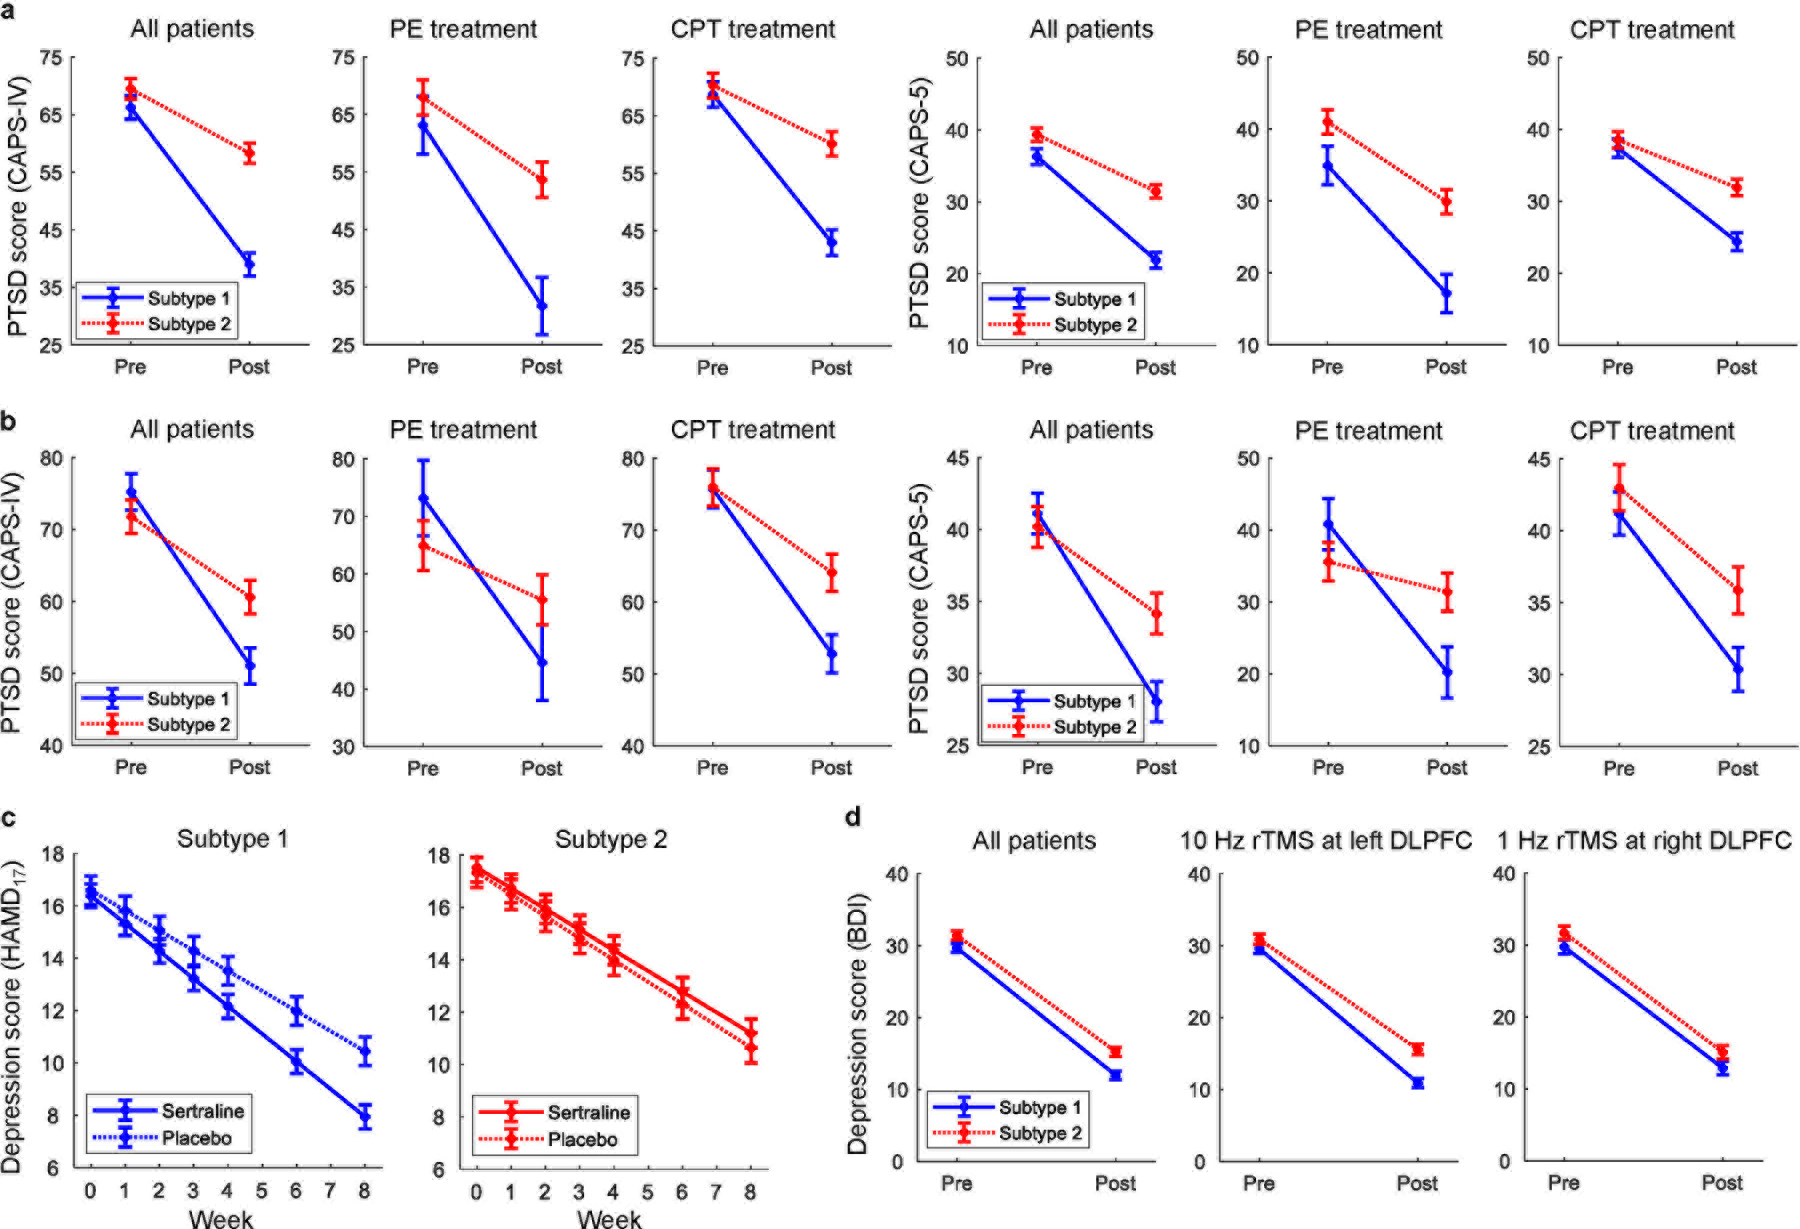
a, Subtype 2 patients had worse outcomes to psychotherapy treatment in PTSD for the first cohort of dataset 2. b, Similarly, subtype 2 patients responded significantly worse than subtype 1 to psychotherapy treatment in PTSD in the second cohort of dataset 2. c, Subtype 2 patients failed to respond differentially to an antidepressant versus placebo in MDD (dataset 3), whereas for subtype 1 the antidepressant was superior to placebo. d, Both subtypes responded equally well to one of the two different rTMS treatment protocols in MDD (dataset 4). All error bars indicate the standard error of the mean.
One of the MDD replication cohorts (dataset 3) was randomized post-EEG to receive either the antidepressant sertraline or placebo. Linear mixed models on clinician-rated depression severity (Hamilton Depression Rating Scale (HAMD17)) in an intent-to-treat analysis revealed that the two subtypes differed in their response to sertraline versus placebo (Figure 6c). Specifically, while sertraline was significantly better than placebo for patients in subtype 1 (group x time interaction: F(1,851)=6.38, p=0.012), the two arms failed to separate for patients in subtype 2 (F(1,517)=0.093, p=0.76). The treatment response analysis revealed that for sertraline, subtype 1 included significantly more responders with MDD than those in subtype 2 for antidepressant medication (X2=4.49, p=0.034, and the number needed to treat is 4.2). However, for placebo, there was no significant difference (X2=0.041, p=0.84) in the number of responders between the two subtypes (Supplementary Figure 11b).
We further tested for subtype-related differences in treatment outcome to rTMS concurrent with psychotherapy, which was given using one of two protocols to the patients in the second MDD replication cohort (dataset 4; 10Hz to the left dorsolateral prefrontal cortex or 1 Hz to the right dorsolateral prefrontal cortex). Linear mixed models on self-reported depression severity (Beck Depression Inventory (BDI)) in an intent-to-treat analysis showed an effect of time for either rTMS protocol (F(1,142)>27, p<0.00001 for 10 Hz and F(1,207)>22, p<0.00001 for 1 Hz), but no difference between subtypes in either protocol (F(1,142)=1.5, p=0.22 for 10 Hz and F(1,207)=0.01, p=0.92 for 1 Hz, Figure 6d). A Bayes factor analysis30 was also used to quantify support for the null hypothesis of no differential treatment outcomes with rTMS between subtypes. We obtained Bayes factor BF10=0.23 for alternative hypothesis (H1) versus null hypothesis (H0) is 0.23. A BF10 value above 1 indicates evidence for alternative hypothesis over null hypothesis, whereas a value below 1 indicates the exact opposite. Conventionally, the strength of evidence is at least moderate for null hypothesis over alternative hypothesis when BF10 is in the range 0.1 – 0.33. Thus, the Bayes factor result provided further support for the lack of treatment outcome difference between subtypes.
Thus, in contrast to baseline clinical measures, on which the subtypes didn’t differ, their response to treatment on the same measures differed strikingly across a variety of treatments. Moreover, whereas the subtypes differed in their response to psychotherapy and antidepressant medication, the two subtypes responded similarly to each of two different protocols in the concurrent rTMS with psychotherapy treatment study. We also report the results of these treatment prediction analyses on item-level clinical scores in Supplementary Tables 2–4.
Clustering on clinical scores.
In order to confirm that our subtype findings were specific to EEG, we also clustered the clinical scores and demographic information alone. For each dataset, the baseline item-level clinical scores and demographic variables (i.e., age, gender, and years of education) were used as the features for clustering to generate clinical subtypes. The number of clusters was assessed using gap statistic criterion31 (Supplementary Figure 12a). By contrast with the replicable subtypes derived from PEC features, the clinical/demographic features identified three subtypes in discovery PTSD dataset 1, but no subtypes in replication PTSD dataset 2. Likewise, no clinical subtypes were found on MDD dataset 3, while two subtypes were identified using clinical features in MDD dataset 4 (Supplementary Figure 12b). That is, clustering on clinical and demographic variables demonstrated that our replicable disease subtypes using PEC features could not be discovered using clinical measures alone. The results confirmed that the EEG-connectivity subtyping capitalized on neural information that was not available in the standard clinical and demographic variables.
Discussion
A central limitation of much neuroscience research in psychiatry has been that patients have been considered as a unitary group for which a maximally sensitive way to differentiate them from controls is needed. Evidence suggests that studying case-control group differences may impede psychiatric biomarker discovery and an understanding of psychiatric pathophysiology due to intrinsic heterogeneity in neurobiological abnormalities within currently clinically-defined diagnoses3,4,32. Moreover, how biomarkers that can elucidate this heterogeneity are to be identified, and replicated, has remained a long-standing challenge33. In this study, we have taken the perspective that understanding the best way to describe biological heterogeneity in patients through a data-driven effort will help inform the best questions to ask with respect to clinical outcomes and relationship to healthy controls4. Here, we implemented a data-driven neurobiological analysis by examining PEC-based signals from rsEEG that led to discovery of two replicable disease subtypes, based on primarily eyes-open beta-band connectivity differences, and evident across two major psychiatric populations (i.e. PTSD and MDD). While these two subtypes did not differ in terms of baseline clinical severity in any of the four datasets studied, they did differ in terms of clinical outcome with respect to either psychotherapy (for PTSD, which we furthermore replicated) or treatment with an antidepressant versus placebo (for MDD). In particular, subtype 2, whose PEC patterns were more distinct from those of healthy controls, responded less well to both treatments. By contrast, treatment with rTMS concurrent with psychotherapy was equally effective in both subtypes (for MDD). Moreover, the finding of different predictors of response to medication versus rTMS draw further support from our prior work, as well as that of others. Most notably, more intact default mode network connectivity in the iSPOT-D study predicted better treatment outcome with antidepressant treatment34, while more perturbed default mode network connectivity predicted better outcome with rTMS35. Unlike prior work, however, here we included a placebo medication arm, demonstrating that the subtypes differ in medication response relative to placebo as well. Thus, our findings substantially advance the identification and potential clinic-translatability of psychiatric disease subtypes, achieving a long-sought goal for the field.
Subtype 1 was also found to have a PEC pattern more similar to that of heathy controls. Our interpretation of subtype 1, consistent with a long history of findings in psychiatric neuroimaging, is that on any given measure there are many patients who are equally symptomatic but do not demonstrate a biological abnormality relative to healthy controls. Not doing so on one measure (EEG connectivity in our case) does not, however, mean that they do not differentiate from healthy controls on other measures. Importantly, though, the fact that we could differentiate the two subtypes in a purely data-driven manner that made no reference to healthy control EEG connectivity, and that one subtype overlapped highly with controls while the other did not, makes a strong statement in particular about the relevance of identifying the subtype that ended up differing from controls and responding poorly to psychotherapy and antidepressants.
A fundamental challenge in discovering biomarkers for psychiatric conditions is the accurate identification of those features most relevant to understanding a particular clinical population. We extracted PEC from source-localized rsEEG as the features for biomarker discovery. PEC computation has proven to be effective for mitigating the effects of volume conduction, a major shortcoming of EEG data, thereby accurately capturing neurobiologically-meaningful connectomic information within different frequency bands of spontaneous oscillatory activity36. Using this method, a previous study from our group used PEC to investigate the connectivity abnormality in PTSD patients versus healthy controls as a group-wise comparison27. Doing so revealed a PTSD-related connectomic difference almost exclusively in eyes-open theta-band PEC. Those results differ from the present work on two critical fronts – that the present analysis focuses on a data-driven dissection of heterogeneity rather than identifying group-level differences based on clinical categories, and as a consequence that the resulting PEC features have no overlap.
Since different frequency bands and EEG resting-state paradigms (e.g., eyes open and eyes closed) may carry different neurobiological information, which condition possesses the most informative features for subtype identification is unknown a priori. Instead of analyzing each condition separately, we employed sparse clustering29 approach to implement simultaneous feature selection and clustering by maximizing the between-cluster dissimilarity with a sparsity constraint on the PEC features. This data-driven approach identified that PEC features from the beta-band eyes open condition were the most informative biomarkers for delineating the two discovered subtypes. Beta-band PEC in prior MEG and simultaneous EEG-fMRI work is best able to yield large-scale functional networks with spatial features qualitatively and quantitatively similar to resting-state fMRI networks37,38. In our data, the beta-band eyes open condition yielded two subtypes characterized by strongly divergent PEC patterns in the frontal and posterior regions, respectively. Interestingly, the mean PEC patterns across either all patients or healthy controls resembled previously reported group-level healthy control beta-band PEC patterns in MEG studies28,39. Although the mechanism mediating the two divergent connectivity patterns we discovered remains unclear, computational models may be employed to shed light on the possible scenarios that may account for PEC patterns similar to those we observed39,40. For instance, a model of coupled oscillators was used to study the source of the amplitude fluctuations observed in resting MEG signals of healthy subjects, where good agreement between the simulated and actual amplitude envelope connectivity patterns was achieved with proper coupling strengths and temporal delays between regions31. This model may help us understand factors that give rise to the distinct PEC patterns of the two subtypes.
Of note, unlike other prior studies, which focused only on a priori regions of interest or which selected features based on their correlation with clinical symptoms41, our connectivity biomarker discovery was based purely on EEG data without assuming any prior knowledge about individual brain regions, frequency bands or resting-state paradigms. Consequently, this feature selection eschewed the potential bias due to a selective focus on brain regions that were thought to contribute to the pathophysiology of psychiatric disorders, which, however, might not be optimal for subtype identification. Moreover, our finding generalized across distinct datasets, which used different clinical criteria (and for different diagnoses), had variable rates of concurrent medication use, as well as used different EEG equipment (including amplifiers, channel count and montages).
Using the sparse clustering-based data driven approach, we found that the most informative PEC features were located in regions that contribute to the FPCN and DMN. Specifically, subtype 1 which, had stronger beta-band PEC in frontal regions but weaker beta-band PEC in parietal regions relative to subtype 2, gained significantly greater clinical benefit from either psychotherapy or antidepressant medication (versus placebo). In accordance with our findings, previous fMRI studies42–47 have reported that functional connectivity abnormalities in the FPCN and DMN were associated with the treatment outcome of psychotherapy in various psychiatric disorders. Specifically, lower pre-treatment functional connectivity in the cognitive control network including dorsolateral prefrontal cortex (DLPFC) and anterior cingulate cortex (ACC) was found to predict poorer antidepressant outcome42. A whole-brain voxel-wise analysis on resting-state fMRI revealed that treatment response to cognitive-behavioral therapy in generalized social anxiety disorder was predicted by amygdala-prefrontal connectivity43. Stronger DLPFC activity and DLPFC-cerebellum connectivity during working memory task at baseline was found to be strongly associated with a favorable response to cognitive-behavioral therapy in schizophrenia44. Pre-treatment within DMN connectivity was observed to predict post-treatment symptom severity of obsessive-compulsive disorder after cognitive behavioral therapy45. Pre-treatment DMN connectivity was also observed to contribute significantly to the multivariate pattern analysis for predicting clinical responses to antidepressant medication46. A randomized controlled trial also revealed that pre-treatment connectivity between posterior cingulate cortex (PCC) and ACC/medial prefrontal cortex (mPFC) predicted remission on antidepressant47. In addition, deactivation of the precuneus and PCC in DMN during emotion discrimination task was observed to predict treatment outcome of antidepressant medication48. On the other hand, greater magnetoencephalography connectivity between DLPFC and ACC in alpha band at baseline was found to predict better antidepressant treatment49. Pre-treatment EEG beta connectivity in frontal regions was reported to be positively correlated with clinical score change in MDD50. The similarities in the key regions identified in our EEG subtyping analysis and those previously reported in treatment prediction studies by fMRI are further echoed by regions with fMRI connectivity differences we observed in our data when dividing patients by their EEG-determined subtypes.
Our findings also suggest that rTMS-based neurostimulation treatment may provide a promising approach for treating patients who are otherwise less responsive to treatment51. Although subtype 2 was shown to be less responsive to psychotherapy and antidepressant medication, our rTMS findings demonstrated that both subtype 1 and subtype 2 responded similarly to two different rTMS treatment protocols (left-prefrontal 10Hz and right-prefrontal 1Hz). This suggests that neurostimulation may be a good option relative to psychotherapy and antidepressant medication for subtype 2. In other words, our identified neural “medication/psychotherapy-resistance” phenotype may be separate from brain features that mediate responsive to rTMS with concurrent psychotherapy, and thus patients in subtype 2 may be better served clinically by advancing faster to rTMS. It is typical that patients receive multiple rounds of pharmacological treatment for years, resulting in substantial morbidity and economic cost, prior to resorting to a treatment modality such as rTMS52,53. Even then, only a small minority of treatment-resistant depressed patients receive rTMS. More rapidly advancing patients with an antidepressant non-responsive brain phenotype to as rTMS, despite the cost of this procedure, may thus make both clinical and financial sense52–55, while medication trials may be preferred for patients with an antidepressant responsive phenotype. In this vein, it is worth noting that the large-scale studies of rTMS treatment for depression have specifically enrolled medication-resistant patients, and benefit has been shown for real over sham rTMS54,55. For this suggestion to be directly demonstrated, however, studies directly comparing rTMS to medication or psychotherapy based on patient subtype are needed. Likewise, it is important to note that patients receiving rTMS in dataset 4 also received psychotherapy, and thus it is not possible to know whether the similar outcome between subtypes was solely due to rTMS or its combination with psychotherapy.
Several limitations and potential extensions of the present study are important to note. First, our subtype findings on predicting responsiveness to psychotherapy and antidepressant medication remain to be replicated in additional independent PTSD and MDD samples with the same types of treatment. Second, here the fourth dataset used 26 EEG channels, which is generally considered low for source reconstruction and this may in turn affect subtyping performance56 (though we observed similar classification rates as for the other datasets). Third, despite the fact that orthogonalization removes the zero-lag connectivity, PEC still suffers from ghost connectivity resulting from volume conduction in the vicinity of true connectivity57. Moreover, as a bivariate connectivity metric, PEC is inherently vulnerable to spurious links due to the common effects of a third neural source58. Subtype identification may be further refined (including with respect to the number of subtypes identified) using other EEG connectivity measures that may capture different aspects of brain connectivity (e.g., imaginary coherence59, weighted phase lag index60, Granger causality61, directed transfer function62, and partial directed coherence63). Likewise, the relevance of our findings for other types of psychiatric diagnoses, such as schizophrenia, autism or addiction is unknown. Finally, the present study assumes the connectivity patterns to be static over time, and hence is unable to disentangle their temporal dynamics, which however may be crucial for understanding of functional communication in mental disorders64.
In summary, we identified neurobiological biomarkers of clinically relevant subtypes from rsEEG power envelope connectivity using a sparse clustering-based data-driven approach in order to elucidate critical heterogeneity in psychiatric populations. Our extensive samples and analyses revealed that the discovered power-envelope connectivity biomarkers from the eyes open beta-band delineated two stable and replicable clinically relevant subtypes that crossed traditional diagnostic boundaries. The two subtypes did not differ in terms of baseline clinical severity in any dataset but were associated with both critical differences and similarities in subsequent clinical outcome with a broad range of clinical interventions. Accordingly, our subtype findings provide a promising and generalizable approach for defining treatment-relevant neurobiological heterogeneity in psychiatric populations, and thus advance personalized medicine in psychiatry and its potential translation to clinic-based implementation.
Methods
PTSD study dataset 1.
Participants.
Our discovery study involved 201 participants, including 106 individuals with PTSD, and 95 trauma-exposed healthy participants27 (Supplementary Table 5). All participants were combat veterans serving during the Operation Iraqi Freedom (Iraq), Operation Enduring Freedom (Afghanistan) and Operation New Dawn periods. Participants were recruited and assessed at either Stanford University or New York University after signing an informed consent approved by the relevant University’s institutional review board, in accordance with the ethical principles in the Declaration of Helsinki. Psychiatric diagnoses, were based on DSM-V criteria using the Clinician-Administered PTSD Scale (CAPS)65, and for other diagnoses using the Structured Clinical Interview for DSM-IV (SCID)66. All diagnoses were confirmed in consensus clinician meetings. A history of traumatic brain injury (TBI) was determined based on whether loss of consciousness occurred after a combat-related head trauma. In addition to the CAPS and SCID, participants completed the Beck Depression Inventory (BDI) to assess depressive symptoms, and the World Health Organization Quality of Life Scale (WHOQOL) to assess functioning. General exclusion criteria for both groups included the following: a history of psychotic, bipolar or active substance dependence (within 3 months for patients and lifetime for controls). Trauma-exposed healthy controls were required to have experienced a criterion A trauma, but not meet lifetime criteria for any Axis 1 psychiatric disorder, including PTSD.
Resting-state EEG acquisition.
EEG data of the discovery PTSD dataset were collected using a BrainAmp DC amplifier (Brain Products GmbH, Germany) at sampling rate of 5 kHz with the analog band-pass filtering between 0 and 1 kHz. Following the standard 10–20 system, the Easy EEG cap with 64 Ag-AgCl electrodes were used for the data recordings. The reference electrode was attached to the tip of the nose. During the experiment, participants were seated on a comfortable chair and instructed to remain awake and complete two sessions (3-minute eyes closed and 3-minute eyes open paradigms).
Resting-state EEG preprocessing.
The recorded rsEEG data were cleaned offline with our in-house fully automated artifact rejection pipeline, thereby minimizing the biases in preprocessing possible with manual rejection of artifacts. The steps are briefly described as follows: 1) The EEG data were resampled to 250 Hz; 2) The 60 Hz AC line noise artifact was identified via the Thompson F-statistic and removed by a multi-taper regression technique67. 3) Non-physiological slow drifts in the EEG recordings were removed using a 0.01 Hz high-pass filter; 4) Bad epochs were rejected by thresholding the magnitude of each epoch. Bad channels were rejected based on thresholding the spatial correlations among channels. Subjects with more than 20% bad channels were discarded. The rejected bad channels were then interpolated from the EEG of adjacent channels via the spherical spline interpolation68; 5) Remaining artifacts were removed using ICA69. ICs related to the scalp muscle artifact, ocular artifact, ECG artifact, were automatically rejected using a pattern classifier trained on expert-labeled ICs from another independent EEG data set; 6) EEG data were re-referenced to the common average. The resulting EEG data were then filtered into four canonical frequency ranges: theta (4–7 Hz), alpha (8–12 Hz), beta (13–30 Hz), and low gamma (31–50 Hz).
Resting-state fMRI acquisition.
Resting-state fMRI was collected from each participant for eight minutes. Participants were scanned using either a General Electrical 750 scanner at Stanford University or a Siemens 3T Skyra scanner at New York University. Both sites acquired 32 axial slices with 3.5 mm thickness using an echo-planar gradient-epoch T2-weighted pulse sequence (with 2000 ms repetition time; 29 ms echo time; 90 degrees flip angle; 0 slice spacing; 20 cm field of view; 64×64 matrix size). A high-resolution T1-weighted structural scan was acquired using three-dimensional MPRAGE in the sagittal place with parameters: inversion time = 450 ms, repetition time = 8.21 ms, echo time = 3.22 ms, flip angle = 15 degrees, field of view = 24 cm, 184 slices, matrix size = 256×256, acquired resolution = 0.9375×0.9375×1.0 mm3. The quality of fMRI scans was monitored by MRI center staff weekly with scans of a Functional Biomedical Informatics Research Network (fBIRN) agar phantom, as described in previous literature70.
The following text is reproduced from our prior publications11,71: As this was a two-site study, prior to study initiation, we harmonized image acquisition sequences across the two scanners. This involved both assessing image quality and signal to noise ratio of images acquired using different parameters at each site, as well as acquisition of the same sequences on several traveling non-study control participants. Scanning of traveling non-study controls was repeated at roughly mid-study. Though the same acquisition sequences were used at both sites, differences between scanners are expected. For example, the echo-planar resting-state scans typically had more ventral prefrontal and temporal lobe susceptibility-artifact dropout at the Stanford University site than the New York University site. These differences in acquisition site were accounted for using a site variable in all statistical models. During the progress of the study, assessment of signal quality and stability was done as follows. For each scan, quality was assessed by quantitative and qualitative factors, with results regularly reported to MRI center staff and principle investigators at weekly meetings. Quantitative factors include: scan parameters (check for correctness), slice-based signal to noise ratio, and total root mean square head motion as well as framewise displacement. We also monitored scanner performance by tracking reference voltage, imaging frequency, and bias field correction over time. Reference voltage (aka RF transmit reference voltage) determines the amplitude of the RF pulses. Imaging frequency variations can indicate scanner problems. The scanner’s central frequency is typically set to the resonance frequency of water photons. Measurements of this are proportional to the field strength, and imaging frequency is a common calibration parameter and can be found in every image’s DICOM header. Variations that exceed reference values can indicate magnet drift or RF instability. Qualitative factors were assessed visually by a trained image quality assessor. These included field of view clipping, wrapping, dropout, ringing/ striping, blurring, ghosting, RF problems (noise, spikes, leakage), and inhomogeneity.
fMRI preprocessing.
The fMRI preprocessing was performed using fMRIPrep71. The T1-weighted image was corrected for intensity non-uniformity and then skull-stripped. Brain tissue segmentation of cerebrospinal fluid, white-matter and gray-matter was performed on the brain-extracted T1-weighted image using FSL72. Volume-based spatial normalization was performed through nonlinear registration using brain-extracted versions of both the T1-weighted image and template. For each fMRI scan, the following preprocessing was performed. First, a reference volume and its skull-stripped version were generated using a custom methodology of fMRIPrep. A deformation field to correct for susceptibility distortions was estimated based on fMRIPrep’s fieldmap-less approach. Registration is performed with antsRegistration, and the process regularized by constraining deformation to be nonzero only along the phase-encoding direction, and modulated with an average fieldmap template. Based on the estimated susceptibility distortion, a corrected echo-planar imaging reference was calculated for a more accurate co-registration with the anatomical reference. The blood-oxygenation-level-dependent (BOLD) reference was then co-registered to the T1-weighted image. Co-registration was configured with twelve degrees of freedom to account for distortions remaining in the BOLD reference. Head-motion parameters with respect to the BOLD reference are estimated before any spatiotemporal filtering. BOLD signals were slice-time corrected and resampled onto their original space by applying a single, composite transform to correct for head-motion and susceptibility distortions. The BOLD signals were then spatially normalized into the standard space. Automatic removal of motion artifacts using ICA was performed on the preprocessed BOLD on MNI space time-series after removal of non-steady state volumes and spatial smoothing with an isotropic, Gaussian kernel of 6 mm full-width half-maximum.
PTSD study dataset 2.
Participants and treatment.
The replication PTSD dataset includes 135 participants (supplementary Table 6) recruited based on meeting clinical criteria for PTSD in the context of evaluation for psychotherapy treatment in a Veterans Affairs (VA) clinic located in either norther California or New Mexico. This dataset contains two cohorts: 72 participants used for our initial submission and 63 participants who completed the study after our initial submission (and thus can serve as an additional opportunity for replication analyses). Written informed consent was obtained from each participant under institutional review board-approved protocol at Stanford University. All assessments occurred at Stanford, with participants recruited in New Mexico being flown, after signing a local written informed consent, to Stanford. Exclusion criteria followed those in dataset 1. Clinical severity was assessed using the CAPS interview for both DSM-IV and DSM-5, using self-reported BDI and WHOQOL.
After baseline assessment, participants were enrolled to one of two evidence-based manualized protocols for the treatment of PTSD: 1) Prolonged exposure (PE)73 or 2) Cognitive Processing Therapy (CPT)74. Type of therapy was chosen by the patient and the therapist. Importantly, all patients received psychotherapy in their participating VA PTSD clinic. Treatment outcome was assessed using the CAPS scale for DSM-IV and DSM5.
Resting-state EEG acquisition.
EEG data of the replication PTSD dataset were collected using an Electrical Geodesics (EGI) amplifier at sampling rate of 1 kHz with 256 saline-based electrodes. For both datasets, the electrode impedances were kept below 50 KΩ during the data recordings. During the experiment, participants were seated on a comfortable chair and instructed to remain awake and complete two sessions (10-minute eyes closed and 10-minute eyes open paradigms).
Resting-state EEG preprocessing.
The recorded rsEEG data were cleaned offline with the identical fully automated artifact rejection pipeline as used in PTSD study dataset 1.
Resting-state fMRI acquisition.
Structural and functional MRI data were acquired on a 3T General Electrical scanner. The T1 structural MRI was scanned with parameters: BRAVO sequence acquired sagitally using a 8-channel coil, 2D image reconstruction matrix of 256×256, flip angle = 15 degrees, slice thickness = 1 mm, repetition time = 8.208 ms, echo time = 3.22 ms, field of view = 24 cm. The functional MRI was scanned with parameters: a gradient echo epi simultaneous multi-slice sequence acquired axially using a 32-channel coil, 2D image reconstruction matrix 70×70, slice thickness = 4 mm, flip angle = 45 degrees, repetition time = 700 ms, echo time = 30 ms, field of view = 22 cm. For rsfMRI, participants were instructed to keep their eyes open and fixated on a cross. Each 10-minute run yielded 851 fMRI volumes in each session.
fMRI preprocessing.
The same preprocessing pipeline as used in PTSD study dataset 1 was adopted here for fMRI preprocessing.
Depression study dataset 3.
Trial registration. Establishing Moderators and Biosignatures of Antidepressant Response for Clinical Care for Depression (EMBARC) is registered with ClinicalTrials.gov (identifier: NCT01407094).
Participants and treatment.
Written informed consent was obtained from each participant under institutional review board-approved protocols at each of the four study sites: University of Texas Southwestern Medical Center (TX), Massachusetts General Hospital (MG), Columbia University (CU), and University of Michigan (UM). Data reported here are based on participants in the Establishing Mediators and Biosignatures of Antidepressant Response (EMBARC) study who were randomly assigned to sertraline or placebo during stage 1 of the trial (N=309 total)7,8,75. Key eligibility for the study included the following: being 18–65 years old; having major depression as a primary diagnosis by the Structured Clinical Interview for DSM-IV Axis I Disorders (SCID) 1; at least moderate depression severity with a score ≥14 on the Quick Inventory of Depressive Symptomatology-Self Report (QIDS-SR) at screening and randomization; a major depressive episode beginning before age 30; either a chronic recurrent episode (duration ≥ 2 years) or recurrent MDD (at least 2 lifetime episodes); no antidepressant failure during the current episode. Exclusion criteria included the following: current pregnancy, breastfeeding, no use of contraception; lifetime history of psychosis or bipolar disorder; substance dependence in the past six months or substance abuse in the past two months; unstable psychiatric or general medical conditions requiring hospitalization; study medication contraindication; clinically significant laboratory abnormalities; history of epilepsy or condition requiring an anticonvulsant; electroconvulsive therapy (ECT), vagal nerve stimulation (VNS), TMS or other somatic treatments in the current episode; medications (including but not limited to antipsychotics and mood stabilizers); current psychotherapy; significant suicide risk; or failure to respond to any antidepressant at adequate dose and duration in the current episode.
EMBARC used a double-blind design, wherein participants were randomized to an 8-week course of sertraline or placebo (Supplementary Figure 13). Randomization was stratified by site, depression severity, and chronicity using a block randomization procedure. Sertraline dosing began at 50mg using 50mg capsules and was increased as tolerated if the patient did not respond until a maximum of 200mg75. A similar dosing approach was used for placebo capsules. Participant information is summarized in Supplementary Table 7. The primary outcome was the Hamilton Depression Rating Scale (HAMD17). For participants lacking an endpoint HAMD17, multiple imputation by chained equations was conducted in R76 using the package mice77. The following observed variables were utilized in order to impute endpoint HAMD17 values for missing data via Bayesian regression: baseline HAMD17, week 1 HAMD17, week 2 HAMD17, week 3 HAMD17, week 4 HAMD17, week 6 HAMD17, baseline Quick Inventory of Depressive Symptoms (QIDS) total score, baseline Mood and Symptom Questionnaire subscale scores for Anxious Arousal, Anhedonic Depression, and General Distress, Snaith-Hamilton Pleasure Scale (SHAPS) total score, age, years of education, gender, and Wechsler Abbreviated Scale of Intelligence (WASI) t-scores for Vocabulary and Matrix Reasoning.
Resting-state EEG acquisition.
rsEEG were recorded from each of the four study sites, including Columbia University, University of Texas Southwestern Medical Center, University of Michigan, and Massachusetts General Hospital. At Columbia University, 72-channel EEG were collected using a 24-bit BioSemi system (sampling rate: 256 Hz, bandpass: DC-251.3 Hz), a Lycra stretch electrode cap (Electro-Cap International Inc., Ohio), and an active reference at electrode locations PPO1 and PPO2. At McLean Hospital, 129-channel EEG data were collected using a Geodesic Net system (sampling rate: 250 Hz, bandpass: 0.01–100 Hz), with Cz as reference (Electrical Geodesics Inc., Oregon). At the University of Michigan, 60-channel EEG data were collected using the 32-bit NeuroScan Synamp (Compumedics, TX) system (sampling rate: 250 Hz, bandpass: 0.5–100 Hz), a Lycra stretch electrode cap, and a nose reference. Finally, at the University of Texas Southwestern Medical Center, 62-channel EEG data were recorded (sampling rate: 250 Hz, bandpass: DC-100 Hz) using a 32-bit NeuroScan Synamp system, a Lycra stretch electrode cap, and a nose reference. At all study sites, amplifier calibrations were performed. Experimenters were certified by the Columbia EEG team after demonstrating accurate EEG cap placement and delivery of task instructions via video conference, and then submitting satisfactory EEG data from a pilot subject. rsEEG were recorded during four 2-minute blocks (2 blocks for eyes-closed, and 2 blocks for eyes open) in a counterbalanced order. Participants were instructed to remain still and minimize blinks or eye movements, and to fixate on a centrally presented cross during the eyes-open condition.
Resting-state EEG preprocessing.
The recorded rsEEG data were cleaned offline with the identical fully automated artifact rejection pipeline as used in PTSD study dataset 1. After artifact rejection, 54 EEG channels common to all four study sites were identified and extracted for each subject. Consequently, of the 266 patients with pretreatment EEG recordings, 228 had usable EEG data for analyses. The 38 patients with unusable EEG recordings mainly had too many bad EEG channels and exceedingly large total power across channels.
Resting-state fMRI acquisition.
Structural and functional MRI were collected using 3 Tesla scanners from the four different sites. The rsfMRI data were acquired via T2*-weighted images using single-shot gradient echo-planar imaging sequence during 6-minute, comprising 180 volumes covering 39 axial slices with repetition time = 2000 ms, echo time = 28 ms, flip angle = 90 degrees, matrix size = 64×64, and voxel size = 3.2×3.2×3.1 mm3. Participants were instructed to keep their eyes open during the scanning. T1-weighted structural 3D axial images were acquired in the same session with parameters: Phillips scanner, Series = MPRAGE, repetition time = 8 ms, echo time = 3.7 ms, flip angle = 12 degrees, voxel size = 1×1×1 mm3 for TX site; Siemens scanner, Series = MPRAGE, repetition time = 2.3 ms, echo time = 2.54 ms, flip angle = 9 degrees, voxel size = 1×1×1 mm3 for MG site; General Electrical scanner, Series = IR FSPGR, repetition time = 6 ms, echo time = 2.4 ms, flip angle = 9 degrees, voxel size = 1×1×1 mm3 for CU site; Phillips scanner, Series = TFE, repetition time = 8.1 ms, echo time = 3.7 ms, flip angle = 12 degrees, voxel size = 1×1×1 mm3 for UM site. More details of the acquisition parameters can be found in literature9.
fMRI preprocessing.
The same preprocessing pipeline as used in PTSD study dataset 1 was adopted here for fMRI preprocessing.
Depression study dataset 4.
Participants.
This dataset was based on a naturalistic open-label clinical study, and has been previously reported in detail elsewhere78,79. Briefly, 179 patients were drawn from three outpatient mental health care clinics in the Netherlands (neuroCare Clinic Nijmegen, neuroCare Clinic The Hague, and Psychologenpraktijk Timmers Oosterhout) between May 2007 and November 2016. Inclusion criteria included: 1) a primary diagnosis of non-psychotic MDD or dysthymia, 2) Beck Depression Inventory, second edition, Dutch version (BDI-II-NL)≥14 at baseline, 3) treatment with at least 10 sessions of rTMS over the DLPFC or early exit if response was achieved within 10 sessions. All participants signed an informed consent. Additional exclusion criteria included: previous ECT treatment, epilepsy, traumatic brain injury, current psychotic disorder, wearing a cardiac pacemaker or metal parts in the head, and current pregnancy. The subject information was summarized in Supplementary Table 8.
Resting-state EEG acquisition.
rsEEG data were acquired from 26 channels according to the 10–20 electrode international system (Quickcap; NuAmps). Data were referenced to averaged mastoids with a ground at AFz. The sampling rate of all channels was 500 Hz. A low pass filter with attenuation of 40dB per decade above 100Hz was employed prior to digitization. Subjects were asked to rest quietly with their eyes open and eyes closed for 2 minutes each.
Resting-state EEG preprocessing.
The recorded rsEEG data were cleaned offline with the identical fully automated artifact rejection pipeline as used in PTSD study dataset 1.
Repetitive TMS treatment.
All patients were treated with either a high frequency (10 Hz) protocol over the left DLPFC or a low frequency (1 Hz) protocol over the right DLPFC, or both sequentially. The rTMS data included a long time-span, and the rTMS protocol applied was never based on clinical symptomatology. In the beginning (2006–2012) the standard protocol applied was 10 Hz left DLPFC rTMS, and only in some cases 1 Hz right DLPFC rTMS was applied (when there were concerns for safety e.g. paroxysmal activity, seizure risk) due to 1 Hz rTMS being considered a safer protocol. On first inspection of those data80, it was found that the clinical benefits for 10 Hz and 1 Hz were indistinguishable, after which time period the standard protocol became 1 Hz right DLPFC78. The analyses reported here focus only on patients that received only 10 Hz or 1 Hz rTMS as too few data sets were available on patients who received both treatments or switched treatments mid-way. There were 73 patients in the 10 Hz arm, while in the 1 Hz arm there were 106 patients. Selection of the treatment protocol was not done in a randomized manner, but rather in the context of clinical care, and thus each arm is analyzed separately. rTMS was performed using a Magstim Rapid2 (Magstim Company, Spring Gardens, UK) or a Deymed DuoMag XT-100 stimulator with a figure-of-8 coil, 70 mm diameter. For the 10 Hz protocol, rTMS was administered at 10 Hz over the left DLPFC, 110–120% of the resting motor threshold (MT), 30 trains of 5s duration, inter-train interval (ITI) 30s, 1500 pulses per session. The 1Hz protocol consisted of rTMS at 1 Hz over the right DLPFC, 110–120% MT, 120 trains of 10s duration, ITI 1s, 1200 pulses per session. The DLPFC was localized using either the 5-cm rule or the Beam F3/F4 method81. Furthermore, rTMS treatment was complemented with cognitive behavioral psychotherapy by a trained psychologist82. Psychotherapy was performed concurrent with the rTMS treatment in 45-minute sessions (the rTMS lasting 20 minutes). Sessions took place with a minimum frequency of two to three times per week and a maximum frequency of two per day, as per the patient’s availability.
As these data were drawn from naturalistic clinical care, the total number of sessions depended on clinical decisions, and thus varied across patients. Decisions to continue treatment were based on response to treatment, clinical evaluation of symptom severity, and the patient’s own request. Decisions followed several rules: if a BDI decrease was observed of at least 20% from baseline 10 sessions, the treatment was continued, and re-evaluated every five sessions. If no response occurred by session 20–25, treatment was recommended to be terminated unless the patient requested to extend it. If BDI scores reached 12 or below for five sessions, which indicated remission, the patient was given the option of ending or tapering treatment, with an option to extend into maintenance sessions (one session every 6–8 weeks). However, if the threshold of BDI=12 was reached, but symptom improvement continued, treatment was continued until BDI scores ceased improving.
Clinical measurements.
Clinical outcome was assessed on the BDI (which was the primary outcome measure for the decision rules above) as well as the Depression, Anxiety and Stress Scale (DASS)83. The DASS is a self-report questionnaire and consists of three subscales: depression (DASS-D), anxiety (DASS-A), and stress (DASS-S).
Source-space power envelope connectivity calculation.
In this study, we exploited the source-space power envelope-based functional connectivity (PEC) of EEG source signals as features for the subtyping analysis. PEC measures the correlation between the power envelopes of two band-limited spontaneous brain signals and therefore characterizes the amplitude synchrony between any pair of brain regions. By orthogonalizing the analytical time-series of the two brain signals prior to calculating the power envelopes, PEC removes the zero-phase-lag connectivity, which is the primary source of spurious connectivity due to volume conduction36.
We first implemented source localization using the minimum-norm estimation approach84 to convert the channel-space EEG into the source-space signals of 3003 vertices. Specifically, a three-layer (scalp, skull, and cortical surface) boundary element head model was computed with the OpenMEEG plugin85 based on FreeSurfer average brain template86. A total of 3003 dipoles with unconstrained orientations were generated. The lead-field matrix relating the dipole activities to the EEG was obtained as a result of the boundary element modeling. Given channel-space EEG signals of channels and sampling points and the lead-field matrix , the source signals could be estimated via
| (1) |
where is the inverse operator derived from the minimum-norm estimation. is the source covariance matrix encoding depth weights to compensate for the bias of assigning larger source estimates towards superficial locations, the noise covariance matrix, and the regularization parameter. Following recommendations in the literature87,88, with , where are the three columns of L associated with the -th vertex, , where is the whitened lead-field matrix, and is equal to the inverse of the power signal-to-noise ratio of the whitened EEG data . In our analysis, . For resting-state EEG, we assume the noises in different channels are uncorrelated and with equal variance. Hence, with the common average reference, , where is an identity matrix, and an all-one vector.
Principal component analysis (PCA) was next employed to reduce the 3-dimensional estimated source signal at each vertex to the one-dimensional time series of the principal component. The analytical signal was then extracted at each vertex via the wavelet transform with the complex Morlet wavelet36. Consistent with literature36, a spectral band-width of 0.5 octave ( and kernel size was , with and being the spectral standard deviation and temporal standard deviation, respectively) was used for the wavelet transform. Subsequently, orthogonalization was carried out for the analytical signal of each vertex versus those of all other vertices to discount the spurious correlation resulting from the limited spatial resolution of source estimates, followed by computing their power envelopes36. Specifically, the orthogonalized component of an analytical signal with respect to an analytical signal was defined at sampling point t as
| (2) |
where denotes the conjugate of . The power envelopes were calculated as the square of the orthogonalized analytical signals, followed by a logarithmic transform to enhance normality. PEC was then calculated as the Pearson’s correlation coefficient between the log-power envelopes at each pair of vertices, followed by the Fisher’s r-to-z transformation to enhance normality27,36.
The regional pairwise PEC features were further extracted among 31 cortical regions (MNI space) that were obtained from a parcellation of resting-state fMRI connectivity using independent component analysis applied to an independent set of subjects in a prior study27,89. For each pair of regions, connectivity was calculated by averaging PEC values over all possible vertex pairs. As a result, 465 unique regional pairwise connectivity features were computed in each of the four frequency bands and each of the two resting paradigms (eyes open and closed), followed by z-score normalization, and then used for the subsequent clustering-based subtyping analysis. The overall subtyping framework is illustrated in Supplementary Figure 1.
To verify the quality of the PEC estimates does not degrade when the vertex number decreases from 15003 to 3003, we compared the ROI-level PEC extracted with source localization between using 3003 vertices and 15003 vertices. PEC extracted based on 3003 vertices is highly similar (correlation coefficient r>0.97) to that based on 15003 vertices (Supplementary Figure 14a). In addition, we further compared the ROI-level mean PEC extracted using 3003 vertices versus 15003 vertices for all patients, subtype 1, and subtype 2, respectively. The results again show very high similarity (correlation coefficient r>0.99) between using 3003 vertices and 15003 vertices for all these cases (Supplementary Figure 14b). All these results confirmed that using 3003 vertices for source localization derived PEC that was very comparable to that of using 15003 vertices. Therefore, we used 3003 vertices for our study due to lower computational cost.
Neurophysiological subtype identification.
For each participant, we combined PEC features extracted from all of the eight conditions to form a feature vector with dimensionality of 465×8 = 3720. Such a large number of features typically include redundant information and the true underlying subtypes present in the data may differ only with respect to a portion of PEC features. In order to automatically determine the most distinct PEC features across all the conditions for more accurate identification of neurophysiological subtypes, we exploited a sparse K-means clustering algorithm29 that provides an elegant way to achieve joint feature selection and clustering. Specifically, we define the between-cluster sum of squares for feature as
| (3) |
where denotes the dissimilarity measure between observations and along feature , consists of the indices of the observations in cluster , and nk is the number of observations in cluster k. The sparse K-means clustering is to find the solution to the following optimization problem:
| (4) |
where is the weight vector to be estimated. Optimization problem (4) can be solved via an iterative algorithm29. As a result of the lasso-type sparsity constraint90 , only the most important features have larger weights while zero weights are assigned to the majority of features. Thus, the sparse K-means clustering provides a data-driven approach for determining the potentially important connectivity biomarkers. In our analysis, an inner-loop cross-validation was carried out to determine the appropriate sparsity parameter for feature selection. Based on the estimated sparse feature weights, K-means clustering was then implemented on the weighted feature subset to derive the optimal cluster solution, with the number of clusters determined by the gap statistic that compared the change in within-cluster dispersion with that expected under an appropriate reference null distribution31. The gap statistic chooses the cluster size based on 1-standard-error criterion, finding the smallest value of k such that the gap value is within one standard deviation of the gap at k+1. In addition, variance ratio criterion (i.e., the Calinski-Harabasz criterion91, defined as the ratio of between-cluster variance to within-cluster variance) was also used to assess the choice of the number of clusters.
Clustering evaluation analysis.
The gap statistic indicated that two clusters yielded the best gap value satisfying the 1-standard-error criterion (Supplementary Figure 7a). The Calinski-Harabasz criterion further confirmed that two clusters achieved the maximum variance ratio and hence were the most distinct in the patient group (Supplementary Figure 7b). To validate the stability of the identified subtypes, we repeatedly carried out clustering on multiple subsets of the whole samples. Specifically, we repeated the clustering analysis on 100 randomly selected subsamples (by leaving 10% subjects out) of the dataset. For each subsample, subtype assignment stability was evaluated by testing whether pairs of subjects assigned to the same cluster had the same cluster labels obtained by clustering on the whole dataset. The stability performance was averaged over the 100 runs of clustering. The stability analysis confirmed that the two clusters also achieved the highest stability (Supplementary Figure 7c–d). In addition, we also assessed the stability of cluster solution in dataset 1 across samples of healthy controls and compared it with that of patients. The subtyping stability of healthy controls (80.1%) was significantly lower (Wilcoxon rank sum statistical test: z=2.3, p=0.02) than that of PTSD (91.9%) as well as more variable (coefficient of variation in healthy controls: 16.0, and in patients: 6.2) (Supplementary Figure 9c).
Pattern classification analysis.
To assess the transferability of our discovered subtypes across independent datasets, we implemented classification analysis by training a cluster centroid-based classifier on one dataset (training set) and then applying it to another dataset (test set). Specifically, we performed sparse clustering on the training set to estimate the feature weights and derive the subtype labels. For each subtype, the cluster centroid was calculated from the weighted beta band eyes-open PEC features belonging to the subtype. By applying the feature weights to the test set, we further calculated the Euclidean distance between the weighted test samples and each of the cluster centroids. A test sample was then classified as a subtype whose centroid has the smallest distance to the test sample. The classification accuracy was evaluated by comparing the predicted subtype labels from the classifier with those obtained from clustering analysis of the test set. Similarly, we also adopted the same classification strategy to iteratively train the classifier on three datasets and tested on the fourth. In this case, the estimation of feature weights and identification of subtype labels were implemented on all three datasets in the training set instead of a single one.
Subtype discriminability using resting-state fMRI.
In order to further validate that our identified subtypes indeed represent internally valid and neurobiologically meaningful phenotypes related to brain connectivity, we carried out a classification analysis to distinguish the two EEG-connectivity driven subtypes using resting-state fMRI (rsfMRI) connectivity features. Specifically, regional pairwise fMRI connectivity was calculated using the same parcellation as that for EEG connectivity analysis. We pooled rsfMRI data (205 patients available for subtype 1 and 139 patients available for subtype 2) from scans acquired as part of datasets 1 – 3 for training a linear relevance vector machine (RVM)92,93 classifier. A 10×10-fold cross-validation was implemented to evaluate the classification performance including accuracy, sensitivity in detecting each subtype versus another, and ROC curve. We regressed the effects of imaging site out of the fMRI data using multiple linear regression within the training set at each round of the cross-validation, and the residualized fMRI connectivity features were used for training the model. For each of 10 repetitions, all subjects were randomly divided into 10 folds, such that each subject was left out and used as a test set once while the remaining nine folds were used as training set for RVM model learning. The classification performance was then assessed over the 10 repetitions. The significance of classification accuracy was further evaluated using 1000 random label permutations.
Supplementary Material
Acknowledgements
This study was supported by grants from the Steven and Alexandra Cohen Foundation, Cohen Veterans Bioscience, and NIH grants U01MH092221 and U01MH092250. AE was additionally funded by NIH grant DP1MH116506, and previously supported by the Sierra-Pacific Mental Illness Research, Education and Clinical Center at the Veterans Affairs Palo Alto Healthcare System. WW and YL were additionally supported by the Key R&D Program of Guangdong Province, China under grant 2018B030339001. WW was also funded by National Key Research and Development Plan of China (No. 2017YFB1002505) and National Natural Science Foundation of China (No. 61876063 and No. 61836003).
Footnotes
Reporting summary. Further information on research design is available in the Nature Research Reporting Summary linked to this article.
Data availability
The data supporting the results in this study are available within the paper and its Supplementary Information. The dataset 3 (EMBARC data) is publicly available through the National Institute of Mental Health (NIMH) Data Archive (https://nda.nih.gov/edit_collection.html?id=2199). Access to the other datasets is governed by data use agreements or sponsor restrictions, and thus they are not publicly available.
Code availability
The custom code used in this study is available for research purpose from the corresponding author upon reasonable request.
Competing interests
AE receives equity and salary from Alto Neuroscience, along with equity from Mindstrong Health, Akili Interactive and Sizung. WW and JG receive equity and salary from Alto Neuroscience. CRM receives equity from Receptor Life Sciences and consulting income from Otsuka Pharmaceuticals.
Publisher’s note: Springer Nature remains neutral with regard to jurisdictional claims in published maps and institutional affiliations.
References
- 1.Kessler RC, et al. Lifetime prevalence and age-of-onset distributions of DSM-IV disorders in the National Comorbidity Survey Replication. Arch. Gen. Psychiatry 62, 593–602 (2005). [DOI] [PubMed] [Google Scholar]
- 2.Belmaker R & Agam G Major depressive disorder. N. Engl. J. Med 358, 55–68 (2008). [DOI] [PubMed] [Google Scholar]
- 3.Hawco C, et al. Separable and replicable neural strategies during social brain function in people with and without severe mental illness. Am. J. Psychiatry 176, 521–530 (2019). [DOI] [PubMed] [Google Scholar]
- 4.Etkin A A reckoning and research agenda for neuroimaging in psychiatry. Am. J. Psychiatry 176, 507–511 (2019). [DOI] [PubMed] [Google Scholar]
- 5.Etkin A Addressing the causality gap in human psychiatric neuroscience. JAMA Psychiatry 75, 3–4 (2018). [DOI] [PubMed] [Google Scholar]
- 6.Etkin A & Wager TD Functional neuroimaging of anxiety: a meta-analysis of emotional processing in PTSD, social anxiety disorder, and specific phobia. Am. J. Psychiatry 164, 1476–1488 (2007). [DOI] [PMC free article] [PubMed] [Google Scholar]
- 7.Wu W, et al. An electroencephalographic signature predicts antidepressant response in major depression. Nat. Biotechnol 38, 439–447 (2020). [DOI] [PMC free article] [PubMed] [Google Scholar]
- 8.Fonzo G, et al. Brain regulation of emotional conflict predicts antidepressant treatment response for depression. Nat. Hum. Behav 13, 1319–1331 (2019). [DOI] [PMC free article] [PubMed] [Google Scholar]
- 9.Chin Fatt CR, et al. Effect of intrinsic patterns of functional brain connectivity in moderating antidepressant treatment response in major depression. Am. J. Psychiatry 177, 143–154 (2019). [DOI] [PubMed] [Google Scholar]
- 10.Berg AO Treatment of Posttraumatic Stress Disorder: An Assessment of The Evidence (Washington, DC: The National Academies Press, 2008). [Google Scholar]
- 11.Etkin A, et al. Using fMRI connectivity to define a treatment-resistant form of post-traumatic stress disorder. Sci. Transl. Med 11, eaal3236 (2019). [DOI] [PMC free article] [PubMed] [Google Scholar]
- 12.Wolfers T, et al. Mapping the heterogeneous phenotype of schizophrenia and bipolar disorder using normative models. JAMA Psychiatry 75, 1146–1155 (2018). [DOI] [PMC free article] [PubMed] [Google Scholar]
- 13.Marquand AF, et al. Beyond lumping and splitting: a review of computational approaches for stratifying psychiatric disorders. Biol. Psychiatry Cogn. Neurosci. Neuroimaging 1, 433–447 (2016). [DOI] [PMC free article] [PubMed] [Google Scholar]
- 14.Poulakis K, et al. Heterogeneous patterns of brain atrophy in Alzheimer’s disease. Neurobiol. Aging 65, 98–108 (2018). [DOI] [PubMed] [Google Scholar]
- 15.Orban P, et al. Subtypes of functional brain connectivity as early markers of neurodegeneration in Alzheimer’s disease. BioRxiv, 195164 (2017). [Google Scholar]
- 16.Wu M-J, et al. Identification and individualized prediction of clinical phenotypes in bipolar disorders using neurocognitive data, neuroimaging scans and machine learning. NeuroImage 145, 254–264 (2017). [DOI] [PMC free article] [PubMed] [Google Scholar]
- 17.Karalunas SL, et al. Subtyping attention-deficit/hyperactivity disorder using temperament dimensions: toward biologically based nosologic criteria. JAMA Psychiatry 71, 1015–1024 (2014). [DOI] [PMC free article] [PubMed] [Google Scholar] [Retracted]
- 18.Fonzo GA, et al. PTSD psychotherapy outcome predicted by brain activation during emotional reactivity and regulation. Am. J. Psychiatry 174, 1163–1174 (2017). [DOI] [PMC free article] [PubMed] [Google Scholar]
- 19.Maron-Katz A, et al. Individual patterns of abnormality in resting-state functional connectivity reveal two data-driven PTSD subgroups. Am. J. Psychiatry 177, 244–253 (2020). [DOI] [PubMed] [Google Scholar]
- 20.Palva S & Palva JM Discovering oscillatory interaction networks with M/EEG: challenges and breakthroughs. Trends Cogn. Sci 16, 219–230 (2012). [DOI] [PubMed] [Google Scholar]
- 21.Schoffelen JM & Gross J Source connectivity analysis with MEG and EEG. Hum. Brain Mapp 30, 1857–1865 (2009). [DOI] [PMC free article] [PubMed] [Google Scholar]
- 22.He B, et al. Electrophysiological brain connectivity: theory and implementation. IEEE Trans. Biomed. Eng 66, 2115–2137 (2019). [DOI] [PMC free article] [PubMed] [Google Scholar]
- 23.Brunner C, et al. Volume conduction influences scalp-based connectivity estimates. Front. Comput. Neurosci 10, 121 (2016). [DOI] [PMC free article] [PubMed] [Google Scholar]
- 24.O’Neill GC, et al. Measuring electrophysiological connectivity by power envelope correlation: a technical review on MEG methods. Phys. Med. Biol 60, R271 (2015). [DOI] [PubMed] [Google Scholar]
- 25.Brookes MJ, Woolrich MW & Barnes GR Measuring functional connectivity in MEG: a multivariate approach insensitive to linear source leakage. NeuroImage 63, 910–920 (2012). [DOI] [PMC free article] [PubMed] [Google Scholar]
- 26.Siems M, Pape A-A, Hipp JF & Siegel M Measuring the cortical correlation structure of spontaneous oscillatory activity with EEG and MEG. NeuroImage 129, 345–355 (2016). [DOI] [PubMed] [Google Scholar]
- 27.Toll R, et al. An electroencephalography connectomic profile of post-traumatic stress disorder. Am. J. Psychiatry 177, 233–243 (2020). [DOI] [PubMed] [Google Scholar]
- 28.Colclough GL, et al. How reliable are MEG resting-state connectivity metrics? NeuroImage 138, 284–293 (2016). [DOI] [PMC free article] [PubMed] [Google Scholar]
- 29.Witten DM & Tibshirani R A framework for feature selection in clustering. J. Am. Stat. Assoc 105, 713–726 (2010). [DOI] [PMC free article] [PubMed] [Google Scholar]
- 30.Kass RE & Raftery A Bayes factors. J. Am. Stat. Assoc 90, 773–795 (1995). [Google Scholar]
- 31.Tibshirani R, Walther G & Hastie T Estimating the number of clusters in a data set via the gap statistic. J. R. Stat. Soc.: Series B (Statistical Methodology) 63, 411–423 (2001). [Google Scholar]
- 32.Price RB, et al. Parsing heterogeneity in the brain connectivity of depressed and healthy adults during positive mood. Biol. Psychiatry 81, 347–357 (2017). [DOI] [PMC free article] [PubMed] [Google Scholar]
- 33.Lanius R, Bluhm R, Lanius U & Pain C A review of neuroimaging studies in PTSD: heterogeneity of response to symptom provocation. J. Psychiatry Res 40, 709–729 (2006). [DOI] [PubMed] [Google Scholar]
- 34.Williams LM, et al. Childhood trauma predicts antidepressant response in adults with major depression: data from the randomized international study to predict optimized treatment for depression. Transl. Psychiatry 6, e799 (2016). [DOI] [PMC free article] [PubMed] [Google Scholar]
- 35.Liston C, et al. Default mode network mechanisms of transcranial magnetic stimulation in depression. Biol. Psychiatry 76, 517–526 (2014). [DOI] [PMC free article] [PubMed] [Google Scholar]
- 36.Hipp JF, et al. Large-scale cortical correlation structure of spontaneous oscillatory activity. Nat. Neurosci 15, 884–890 (2012). [DOI] [PMC free article] [PubMed] [Google Scholar]
- 37.Brookes MJ, et al. Investigating the electrophysiological basis of resting state networks using magnetoencephalography. Proc. Natl. Acad. Sci. USA 108, 16783–16788 (2011). [DOI] [PMC free article] [PubMed] [Google Scholar]
- 38.Mantini D, et al. Electrophysiological signatures of resting state networks in the human brain. Proc. Natl. Acad. Sci. USA 104, 13170–13175 (2007). [DOI] [PMC free article] [PubMed] [Google Scholar]
- 39.Cabral J, et al. Exploring mechanisms of spontaneous functional connectivity in MEG: how delayed network interactions lead to structured amplitude envelopes of band-pass filtered oscillations. NeuroImage 90, 423–435 (2014). [DOI] [PubMed] [Google Scholar]
- 40.Deco G, et al. Single or multiple frequency generators in on-going brain activity: A mechanistic whole-brain model of empirical MEG data. NeuroImage 152, 538–550 (2017). [DOI] [PMC free article] [PubMed] [Google Scholar]
- 41.Drysdale AT, et al. Resting-state connectivity biomarkers define neurophysiological subtypes of depression. Nat. Med 23, 28–38 (2017). [DOI] [PMC free article] [PubMed] [Google Scholar]
- 42.Dichter GS, Gibbs D & Smoski MJ A systematic review of relations between resting-state functional-MRI and treatment response in major depressive disorder. J. Affect. Disord 172, 8–17 (2015). [DOI] [PMC free article] [PubMed] [Google Scholar]
- 43.Klumpp H, et al. Resting state amygdala-prefrontal connectivity predicts symptom change after cognitive behavioral therapy in generalized social anxiety disorder. Biol. Mood Anxiety Disord 4, 14 (2014). [DOI] [PMC free article] [PubMed] [Google Scholar]
- 44.Kumari V, et al. Dorsolateral prefrontal cortex activity predicts responsiveness to cognitive–behavioral therapy in schizophrenia. Biol. Psychiatry 66, 594–602 (2009). [DOI] [PMC free article] [PubMed] [Google Scholar]
- 45.Reggente N, et al. Multivariate resting-state functional connectivity predicts response to cognitive behavioral therapy in obsessive–compulsive disorder. Proc. Natl. Acad. Sci. USA 115, 2222–2227 (2018). [DOI] [PMC free article] [PubMed] [Google Scholar]
- 46.Qin J, et al. Predicting clinical responses in major depression using intrinsic functional connectivity. NeuroReport 26, 675–680 (2015). [DOI] [PubMed] [Google Scholar]
- 47.Goldstein-Piekarski AN, et al. Intrinsic functional connectivity predicts remission on antidepressants: a randomized controlled trial to identify clinically applicable imaging biomarkers. Transl. Psychiatry 8, 57 (2018). [DOI] [PMC free article] [PubMed] [Google Scholar]
- 48.Spies M, et al. Default mode network deactivation during emotion processing predicts early antidepressant response. Transl. Psychiatry 7, e1008 (2017). [DOI] [PMC free article] [PubMed] [Google Scholar]
- 49.Wang Q, et al. Identification of major depressive disorder and prediction of treatment response using functional connectivity between the prefrontal cortices and subgenual anterior cingulate: A real-world study. J. Affect. Disord 252, 365–372 (2019). [DOI] [PubMed] [Google Scholar]
- 50.Olbrich S, et al. Functional connectivity in major depression: increased phase synchronization between frontal cortical EEG-source estimates. Psychiatry Res. Neuroimaging 222, 91–99 (2014). [DOI] [PubMed] [Google Scholar]
- 51.George MS, et al. Daily repetitive transcranial magnetic stimulation (rTMS) improves mood in depression. Neuroreport: An International Journal for the Rapid Communication of Research in Neuroscience 6, 1853–1856 (1995). [DOI] [PubMed] [Google Scholar]
- 52.Voigt J, Carpenter L & Leuchter A Cost effectiveness analysis comparing repetitive transcranial magnetic stimulation to antidepressant medications after a first treatment failure for major depressive disorder in newly diagnosed patients–A lifetime analysis. PLoS One 12, e0186950 (2017). [DOI] [PMC free article] [PubMed] [Google Scholar]
- 53.Nguyen K-H & Gordon LG Cost-effectiveness of repetitive transcranial magnetic stimulation versus antidepressant therapy for treatment-resistant depression. Value Health 18, 597–604 (2015). [DOI] [PubMed] [Google Scholar]
- 54.O’Reardon JP, et al. Efficacy and safety of transcranial magnetic stimulation in the acute treatment of major depression: a multisite randomized controlled trial. Biol. Psychiatry 62, 1208–1216 (2007). [DOI] [PubMed] [Google Scholar]
- 55.George MS, et al. Daily left prefrontal transcranial magnetic stimulation therapy for major depressive disorder: a sham-controlled randomized trial. Arch. Gen. Psychiatry 67, 507–516 (2010). [DOI] [PubMed] [Google Scholar]
- 56.Srinivasan R, Tucker DM & Murias M Estimating the spatial Nyquist of the human EEG. Behav. Res. Meth. Instrum. Comput 30, 8–19 (1998). [Google Scholar]
- 57.Palva JM, et al. Ghost interactions in MEG/EEG source space: A note of caution on inter-areal coupling measures. NeuroImage 173, 632–643 (2018). [DOI] [PubMed] [Google Scholar]
- 58.Olejarczyk E, Marzetti L, Pizzella V & Zappasodi F Comparison of connectivity analyses for resting state EEG data. J. Neural Eng 14, 036017 (2017). [DOI] [PubMed] [Google Scholar]
- 59.Nolte G, et al. Identifying true brain interaction from EEG data using the imaginary part of coherency. Clin. Neurophysiol 115, 2292–2307 (2004). [DOI] [PubMed] [Google Scholar]
- 60.Vinck M, et al. An improved index of phase-synchronization for electrophysiological data in the presence of volume-conduction, noise and sample-size bias. NeuroImage 55, 1548–1565 (2011). [DOI] [PubMed] [Google Scholar]
- 61.Geweke JF Measures of conditional linear dependence and feedback between time series. J. Am. Stat. Assoc 79, 907–915 (1984). [Google Scholar]
- 62.Astolfi L, et al. Estimation of the effective and functional human cortical connectivity with structural equation modeling and directed transfer function applied to high-resolution EEG. Magn. Reson. Imaging 22, 1457–1470 (2004). [DOI] [PubMed] [Google Scholar]
- 63.Astolfi L, et al. Comparison of different cortical connectivity estimators for high-resolution EEG recordings. Hum. Brain Mapp 28, 143–157 (2007). [DOI] [PMC free article] [PubMed] [Google Scholar]
- 64.O’Neill GC, et al. Dynamics of large-scale electrophysiological networks: A technical review. NeuroImage 180, 559–576 (2018). [DOI] [PubMed] [Google Scholar]
- 65.Weathers FW, et al. The Clinician-Administered PTSD Scale for DSM–5 (CAPS-5): Development and initial psychometric evaluation in military veterans. Psychol. Assess 30, 383–395 (2018). [DOI] [PMC free article] [PubMed] [Google Scholar]
- 66.First MB Structured clinical interview for the DSM (SCID). The Encyclopedia of Clinical Psychology, 1–6 (2014).
- 67.Mullen T NITRC: CleanLine: Tool/Resource Info (2012).
- 68.Perrin F, Pernier J, Bertrand O & Echallier J Spherical splines for scalp potential and current density mapping. Electroencephalography and Clinical Neurophysiology 72, 184–187 (1989). [DOI] [PubMed] [Google Scholar]
- 69.Bell AJ & Sejnowski TJ An information-maximization approach to blind separation and blind deconvolution. Neural Comput 7, 1129–1159 (1995). [DOI] [PubMed] [Google Scholar]
- 70.Glover GH, et al. Function biomedical informatics research network recommendations for prospective multicenter functional MRI studies. J. Magn. Reson. Imaging 36, 39–54 (2012). [DOI] [PMC free article] [PubMed] [Google Scholar]
- 71.Esteban O, et al. fMRIPrep: a robust preprocessing pipeline for functional MRI. Nat. Methods 16, 111–116 (2019). [DOI] [PMC free article] [PubMed] [Google Scholar]
- 72.Jenkinson M, et al. Fsl. NeuroImage 62, 782–790 (2012). [DOI] [PubMed] [Google Scholar]
- 73.Foa EB, et al. A comparison of exposure therapy, stress inoculation training, and their combination for reducing posttraumatic stress disorder in female assault victims. J. Consult. Clin. Psychol 67, 194–200 (1999). [DOI] [PubMed] [Google Scholar]
- 74.Resick PA Cognitive therapy for posttraumatic stress disorder. J. Cogn. Psychother 15, 321–329 (2001). [Google Scholar]
- 75.Trivedi MH, et al. Establishing moderators and biosignatures of antidepressant response in clinical care (EMBARC): rationale and design. J. Psychiatry Res 78, 11–23 (2016). [DOI] [PMC free article] [PubMed] [Google Scholar]
- 76.Team RCR: A language and environment for statistical computing (2013).
- 77.Buuren S.v. & Groothuis-Oudshoorn K mice: Multivariate imputation by chained equations in R. J. Stat. Softw 1–68 (2010).
- 78.Donse L, et al. Simultaneous rTMS and psychotherapy in major depressive disorder: Clinical outcomes and predictors from a large naturalistic study. Brain Stimul 11, 337–345 (2018). [DOI] [PubMed] [Google Scholar]
- 79.Krepel N, et al. Non-replication of neurophysiological predictors of non-response to rTMS in depression and neurophysiological data-sharing proposal. Brain Stimulation: Basic, Translational, and Clinical Research in Neuromodulation 11, 639–641 (2018). [DOI] [PubMed] [Google Scholar]
- 80.Arns M, Drinkenburg WH, Fitzgerald PB & Kenemans JL Neurophysiological predictors of non-response to rTMS in depression. Brain Stimul 5, 569–576 (2012). [DOI] [PubMed] [Google Scholar]
- 81.Mir-Moghtadaei A, et al. Concordance between BeamF3 and MRI-neuronavigated target sites for repetitive transcranial magnetic stimulation of the left dorsolateral prefrontal cortex. Brain Stimul 8, 965–973 (2015). [DOI] [PMC free article] [PubMed] [Google Scholar]
- 82.Beck AT The current state of cognitive therapy: a 40-year retrospective. Arch. Gen. Psychiatry 62, 953–959 (2005). [DOI] [PubMed] [Google Scholar]
- 83.Lovibond PF & Lovibond SH The structure of negative emotional states: Comparison of the Depression Anxiety Stress Scales (DASS) with the Beck Depression and Anxiety Inventories. Behav. Res. Ther 33, 335–343 (1995). [DOI] [PubMed] [Google Scholar]
- 84.Hauk O Keep it simple: a case for using classical minimum norm estimation in the analysis of EEG and MEG data. NeuroImage 21, 1612–1621 (2004). [DOI] [PubMed] [Google Scholar]
- 85.Gramfort A, Papadopoulo T, Olivi E & Clerc M OpenMEEG: opensource software for quasistatic bioelectromagnetics. Biomed. Eng. Online 9, 45 (2010). [DOI] [PMC free article] [PubMed] [Google Scholar]
- 86.Fischl B FreeSurfer. NeuroImage 62, 774–781 (2012). [DOI] [PMC free article] [PubMed] [Google Scholar]
- 87.Hämäläinen M MNE software user’s guide. NMR Center, Mass General Hospital, Harvard University 58, 59–75 (2005) [Google Scholar]
- 88.Lin F-H, et al. Assessing and improving the spatial accuracy in MEG source localization by depth-weighted minimum-norm estimates. NeuroImage 31, 160–171 (2006). [DOI] [PubMed] [Google Scholar]
- 89.Chen AC, et al. Causal interactions between fronto-parietal central executive and default-mode networks in humans. Proc. Natl. Acad. Sci. USA 110, 19944–19949 (2013). [DOI] [PMC free article] [PubMed] [Google Scholar]
- 90.Tibshirani R, Wainwright M & Hastie T Statistical Learning with Sparsity: The Lasso and Generalizations, (Chapman and Hall/CRC, 2015). [Google Scholar]
- 91.Caliński T & Harabasz J A dendrite method for cluster analysis. Commun. Stat. Theory Methods 3, 1–27 (1974). [Google Scholar]
- 92.Tipping ME Sparse Bayesian learning and the relevance vector machine. J. Mach. Learn. Res 1, 211–244 (2001). [Google Scholar]
- 93.Zhu H, et al. Multivariate classification of earthquake survivors with post-traumatic stress disorder based on large-scale brain networks. Acta Psychiatr. Scand 141, 285–298 (2020). [DOI] [PubMed] [Google Scholar]
Associated Data
This section collects any data citations, data availability statements, or supplementary materials included in this article.