

Abstract
Eggs with the same total weight may have considerable differences in yolk weight. Eggs with a high percentage of yolk have a higher nutritional value, more flavor, and are more desirable to consumers. However, a large yolk proportion means more dry matter in the eggs, which reduces the feed efficiency. The elucidation of the genetic factors of yolk quantity in eggs is of scientific and practical significance. Through RNA sequencing, we explored the transcriptome of ovarian tissue from 12 Wenchang chickens, including 6 chickens that laid eggs with a high yolk percentage (32%) and 6 that laid low yolk percentage eggs (25%). We identified a total of 362 differentially expressed genes (P-value < 0.01, log2 fold change < −1, log2 fold change > 1), of which 220 were upregulated and 142 were downregulated in high yolk percentage hens. According to the Gene Ontology terms annotation and Kyoto Encyclopedia of Genes and Genomes enrichment analysis, the differentially expressed genes were associated with the regulation of various cell functions, cell differentiation and development, neuroactive ligand–receptor interactions, and calcium and ubiquitin-mediated proteolysis signaling pathways. To further filter for genes that were directly involved in yolk accumulation, the chicken quantitative trait loci database, genes within 100 kb upstream and downstream of the yolk weight trait SNP, and intersection genes in protein–protein interaction network diagrams were used to detect genes that overlapped with the differentially expressed genes. We found 7 candidate genes in total, MNR2, AOX1, ANTXRL, GRAMD1C, EEF2, COMP, and JUND, which affect female reproductive performance and the growth and development of follicles, supporting cell transport, cell proliferation, and differentiation. All candidate genes and several randomly selected genes were verified by quantitative real time PCR, and the results were consistent with the RNA sequencing. In conclusion, investigating the molecular mechanisms of high yolk percentage traits will allow breeding strategies to be optimized to alter the percentage of yolk in chicken eggs.
Key words: RNA-Seq, ovary, percentage of yolk, QTL
Introduction
Egg products are important for human diets worldwide because eggs are rich in proteins, vitamins, minerals, and fats (Munger et al., 2018). An egg is primarily made up of the eggshell, egg white, and egg yolk. Compared with the other ingredients, the yolk contains the highest content of dry matter, and has the longest formation time, of around 10 d (Marza, 1935). The yolk is comprised of 15.7 to 16.6% proteins, 32 to 35% lipids, 0.2 to 1% carbohydrates, 1.1% ash, and roughly 50% water, whereas nearly 86% of the egg white is water (Kovacs-Nolan et al., 2005). Yolk formation is regulated by a variety of factors, such as diet, light, and neuroendocrine hormones. After yolk lipid precursors are synthesized in the liver, they are released into the blood. They then enter the ovary, bind to receptors on the surface of the oocyte, and enter the follicle through endocytosis. Therefore, follicle development has a significant effect on yolk weight (YW) (Arukwe and Goksoyr, 2003).
The yolk is the main source of the egg flavor, the size of the yolk directly affects the flavor (Liu et al., 2017), and the absolute nutritional value of the yolk is relatively high. Eggs with large yolks are more popular among most consumers (Fernandez and Andersen, 2015), although some may prefer smaller yolks because of the high cholesterol content in the yolk. A large percentage of yolk (PY) normally means more dry matter in eggs, which reduces the feeding efficiency. The correlation coefficient between PY and the feed conversion ratio is −0.25 (Hartmann et al., 2003); thus hens with a higher PY need more feed, which cuts into the profits of producers. To both satisfy the needs of consumers and protect the interests of producers, it is necessary to find a balance point. Using a genetic strategy to alter the yolk percentage is a key approach that will assist in this endeavor. Hence, it is important to investigate the genetic mechanisms underlying yolk size.
In recent years, there have also been many studies on follicular development. The initial growth and development of avian ovarian follicles at puberty and with each subsequent reproductive season in wild birds occur in an orderly and progressive fashion, with all stages of follicle development eventually present at the onset of egg production. Specifically, the initiation of egg laying is preceded by the activation of primordial follicles (initial recruitment) from within the ovarian cortex followed by the organization of primary follicles. This transition occurs via the development of a single inner layer of granulosa cells plus the incorporation of a multicellular theca layer. The white follicles (1–5 mm), which are small and slow growing, ingest a comparatively more lipid containing yolk (Shen et al., 1993); the prehierarchical follicles (6–8 mm) are then formed. In addition, a single follicle among the small cohort of 6 to 8 mm follicles is selected daily to enter a rapid growth phase and undergo final maturation before ovulation in hens that lay regularly (Liu and Zhang, 2008; Guo et al., 2019). There were approximately 6 follicles larger than 8 mm, and the weight range was approximately 150 to 230 mg (Johnson, 2015).
In poultry breeding programs, the genes involved in yolk size regulation have not been investigated in detail, and the PY has not been examined independent of the egg weight (EW) and YW. Focusing on the YW alone causes the EW to increase, indirectly affecting the PY. Many methods of studying animal production and health have been developed and transcriptomic analyses have become important components of systems genomic or systems biology methods. These methods can provide a snapshot of all the gene expression profiles in a tissue and an insight into the gene functions pertaining to a particular trait (Salleh et al., 2017).
Thus, in our study, Wenchang chickens, a local Chinese breed, with different PY were selected for analysis after controlling for the EW and percentage of eggshell (PS). Using RNA sequencing (RNA-Seq) technology, we sequenced the ovaries of high and low yolk percentage hens to detect differentially expressed genes (DEGs), and annotated the functions of these genes. We then identified important candidate genes that might participate in the process of yolk formation through functional analysis of the DEGs and the relationships between the DEGs, YW, and ovarian weight quantitative trait loci (QTL).
Materials and methods
Animal Husbandry, Egg Quality Determination, and Ovary Collection
In this study, we used Wenchang chickens with complete pedigrees, which were provided by the farm at Yangzhou Poultry Research Institute, Jiangsu, China. At 26 wk, according to appearance, growth, and egg production, 20 families were selected, with a total count of 390 chickens. Early sexual maturation is the main characteristic in comparison with other commercial hens. Therefore, all the chickens continued to lay eggs from 22 to 43 wk, and there was no significant difference in egg production among different families by one-way ANOVA (P-value> 0.05). The entire chicken population was kept under a light/dark cycle of 16 h light and 8 h darkness (16L:8D), and had free access to feed and water.
Eggs were collected over 3 to 4 successive days at 27, 33, and 43 wk of age, and the bodies of all the chickens were weighed (BW). After egg collection at 10:00 am, measurements of egg length and width were carried out with an egg-shape index tester (FHK, Tokyo, Japan). The egg shape index was slightly modified from these measurements according to previous research, using the formula: egg shape index = egg length/egg width (Anderson et al., 2004; Nikolova and Kocevski, 2006). Eggshell strength was detected by an eggshell strength tester (Robomation, Tokyo, Japan). The EW, YW, eggshell weight (ESW), albumen height, yolk color, and Haugh unit were obtained using an EMT-5200 multifunction egg tester (Robotmation, Tokyo, Japan). The Haugh unit was calculated as 100 log (h + 7.57 − 1.7 W 0.37), where h = thick albumen height (mm) and W = egg weight (g) (Eisen et al., 1962; Doyon et al., 1986). Furthermore, the ESW was determined with an electronic balance (YP601 N, Qinghai Co., Ltd., Shanghai, China) after drying and removing the membrane of the eggshell. We obtained the eggshell thickness in 3 zones (at both ends and the equator), taking the average of 3 measurements. Finally, the PY and PS were determined by using the formulas PY = YW/EW and PS = ESW/EW (Kaliasheva et al., 2017). All the measurements were taken on the same day. The changes in EW, YW, and PY for each chicken were analyzed at each age point.
At 43 wk of age, chickens selected for RNA-Seq were assigned to either a low (L) or high (H) PY group with 6 chickens in each group. The chickens selected displayed no significant differences in EW at every age point studied (27, 33, and 43 wk of age). Moreover, all 12 chickens continued to lay eggs from 27 to 43 wk and showed no significant differences in egg production. Euthanasia was performed by cervical dislocation, with all efforts made to minimize suffering. The 12 chickens came from 2 statistical tails (18%) when individuals were ranked by PY (Figure 1), and they were in 2 tails at every time point. The chickens were dissected within half an hour of death, and the ovaries and liver were removed and weighed (ovary weight, liver weight). The larger follicles (>10 mm) on the ovaries were removed (number of follicles [NOF] removed), the ovaries were weighed again (remaining ovary weight), and the NOF (2–10 mm) that remained on the ovaries were counted carefully. To ensure consistency of the samples, ovarian tissue adjacent to the white follicle (2 mm) was taken for sequencing. For RNA isolation, all operations were carried out on ice, and all tissue was quickly removed from each chicken and placed on dry ice, and then stored at −80°C.
Figure 1.

The histogram of PY. The ordinate value means PY, and the abscissa indicates H and L groups and population. The red, orange, and green columns refer to the group H, population, and group L, respectively. Abbreviations: H, high; L, low; PY, percentage of yolk.
Total RNA Extraction, cDNA Library Preparation, and Sequencing
Each ovarian tissue sample was placed in a mortar, frozen in liquid nitrogen, and finely ground. Total RNA was extracted from 70 to 100 mg of each sample using TRIzol reagent (Tiangen Biotech Co., Ltd., Beijing, China). The quality of the total RNA was checked using an Agilent 2100 Bioanalyzer System (Agilent Technologies, Santa Clara, CA) and by 1% agarose gel electrophoresis (180 V, 16 min).
After the RNA samples were quantified, eukaryotic mRNA was enriched using magnetic beads conjugated to oligos. Then fragmentation buffer was added, breaking the mRNA into short pieces. This mRNA was used as the template for cDNA synthesis with random hexamer primers. Buffer, deoxyribonucleotide triphosphates, DNA polymerase I, and RNase H were added, and cDNA was synthesized. cDNA was then purified using AMPure XP beads (Beckman Coulter, Brea, CA). Purified double-stranded cDNA was first used to repair ends, then A-tails were added and joined to the sequencing adaptors. Finally, PCR amplification and AMPure XP beads were used to purify the PCR products. After library construction was complete, Qubit 2.0 (Thermo Fisher Scientific, Waktham, USA) was used for preliminary quantification and to determine library dilution. An Agilent 2100 Bioanalyzer was used to detect the size of the inserted fragments in the libraries. After inserts were found to meet the expected size, the effective concentration of each library was quantified using quantitative PCR to ensure the quality of the library. The cDNA libraries underwent paired-end sequencing using the Illumina HiSeq X Ten platform (Illumina Inc., San Diego, CA). Twelve cDNA libraries were sequenced from the ovaries of the L and H PY groups. The RNA-Seq reads have been submitted to the National Center for Biotechnology Information Short Read Archive database (bioproject: PRJNA613236). Data from the remaining 12 chickens were then analyzed.
Differential Expression Analysis
Raw reads were cleaned by removing adaptor sequences, and low-quality reads were discarded. Processed reads were then mapped to the chicken reference genome (Gallus gallus 5, http://ftp.ensembl.org/pub//release-94/fasta/gallus_gallus/dna/) using HISAT2 software (D. Kim, Center for Computational Biology, McKusick-Nathans Institute of Genetic Medicine, Johns Hopkins University School of Medicine, Baltimore, Maryland, USA). This process has a higher alignment efficiency than TopHat (C. Trapnell, Center for Bioinformatics and Computational Biology, University of Maryland, Baltimore, USA) and can be roughly divided into 3 steps, establishing a genome index, alignment to genome, and sorting (Kim et al., 2015). This process also uses StringTie (M. Pertea, Center for Computational Biology, Johns Hopkins University, Baltimore, Maryland, USA), which is faster and more accurate than Cufflinks (C. Trapnell, Broad Institute of MIT and Harvard, Cambridge, Massachusetts, USA) (Pertea et al., 2015), and results in more complete transcripts. DEGs (P-value < 0.01) were identified using the DESeq2 software package (M.I. Love, Genome Biology Unit, European Molecular Biology Laboratory, Meyerhofstrasse 1, 69117 Heidelberg, Germany) and the Benjamini-Hochberg P-value correction algorithm to identify all DEGs that showed a statistically significant difference (Hochberg and Benjamini, 1990). DESeq2 uses the average expression strength of each gene across all samples as its filter criterion, and it omits all genes with mean normalized counts below a filtering threshold from multiple testing adjustments (Anders and Huber, 2010; Love et al., 2014).
Bioinformatic Analysis of DEGs and Identification of Candidate Genes
Differential expression tables were imported into the Gene Ontology (GO) and Kyoto Encyclopedia of Genes and Genomes (KEGG) databases for enrichment analysis. GO terms and KEGG pathways showing P-values less than 0.05 were considered to be significantly enriched among the DEGs by the clusterProfiler package in R (clusterProfiler, G. Yu, Southern Medical University, China) (Benjamini and Hochberg, 1995; Yu et al., 2012). DEGs were then mapped to the chicken QTL database. By comparative analysis and imperative validation, the DEGs which were entirely located in the QTL regions (YW and ovary weight QTL) were detected according to the start and end location information of the QTL (https://www.animalgenome.org/cgi-bin/QTLdb/GG/summary). Finally, genes corresponding to the YW and ovary weight QTL were selected, and then the corresponding pathways were examined to select candidate genes for further analysis. Genes 100 kb upstream and downstream of the reported yolk heavy SNP sites were also identified. The STRING database (http://string-db.org/) was utilized to get data for other proteins and protein–protein interactions (PPI) analysis with the DEGs for which P-adjust was < 0.05 (Wright, 1992; Szklarczyk et al., 2019).
Confirmation of RNA-Seq Results via Quantitative Real Time (qRT)-PCR
We randomly selected 17 DEGs and 7 candidate genes for reverse transcription (RT)-PCR to verify the accuracy of our RNA-Seq data. Total RNA was reverse transcribed into cDNA using the PrimeScript RT reagent kit with gDNA Eraser (Tiangen Co., Ltd., Beijing, China), according to the manufacturer's instructions, and all the cDNA concentrations were diluted to 200 ng/μL. Primers (Supplementary Table 2) were designed using primer 5 software (PREMIER Biosoft lab, USA), based on relevant gene sequences retrieved from the National Center for Biotechnology Information. qRT-PCR was performed in a final reaction volume of 20 μL using the SYBR Green PCR Master Mix Kit (Roche, Penzberg, Germany) in a LightCycler 480 Real-Time PCR Detection System. The reaction mixture contained 2 μL of cDNA, 2 μL of primers (0.2 μmol), 10 μL of SYBR Premix Ex Taq, and ddH2O up to a total volume of 20 μL. The following protocol was used: 95°C for 10 min; 45 cycles of 95°C for 10 s, 60°C for 10 s, and 72°C for 10 s. Three biological replicates were performed for each sample, and β-actin was used as the reference gene. Relative gene expression was calculated using the 2−ΔΔCt method (Livak and Schmittgen, 2001). A trend analysis was performed on the log2 fold change values from the RNA-Seq and the qRT-PCR to determine consistency.
Results
Phenotypic Data
All the phenotypic data from the 43 wk age point are shown in Table 1, with the first 2 columns showing all the phenotypic traits of the H and L PY hens, and the third column showing the whole population. The chickens selected for RNA-Seq were assigned to either a H or L PY group, and displayed no significant differences at the studied age points in EW, ESW, or any other egg quality traits, excluding PY and YW. The chickens selected for sequencing were slaughtered at this time point. Postmortem measurements further revealed no significant differences in the NOF for both NOF and NOF removed. However, the BW, ovary weight, and liver weight of chickens in group H were significantly higher than those in group L. As there was a significant difference in yolk percentage between groups H and L (P-value < 0.05), and because the control EW did not differ, it follows that the weight of the liver, which produces yolk precursor proteins, would also be significantly different. Finally, we found that the overall NOF in the ovaries of chickens with high yolk ratios was higher than in those of low yolk ratios, but this trend was not significant (P-value > 0.05).
Table 1.
Summary of sequencing chicken and population's phenotypic data in 43 wk.1
| Trait | H group (n = 6) Mean ± SD |
L group (n = 6) Mean ± SD |
Overall (n = 390) Mean ± SD |
|---|---|---|---|
| EW (27 wk, g) | 44.45 ± 2.46 | 45.99 ± 2.67 | - |
| EW (33 wk, g) | 46.69 ± 2.79 | 47.07 ± 2.81 | - |
| EW (43 wk, g) | 50.04 ± 2.05 | 50.02 ± 2.24 | 48.73 ± 3.91 |
| YW (g) | 17.05 ± 0.63a | 13.51 ± 0.7c | 15.08 ± 1.42b |
| PY | 0.34 ± 0.01a | 0.27 ± 0.01c | 0.31 ± 0.02b |
| ESW (g) | 5.03 ± 0.73 | 4.96 ± 0.56 | 4.79 ± 0.56 |
| PS | 0.1 ± 0.01 | 0.1 ± 0.01 | 0.1 ± 0.01 |
| ESS | 2.75 ± 0.36 | 3.24 ± 0.67 | 3.09 ± 0.75 |
| EST (mm) | 297.33 ± 16.9 | 297.61 ± 28.79 | 287.56 ± 30.28 |
| ESI | 1.35 ± 0.05 | 1.33 ± 0.04 | 1.36 ± 0.05 |
| AH (mm) | 4.99 ± 0.73 | 5.36 ± 0.76 | 5.32 ± 0.95 |
| YC | 6.38 ± 1.28 | 5.38 ± 1.22 | 5.76 ± 1.26 |
| HU | 72.29 ± 6.37 | 75.22 ± 6.35 | 75.35 ± 7.48 |
| BW (g) | 1,743.3 ± 187.0a | 1,402.8 ± 241.0b | - |
| OW (g) | 52.62 ± 7.08a | 35.28 ± 4.28b | - |
| ROW (g) | 10.20 ± 2.70 | 9.03 ± 2.71 | - |
| NOFR | 5.33 ± 1.03 | 4.33 ± 0.82 | - |
| NOF | 54.00 ± 13.91 | 45.50 ± 12.11 | - |
| LW (g) | 47.09 ± 10.51a | 31.10 ± 5.36b | - |
a–cDifferent superscripts within a column indicate significant difference (P-value <0.05).
Abbreviations: AH, albumen height; ESI, egg shape index; ESS, eggshell strength; EST, eggshell thickness; ESW, eggshell weight; EW, egg weight; HU, Haugh unit; LW, liver weight; NOF, number of follicles; NOFR, number of follicles removed; OW, ovary weight; PS, percentage of eggshell; PY, percentage of yolk; ROW, remaining ovary weight; YC, yolk color; YW, yolk weight.
Data are presented as means ± SD.
RNA-Seq of Chicken Ovary Tissue and DEGs in the H and L Yolk Percentage Groups
After removing adaptor sequences and low-quality reads, we obtained 4.8 × 10⁸ clean reads, with an average of 3.0 × 10⁷ reads per sample (range 2.39 × 10⁷ to 3.48 × 10⁷). The proportion of mapped reads was relatively high, ranging from 74.57 to 89.06%. The Q20 and Q30 quality values were 96.56 and 92.11%, respectively. The average effective rate value was 98.72%.
After mapping to the Gallus genome, 14,591 genes were identified from all libraries. Among these genes, a total of 7 were expressed only in group H, 29 were expressed only in group L, and 14,555 genes were expressed in both libraries. Among the common genes, 362 genes (Supplementary Table 1) were found to be differentially expressed between these 2 groups, of which 142 and 220 were significantly upregulated and downregulated, respectively, in group H (Figure 2). Table 2 lists the 10 genes that were most highly upregulated or downregulated in group H.
Figure 2.
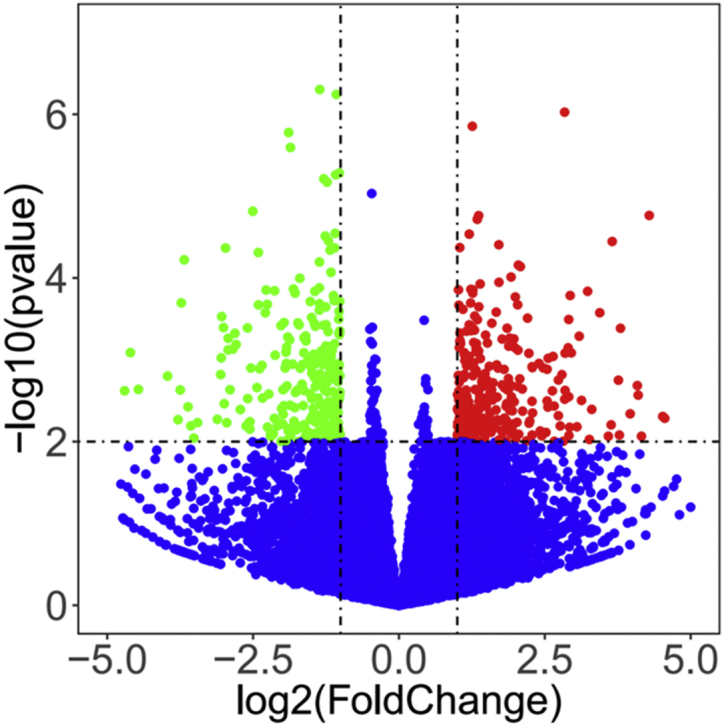
Scatterplot of DEGs. Red points represent upregulated genes with a log2 fold change >1 and P-value < 0.01. Green points represent downregulated genes with a log2 fold change <−1 and P-value < 0.01. Blue points represent genes showing no significant difference. Fold change = normalized gene expression in the H group/normalized gene expression in the L group. Abbreviations: DEGs, differentially expressed genes; H, high; L, low.
Table 2.
Detailed information about the top 10 upregulated and downregulated genes in the high percentage of yolk group.
| Ensembl gene ID | Gene | Fold change | P-value | Up/down | Gene description |
|---|---|---|---|---|---|
| Downregulated genes | |||||
| ENSGALG00000029011 | SLC35F1 | 0.0424959 | 0.00518268 | Down | Solute carrier family 35 member F1 |
| ENSGALG00000030032 | SLC4A10 | 0.0270718 | 0.000457706 | Down | Solute carrier family 4 member 10 |
| ENSGALG00000009645 | ESRRG | 0.0303217 | 0.000548399 | Down | Estrogen-related receptor gamma |
| ENSGALG00000039023 | NIPBLL | 0.0511349 | 1.71588E-05 | Down | Nipped-B homolog-like |
| ENSGALG00000043080 | CCDC85 A | 0.0232416 | 0.002943567 | Down | Coiled-coil domain containing 85A |
| Upregulated genes | |||||
| ENSGALG00000002907 | MYL1 | 13.436006 | 0.002334536 | Up | Myosin light chain 1 |
| ENSGALG00000025958 | LOC112530098 | 26.028801 | 0.002391896 | Up | Small nucleolar RNA U3 |
| ENSGALG00000031211 | LBX2 | 66.24974 | 2.72767E-05 | Up | Ladybird homeobox 2 |
| ENSGALG00000037051 | ODF3L15 | 62.085633 | 0.004124084 | Up | Outer dense fiber protein 3-like 15 |
| ENSGALG00000020160 | ADH6 | 11.431479 | 0.009049071 | Up | Alcohol dehydrogenase 6 |
GO and KEGG Analysis of DEG
We used the clusterProfiler R package to perform GO and KEGG enrichment analysis on the 362 DEGs to identify their biological functions and associated pathways (Figure 3). We found GO terms including extracellular matrix organization, chondrocyte proliferation, extracellular structure organization, platelet activation, collagen-activated signaling pathway, ceramide biosynthetic process, ceramide metabolic process, positive regulation of cell migration, negative regulation of cellular component movement, and negative regulation of alpha-beta T cell differentiation. GO analysis further showed that the DEGs were mainly responsible for cell proliferation, differentiation, movement, and participation in neurometabolic regulation. The most enriched KEGG categories related to the following pathways: neuroactive ligand–receptor interaction, regulation of actin cytoskeleton, ECM–receptor interaction, glycerophospholipid metabolism, the relaxin signaling pathway, ubiquitin digestion and absorption, and the adipocytokine signaling pathway.
Figure 3.

GO-enriched map and pathway enrichment scatterplot of differentially expressed genes. (A) Different colors represent different degrees of significance (P-value<0.05), and the abscissa value represents the number of enriched genes. (B) Different colors represent different degrees of significance (P-value < 0.05). The ordinate indicates the path name, and the abscissa value refers to the ratio of the number of enriched genes to the total number of genes. The size of the point indicates how many differentially expressed genes are in the pathway, and the color of the point corresponds to a different P-value range. Abbreviations: ECM, extracellular matrix; GO, Gene Ontology.
Gene Networks
To investigate the DEGs that interacted with each other, we analyzed the major DEGs (P-adjust < 0.05) using STRING (v11) (Supplementary Table 1). Several interacting genes were identified among the DEGs. As shown in Figure 4, we found that in addition to the candidate genes, some of the nodes contained spiral structures, indicating that the 3-dimensional structure of the protein is known. The edge thickness indicates the strength of the supporting data and disconnected nodes in the network are hidden. The results showed that EEF2 may have a significant influence on the size of the egg yolk, and interacts with RPS4X, C12orf66, TOP2A, and ATAD2B. In addition, we also added more nodes (RPS11, RPS8, RPS3A, RPL8, and RPL3) that are closely associated with the current network to further confirm the importance of EEF2 in this network. EEF2 is involved in the metabolic regulation of cells and lipid metabolism, and is classified as a candidate gene (Table 3).
Figure 4.

The protein-interacted subnetworks of 41 DEGs. Each node represents a protein and the thickness of the edges between proteins represents the degree of interaction between the proteins; the helix in the protein represents the known structure of the protein; the genes that are not in the subnetwork are removed. Abbreviation: DEGs, differentially expressed genes.
Table 3.
Summary of candidate genes involved in ovary weight and yolk weight, based on differential expression in ovary tissue samples between the H group and L group and genome-wide association analyses for yolk weight.
| Symbol | CHR | Ensembl gene ID | Log2 fold change | Gene name | padj | QTL |
|---|---|---|---|---|---|---|
| MNR2 | 7 | ENSGALG00000011349 | −1.27 | Homeodomain protein | 0.04 | Ovary weight |
| AOX1 | 7 | ENSGALG00000008185 | −1.26 | Aldehyde oxidase 1 | 0.04 | Ovary weight |
| ANTXRL | 6 | ENSGALG00000005969 | −1.39 | Anthrax toxin receptor-like | 0.04 | Ovary weight |
| GRAMD1C | 1 | ENSGALG00000035629 | −1.23 | GRAM domain containing 1C | 0.04 | Yolk weight |
| EEF2 |
28 |
ENSGALG00000033884 |
1.48 |
Eukaryotic translation elongation factor 2 |
0.0000794 |
- |
|
P-value |
SNP position |
|||||
| COMP | 28 | ENSGALG00000003283 | 1.65 | Cartilage oligomeric matrix protein | 0.001 | rs312474469 |
| JUND | 28 | ENSGALG00000043641 | 1.15 | JunD proto-oncogene | 0.001 | rs315213484 |
Abbreviations: CHR, chromosome; GRAM, a novel domain in glucosyltransferases, myotubularins and other putative membrane-associated proteins; H, high; L, low; padj, adjusted P-values; QTL, quantitative trait loci.
Candidate Genes
To identify candidate genes, we further examined the 362 DEGs between the H and L groups. The DEGs with the highest fold changes were SLC35F1, LBX2, SLC4A10, ESRRG, and CCDC85 A. These genes have not been previously studied, and our RNA-Seq data suggest that they may be involved in the regulation of yolk size; however, these data alone are not enough to propose them as candidate genes for yolk deposition. To further identify candidate yolk-related genes, the genomic regions associated with the traits “YW” and “ovary weight” (Supplementary Table 3) were selected for analysis based on the QTL locations. We then limited the DEGs list to include only those genes with an adjusted P-value of less than 0.05, and combined this with the GO and KEGG pathway results. Four genes, MNR2, AOX1, ANTXRL, and GRAMD1C, emerged as promising candidate genes for yolk synthesis, transport, and metabolism during the egg laying process. Details of the candidate genes identified in the comparison of groups H and L are listed in Table 3. We also searched for SNPs that were reported to relate to YW in a genome-wide association study, and examined all genes located up to 100 kb upstream and downstream of these SNPs. Comparing these results with our list of DEGs, we found 2 genes that were common to both datasets, COMP and JUND. Finally, we found that EFF2 also has potential as a candidate gene through protein interactions on the STRING website.
Quantitative RT-PCR Validation
The expression of all the candidate genes was validated by quantitative RT-PCR, including 5 downregulated genes (MNR2, AOX1, ANTXRL, GRAMDIC, and EEF2) and 2 upregulated genes (COMP and JUND). To verify the accuracy of our RNA-Seq results, we also randomly selected 17 DEGs (ADH6, MYL1, LOC112530098, ODF31L15, LBX2, CCDC85 A, ESRRG, NIPBLL, SLC4A10, SLC35F1, ALPL, ADNP, FPGT, CITED2, SRPX, FKBP14, and CACNA1H) for qRT-PCR validation. The β-actin gene was used as a reference gene to normalize the expression levels of the 25 DEGs. The results showed that the gene expression detected by these 2 methods were generally consistent, except for ADNP, which was less consistent (Figure 5).
Figure 5.

Correlations of the mRNA expression levels of 24 DEGs. The purple column and red column show the log2 fold change values measured via RNA-Seq and qRT-PCR, respectively. Abbreviations: DEGs, differentially expressed genes; qRT-PCR, quantitative real time PCR; RNA-Seq, RNA sequencing.
Discussion
Most health promoting ingredients in eggs are present in the yolk compared with the egg white, which is 88% water. PY is therefore an important indicator for measuring the nutrition of eggs (Hartmann and Wilhelmson, 2001), with a higher PY indicating a higher nutritional level, and studies focusing on PY are essential. In this experiment, the egg quality of Wenchang laying hens was measured over a complete laying period, and the relationship between PY, EW, and YW was investigated. There was a negative correlation between EW and PY, as the increase of YW was slower than that of EW as EW increased, consistent with previous research (Rahn et al., 1975). In comparison, Rodda et al. (1977) reported a genetic correlation between PY and EW of between −0.28 and −0.1 (Rodda et al., 1977). PY may decrease with an increase in EW because of excessive ESW or the excessive secretion of egg white. During continuous egg production, the size of the yolk is almost unchanged, while the secretion of other proteins can be quite different. Here, we corrected for EW by selecting chickens with consistent EW production before performing RNA-Seq on ovarian tissue. This allowed us to narrow the range of factors affecting yolk percentage, and thus better identify candidate genes relating to the production of high yolk percentage eggs. Compared with traditional cDNA microarray technologies, RNA-Seq has many advantages, such as a greater dynamic range, lower bias, lower frequency of false positives, and higher repeatability (Wilhelm and Landry, 2009). Moreover, results from RNA-Seq transcriptomes have a high correlation with RT-PCR results. In general, including more biological replicates in an experiment increases the reliability of the results. Accordingly, we included 6 biological replicates in each of our trials to ensure confidence in our data.
Yolk production mainly depends on the number of undifferentiated pre-stage follicles in the ovary (Hernandez and Bahr, 2003). The follicles of birds play a crucial role in various physiological processes, have an impact on the economics of production, and have unique developmental characteristics. Yolk size and percentage mainly depend on follicle development, and as the ovary plays an important role in regulating the size of follicles (Kang et al., 2013), the ovary is also important for yolk formation. A follicle is selected from a pool of small yellow follicles during the development of the fractional follicles prior to grading (Hernandez and Bahr, 2003). In the subsequent process of yolk deposition, the yolk, which includes many proteins and lipids, is mainly derived from yolk precursors (Liu et al., 2018). These yolk precursors are gradually synthesized by the liver under the action of estrogen, transported to the developing follicle via blood circulation, and deposited in the developing egg by a specific receptor-mediated mechanism (Schneider, 2016). In chickens, the oocyte is deposited about 10 d before ovulation, after which the yolk is deposited rapidly (http://www.poultryhub.org/physiology/body-systems/reproductive-system/). In this study, we found that some expressed genes participate in liver lipid metabolism, cell development, and hormone secretion regulation, which may affect the process of yolk formation; meanwhile, we identified genes that may regulate the size of the yolk by comparing gene expression in the ovaries of hens with different PY. From this dataset, we predicted candidate yolk-related genes.
We finally identified 3 DEGs located on the QTL relating to ovary weight and YW by integrating the RNA-Seq data and the chicken QTL information, namely MNR2, AOX1, and GRAMD1C. It has been reported that the maturity and ovulation of the yolk follicle are profusely innervated by both adrenergic and cholinergic fibers (Odlind et al., 1995). The neural networks are inextricably linked to the development of follicles in the ovaries (Sun et al., 2015). Neurons are secreted within the thecal layers of the largest follicles, providing the follicle with many neurochemicals (catecholamines, neurotrophins, and vasoactive intestinal peptide) (Onagbesan et al., 2009). Notably, the ectopic expression of MNR2, which functions as a neural determination gene in neural cells, initiates a program of somatic motor neuron differentiation that is characterized by the expression of homeodomain proteins (Tanabe et al., 1998). The synthesis and secretion of very low density lipoprotein (VLDL) and apolipoprotein E that are most essential to the yolk are closely associated with neurons in the brain cortex (Willnow et al., 2007). In addition, MNR2 can induce ectopic expression during embryonic development, indicating that it can indirectly affect female reproductive performance and the growth and development of follicles (Wang et al., 2017). MNR2 expression may be able to also influence the absorption of VLDL and apolipoprotein E in the follicle by neuromodulation and affect the yolk formation. Therefore, we hypothesized that MNR2 was associated with continuous follicular enlargement and nutrient absorption during the transition from small follicles to a mature yolk. Our results confirm that this gene has an important effect on follicular development; the differences among YW with the same EW might be partly led by the variable maturity of the sequential follicles that are regulated by the nerve networks.
The development of the mature yolk is inseparable from the proliferation and differentiation of small follicles, as the avian yolk is derived from the follicle. AOX1 promotes cell proliferation in mice (Terao et al., 2000), which is analogous to its role in chickens. AOX1 may promote growth and development of the follicles in the ovaries to facilitate the formation of the final yolk. Moreover, yolk deposition is the one of the processes of yolk formation via nutrients that include protein and lipid being deposited in the oocyte (Vieira, 2007), or female germ cell involved in the reproduction of lecithotrophic organisms. When the follicle size is > 8 mm, there is a rapid deposition of nutrients to form a mature yolk, indicating that this process is related to genes that participate in protein and lipid metabolism. AOX1 encodes a homodimeric protein that produces hydrogen peroxide. Vieweg et al. (2018) altered the content of crude oil in the diet of polar cod to detect physiological parameters related to lipid homeostasis and observed changes to the expression of AOX1, indicating that AOX1 expression is important for lipid metabolism (Vieweg et al., 2018). Therefore, we speculated that AOX1 may regulate the growth and development of the follicles and thereby influence the NOF. It may also affect the regulation of lipid metabolism to influence the absorption and utilization of lipoproteins by follicles during rapid yolk deposition, leading to some of the differences in the yolk.
GRAMD1C is a member of a highly conserved family of proteins that contain both a GRAM domain and a steroidogenic intense regulatory protein-related lipid transfer domain. GRAM (a novel domain in glucosyltransferases, myotubularins and other putative membrane-associated proteins), domain containing proteins regulate organelle contacts, whereas the steroidogenic intense regulatory protein-related lipid transfer domain is involved in the redistribution of phospholipids to different organelles. The family of proteins is highly conserved from yeast to avian genomes, suggesting an essential functional role. Recently, it has been reported that it is an endoplasmic reticulum-resident protein that regulates sterol transport. The GRAMD family members, containing A, B, and C isoforms, are involved in lipid trafficking with a high specificity for cholesterol (Besprozvannaya et al., 2018). GRAMD-B is specifically required for transport of high density lipoprotein cholesterol from the plasma membrane to the endoplasmic reticulum (Sandhu et al., 2018). Moreover, during the final stage of yolk maturation the follicles absorb a variety of nutrients, such as proteins and lipids that contain sterol, which are inseparable from lipid transport. Therefore, GRAMD1C may be significant in yolk development.
In the ovaries of sexually mature hens, there are numerous slow growing follicles approximately 2 to 6 mm in diameter that contain small amounts of a protein-rich white yolk. One follicle is selected per day from 6 to 8 mm prehierarchical follicles to become a preovulatory follicle, followed by final rapid growth (Bahr and Johnson, 1984; Besprozvannaya et al., 2018). During the final growth phase, yolk fats are synthesized in the liver of the hen and are deposited to the yolk through serum via triacylglycerol-rich VLDL and phospholipid-rich very high density lipoprotein vitellogenin (Speake et al., 1998). In avians, lipid metabolism of the liver has the ability to affect the growth of the ovary and the process from small follicles to a mature yolk. The activator protein 1 member JUND, which is located within 100 kb of the SNP (rs315213484) related to YW, was recently identified as a key modulator of hepatic lipid metabolism in obese mice (Sun et al., 2015; Costantino et al., 2019). These discoveries led us to hypothesize that the differential expression of JUND in the ovary might have a profound impact on the final shaping process of the yolk, which absorbs many lipids and proteins.
Our PPI results for the significant DEGs show a subnetwork with EEF2 as the core gene, interacting with RPS4X, C12orf66, TOP2A, and ATAD2B. EEF2 participates in the cell growth and development process, the mammalian target of rapamycin and adenosine monophosphate-activated protein kinase signaling pathways, and is combined with enzymes (Kamel et al., 2017). Mammalian target of rapamycin plays a role in promoting adipocyte formation and lipid synthesis (Lamming and Sabatini, 2013). Adenosine monophosphate-activated protein kinase mainly promotes glucose and fatty acid catabolism, whereas it prevents protein, glycogen, and fatty acid synthesis (Angin et al., 2016). Therefore, the varying EEF2 expression may have an effect on lipid metabolism in the yolk, leading to variation in yolk size. This supports the theory that this gene is linked to egg yolk formation. In our study, ANTRXL, located on the ovary weight QTL, and COMP, located within 100 kb of an SNP (rs312474469), were both identified as candidate genes. However, no relationship between these 2 genes and follicular development or yolk deposition has been documented. This is the first indication that these 2 genes may function in the development of the yolk, providing an opportunity for future research.
Although this study used relatively few samples, it was carried out in a highly controlled environment to ensure the accuracy of our research results. By integrating information obtained from DEGs, pathway analysis, and correlational studies, our study provides a list of candidate genes with functions and expression levels that are closely related to egg yolk size. Most of these candidate genes are located on the YW and ovary weight QTL, and some are located around SNP sites that are significantly associated with egg YW.
In conclusion, we investigated the transcriptome of ovarian tissue in laying hens with different PY, and qRT-PCR was performed on candidate genes and some DEGs to verify the accuracy of the RNA-Seq. A total of 362 DEGs were identified. Seven of them were identified as candidate genes (MNR2, AOX1, ANTXRL, GRAMD1C, COMP, JUND, and EFF2) through GO, KEGG, and PPI network analyses of the DEGs, analysis of 100 kb upstream and downstream of SNP related to the YW trait, and the positional relationship between the DEG and the YW and ovary weight QTL. The findings of this research provide an important basis for understanding the biology of poultry yolk deposition and clarifying the biological functions and processes of the DEGs. Studies such as this have been lacking in the study of PY, and our study provides a reference for future research.
Acknowledgments
This study was supported by the China Agriculture Research System (CARS-40).
Disclosures
The authors declare no conflicts of interest.
Footnotes
Supplementary data associated with this article can be found in the online version at https://doi.org/10.1016/j.psj.2021.101077.
Supplementary data
References
- Anders S., Huber W. Differential expression analysis for sequence count data. Genome Biol. 2010;11:R106. doi: 10.1186/gb-2010-11-10-r106. [DOI] [PMC free article] [PubMed] [Google Scholar]
- Anderson K.E., Tharrington J.B., Curtis P.A., Jones F.T. Shell characteristics of eggs from historic strains of Single Comb White Leghorn chickens and the relationship of egg shape to shell strength. Int. J. Poult. Sci. 2004;3:17–19. [Google Scholar]
- Angin Y., Beauloye C., Horman S., Bertrand L. Regulation of carbohydrate metabolism, lipid metabolism, and protein metabolism by AMPK. Amp-Activated Protein Kinase. 2016:23–43. doi: 10.1007/978-3-319-43589-3_2. [DOI] [PubMed] [Google Scholar]
- Arukwe A., Goksoyr A. Eggshell and egg yolk proteins in fish: hepatic proteins for the next generation: oogenetic, population, and evolutionary implications of endocrine disruption. Comp. Hepatol. 2003;2:4. doi: 10.1186/1476-5926-2-4. [DOI] [PMC free article] [PubMed] [Google Scholar]
- Bahr J.M., Johnson A.L. Regulation of the follicular hierarchy and ovulation. J. Exp. Zool. 1984;232:495–500. doi: 10.1002/jez.1402320316. [DOI] [PubMed] [Google Scholar]
- Benjamini Y., Hochberg Y. Controlling the false discovery rate - a practical and powerful approach to multiple testing. J. R. Stat. Soc. B. 1995;57:289–300. [Google Scholar]
- Besprozvannaya M., Dickson E., Li H., Ginburg K.S., Bers D.M., Auwerx J., Nunnari J. GRAM domain proteins specialize functionally distinct ER-PM contact sites in human cells. Elife. 2018;7:e31019. doi: 10.7554/eLife.31019. [DOI] [PMC free article] [PubMed] [Google Scholar]
- Costantino S., Akhmedov A., Melina G., Mohammed S.A., Othman A., Ambrosini S., Wijnen W.J., Sada L., Ciavarella G.M., Liberale L., Tanner F.C., Matter C.M., Hornemann T., Volpe M., Mechta-Grigoriou F., Camici G.G., Sinatra R., Luscher T.F., Paneni F. Obesity-induced activation of JunD promotes myocardial lipid accumulation and metabolic cardiomyopathy. Eur. Heart J. 2019;40:997–1008. doi: 10.1093/eurheartj/ehy903. [DOI] [PubMed] [Google Scholar]
- Doyon G., Berniercardou M., Hamilton R.M.G., Castaigne F., Randall C.J. Egg quality .2. Albumin quality OF eggs from 5 commercial STRAINS OF white LEGHORN hens during one YEAR OF lay. Poult. Sci. 1986;65:63–66. [Google Scholar]
- Eisen E.J., Bohren B.B., McKean H.E. Haugh unit as a measure of egg albumen quality. Poult. Sci. 1962;41:1461. [Google Scholar]
- Fernandez M.L., Andersen C.J. The good egg, the forgotten benefits: protein, carotenoids, choline and glycemic index. Hum. Healt Handb. 2015:17–34. [Google Scholar]
- Guo X., Wang Y., Chen Q., Yuan Z., Chen Y., Guo M., Kang L., Sun Y., Jiang Y. The role of PTHLH in ovarian follicle selection, its Transcriptional regulation and genetic effects on egg laying traits in hens. Front Genet. 2019;10:430. doi: 10.3389/fgene.2019.00430. [DOI] [PMC free article] [PubMed] [Google Scholar]
- Hartmann C., Strandberg E., Rydhmer L., Johansson K. Genetic relations of yolk proportion and chick weight with production traits in a White Leghorn line. Br. Poult. Sci. 2003;44:186–191. doi: 10.1080/0007166031000096489. [DOI] [PubMed] [Google Scholar]
- Hartmann C., Wilhelmson M. The hen's egg yolk: a source of biologically active substances. World Poult. Sci J. 2001;57:13–28. [Google Scholar]
- Hernandez A.G., Bahr J.M. Role of FSH and epidermal growth factor (EGF) in the initiation of steroidogenesis in granulosa cells associated with follicular selection in chicken ovaries. Reproduction. 2003;125:683–691. [PubMed] [Google Scholar]
- Hochberg Y., Benjamini Y. More powerful procedures for multiple significance testing. Stat. Med. 1990;9:811–818. doi: 10.1002/sim.4780090710. [DOI] [PubMed] [Google Scholar]
- Johnson A.L. Ovarian follicle selection and granulosa cell differentiation. Poult. Sci. 2015;94:781–785. doi: 10.3382/ps/peu008. [DOI] [PubMed] [Google Scholar]
- Kaliasheva K., Oblakova M., Hristakieva P., Mincheva N., Lalev M. Comparative study on morphological qualities of eggs from new autosexing layer hybrids for free range poultry farming system. Bulgarian J. Agric. Sci. 2017;23:609–616. [Google Scholar]
- Kamel N.N., Ahmed A.M.H., Mehaisen G.M.K., Mashaly M.M., Abass A.O. Depression of leukocyte protein synthesis, immune function and growth performance induced by high environmental temperature in broiler chickens. Int. J. Biometeorol. 2017;61:1637–1645. doi: 10.1007/s00484-017-1342-0. [DOI] [PubMed] [Google Scholar]
- Kang L., Cui X., Zhang Y., Yang C., Jiang Y. Identification of miRNAs associated with sexual maturity in chicken ovary by Illumina small RNA deep sequencing. BMC Genomics. 2013;14:352. doi: 10.1186/1471-2164-14-352. [DOI] [PMC free article] [PubMed] [Google Scholar]
- Kim D., Langmead B., Salzberg S.L. HISAT: a fast spliced aligner with low memory requirements. Nat. Methods. 2015;12:357–360. doi: 10.1038/nmeth.3317. [DOI] [PMC free article] [PubMed] [Google Scholar]
- Kovacs-Nolan J., Phillips M., Mine Y. Advances in the value of eggs and egg components for human health. J. Agric. Food Chem. 2005;53:8421–8431. doi: 10.1021/jf050964f. [DOI] [PubMed] [Google Scholar]
- Lamming D.W., Sabatini D.M. A Central role for mTOR in lipid homeostasis. Cell. Metab. 2013;18:465–469. doi: 10.1016/j.cmet.2013.08.002. [DOI] [PMC free article] [PubMed] [Google Scholar]
- Liu H.Y., Zhang C.Q. Effects of daidzein on messenger ribonucleic Acid expression of gonadotropin receptors in chicken ovarian follicles. Poult. Sci. 2008;87:541–545. doi: 10.3382/ps.2007-00274. [DOI] [PubMed] [Google Scholar]
- Liu X.T., Lin X., Mi Y.L., Zeng W.D., Zhang C.Q. Age-related changes of yolk precursor formation in the liver of laying hens. J. Zhejiang Univ. Sci. B. 2018;19:390–399. doi: 10.1631/jzus.B1700054. [DOI] [PMC free article] [PubMed] [Google Scholar]
- Liu X., Zhang Y., Yan P., Shi T., Wei X. Effects of conjugated linoleic acid on the performance of laying hens, lipid composition of egg yolk, egg flavor, and serum components. Asian-Australas J. Anim. Sci. 2017;30:417–423. doi: 10.5713/ajas.15.1036. [DOI] [PMC free article] [PubMed] [Google Scholar]
- Livak K.J., Schmittgen T.D. Analysis of relative gene expression data using real-time quantitative PCR and the 2(-Delta Delta C(T)) Method. Methods. 2001;25:402–408. doi: 10.1006/meth.2001.1262. [DOI] [PubMed] [Google Scholar]
- Love M.I., Huber W., Anders S. Moderated estimation of fold change and dispersion for RNA-seq data with DESeq2. Genome Biol. 2014;15:550. doi: 10.1186/s13059-014-0550-8. [DOI] [PMC free article] [PubMed] [Google Scholar]
- Marza V.D. The formation of the hen's egg. Parts I-IV. Q. J. Microscopical Sci. 1935;78:133–189. [Google Scholar]
- Munger L.H., Garcia-Aloy M., Vazquez-Fresno R., Gille D., Rosana A.R.R., Passerini A., Soria-Florido M.T., Pimentel G., Sajed T., Wishart D.S., Andres Lacueva C., Vergeres G., Pratico G. Biomarker of food intake for assessing the consumption of dairy and egg products. Genes Nutr. 2018;13:26. doi: 10.1186/s12263-018-0615-5. [DOI] [PMC free article] [PubMed] [Google Scholar]
- Nikolova N., Kocevski D. Forming egg shape index as influenced by ambient temperatures and age of hens. Biotechnol. Anim. Husbandry. 2006;22:119–125. [Google Scholar]
- Odlind V., Rosen M., Stenbeck M. Female genital organs. Acta Oncologica. 1995;34:53–59. doi: 10.3109/02841869509094059. [DOI] [PubMed] [Google Scholar]
- Onagbesan O., Bruggeman V., Decuypere E. Intra-ovarian growth factors regulating ovarian function in avian species: a review. Anim. Reprod. Sci. 2009;111:121–140. doi: 10.1016/j.anireprosci.2008.09.017. [DOI] [PubMed] [Google Scholar]
- Pertea M., Pertea G.M., Antonescu C.M., Chang T.C., Mendell J.T., Salzberg S.L. StringTie enables improved reconstruction of a transcriptome from RNA-seq reads. Nat. Biotechnol. 2015;33:290–295. doi: 10.1038/nbt.3122. [DOI] [PMC free article] [PubMed] [Google Scholar]
- Rahn H., Paganelli C.V., Ar A. Relation of avian egg weight to body-weight. Auk. 1975;92:750–765. [Google Scholar]
- Rodda D.D., Friars G.W., Gavora J.S., Merritt E.S. Genetic parameter Estimates and Strain comparisons of egg Compositional traits. Br. Poult. Sci. 1977;18:459–473. [Google Scholar]
- Salleh M.S., Mazzoni G., Hoglund J.K., Olijhoek D.W., Lund P., Lovendahl P., Kadarmideen H.N. RNA-Seq transcriptomics and pathway analyses reveal potential regulatory genes and molecular mechanisms in high- and low-residual feed intake in Nordic dairy cattle. BMC Genomics. 2017;18:258. doi: 10.1186/s12864-017-3622-9. [DOI] [PMC free article] [PubMed] [Google Scholar]
- Sandhu J., Li S., Fairall L., Pfisterer S.G., Gurnett J.E., Xiao X., Weston T.A., Vashi D., Ferrari A., Orozco J.L., Hartman C.L., Strugatsky D., Lee S.D., He C., Hong C., Jiang H., Bentolila L.A., Gatta A.T., Levine T.P., Ferng A., Lee R., Ford D.A., Young S.G., Ikonen E., Schwabe J.W.R., Tontonoz P. Aster proteins facilitate Nonvesicular plasma membrane to ER cholesterol transport in Mammalian cells. Cell. 2018;175:514–529.e520. doi: 10.1016/j.cell.2018.08.033. [DOI] [PMC free article] [PubMed] [Google Scholar]
- Schneider W.J. Lipid transport to avian oocytes and to the developing embryo. J. Biomed. Res. 2016;30:174–180. doi: 10.7555/JBR.30.20150048. [DOI] [PMC free article] [PubMed] [Google Scholar]
- Shen X., Steyrer E., Retzek H., Sanders E.J., Schneider W.J. Chicken oocyte growth: receptor-mediated yolk deposition. Cell Tissue Res. 1993;272:459–471. doi: 10.1007/BF00318552. [DOI] [PubMed] [Google Scholar]
- Speake B.K., Murray A.M., Noble R.C. Transport and transformations of yolk lipids during development of the avian embryo. Prog. Lipid Res. 1998;37:1–32. doi: 10.1016/s0163-7827(97)00012-x. [DOI] [PubMed] [Google Scholar]
- Sun C., Lu J., Yi G., Yuan J., Duan Z., Qu L., Xu G., Wang K., Yang N. Promising loci and genes for yolk and ovary weight in chickens revealed by a genome-wide association study. PLoS One. 2015;10:e0137145. doi: 10.1371/journal.pone.0137145. [DOI] [PMC free article] [PubMed] [Google Scholar]
- Szklarczyk D., Gable A.L., Lyon D., Junge A., Wyder S., Huerta-Cepas J., Simonovic M., Doncheva N.T., Morris J.H., Bork P., Jensen L.J., Mering C. STRING v11: protein-protein association networks with increased coverage, supporting functional discovery in genome-wide experimental datasets. Nucleic Acids Res. 2019;47:D607–D613. doi: 10.1093/nar/gky1131. [DOI] [PMC free article] [PubMed] [Google Scholar]
- Tanabe Y., William C., Jessell T.M. Specification of motor neuron identity by the MNR2 homeodomain protein. Cell. 1998;95:67–80. doi: 10.1016/s0092-8674(00)81783-3. [DOI] [PubMed] [Google Scholar]
- Terao M., Kurosaki M., Saltini G., Demontis S., Marini M., Salmona M., Garattini E. Cloning of the cDNAs coding for two novel molybdo-flavoproteins showing high similarity with aldehyde oxidase and xanthine oxidoreductase. J. Biol. Chem. 2000;275:30690–30700. doi: 10.1074/jbc.M005355200. [DOI] [PubMed] [Google Scholar]
- Vieira S.L. Chicken embryo utilization of egg micronutrients. Braz. J. Poult. Sci. 2007;9:1–8. [Google Scholar]
- Vieweg I., Bilbao E., Meador J.P., Cancio I., Bender M.L., Cajaraville M.P., Nahrgang J. Effects of dietary crude oil exposure on molecular and physiological parameters related to lipid homeostasis in polar cod (Boreogadus saida) Comp. Biochem. Physiol. C Toxicol. Pharmacol. 2018;206-207:54–64. doi: 10.1016/j.cbpc.2018.03.003. [DOI] [PubMed] [Google Scholar]
- Wang Y., Li J., Feng C., Zhao Y., Hu X., Li N. Transcriptome analysis of comb and testis from Rose-comb Silky chicken (R1/R1) and Beijing Fatty wild type chicken (r/r) Poult. Sci. 2017;96:1866–1873. doi: 10.3382/ps/pew447. [DOI] [PubMed] [Google Scholar]
- Wilhelm B.T., Landry J.R. RNA-Seq-quantitative measurement of expression through massively parallel RNA-sequencing. Methods. 2009;48:249–257. doi: 10.1016/j.ymeth.2009.03.016. [DOI] [PubMed] [Google Scholar]
- Willnow T.E., Hammes A., Eaton S. Lipoproteins and their receptors in embryonic development: more than cholesterol clearance. Development. 2007;134:3239–3249. doi: 10.1242/dev.004408. [DOI] [PubMed] [Google Scholar]
- Wright S.P. Adjusted P-values for Simultaneous Inference. Biometrics. 1992;48:1005–1013. [Google Scholar]
- Yu G.C., Wang L.G., Han Y.Y., He Q.Y. clusterProfiler: an R Package for comparing biological Themes among gene Clusters. Omics. 2012;16:284–287. doi: 10.1089/omi.2011.0118. [DOI] [PMC free article] [PubMed] [Google Scholar]
Associated Data
This section collects any data citations, data availability statements, or supplementary materials included in this article.