Abstract
Objectives
4′-cyano-2′-deoxyguanosine (CdG), a novel nucleoside analogue, has a high degree of antiviral activity against the chronic hepatitis B virus (HBV). The objective of this study was to develop an analytical method for quantitatively determining CdG levels in biological samples by liquid chromatography–mass spectrometry (LC/MS) and to investigate the pharmacokinetic properties of CdG in rats after intravenous and oral administration.
Methods
An analytical method using a UPLC system interfaced with a TOF-MS system was developed and validated. The pharmacokinetic properties after the intravenous and oral administration of CdG to rats were evaluated. In vivo pharmacokinetic interactions between CdG and entecavir were also investigated.
Key findings
A rapid, simple and selective method for the quantification of CdG in biological samples was established using LC/MS with solid-phase extraction. In vivo pharmacokinetic studies of CdG in rats demonstrated that CdG is highly bioavailable, is rapidly absorbed from the intestinal tract, is then distributed to the liver rather than kidney and is ultimately excreted via the urine in an unchanged form. The co-administration of CdG and entecavir led to pharmacokinetic interactions with each other.
Conclusions
The data generated in this study provide support for the clinical development of CdG for use in the treatment of HBV.
Keywords: chronic hepatitis B, liquid chromatography–mass spectrometry, nucleoside analogue, pharmacokinetic
Introduction
Hepatitis B is potentially a life-threatening disease and a worldwide public health problem, which is caused by the hepatitis B virus (HBV).[1] Repeated and sustained HBV infections can cause chronic hepatic disease and elevate the risk of development of chronic hepatitis and advanced-stage liver diseases such as cirrhosis, fibrosis and hepatocellular carcinoma.[2] According to the fact sheets reported by World Health Organization (WHO), more than 250 million individuals are estimated to be affected by chronic HBV infections, worldwide.[3] To date, two types of interferons (IFN) and six kinds of nucleoside analogues (NAs) have been approved by the US Food and Drug Administration (FDA) for the treatment of chronic hepatitis B: IFN alpha-2b, pegylated IFN, lamivudine, adefovir dipivoxil (ADV), entecavir (ETV), telbivudine, tenofovir and tenofovir alafenamide.[4] Although chronic hepatitis B therapy based on these drugs clearly has contributed to human health and welfare, IFN treatment is frequently limited because of the high cost and adverse effects,[5,6] and long-term treatment with NAs causes the appearance of certain HBV variants that result in an acquired resistance against NAs. In fact, an HBV variant that acquired resistance against ADV (HBVA181T/N236T) and ETV (HBVL180M/S202G/M204V) has been reported.[7,8] Therefore, developing a novel therapeutic agent that has potent activity against, not only wild-type HBV but also ETV-resistant and ADV-resistant HBV, would be highly desirable.
To identify novel therapeutic NAs for use in the treatment of hepatitis B, our group previously tested ~150 NAs plus five commercially available NAs (lamivudine, ADV, ETV, telbivudine and tenofovir) for their antiviral activity against HBV in a real-time HBV-PCR assay.[9] Among the ~150 NAs, 4′-cyano-2′-deoxyguanosine (CdG, Figure 1) was found to be highly active against wild-type HBV with a half-maximal inhibitory concentration (IC50) value of 0.0004 μm, a value that is 1.75–500 times lower than those for the five commercially available NAs described above. Furthermore, ETV-resistant HBV (HBVL180M/S202G/M204V) and ADV-resistant HBV (HBVA181T/N236T) had a higher susceptibility to CdG, the IC50 values of which were more than 25 times and 1000 times lower than ETV and ADV, respectively. Therefore, CdG represents a promising candidate for use in as novel therapeutic NA for treating wild-type, ETV-resistant and ADV-resistant HBV. Among the various assessments for drug development, clarifying the pharmacokinetic properties in animal models is one of the essential elements before clinical trials, because pharmacokinetic data in animal models are used to select a dose regimen in humans. However, the pharmacokinetic characteristics of CdG have not yet been investigated because no analytical methods have been developed for quantitatively determining CdG concentrations in biological samples.
Figure 1.
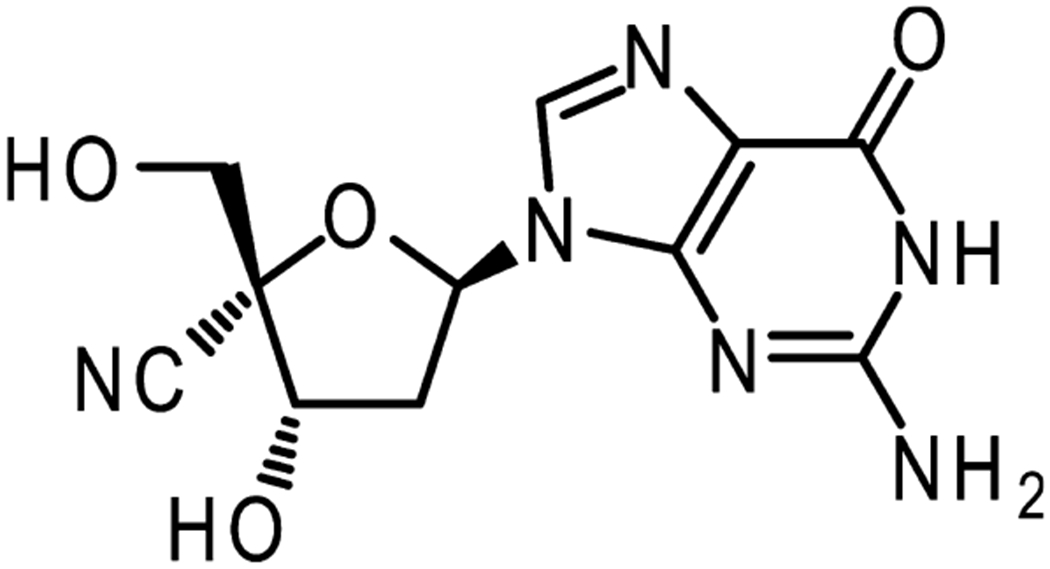
Chemical structure of 4′-cyano-2′-deoxyguanosine (CdG).
In this study, we report on the development and validation of a rapid, simple and selective method for accomplishing this using liquid chromatography–mass spectrometry (LC/MS) for the quantification of CdG in plasma. Pharmacokinetic studies after the intravenous and oral administration of CdG in rats were also carried out. In addition, as patients with hepatitis B typically receive combination nucleoside drug therapy in clinics to reduce the risk of producing a virus that is resistant to NAs, information on drug–drug interactions when CdG and commercially available NAs are co-administered would also be required. In this regard, we also performed a pharmacokinetic study of the co-administration of CdG and ETV to assess the effects of ETV on the pharmacokinetic of CdG and to assess the effect of CdG on the pharmacokinetic of ETV.
Materials and Methods
Chemicals and reagents
ETV was obtained from TCI chemicals (Tokyo, Japan). Ultrapure water (LC/MS grade), methanol (LC/MS grade), formic acid (LC/MS grade) and a 28% ammonia solution were obtained from Wako Pure Chemical Industries (Osaka, Japan). All other chemicals were of the highest grade commercially available. CdG was synthesized following a previously described procedure.[10]
Preparation of calibration standards and samples
A CdG stock solution (1 mg/ml) was serially diluted in water. Calibration standards were prepared using rat blank plasma that had been spiked with CdG working solutions to yield concentrations of 15.625, 31.25, 62.5, 125, 250, 500 and 1000 ng/ml. For the evaluation of intraday and interday validation including precision and accuracy, quality control samples were prepared in the same manner as the calibration standards (20, 200 and 800 ng/ml). The intraday validation was determined on the same day by analysing five replicates of each quality control sample. Interday validation was determined on five different days. For the quantitation of CdG using LC/MS, plasma samples were pretreated using a Waters Oasis® MCX 96-well plate (Waters, Milford, CT, USA), a solid-phase extraction (SPE) column for extracting compounds with cation-exchangeable groups. The SPE protocol was as follows: the MCX 96-well plate was conditioned with methanol and water. Plasma samples were loaded onto the plate and further washed with 2% formic acid in water and then treated with 5% methanol. The samples were eluted with 1 ml of 15% ammonium in 5% methanol and were collected. All samples were evaporated using a centrifugal evaporator. All of the dried samples were reconstituted with methanol/0.1% formic acid (5/95).
LC/MS conditions
LC/MS was conducted on a Waters ACQUITY UPLC system with a TOF-MS system (Xevo® G2-S Tof, Waters). LC separations for both CdG and ETV were performed with a ACQUITY UPLC BEH Phenyl column (2.1 × 100 mm, 1.7 μm particle size, Waters) at 40°C. The mobile phases were an aqueous solution of 0.1% formic acid (solvent A) and 100% methanol (solvent B). The solvent gradient started at 95% A/5% B, changed to 5% A/95% B over 5 min after holding for 1 min. The gradient was returned to 95% A/5% B over 0.1 min and maintained for 4 min for the next run. The flow rate was 0.4 ml/min, and the injection volume was 5 μl. The target mass was 293.1 and 278.1 for CdG and ETV, respectively.
Animals
Male Sprague-Dawley rats (230–270 g) were purchased from the Kyudo Co., Ltd. (Saga, Japan). All animals were maintained under conventional housing conditions, with food and water ad libitum in a temperature-controlled room with a 12 h dark/light cycle. Maintenance of the animals and the experimental procedures performed on them were carried out in accordance with NIH guidelines. All animal experiments were reviewed and approved by the Animal Care and Use Committee of Sojo University (Permit #: 2015-P-020).
Pharmacokinetic studies of CdG
Rats were intravenously (i.v., n = 4) or orally (p.o., n = 4) administered a CdG solution at a dose of 1 mg/kg. At stipulated times after the administration (i.v., 3, 15, 30 min, 1, 3, 6 and 9 h; p.o., 15, 45, 90 min, 3, 6 and 9 h), venous blood samples (0.25 ml) were collected. After collecting the blood samples by means of a heparinized syringe, the blood samples were centrifuged at 3000 rpm for 10 min to give plasma. Urine samples were collected in a metabolic cage for 9 h after the administration of the CdG solution. After the last sampling of blood, rats were sacrificed and kidneys and liver were collected.
Pharmacokinetic study of ETV with and without CdG co-administration
Rats were orally administered an ETV solution, with or without CdG at doses of 1 mg/kg (n = 4 each). At stipulated times after administration (15, 45, 90 min, 3, 6 and 9 h), blood samples (0.25 ml) were collected from the tail vein. After collecting the blood samples by means of a heparinized syringe, the blood samples were centrifuged at 3000 rpm for 10 min to give plasma.
Sample treatment for quantification by LC/MS
For the quantification of the CdG concentration in plasma using LC/MS, plasma samples were treated in the same way as described in the ‘Preparation of calibration standards and samples’ section. A portion of the liver and kidney tissues (about 500 mg) was homogenized in water (1 ml). The homogenized samples were subsequently ultracentrifuged at 100 000 g for 1 h, and supernatant collected. Urine samples were centrifuged at 3000 rpm for 10 min, and the supernatants were used for analysis. All samples derived from organs and urine were processed using a Waters Oasis® MCX 96-well plate in the same manner as was used for the plasma samples before LC/MS analysis. The extraction of ETV from plasma samples was performed using a Waters Oasis® MCX 96-well plate in the same manner as was used for the CdG extraction.
Protein binding
Protein binding assays were performed following a previously reported procedure, with minor modifications.[11] In short, pooled human plasma (Interstate Blood Bank Inc., Memphis, TN, USA), 600 μm human serum albumin (HSA, Sigma-Aldrich, Tokyo, Japan) and 45 μm human α1 acidic glycoprotein (AGP, Sigma-Aldrich, Tokyo, Japan) were spiked with an aqueous solution of CdG to yield a final CdG concentration of 500 ng/ml, respectively. The binding rates were determined by ultrafiltration. Ultrafiltration was carried out using an Amicon® Ultra-0.5 ml centrifugal filter unit with an Ultracel®-30 membrane (Merck Millipore Company, MA, USA). Samples of 500 μl were centrifuged at 14 000 g for 10 min. The CdG concentration was determined by LC/MS without the SPE method.
Data analysis
All data are expressed as the mean ± SD. Statistical analyses for multiple comparisons in the study were determined by the analysis of variance (two-way ANOVA) followed by the Bonferroni analysis. A probability value of P < 0.05 was considered significant. A noncompartment model was used for the pharmacokinetic analysis. Each parameter was calculated using the moment analysis program available on Microsoft Excel.
Results
Validation assay
Before the validation assay, the specificity of the LC/MS method with SPE was confirmed. Figure 2 shows representative chromatographic profiles for blank plasma, plasma spiked with CdG and water spiked with CdG. Under these conditions, no endogenous, interfering peaks were observed, and a sharp peak derived from CdG (m/z 293.1) was clearly detected at around 2 min (Figure 2). In addition, the extraction yield by the solid column using the Waters Oasis® MCX 96-well plate was confirmed. Based on the analysis of relative ion intensity, the absolute recovery results for CdG in rat plasma were 102.7 ± 8.6%, indicating that this method has an acceptable extraction recovery.
Figure 2.
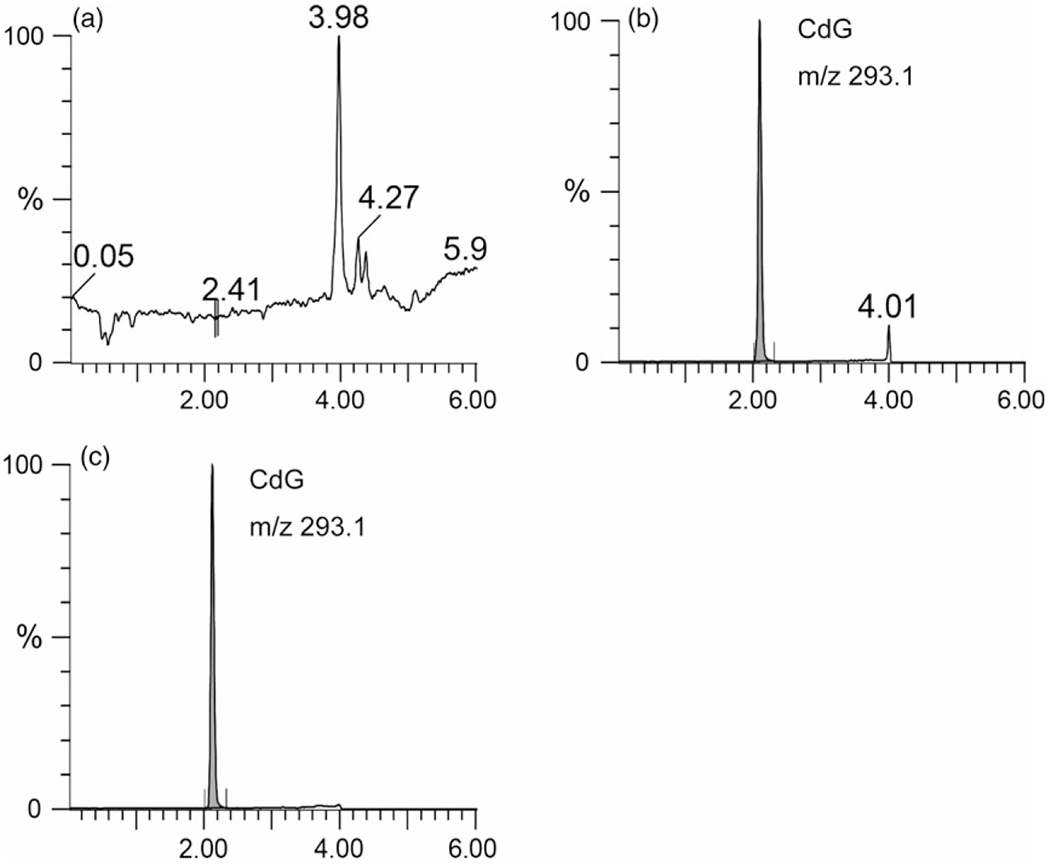
LC/MS chromatograms of (a) blank plasma, CdG spiked with (b) plasma and (c) water. All samples were pretreated with the SPE column (Waters Oasis® MCX 96-well plate) for extracting CdG as described in the Materials and Methods section. CdG in all samples was 1 μg/ml.
Intraday and interday validation assays were performed. A calibration curve was produced by plotting the peak intensity of CdG (y) vs the respective standard concentration (x). The standard curve showed good linearity over the concentration range 15.625–1000 ng/ml by assaying calibration samples at seven different concentrations y = 45.7x+234.4 (r2=0.99). The quantification limit was 15 ng/ml in this established method. The intraday and interday precision and accuracy are shown in Table 1. The intraday precision ranged from 1.5% to 4.1%, and the intraday accuracy was 101.2–103.5%. The interday precision and accuracy ranges were 1.6–7.6% and 101.3–103.6%, respectively. These results indicate that the established method has an acceptable level of precision and accuracy.
Table 1.
Intra- and interday accuracy and precision for CdG in plasma
| Nominal concentration (ng/ml) | Measured concentration (ng/ml) | RSD (%) | Accuracy (%) | |
|---|---|---|---|---|
| Intraday | 20 | 20.4 ± 0.8 | 4.0 | 102.1 |
| 200 | 206.9 ± 8.5 | 4.1 | 103.5 | |
| 800 | 809.7 ± 12.4 | 1.5 | 101.2 | |
| Interday | 20 | 20.7 ± 1.6 | 7.6 | 103.6 |
| 200 | 202.6 ± 6.6 | 3.3 | 101.3 | |
| 800 | 812.1 ± 13.2 | 1.6 | 101.5 | |
Each value represents the mean ± SD (n = 5).
Pharmacokinetic studies of CdG in rats
The plasma concentration-time curve profiles for CdG after intravenous (i.v.) and oral (p.o.) administration at a dose of 1 mg/kg are shown in Figure 3. The corresponding pharmacokinetic parameters were calculated using a non-compartmental analysis (Table 2). CdG was rapidly cleared from the blood circulation, with a half-life (t1/2) value of 0. 5 h for intravenous and 0.7 h for p.o. (Table 2), and reached undetectable levels within 9 h after administration. In addition, CdG was rapidly absorbed following an oral administration, with the time to reach peak plasma concentration (tmax) value of 0.75 h. The bioavailability of CdG was calculated to be approximately 70%, indicating that this compound is absorbed from the intestinal tract relatively efficiently. The distribution of CdG in the liver and kidney was evaluated at 9 h after the administration of CdG. As shown in Figure 4, higher levels of CdG were distributed to the liver than the kidney, even though CdG was not detected in plasma at this time point. We also evaluated the excretion of CdG in the urine. As shown in Figure 5a, the LC/MS chromatographic profile shows that CdG is excreted into the urine in an unchanged form. The amount of unchanged CdG that accumulated in the urine at 9 h after administration was about 113 μg for intravenous and 49 μg for p.o. of the given dose (Figure 5b), corresponding to 45% and 20% of the given dose, respectively.
Figure 3.
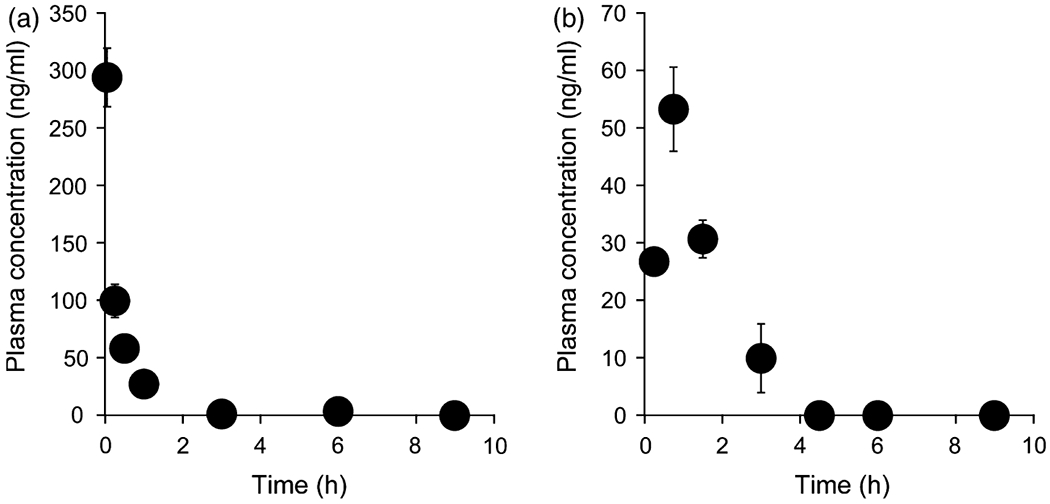
Time course for the plasma concentration of CdG after (a) intravenous injection and (b) oral administration at a dose of 1 mg/kg in rats. Blood samples were collected from the tail vein at 3, 15, 30 min, 1, 3, 6 and 9 h for intravenous or 15, 45, 90 min, 3, 6 and 9 h for p.o. after administration. The CdG concentrations in plasma were measured by the LC/MS with SPE method. The values are the mean ± SD (n = 4).
Table 2.
Pharmacokinetic parameters of CdG after intravenous and oral administration of a dose of 1 mg/kg in rats
| i.v. | p.o. | |
|---|---|---|
| t1/2 (h) | 0.45 ± 0.09 | 0.73 ± 0.12 |
| MRT (h) | 0.49 ± 0.06 | 1.38 ± 0.12 |
| AUC (h·ng/ml) | 122.8 ± 28.1 | 90.1 ± 5.75 |
| CL (L/h/kg) | 8.48 ± 2.21 | 11.1 ± 0.76a |
| Vdss (L/kg) | 4.08 ± 0.62 | – |
| tmax (h) | – | 0.75 |
| Cmax (ng/ml) | – | 53.8 ± 8.63 |
t1/2, half-life; MRT, mean residence time; AUC, area under the concentration-time curve; CL, clearance; Vdss, distribution volume; F, bioavailability. Each value represents the mean ± SD (n = 4).
This value indicates CL/F.
Figure 4.
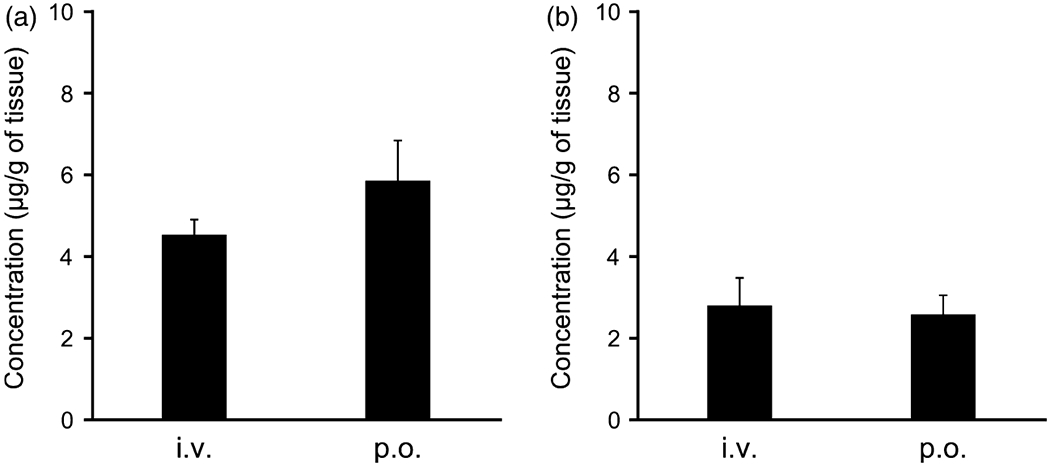
The tissue distribution to (a) liver and (b) kidney of CdG at 9 h after intravenous injection (i.v.) and oral administration (p.o.) at a dose of 1 mg/kg in rats. The CdG concentrations in liver and kidney were measured using LC/MS with SPE method. The values are mean ± SD (n = 4).
Figure 5.
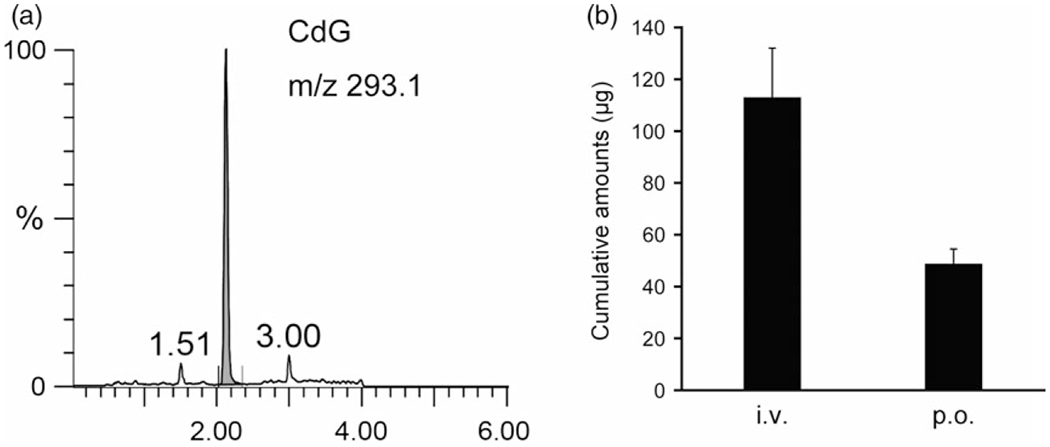
(a) LC/MS chromatograms of CdG in urine. Urine samples were pretreated with the SPE column (Waters Oasis® MCX 96-well plate) for extracting CdG as described in the Materials and Methods section. (b) Accumulative amount of CdG excretion in urine until 9 h after intravenous injection and oral administration at a dose of 1 mg/kg in rats. Urine samples were collected in a metabolic cage. The CdG concentrations in urine were measured using LC/MS with SPE method. The values are mean ± SD (n = 4).
Pharmacokinetic studies of CdG and ETV co-administration
As the co-administration of two NAs may interfere with the pharmacokinetic properties each other, we evaluated the pharmacokinetic characteristics of CdG when co-administered with ETV. Figure 6a shows the plasma concentration curve for CdG after an oral administration of CdG with or without the co-administration of ETV at a dose of 1 mg/kg. The CdG concentration in plasma was increased slightly, with a peak plasma concentration (Cmax) of 60.1 ± 16.1 ng/ml and under the plasma concentration-time curve (AUC) of 143.1 ± 47.7 ng/ml, when ETV is co-administered (Table 3). However, CdG was rapidly absorbed with a tmax of 0.75 h when administered in combination with ETV, as well as when CdG was administered alone. On the other hand, the concentration of ETV in plasma, when administered in combination with CdG, was clearly decreased compared to the administration of ETV alone. Concerning changes in the plasma concentration, the Cmax and AUC for ETV in combination with CdG were significantly decreased in comparison with ETV being administered alone (Table 3). However, the tmax of ETV remained unchanged in the case of the administration of ETV alone and in combination with CdG.
Figure 6.
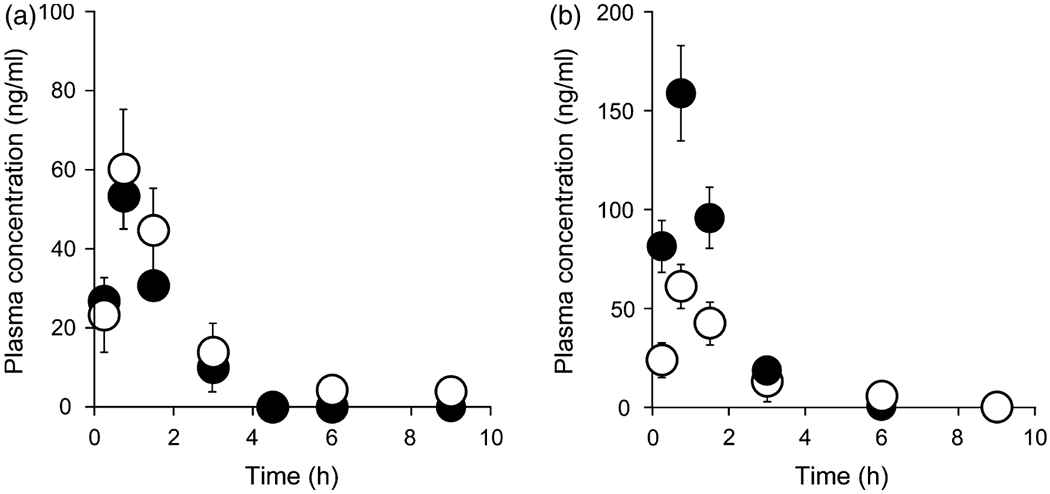
(a) Time course for the plasma concentration of CdG after the oral administration of CdG alone (closed circle) or combination with entecavir (ETV) (open circle) at doses of 1 mg/kg in rats. (b) Time course for the plasma concentration of ETV after the oral administration of ETV alone (closed circle) or combination with CdG (open circle) at doses of 1 mg/kg in rats. Blood samples were collected from the tail vein at 15, 45, 90 min, 3, 6 and 9 h after administration. The CdG and ETV concentrations in plasma were measured using LC/MS with the SPE method. The data for CdG alone are taken from Figure 3b. The values are the mean ± SD (n = 4).
Table 3.
Pharmacokinetic parameters of CdG and entecavir (ETV) after the oral co-administration of CdG and ETV at a dose of 1 mg/kg in rats
| CdG |
ETV |
|||
|---|---|---|---|---|
| ETV (−) | ETV (+) | CdG (−) | CdG (+) | |
| t1/2 (h) | 0.73 ± 0.12 | 1.18 ± 0.33* | 0.72 ± 0.05 | 1.19 ± 0.43 |
| MRT (h) | 1.38 ± 0.12 | 1.91 ± 0.34* | 1.35 ± 0.03 | 1.97 ± 0.56 |
| AUC (h·ng/ml) | 90.1 ± 5.75 | 143 ± 47.7* | 261 ± 16.2 | 140 ± 21.7** |
| CL/F (L/h/kg) | 11.1 ± 0.76 | 7.70 ± 2.73* | 3.85 ± 0.25 | 7.25 ± 1.06** |
| tmax (h) | 0.75 | 0.75 | 0.75 | 0.75 |
| Cmax (ng/ml) | 53.8 ± 8.63 | 60.1 ± 16.1 | 147 ± 5.82 | 62.6 ± 11.9** |
t1/2, half-life; MRT, mean residence time; AUC, area under the concentration-time curve; CL, clearance; F, bioavailability. The data for the CdG (ETV (−)) are quoted from Table 2.
P < 0.05
P < 0.01, each value represents the mean ± SD (n = 4).
Protein binding
We examined the protein binding properties, which are sometimes related to drug–drug interactions. The protein binding rate for CdG in human pooled plasma was about 60.7 ± 0.04%. It is well known that albumin and AGP undergo noncovalent reversible binding to various substances, including drugs, when they are transported in the body.[12] Thus, we subsequently evaluated the binding properties of CdG to HSA and AGP. The binding rate of CdG to HSA was about 11.6 ± 0.01% and about 13.5 ± 0.01% for AGP, indicating that neither HSA nor AGP is major CdG-binding protein.
Discussion
The objective of this study was to develop a simple, selective and validated LC/MS assay for the quantification of CdG in biological samples and to apply the method to in vivo pharmacokinetic studies of CdG. During the development of the assay, we attempted to extract CdG from biological samples, including plasma, organs and urine, by a reverse-phase liquid–liquid extraction method because this method is the simplest and fastest form of extraction. However, a reverse-phase liquid–liquid extraction method using methanol and acetonitrile failed to extract all of the CdG from the biological samples (data not shown). The reason for this is that CdG is a low molecular weight, polar compound as well as ETV and is therefore not ideally suited for reverse-phase liquid–liquid extraction. In previous studies, attempts have been made to develop a method for extracting NAs from biological samples using an SPE method before an LC/MS analysis, and NAs such as ETV, lamivudine and acyclovir could be adequately extracted for applications in pharmacokinetic studies.[13,14] We therefore developed an SPE method using Waters Oasis® MCX columns that were optimized to achieve a higher selectivity and sensitivity for extracting weakly basic compounds with cation-exchangeable groups. The results clearly showed that this sample pretreatment procedure was capable of removing most of the endogenous compounds from biological samples with high recoveries (Figures 2 and 5a). In terms of chromatography, we used a simple mobile phase containing 0.1% formic acid and methanol by gradient elution, which allowed the adequate and quick retention of CdG and better ionization efficiency. Using this procedure, the measurement time for one biological sample was 9 min and the lower limit of quantification for CdG was 15 ng/ml. These results indicate that our established method is adequately suited for the quantification of CdG in biological samples.
The simple, precise and accurate LC/MS method followed by the SPE method afforded satisfactory results for examining the pharmacokinetics of CdG in rats. The findings reported herein provide basic pharmacokinetic information regarding CdG, especially its absorption, distribution, metabolism and excretion, the so-called ADME. In terms of absorbability, CdG was rapidly absorbed following oral administration with a tmax value of 0.75 h, a value that is comparable to that for ETV (tmax: 0.75 h). Based on the Biopharmaceutics Classification System (BCS) guidance, CdG would be classified as a BCS III drug.[15] Many drugs belonging to BCS III show site-dependent absorption, with a better absorption in the upper small intestine.[16,17] In fact, the intestinal permeability of ETV, which is also classified as a BCS III drug, is region dependent, with a better absorption in the duodenum than in the jejunum and ileum.[14] Thus, CdG, as well as ETV, is thought to be absorbed in the upper small intestine, with the result that it is rapidly absorbed after oral administration. It should also be noted that when orally administered, CdG shows a good bioavailability (approximately 70% in rats) similar to other NAs (ETV: approximately 78% in rats,[14] adefovir dipivoxil: approximately 50% in rats[18]). These findings indicate that CdG has the necessary properties for use as an oral preparation, similar to other NAs for HBV treatment. In terms of distribution, CdG was distributed to the liver rather than kidney (Figure 4), which is a desirable characteristic in terms of HBV treatment. In our previous study, the oral administration of CdG at a dose of 0.02 mg/kg/day significantly blocked the replication of both wild-type and ETV-resistant HBV in hu-liver-chimeric-uPA+/+/SCID+/+ mice.[9] This in vivo antiviral activity of CdG can be partly attributed to the fact that it is largely distributed to the liver. In terms of metabolism and excretion, the metabolism and excretion pathway for CdG are thought to be similar to that for ETV because, like ETV, CdG is also a guanosine analogue. It is known that ETV is not a substrate for the cytochrome P450 (CYP450) enzyme system, and no oxidative or acetylated metabolite was observed during the in vivo process, and more than 70% of the orally dosed ETV is excreted into urine in a nonmetabolized form.[19] As expected, CdG was rarely metabolized by CYP450 (data not shown) and is excreted into the urine in an unchanged form (Figure 5). However, we collected only about 20% (49 μg) of the orally dosed CdG at 9 h after its administration. This appears to be related to the phosphorylation of CdG. In general, NAs are rapidly converted into an intracellular active form, such as NA-diphosphate or NA-triphosphate.[20,21] Subsequently, the intracellular NA-phosphates are dephosphorylated relatively slowly and returned to the systemic circulation in an unchanged form. Although we did not investigate the disposition of CdG-phosphate in this study because no analytical methods are available for measuring CdG-phosphates, the phosphorylated form of CdG would be subsequently dephosphorylated in the cell and would then be released to the systemic circulation and eliminated via the urine in an unchanged form. In fact, in another study, we confirmed that the amount of CdG that accumulated in the urine at 2 days after administration was about 40% of the given dose.
Finally, it should be noted that the co-administration of ETV with CdG appears to have an effect on the pharmacokinetics of CdG. As CdG and ETV contain the same guanosine analogue, it can be assumed that some factors related to the pharmacokinetics of this compound are involved in this effect. One factor is competition for intestinal membrane permeation, because, as described above, both CdG and ETV are thought to be absorbed in the upper small intestine. In fact, the Cmax of ETV in combination with CdG was significantly decreased in comparison with the case where ETV was administered alone (Figure 6b), indicating that CdG may competitively inhibit the intestinal membrane permeation of ETV. Another factor is competition in the excretion pathway in the kidney. In this study, the t1/2 for CdG in combination with ETV was prolonged compared to the case where CdG was administered alone and vice versa (Table 3), which could be caused by the inhibition of excretion. It is well known that multiple drug transporters, such as the organic anion transporter 1/3, the organic cation transporter 2 and multidrug and toxin efflux extrusion protein, are involved in the renal secretion and reabsorption of ETV.[22,23] Thus, CdG and ETV might competitively inhibit renal excretion mediated by transporters due to the fact that the structures of CdG and ETV are similar. However, further studies will be needed to determine whether these factors might be related to the pharmacokinetic interactions between CdG and ETV.
Conclusion
This study reports on the development and validation of a rapid, simple and selective method using LC/MS for the quantification of CdG in biological samples. This established method was successfully applied to in vivo pharmacokinetic studies and provides the first data regarding the pharmacokinetic properties of CdG after its intravenous and oral administration in rats. The results obtained from in vivo pharmacokinetic studies of CdG demonstrate that CdG possesses pharmacokinetic properties that are similar to those for ETV due to the fact that both CdG and ETV are guanosine analogues. In addition, the similar structures of CdG to ETV may result in pharmacokinetic interactions, especially in their absorption and elimination, when they are co-administered. The data obtained in this study provide support for the clinical development of CdG for use in the treatment of HBV.
Acknowledgement and funding
This work was supported by a Health and Labor Sciences Research Grant (Practical Research on Hepatitis (research on the innovative development and the practical application of new drugs for hepatitis B)). The authors declare no competing financial interest.
References
- 1.Ott JJ et al. Global epidemiology of hepatitis B virus infection: new estimates of age-specific HBsAg sero-prevalence and endemicity. Vaccine 2012; 30: 2212–2219. [DOI] [PubMed] [Google Scholar]
- 2.Tang C-M et al. Management of chronic hepatitis B infection: current treatment guidelines, challenges, and new developments. World J Gastroenterol 2014; 20: 6262–6278. [DOI] [PMC free article] [PubMed] [Google Scholar]
- 3.WHO. Hepatitis B. WHO; 2017. Available at: http://www.who.int/mediacentre/factsheets/fs204/en/. Accessed August 21, 2017. [Google Scholar]
- 4.Hepatitis B and C – Hepatitis B and C treatments. Available at: http://www.fda.gov/forpatients/illness/hepatitisbc/ucm408658.htm. Accessed August 21, 2017.
- 5.Zoulim F Antiviral therapy of chronic hepatitis B. Antiviral Res 2006; 71: 206–215. [DOI] [PubMed] [Google Scholar]
- 6.Brunetto MR, Bonino F. Interferon therapy of chronic hepatitis B. Intervirology 2014; 57: 163–170. [DOI] [PubMed] [Google Scholar]
- 7.Tacke F, Kroy DC. Treatment for hepatitis B in patients with drug resistance. Ann Transl Med 2016; 4: 334. [DOI] [PMC free article] [PubMed] [Google Scholar]
- 8.Lim Y-S. Management of antiviral resistance in chronic hepatitis B. Gut Liv 2017; 11: 189–195. [DOI] [PMC free article] [PubMed] [Google Scholar]
- 9.Takamatsu Y et al. 4′-modified nucleoside analogs: potent inhibitors active against entecavir-resistant hepatitis B virus. Hepatology 2015; 62: 1024–1036. [DOI] [PMC free article] [PubMed] [Google Scholar]
- 10.Kohgo S et al. Design, efficient synthesis, and anti-HIV activity of 4′-C-cyano- and 4′-C-ethynyl-2′-deoxy purine nucleosides. Nucleosides, Nucleotides Nucleic Acids 2004; 23: 671–690. [DOI] [PubMed] [Google Scholar]
- 11.Enokida T et al. Tyrosine411 and arginine410 of human serum albumin play an important role in the binding of sodium 4-phenylbutyrate to site II. J Pharm Sci 2016; 105: 1987–1994. [DOI] [PubMed] [Google Scholar]
- 12.Otagiri M A molecular functional study on the interactions of drugs with plasma proteins. Drug Metab Pharmacokinet 2005; 20: 309–323. [DOI] [PubMed] [Google Scholar]
- 13.Jiang Q et al. Simultaneous determination of entecavir and lamivudine in rat plasma by UPLC-MS/MS and its application to a pharmacokinetic study. RSC Adv 2016; 6: 70990–70998. [Google Scholar]
- 14.Zhang Q-H et al. Food effect on the pharmacokinetics of entecavir from dispersible tablets following oral administration in healthy Chinese volunteers. Arzneimittelforschung 2011; 60: 640–644. [DOI] [PubMed] [Google Scholar]
- 15.Food and Drug Administration. Waiver of in vivo bioavailability and bioequivalence studies for immediate-release solid oral dosage forms based on a biopharmaceutics classification system guidance for industry waiver of in vivo bioavailability and bioequivalence studies for immediate-release solid oral dosage forms based on a biopharmaceutics classification system guidance for industry contains nonbinding recommendations. 2015. Available at: http://www.fda.gov/Drugs/GuidanceComplianceRegulatoryInformation/Guidances/default.htm. Accessed August 21, 2017.
- 16.Fleisher D et al. Drug, meal and formulation interactions influencing drug absorption after oral administration. Clinical implications. Clin Pharmacokinet 1999; 36: 233–254. [DOI] [PubMed] [Google Scholar]
- 17.Pao LH et al. Reduced systemic availability of an antiarrhythmic drug, bidisomide, with meal co-administration: relationship with region-dependent intestinal absorption. Pharm Res 1998; 15: 221–227. [DOI] [PubMed] [Google Scholar]
- 18.Yoon I-S et al. Effects of 1α,25-dihydroxyvitamin D3 on intestinal absorption and disposition of adefovir dipivoxil and its metabolite, adefovir in rats. Biol Pharm Bull 2015; 38: 1732–1737. [DOI] [PubMed] [Google Scholar]
- 19.Innaimo SF et al. Identification of BMS-200475 as a potent and selective inhibitor of hepatitis B virus. Antimicrob Agents Chemother 1997; 41: 1444–1448. [DOI] [PMC free article] [PubMed] [Google Scholar]
- 20.Yamanaka G et al. Metabolic studies on BMS-200475, a new antiviral compound active against hepatitis B virus. Antimicrob Agents Chemother 1999; 43: 190–193. [DOI] [PMC free article] [PubMed] [Google Scholar]
- 21.Chang CN et al. Biochemical pharmacology of (+)- and (−)-2′,3′-dideoxy-3′-thiacytidine as anti-hepatitis B virus agents. J Biol Chem 1992; 267: 22414–22420. [PubMed] [Google Scholar]
- 22.Yanxiao C et al. Organic anion and cation transporters are possibly involved in renal excretion of entecavir in rats. Life Sci 2011; 89: 1–6. [DOI] [PubMed] [Google Scholar]
- 23.Yang X et al. Multiple drug transporters are involved in renal secretion of entecavir. Antimicrob Agents Chemother 2016; 60: 6260–6270. [DOI] [PMC free article] [PubMed] [Google Scholar]


