Abstract
The rodent heart is frequently used to study human cardiovascular disease (CVD). Although advanced cardiovascular ultrasound imaging methods are available for human clinical practice, application of these techniques to small animals remains limited due to the temporal and spatial-resolution demands. Here, an ultrasound vector-flow workflow is demonstrated that enables visualization and quantification of the complex hemodynamics within the mouse heart. Wild type (WT) and fibroblast growth factor homologous factor 2 (FHF2)-deficient mice (Fhf2KO/Y), which present with hyperthermia-induced ECG abnormalities highly reminiscent of Brugada syndrome, were used as a mouse model of human CVD. An 18-MHz linear array was used to acquire high-speed (30 kHz), plane-wave data of the left ventricle (LV) while increasing core body temperature up to 41.5°C. Hexplex (i.e., six output) processing of the raw data sets produced the output of vector-flow estimates (magnitude and phase); B-mode and color-Doppler images; Doppler spectrograms; and local time histories of vorticity and pericardium motion. Fhf2WT/Y mice had repeatable beat-to-beat cardiac function, including vortex formation during diastole, at all temperatures. In contrast, Fhf2KO/Y mice displayed dyssynchronous contractile motion that disrupted normal inflow vortex formation and impaired LV filling as temperature rose. The hexplex processing approach demonstrates the ability to visualize and quantify the interplay between hemodynamic and mechanical function in a mouse model of human CVD.
I. Introduction
A number of species from zebrafish to non-human primates are used to study cardiovascular development and disease [1]. Murine animal models are by far the most common species to study cardiovascular disease (CVD) [2], [3]. Hemodynamic features such as vortex patterns in the left ventricle (LV) have been proposed as an indicator of cardiac health [4], [5]. However, due to the small size and rapid heart rate of mice (500–700 beats per minute) [6], current imaging technology and approaches provide limited in vivo information of hemodynamic patterns, such as vortex formation, within the beating heart. This limits the number of cardiac function endpoints that can be compared between mouse and human. Our aim is to apply emerging ultrasound imaging approaches in humans [7]–[10] towards murine preclinical studies, particularly as it relates to vorticity imaging [10].
Traditional Doppler methods have been used to characterize cardiac function in mice from embryo to adult using high-frequency ultrasound (HFU) [11], [12]. Cardiac wall motion and blood flow in the mouse LV were analyzed with retrospective techniques that required seven minutes to acquire data representing 0.4 seconds of effective time [13], [14]. Flow features, such as vortex formation, were noted in the color Doppler patterning [14]. A similar retrospective approach was used to look at dyssynchronous myocardial motion in the LV of a post-myocardial-infarction mouse model [15], [16] but blood flow patterns were not evaluated. Detailed cardiac hemodynamic information instantaneously visualized as a flow-field with vector representation remains unreported in adult mice.
Ultrasound plane-wave imaging and vector-flow techniques are methods that overcome the limits of traditional Doppler and achieve fine temporal and spatial resolution [8], [17]–[24]. The major advantages of plane-wave imaging are that high-speed events can be visualized with minimal motion artifacts and advanced Doppler methods can be used to obtain information throughout the full 2D image. Mechanical and hemodynamic information over multiple cardiac cycles can be acquired and analyzed in a single set of data. [21], [24],[25].
With the availability of programmable equipment capable of plane-wave imaging, there is a growing interest in exploring applications, particularly areas involving blood flow and cardiac function, to create a “hemodynamic echocardiogram” workflow. Research to date has focused on improving and implementing techniques at low-MHz frequencies [26]–[28] and on in vivo imaging including, for instance, the adult heart [29], [30], neonates and children [31]–[33], and ophthalmic blood flow [34]. The basic approach to plane-wave and vector-flow imaging has been established and is not fundamentally different based on the transmit frequency. At this time, plane-wave methods using HFU have not been applied to characterize blood-flow-patterns, such as vortex flow, in the mouse heart.
Here, we implement high-speed, HFU vector-flow, plane-wave techniques to demonstrate the utility and feasibility of these methods for murine preclinical studies. We demonstrate this process by comparing the hemodynamic patterning within a wild-type (WT) mouse heart and a fibroblast growth factor homologous factor 2 (FHF2)-deficient knockout (KO) mouse heart [35]. FHF2-deficient mice present with hyperthermia-induced conduction slowing and ECG abnormalities highly reminiscent of Brugada syndrome [36]. The cardiac conduction phenotype of this mouse model has been extensively interrogated with various diagnostic tools [35]; however, the impact of these temperature-sensitive electrocardiographic changes on instantaneous blood flow patterns and wall motion have not been examined.
Our approach allowed multiple quantitative data streams to be generated from a single set of plane-wave data that spanned consecutive cardiac cycles. These data included 1) color-flow Doppler, 2) classic Doppler velocity waveforms, 3) B-mode images, 4) directional vector flow, 5) vorticity and 6) local tissue displacement. We dub this “hexplex” (i.e., six output) processing in a nod to classic duplex imaging [37] although our six data streams were derived from a single transmission mode and one set of data rather than an overlay of multiple transmission modes. Our goal is to demonstrate that the hexplex processing strategy enables a clinically equivalent assessment of intraventricular hemodynamic patterns within the adult mouse heart and enables further understanding of hemodynamic patterning in CVD.
II. Methods
A. Animal Models
All animal studies adhered to the Association for the Assessment and Accreditation of Laboratory Animal Care guidelines and protocols were approved by the NYU School of Medicine Animal Care and Use Committee.
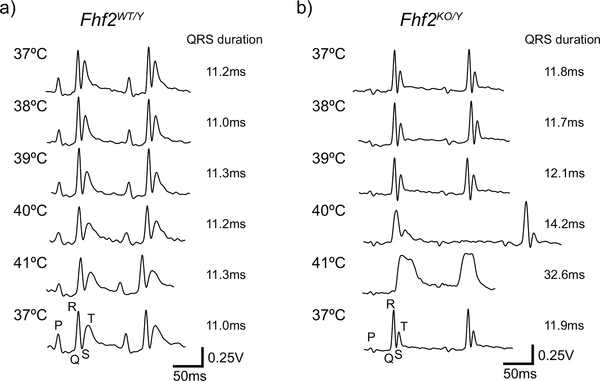
Adult (8–12-week-old) male Fhf2WT/Y and Fhf2KO/Y mice were studied. The ECG abnormalities present in Fhf2KO/Y hearts are reminiscent of Brugada syndrome [36], where ECG parameters change from normal to coved-type ST elevations in the presence of fever or sodium channel blocking drugs (Fig. 1) [35]. The mice were maintained on a 129/svPas strain and originally derived and characterized by the Goldfarb and Fishman laboratories [35]. For plane-wave acquisition experiments, a Fhf2WT/Y and a Fhf2KO/Y mouse were imaged at multiple temperature points during a temperature challenge.
Fig. 1.
Representative ECG traces from Fhf2WT/Y and Fhf2KO/Y mice at a series of body temperatures. (a) Fhf2WT/Y and (b) Fhf2KO/Y ECGs were similar at 37°C. However, conduction intervals were markedly prolonged in Fhf2KO/Y mice at elevated temperatures (≥40°C). High degree AV block and coved-type ST elevations were noted in Fhf2KO/Y above 40°C. Fhf2WT/Y mice did not have altered ECG parameters at any body temperature (37–41°C). Heart rates were similar between the Fhf2WT/Y and Fhf2KO/Y mice.
B. Plane-Wave Acquisition
High-speed plane-wave data were acquired with a Vantage 128 (Verasonics, Redmond, WA) and an 18-MHz, 128 element linear array with an 8-mm elevation focus (Verasonics L22–14v). The array had a 100-μm pitch, an 80-μm element width and a 1.5-mm element length. The Verasonics was controlled via a MATLAB (The MathWorks Inc., Natick, MA) script. The linear array was attached to the end of a modified tissue stabilizer (Octopus, Medtronic, Minneapolis, MN) that allowed the array to be manually positioned to achieve the desired view and then secured in place.
Mice were anesthetized with a low-flow digital anesthesia machine (SomnoSuite, Kent Scientific, Torrington, CT) set at 2% isoflurane, and hair was removed from the chest using a depilatory cream (Nair, Church & Dwight Co., Inc., Ewing, NJ). The mouse lay supine on top of a physiological monitoring station (Indus Instruments, Webster, TX) where the core temperature, respiration rate and ECG were visualized to assess the mouse’s health. Warmed ultrasound transmission gel (Parker, Fairfield, NJ) was placed on the chest and the probe was positioned while using a real-time duplex mode that overlaid color Doppler on a B-mode image [37]. Once the desired LV long-axis view was achieved, the probe was secured in a fixed position and data were acquired as the mouse body temperature increased. The experimental parameters are summarized in Tab. I. While short relative to classic Doppler modes, 1–2 cycle transmissions are often used for plane-wave studies where imaging and Doppler are derived from the same transmit sequence [38], [39].
For temperature ramp experiments, heated air was directed at the mouse in order to raise body temperature at a rate of 1°C per minute. Data were acquired at a series of temperatures between 37°C and 41.5°C over a 1-sec duration (6–10 cardiac cycles), which was near the limit of total continuous data acquisition duration based on the constraints of the hardware.
C. Traditional 2-Dimensional (2D) Echocardiographic Imaging and Analysis
Standard echocardiography was performed on anesthetized (2% isoflurane) Fhf2WT/Y and Fhf2KO/Y mice (n=5/group) using a Vevo 2100 HFU system with a MS400D probe (FUJIFILM VisualSonics, Inc., Toronto, ON, Canada) [35]. A separate cohort of Fhf2WT/Y and Fhf2KO/Y mice were used for Vevo 2100 data acquisition. LV long-axis view data were acquired at normal body temperature (37°C) and then at an elevated core body temperature (41°C). Vevo 2100 V1.5.0 software was used for evaluating ejection fraction (EF, blood volume percentage exiting LV each cardiac cycle) and myocardial strain. A two-way ANOVA statistical test was used to test the impact of independent variables (genotype and body temperature) on EF and myocardial strain endpoints.
D. Plane-Wave Data Processing
1). Beamforming:
Beamforming produced in-phase (I) and quadrature (Q) signal components, and was accomplished with a graphic-processing-unit-(GPU) codec compiled as a MATLAB executable (MEX) file [40]. 128 elements were used for the transmit and receive apertures. A Tukey window with a 10% rolloff parameter was used on the transmit aperture and a Hanning window was applied to the receive aperture. The raw data were bandpass filtered from 11 to 25 MHz with a 30th order finite-impulse response (FIR) filter. Data were beamformed at a 50×50 μm spacing to produce a collection of transmit-to-receive angle pairs (AM,N) with 3 transmit angles (M = −5, 0, 5 degrees) and 3 receive angles (N = −10, 0, 10 degrees) where 0 degrees was normal to the transducer. The receive angle span was increased to 10 degrees to reduce the variance in the estimates [41]. B-mode images were generated from the coherent summation of the three diagonal components of A. The PRF of the B-mode sequence was 1/3 of the absolute 30 kHz transmission rate (i.e., 10 kHz).
2). Spectrograms:
The B-mode data, before log-compression, were processed to generate a color-flow Doppler sequence and spectrograms at any pixel location. The slow-time data were first clutter filtered with a Parks-McClellan optimal equiripple, high-pass, Chebyshev FIR filter [42] of order 133 and normalized cutoff frequency of 0.05 and passband of 0.1. Spectrograms could be generated at any pixel location by first averaging adjacent points in 3×3 grid and then a short-time Fourier transform was applied with a 64 sample window (i.e., 6.4 ms) and step size of 4 samples (i.e., 0.4 ms) followed by a conversion of Doppler frequency to velocity using the Doppler equation [43]. The maximum possible axial velocity, before aliasing, was 24.9 cm/s based on a 10-kHz effective PRF and 15.5 MHz center frequency.
3). Color-Doppler:
Color-flow Doppler maps were derived by calculating the instantaneous slow-time frequency using a lag-one autocorrelation phase estimator method [44] with a sliding window ensemble length of 64 samples and a step size of 4 samples. The lag-one phase estimates were converted to velocity as described above. As the LV flow was not steady nor unidirectional, the lag-one estimates represented a mean velocity rather than a peak velocity.
Because aliasing was present, particularly during early diastole, we implemented a basic phase unwrapping approach after implementing a 3×3 median filter to the lag-one estimates. The dealiasing algorithm was designed to search for zones along each slow-time signal having pairs of phase jumps θ > 1.4∗ π that were spaced between 0.3 to 8 ms (i.e., 3 to 80 samples). These regions were passed through the standard MATLAB phase unwrapping algorithm. The dealiased, slow-time traces were then color coded with a red-blue color hue and overlaid on the B-mode sequence to form color-flow Doppler images. This approach was effective at dealing with intermittent aliasing each cardiac cycle and avoided unwrapping artifacts that arise when blindly applying phase unwrapping to noisy Doppler signals.
4). Vector Flow:
Vector-flow maps were calculated using a multi-angle plane-wave, Doppler estimation strategy as previously described [41], [43], [45], [46]. Using the same approach as with the color-flow Doppler, dealiased Doppler estimates were generated for the full set of beamformed transmit-to-receive pairs (AM,N). A least-squares fitting process was then implemented to estimate the x (lateral) and z (axial) velocity components which yielded a flow magnitude and direction at each pixel location and each time step [41], [45]. The flow vectors could be visualized as x or z velocity maps, or as directional, color-coded vector maps overlaid on the B-mode image sequence.
5). Pericardium Tracking:
A simple motion tracking of the posterior pericardium was employed as an indicator of cardiac contraction from beat to beat. The stack of log-compressed B-mode data were cropped from approximately the centerline of the LV to the far edge of the data spanning a roughly 5×4 mm region that included the far pericardium. A cutoff of 20 dB below the maximum value of the stack was defined. All values above the threshold were defined as 1 and all below 0. Using the initial frame (t = 0) as the reference, a 2D cross-correlation was performed against all following time steps. The maximum cross-correlation value at each time step was tracked in the axial direction to provide a one-dimensional axial displacement versus time [47]. This approach is analogous to analysing cardiac motion from anatomical M-mode data [13], [14], [48], but using a region correlated in time rather than uncorrelated adjacent M-mode slices. The motion tracking was not meant to be a detailed analysis of cardiac wall motion [14], [49], but, rather, an additional indicator of differences in cardiac function between the Fhf2WT/Y and Fhf2KO/Y mice.
6). Vorticity:
Calculation of vorticity provided an indicator of rotational flow [7], [31], [50]. Vorticity, ω, was defined as,
| (1) |
where V was the velocity component in the lateral, x, or axial, z, direction. When the flow is rotational, positive and negative vorticity represent counterclockwise or clockwise rotation, respectively.
The vorticity equation was implemented as a simple difference equation using vector-flow estimates spaced at an interval of 150 μm for Δx and Δz. Vorticity was calculated at each grid point (50 × 50 μm spacing) within a rectangular window such that the center of rotation was approximately in the center of the window. The mean value within the window was then determined. This process was repeated at each slow-time step to generate a vorticity-versus-time curve. Alternate approaches to calculating vorticity are available when the local variation in vorticity is of interest [51] but the simple difference technique we implemented was sufficient for the time history analysis we were interested in.
E. Rotation Phantom
A 1-cm diameter cylinder of tissue-mimicking material (ATS, Bridgeport, CT) was attached to a DC-servo motor and rotated at a constant angular velocity. Data were acquired at a rotation rate of 6 revs/s (18.8 cm/s at outer edge of phantom) with the same system parameters used to acquire mouse data, except over a 0.25 sec duration. Because our multi-angle vector-flow approach has been previously validated with rotation phantoms [41], [46], we only present results of the vorticity calculation for several window locations.
III. Results
A. Vorticity in Phantom
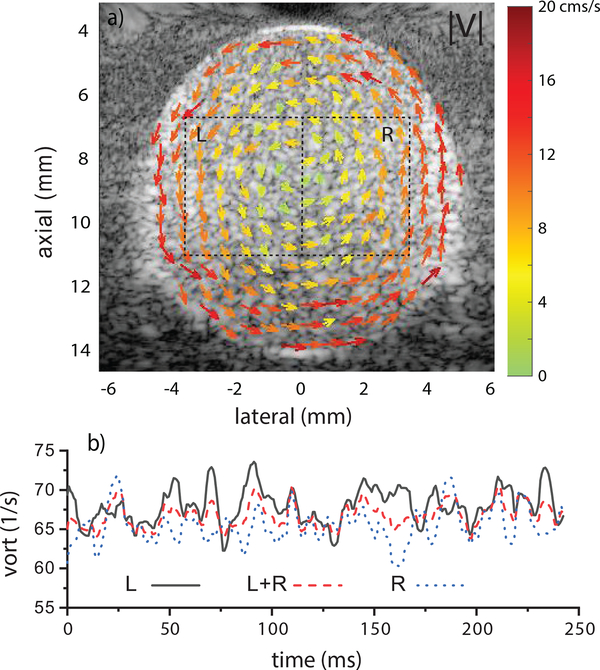
A representative image of vector-flow results in the counterclockwise rotating phantom is shown in Fig. 2a. The vector image clearly indicates the direction of rotation and the increasing velocity from the center to outer edge. Using the regions L and R in Fig. 2a, vorticity was calculated as function of time using Eq. 1. Figure 2b shows curves derived from the regions L, R and L+R. The mean vorticity values were 68 ± 2.3 for L, 65.5 ± 2.3 for R and 66.7± 1.5 1/s for L+R. The expected vorticity was 75.4 1/s. The window placement had minimal impact on the vorticity as would be expected from ideal circular flow.
Fig. 2.
a) Vector-flow mapping from cylindrical phantom rotating at 6 rev/s. b) Vorticity was calculated in the regions L, R and L+R and showed minimal dependence on ROI placement. The expected vorticity was 75.4 1/s.
B. Fhf2KO/Y Mice Exhibit Hyperthermia-Induced Cardiac Dysfunction
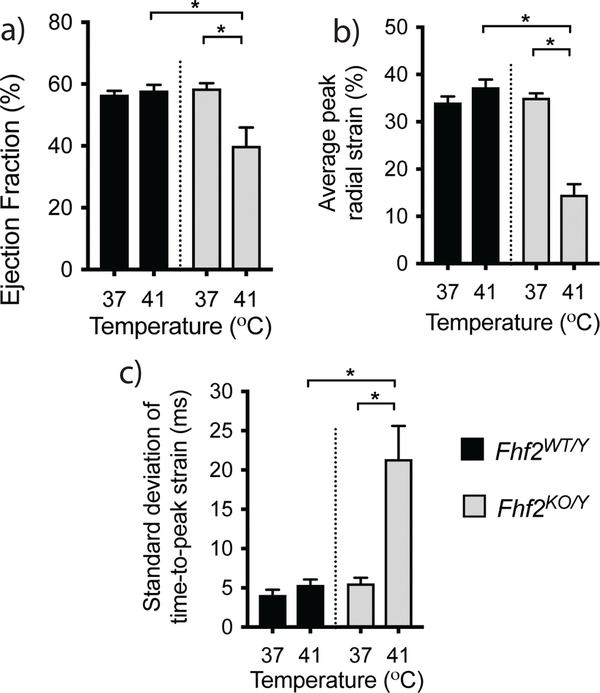
FHF2-deficient mice are highly temperature-sensitive and have marked cardiac conduction slowing at temperatures above 40°C (Fig. 1) [35]. To examine the cardiac contractile consequences produced by these conduction deficits, LV echocardiograms were collected from anesthetized 8–12-week-old Fhf2WT/Y and Fhf2KO/Y mice at a core body temperature of 37°C and 41°C. Fhf2KO/Y mice exhibited normal cardiac function at euthermic conditions while an increase in core body temperature to 41°C resulted in a significant decline in cardiac function concurrent with cardiac conduction slowing (Fig. 3a, video Mm01.mp4). LV ejection fraction (EF) was significantly reduced in Fhf2KO/Y hearts at 41°C (Fhf2WT/Y, 58.5 ±1.7%; Fhf2KO/Y, 40.0 ±2.7%; p < 0.05). In addition, myocardial dynamics were altered including a reduction of systolic strain and an increase in myocardial dyssynchrony (Fig. 3b,c). No temperature-dependent differences in cardiac function or myocardial dynamics were observed in Fhf2WT/Y. These findings suggest that FHF2-deficient mice are an ideal CVD model system to investigate the impact of conduction slowing on hemodynamic patterns within the heart.
Fig. 3.
Hyperthermia-induced cardiac function changes in FHF2 deficient mice. (a) Ejection fraction (EF) in Fhf2WT/Y and Fhf2KO/Y hearts measured at 37°C and 41°C by echocardiography. (b) Quantification of average radial LV systolic strain (c) Quantification of the standard deviation of time to peak strain across six LV myocardial segments. Data represent mean and standard error of the mean, n=5 per group. * p < 0.05 using a two-way ANOVA.
C. Color Doppler, Vector Flow and Spectrograms
1). Fhf2WT/Y Mouse:
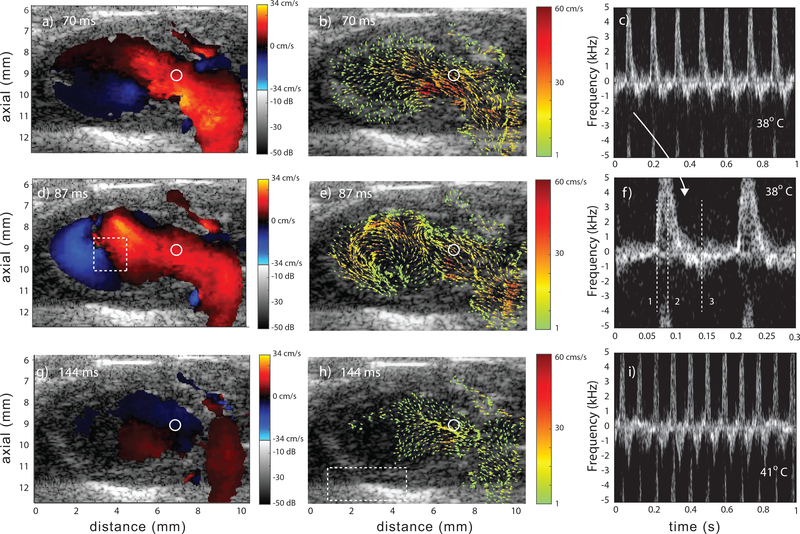
The Fhf2WT/Y mouse LV was imaged as the core body temperature was increased from 37° to 41°C. Representative images of traditional color Doppler, vector flow and spectrograms at 38°C are shown in Figure 4 for three time points of the cardiac cycle: early diastole, mid diastole and mid systole. The video Mm02.mp4 shows 1 sec of color-Doppler and vector-flow data.
Fig. 4.
Representative data from a Fhf2WT/Y mouse at 38°C and three points in cardiac cycle: early diastole (a,b), mid diastole (d,e) and mid systole (g,h). Color Doppler (a,d,g), corresponding vector flow (b,e,h) and spectrograms at 38°C (c and f) and 41°C (i). The spectrogram in f) represents the region of flow marked with the circle in the color-Doppler and vector-flow images. A subregion spanning two cardiac cycles is shown in c) and has the three time points marked with vertical, numbered lines. The spectrogram in (i) represents the same ROI but at 41°C. The rectangular region in (d) represents the ROI for vorticity flow calculations and the region in (h) represents the ROI for the pericardium motion tracking (Sec. III–E). The regions of no flow were a result of the velocities being below the high-pass slow-time cutoff. Videos Mm02.mp4 and Mm03.mp4 show data at 38°C and 41°C, respectively.
At early diastole (Figs. 4a and b) the LV began to fill from the left atrium. The initiation of vortex formation was apparent towards the LV apex as indicated by the adjacent blue and red regions in Fig. 4a and the vector-flow field in Fig. 4b. At mid diastole (Figs. 4d and e) the vortex was fully formed (Fig. 4e). At mid systole, the majority of blood has been ejected from the LV (Fig. 4h).
The spectrogram in Fig. 4c shows 7 cardiac cycles with the expected cyclical flow patterns of a healthy heart. The positive velocities in the spectrogram represented the inflow during diastole (Fig. 4a,b,d and e) and the negative velocities the outflow to the aorta during systole (Fig. 4g and h). The inflow can be considered the E-wave but no distinct A-wave was visible in the spectrograms. The spectrogram in Fig. 4i represents the same ROI in the LV but at 41°C and shows that the flow remained stable and repeatable but at a higher heart rate with 10 cardiac cycles. Video MM03.mp4 shows 0.6 sec of color-Doppler and vector-flow data.
2). Fhf2KO/Y Mouse:
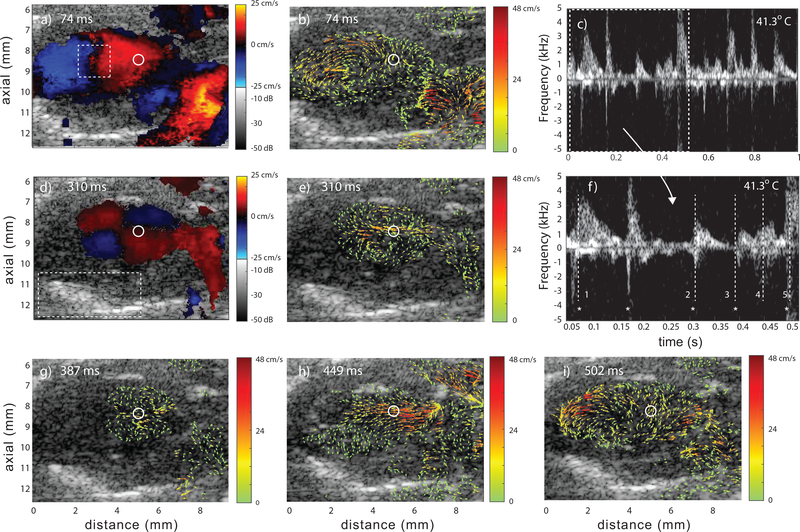
The Fhf2KO/Y mouse LV was imaged as the core body temperature was increased from 37.6°C to 41.3°C. Representative images of color Doppler, vector flow and spectrograms at 41.3°C are shown in Figure 5 at five time points over several cardiac cycles. Video Mm04.mp4 shows 1 sec of color-Doppler and vector-flow data. At physiological temperature, beat-to-beat heart function was similar to the Fhf2WT/Y mouse. An example at 37.6°C is shown in video Mm05.mp4.
Fig. 5.
Representative data from a Fhf2KO/Y mouse at 41.3°C at five time points. Color Doppler (a,d), vector flow (b,e,g,h,i) and spectrograms (c and f) where f) is a subregion of c). The spectrograms represent the region of flow marked with the circle in the color-Doppler and vector-flow images. The five time points are marked in f) with vertical, numbered lines; (1,2,3,5) mid-to-late diastole and (4) systole. The * symbol represents a common reference point each cardiac cycle. The rectangular region in (a) represents the ROI for vorticity flow calculations and the region in (d) represents the ROI for the pericardium motion tracking (Sec. III–E). Video Mm04.mp4 shows 1 sec of data.
Unlike the Fhf2WT/Y data, intraventricular hemodynamic patterns in the Fhf2KO/Y mouse varied from beat to beat at elevated body temperature; likely a reflection of the marked disruption in rapid, synchronous ventricular depolarization. Color-Doppler (Figs. 5a and d) and vector-flow (Figs. 5b and e) data at mid-to-late diastole are shown during two different cardiac cycles: one at 74 ms (time point 1) and another two cardiac cycles later at 310 ms (time point 2).
At 74 ms a fully formed vortex was present in the Fhf2KO/Y heart that was very similar to what was observed for the Fhf2WT/Y heart. At 310 ms, a split vortex formed (Fig. 5e), possibly indicating a toroidal vortex pattern in 3D. The color Doppler image (Fig. 5d) revealed an atypical flow pattern with four quadrants, two with upward flow and two with downward flow. This aberrant pattern in the Fhf2KO/Y heart was not observed in the Fhf2WT/Y heart under any conditions. When viewing the spectrogram (Fig. 5f) at these time points, there was clearly a variation in the interval of each cardiac cycle.
One cardiac cycle further into the data (time point 3), again at mid-to-late diastole, (387 ms) the split vortex was still present in the Fhf2KO/Y heart (Fig. 5g) but less developed and with lower velocities. It appeared that the flow was mainly driven by atrial systole without the inflow kick of LV diastole. Later in this cycle, the outflow during systole (449 ms, time point 4) appeared relatively normal (Fig. 5h) and diastole of the following cardiac cycle (502 ms, time point 5) showed more typical vortex formation without an indication of a split vortex (Fig. 5e).
The overall hemodynamic patterns within the Fhf2KO/Y heart at elevated temperature were revealed to be aberrantly irregular compared to the Fhf2WT/Y heart and showed that blood flow patterns shifted from normal to abnormal and back to normal over several cardiac cycles, reflective of extreme electrical instability.
D. Vorticity
1). Fhf2WT/Y Mouse:
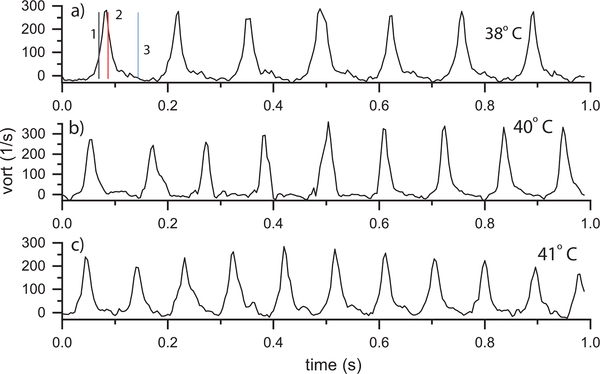
Additional insight into the hemodynamics can be found in the vorticity-versus-time plots. The vorticities for the Fhf2WT/Y mouse at three temperatures (38, 40 and 41°C) are shown in Fig. 6. Time points from Fig. 4 are marked with vertical lines. The vorticity peaked positive (i.e., counter-clockwise rotation) during LV diastole and then was near zero during systole. The peak values were consistent from beat to beat and across the temperatures as summarized in Table II.
Fig. 6.
Fhf2WT/Y vorticity vs. time at a) 38, b) 40 and c) 41°C using the ROI indicated in Fig. 4d. Vorticity peaked during LV diastole and was near zero during systole. The time points in (a) correspond to those in Fig. 4 and correspond to (1) early diastole, (2) mid diastole and (3) mid systole. The vorticity was stable from beat to beat.
TABLE II.
Peak vorticity each cardiac cycle versus temperature
| Fhf2WT/Y | Fhf2KO/Y | ||||
|---|---|---|---|---|---|
| Temp | beats | Peak ω | Temp | beats | Peak ω |
| 37°C | 6 | 239 ±25 1/s | 37.3°C | 6 | 319 ±62 1/s |
| 37.6 | 7 | 316 ±71 | |||
| 38 | 6 | 266 ±11 | 38.1 | 8 | 276 ±74 |
| 39 | 7 | 290 ±26 | 39 | 9 | 324 ±81 |
| 40 | 8 | 312 ±38 | 40 | 8 | 248 ±125 |
| 40.5 | 9 | 257 ±49 | 40.5 | 7 | 156 ±97 |
| 41 | 10 | 235 ±34 | 41 | 8 | 140 ±83 |
| 41.3 | 8 | 177 ±93 | |||
2). Fhf2KO/Y Mouse:
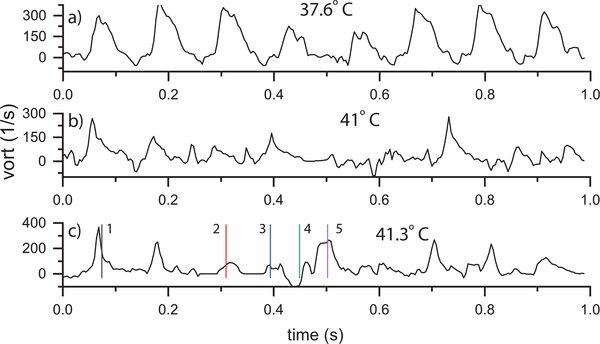
The vorticity plots for the Fhf2KO/Y mouse are shown at three temperatures: 37.6, 41, and 41.3°C (Fig. 7). At 37.6°C (Fig. 7a), the vorticity showed a periodic peak from beat to beat (video Mm05.mp4). However, the time duration of the vortex was longer in the Fhf2KO/Y heart than for the Fhf2WT/Y mouse and the peak vorticity had more variability from beat to beat. At 41°C (Fig. 7 b), vorticity lacked a distinct repeatable pattern from beat to beat.
Fig. 7.
Fhf2KO/Y vorticity vs. time at a) 37.6, b) 41 and c) 41.3° using the ROI indicated in Fig. 5a. The time points in (c) correspond to those in Fig. 5 and represent (1,2,3,5) mid-to-late diastole and (4) systole.
At 41.3°C (Fig. 7c), the vorticity was again erratic from beat to beat as can be seen in the accompanying video (Mm4.mp4). The initial two cycles had local vorticity peaks that were shorter in duration than at 41°C after which distinct vorticity peaks were not visible until near 700 ms. The vorticity plot was consistent with the results in Fig. 5 where weak, poorly formed vorticies were visible over several cardiac cycles.
Table II summarizes the peak vorticity each cardiac cycle for all the measured Fhf2KO/Y temperatures. Compared to the Fhf2WT/Y, the Fhf2KO/Y peak vorticities had greater variability. The mean peak vorticity was significantly lower at elevated temperatures (≥ 40°C) because some cycles had minimal vorticity. For the physiological temperature cases with a distinct peak vorticty each cardiac cycle, the Fhf2WT/Y, the Fhf2KO/Y mean peak vorticities were similar.
E. Pericardium Tracking
1). Fhf2WT/Y Mouse:
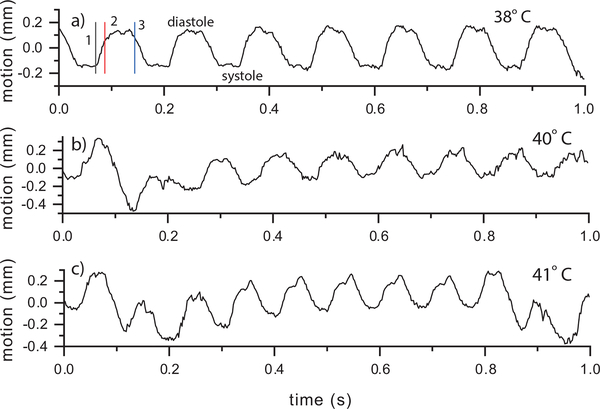
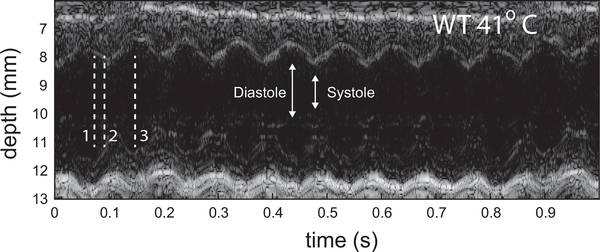
The pericardium tracking data contain the remaining output of the hexplex processing. Figure 8 shows the same three Fhf2WT/Y temperatures as the vorticity results. The curves represent the axial displacement of the pericardium relative to the mean position. A positive value represents an expansion (diastole) and negative indicates contraction (systole). The motion at 38°C shows cyclical axial motion of the tissue and was consistent with the stable nature of the Fhf2WT/Y cardiac function noted above. The total displacement of the tracked region covered 0.4 mm. The motion at 40°C (Fig. 6b) and 41°C (Fig. 6c) were stable and showed the expected increased heart rate. The pericardium motion can also be visualize as an anatomical M-mode sequence [48]. Figure 9 shows such a sequence through the centerline of the LV for the 41°C case.
Fig. 8.
Fhf2WT/Y pericardium axial motion vs. time at a) 38, b) 40 and c) 41°C using the ROI indicated in Fig. 4h. The motion was stable from beat to beat. A respiration artifact from was visible in (b) and (c) causing a drift in the local mean value over time. The time points from Fig. 4 are noted by vertical lines in (a).
Fig. 9.
Anatomic M-mode sequence through the LV centerline of Fhf2WT/Y mouse at 41°C. Motion is observed to be regular from beat to beat.
2). Fhf2KO/Y Mouse:
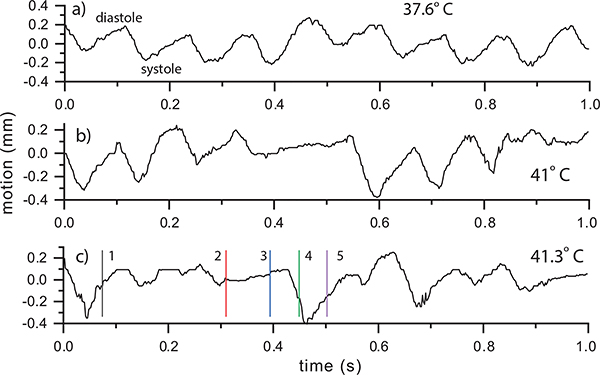
Figure 10 shows pericardium tracking for the Fhf2KO/Y mouse. At 37.6°C (Fig. 8a), the motion appeared periodic from beat to beat, similar to the Fhf2WT/Y heart. At 41°C (Fig. 10b), the initial two beats appeared normal but during the third beat (0.3 sec) the motion range appeared to reduce followed by a period of no motion, likely a consequence of atrioventricular conduction block. The motion then appeared to return to periodic motion for two cycles before again displaying a limited motion range.
Fig. 10.
Fhf2KO/Y far pericardium motion vs. time at a) 37.6, b) 41 and c) 41.3°C using the ROI indicated in Fig. 5f. The time points from Fig. 5 are noted by vertical lines in (c).
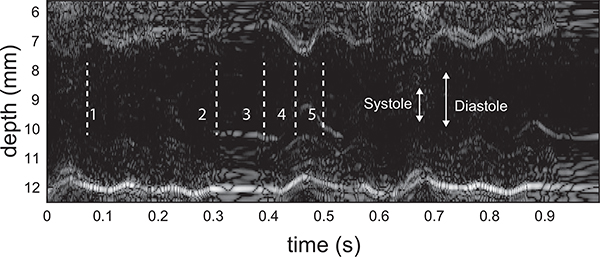
At the highest temperature, 41.3°C (Fig. 10c), the pericardium motion displayed very little indication of cyclical motion. At time point 2 (mid-to-late diastole), the LV motion was minimal and the inflow, as seen by the split vortex in Fig. 5e, was largely driven by atrial systole. On the next beat, during systole (time point 3), there was again minimal motion and a split vortex was observed (Fig. 5g). At time point 4 (systole), LV function reset with ventricular systole beginning to return and strong outflow was established (Fig. 5h). At time point 5, LV diastole was present initiating a primary, although weak, vortex (Fig. 5i). These beat-to-beat contractile and hemodynamic irregularities in Fhf2KO/Y hearts mirror the intermittent high degree conduction block observed at elevated temperatures. The lack of regularity in the pericardium motion at 41.3°C is also visualized as an anatomical M-mode sequence (Figure 11).
Fig. 11.
Anatomic M-mode sequence through the LV centerline of the Fhf2KO/Y mouse at 41.3°C. Motion is observed to be irregular from beat to beat.
IV. Discussion
We obtained a LV long-axis view in line with standard murine imaging practice. The elevation thickness of the transducer was near 800 μm which was a relatively large cut compared to the scale of the heart. The large elevation slice and small scale of the heart resulted in the acquisition of the inflow from the atrium to the aortic outflow in one plane. Although we captured some out-of-plane flow, the overall LV flow dynamics remained well visualized. The myocardium of the atrium was not obviously visible nor was the mitral valve. Regardless, the location of the atrium and myocardium could be deduced based on the inflow and the shifting speckle patterns.
Using the hexplex processing strategy, we were able to observe stable intraventricular hemodynamic patterns in the Fhf2WT/Y heart without the introduction of acoustic contrast agents. As body temperature rose, the Fhf2WT/Y heart had an increase in heart rate but the velocity, vorticity, and pericardium motion remained stable from beat to beat. The Fhf2KO/Y heart presented with marked cardiac dysfunction. As body temperature rose, the electrical disturbances present in the Fhf2KO/Y heart resulted in hemodynamic pattern variability that cycled between normal to abnormal flow patterns. Moreover, the Fhf2KO/Y heart appeared to display subtle abnormal hemodynamic behavior continuously, even at physiological temperature.
The combined color-Doppler, vector-flow, vorticity and motion information, provides insight into the dyssynchronous hemodynamic patterns of the Fhf2KO/Y mouse at elevated body temperature (Figs. 5, 7, and 10). The initial beats displayed normal flow characteristics, however as conduction began to fail, the vortex pattern changed from a fully developed counterclockwise rotation to a split, inefficient vortex with intermittent normal behavior. The split vortex likely arose due to intramyocardial conduction delay causing dyssynchronous ventricular contraction along with discoordinated atrial contraction and ventricular filling. The disrupted vortex patterns corresponded to the lack of normal pericardium motion. These results further enforce the tight interplay between cardiac conduction, myocardial dynamics, and hemodynamic performance to coordinate the heartbeat.
The hexplex processing results presented an indication of how the underlying myocardial mechanics impacted the flow. The pericardium, which does not twist like the myocardium, was a useful proxy for cardiac motion but it was a very primitive method to study cardiac mechanics. The ability to acquire better quality data with sufficient resolution and contrast of the myocardium would permit strain imaging and provide more detailed information to link mechanics and hemodynamics. This information would comprehensively capture multiple aspects of cardiac function in the same dataset and assist with validation of computational fluid dynamics models of cardiac function [52], [53]. In addition, while ECGs have been acquired in the past [35] from the Fhf2KO/Y mice used in these studies, we only monitored and did not simultaneously collect time-matched ECGs during our experiments. ECGs would provide another set of simultaneous information to link electrical function to hemodynamic patterning of blood flow in CVD mouse models.
A frequency of 15.5 MHz was sufficient to perform vector-flow estimates but was somewhat low in terms of resolution, as was seen in the B-mode images that did not present high contrast between the ventricular myocardium and lumen or show motion of the mitral valve. While a higher-frequency transducer would improve the image quality of data, it would also reduce the Doppler aliasing velocity. LV imaging in the long axis benefits from the fact that the inflow and outflow have a strong horizontal component which helps to minimize aliasing during peak flow conditions. Unlike unidirectional flow, the blood-flow patterns in the mouse LV span all directional components and shifting the flow relative to the probe would not allow a simple avoidance of aliasing. Therefore, dealiasing approaches, such as the basic one we implemented, are very beneficial for murine cardiac imaging. Alternate techniques such as multi-PRF methods [54], [55] or more sophisticated phase unwrapping [56] and velocity estimation methods [31], [57], [58] all provide approaches to minimize the impact of or avoid aliasing.
The choice of a 10-degree total transmit span resulted in correct directional information but with a fairly high variance. As demonstrated in Ref. [41], increasing the total transmit angle span improves the accuracy of velocity estimates. We were able to achieve a reduced variance by choosing a “virtual” receive angle span of 20 degrees. Variance could be further reduced by increasing the cycles of the transmit waveform to 3 or more cycles. This would reduce the spectral broadening but would also reduce the axial resolution. The beamforming could also be optimized by using a fixed or variable F-number approach for the receive aperture.
V. Conclusions
We demonstrated that vector-flow methods developed for human-subject cardiac imaging at lower clinical frequencies can be adapted and applied to studies of adult murine cardiac hemodynamics. We employed a hexplex processing approach that yielded 1) color-flow Doppler, 2) Doppler spectrograms, 3) B-mode images, 4) directional vector flow, 5) vorticity and 6) local tissue displacement from a single set of data. This study represents the first application of this technology to study small-animal adult heart function and, as such, represents a validation study rather than a detailed study of a specific mouse model. We were able to ascertain clear changes in ventricular hemodynamic patterning between a Fhf2WT/Y and a Fhf2KO/Y mouse that has documented impaired cardiac conduction during hyperthermia [35]. These changes could be readily identified on a beat-to-beat comparison and allowed us to quantify vector flow (x, z, magnitude and phase), color Doppler, spectrograms, vorticity and pericardium motion. The data were acquired over one second intervals that spanned 6–10 continuous cardiac cycles.
The methods detailed here have the potential to better understand CVD in mouse models and ascertain how reliably the mouse heart replicates human heart mechanics and hemodynamics. Past studies have validated ultrasound-based translational research tools in certain forms for mechanics and flow [13], [59], but not at the detailed level that vector flow permits. The approaches used here add new tools to study the mouse heart and are a first step towards the holy grail of full volumetric vector-flow imaging in mouse models [22], [23].
Akshay Shekhar was born in Southfield, MI. He received his B.S. degree in chemical engineering and M.Eng. degree in biomedical engineering from Cornell University, Ithaca, NY, in 2009 and 2010, respectively. He received his M.S. and Ph.D. degrees in molecular pharmacology from New York University School of Medicine’s Sackler Institute of Graduate Biomedical Sciences, New York, NY, in 2015 and 2018, respectively. His doctoral thesis focused on identifying novel transcriptional mechanisms that modulate conduction system development and physiology in the laboratory of Glenn I. Fishman.
Dr. Shekhar is currently a Postdoctoral Fellow at Regeneron Pharmaceuticals in Tarrytown, New York. His research interests span many facets of cardiovascular biology including mechanical regulation of cardiac development/function, cardiac conduction system electrophysiology, and cardiac metabolism regulation in heart failure. He received predoctoral fellowships including the Ruth L. Kirschstein National Research Service Award and a T32 training grant in pharmacological sciences from National Institute of Health.
Orlando Aristizábal (Member ’04) was born in Popayán, Colombia, in 1964. He received the B.S. degree in physics in 1986 from City College of New York and the M.Phil. degree in Physics in 1993 from the Graduate Center of the City University of New York. During this time he studied the acoustomagnetic properties of Type I and Type II superconducting films. From 1993 to 1995 he was a visiting scholar at the University of Illinois in Urbana-Champaign where he studied the electrical properties of YBCO and other high temperature superconducting thin films.
Since 1996 he has been a Research Scientist at the Skirball Institute of Biomolecular Medicine, New York University School of Medicine. Mr. Aristizábal’s main area of research has been in developing imaging protocols and instrumentation for high frequency ultrasound in order to analyze, in vivo, the normal and abnormal development of the mouse embryo. More recently he has applied other imaging modalities to the same model system such as photoacoustic imaging, MRI, CT and BLI.
From 2007 To 2017 he joined the Research Staff at Riverside Research Institute, New York, NY. Here he worked on the application of high frequency annular array technology for the acquisition and analysis of high resolution 3D volumes of the mouse embryo in utero. Since 2015 Mr. Aristizábal has been Co-Director of the Preclinical Imaging Core Facility at the NYU Langone Medical Center.
Glenn I. Fishman was born in New York. He received his BA degree in chemistry from Cornell University and his MD degree from Stanford University School of Medicine. He subsequently completed his residency in internal medicine at Massachusetts General Hospital, his cardiology fellowship at ColumbiaPresbyterian Medical Center and a research fellowship in molecular cardiology at Albert Einstein College of Medicine. Dr. Fishman is currently the William Goldring Professor of Medicine, Director of the Division of Cardiology and Vice-Chair for Research in the Department of Medicine at NYU Grossman School of Medicine. He serves as principal investigator on multiple grants from the National Institutes of Health, American Heart Association and various foundations, all focused on cardiac excitability and arrhythmia mechanisms.
Colin K.L. Phoon received his B.A. in Biophysics from Johns Hopkins in 1985, his M.Phil. in Pharmacology from the University of Cambridge in 1986, and his M.D. from the University of Pennsylvania School of Medicine in 1990. He completed clinical training at The Johns Hopkins Hospital and the University of California, San Francisco, where he was also a post-doctoral fellow at the Cardiovascular Research Institute. Dr. Phoon joined the faculty at New York University School of Medicine in 1996, where he is currently an Associate Professor in the Division of Pediatric Cardiology. Dr. Phoon pioneered high-frequency ultrasound mouse cardiovascular imaging approaches, and in particular embryonic cardiovascular imaging, with Dr. Dan Turnbull at the Skirball Institute at NYUSoM, and continues to collaborate actively with several investigators on small animal cardiovascular biology. His current research focuses on the role of cardiolipin in the developing heart.
Jeffrey A. Ketterling (Senior Member ’11) was born in Seattle, WA. He received the B.S. degree in electrical engineering from the University of Washington, Seattle, WA, in 1994. He received the Ph.D. degree in mechanical engineering from Yale University, New Haven, CT, in 1999. His thesis focused on experimental studies of phase-space stability in single bubble sonoluminescence.
Dr. Ketterling joined the Lizzi Center for Biomedical Engineering at Riverside Research in 1999 is currently the Associate Research Director. He serves as a principal investigator for programs supported by the National Institutes of Health that deal with high-frequency annular arrays for small-animal and ophthalmic imaging, acoustic contrast agents for microcirculation imaging, vector-flow imaging of blood-flow patterns in animal models, high-speed plane-wave imaging and hydrophone arrays for characterizing the instantaneous acoustic fields of lithotripters.
Dr. Ketterling was the Technical Chair for the Biomedical Acoustics Committee of the Acoustical Society of America from 2008 through 2011 and he is currently the Chair of the Medical Ultrasonics Tech. Program Committee of the IEEE International Ultrasonics Symposium.
Supplementary Material
TABLE I.
Experimental Parameters
| Transmit Cycles | 1.5 |
| Transmit Frequency | 17.86 MHz |
| Doppler Center Freq | 15.5 MHz |
| Transmit Voltage | 25 V |
| Sampling Rate | 62.5 MHz |
| Transmit Angles | −5, 0, 5 degrees |
| Receive Processing Angles | −10, 0, 10 degrees |
| Absolute PRF | 30 kHz |
| Effective PRF | 10 kHz |
| Total Acquisition Time | 1 sec |
VI. Acknowledgements
The authors wish to thank Billy Yiu and Alfred Yu for providing the source code that was adapted for the beamforming and vector-flow calculations in addition to Jonathan Mamou for many helpful discussions. The authors also thank the lab of Mitchell Goldfarb where the Fhf2KO mouse model was generated and the NYU Preclinical Imaging Core, Youssef Zaim Wadghiri director, for the use of the physiological monitoring system, digital anesthesia machine and air warmer.
This research was supported by grants from the National Institutes of Health (HD097485, EY028550, EB022950, HL132438, HL142498, and EY025215).
Contributor Information
Akshay Shekhar, Leon H. Charney Division of Cardiology, NYU Langone Health, New York, NY.
Orlando Aristizábal, Skirball Institute of Biomolecular Medicine, NYU School of Medicine, New York, NY.
Glenn I. Fishman, Leon H. Charney Division of Cardiology, NYU Langone Health, New York, NY
Colin K.L. Phoon, Division of Pediatric Cardiology, Hassenfeld Children’s Hospital at NYU Langone, New York, NY
Jeffrey A. Ketterling, Lizzi Center for Biomedical Engineering, Riverside Research, New York, NY
References
- [1].Santhanakrishnan A and Miller LA, “Fluid dynamics of heart development.” Cell Biochem. Biophys, vol. 61, pp. 1–22, September. 2011. [DOI] [PubMed] [Google Scholar]
- [2].Yutzey KE and Robbins J, “Principles of genetic murine models for cardiac disease,” Circulation, vol. 115, no. 6, pp. 792–799, 2007. [DOI] [PubMed] [Google Scholar]
- [3].Phoon CKL and Turnbull DH, “Cardiovascular imaging in mice,” Curr. Protoc. Mouse. Biol, vol. 6, no. 1, pp. 15–38, 2016. [DOI] [PMC free article] [PubMed] [Google Scholar]
- [4].Gharib M, Rambod E, Kheradvar A, Sahn DJ, and Dabiri JO, “Optimal vortex formation as an index of cardiac health,” Proc. Natl. Acad. Sci, vol. 103, no. 16, pp. 6305–6308, 2006. [DOI] [PMC free article] [PubMed] [Google Scholar]
- [5].Bermejo J, Benito Y, Alhama M, Yotti R, Martínez-Legazpi P, Del Villar CP, Pérez-David E, González-Mansilla A, Santa-Marta C, Barrio A, Fernández-Avilés F, and Del Álamo JC, “Intraventricular vortex properties in nonischemic dilated cardiomyopathy.” Am J Physiol Heart Circ Physiol, vol. 306, no. 3, pp. H718–H729, 2014. [DOI] [PMC free article] [PubMed] [Google Scholar]
- [6].Ho D, Zhao X, Gao S, Hong C, Vatner DE, and Vatner SF, “Heart rate and electrocardiography monitoring in mice,” Curr Protoc Mouse Biol, vol. 1, no. 1, pp. 123–139, 2011. [Online]. Available: https://currentprotocols.onlinelibrary.wiley.com/doi/abs/10.1002/9780470942390.mo100159 [DOI] [PMC free article] [PubMed] [Google Scholar]
- [7].Hong G-R, Pedrizzetti G, Tonti G, Li P, Wei Z, Kim JK, Baweja A, Liu S, Chung N, Houle H, Narula J, and Vannan MA, “Characterization and quantification of vortex flow in the human left ventricle by contrast echocardiography using vector particle image velocimetry,” JACC Cardiovasc. Imaging, vol. 1, no. 6, pp. 705–717, 2008. [Online]. Available: http://www.sciencedirect.com/science/article/pii/S1936878X08003641 [DOI] [PMC free article] [PubMed] [Google Scholar]
- [8].Villemain O, Baranger J, Friedberg MK, Papadacci C, Dizeux A, Messas E, Tanter M, Pernot M, and Mertens L, “Ultrafast ultrasound imaging in pediatric and adult cardiology,” JACC Cardiovasc. Imaging, 2019. [Online]. Available: http://imaging.onlinejacc.org/content/early/2019/11/10/j.jcmg.2019.09.019 [DOI] [PubMed] [Google Scholar]
- [9].Gürel E, Prinz C, Van Casteren L, Gao H, Willems R, and Voigt J-U, “The impact of function-flow interaction on left ventricular efficiency in patients with conduction abnormalities: A particle image velocimetry and tissue doppler study.” J Am Soc Echocardiog, vol. 29, pp. 431–440, May 2016. [DOI] [PubMed] [Google Scholar]
- [10].Mele D, Smarrazzo V, Pedrizzetti G, Capasso F, Pepe M, Severino S, Luisi GA, Maglione M, and Ferrari R, “Intracardiac flow analysis: Techniques and potential clinical applications.” J Am Soc Echocardiog, vol. 32, pp. 319–332, March. 2019. [DOI] [PubMed] [Google Scholar]
- [11].Srinivasan S, Baldwin HS, Aristizabal O, Kwee L, Labow M, Artman M, and Turnbull DH, “Noninvasive, in utero imaging of mouse embryonic heart development with 40-MHz echocardiography,” Circulation, vol. 98, no. 9, pp. 912–918, 1998. [DOI] [PubMed] [Google Scholar]
- [12].Zhou Y-Q, Foster FS, Parkes R, and Adamson SL, “Developmental changes in left and right ventricular diastolic filling patterns in mice.” Am J Physiol Heart Circ Physiol, vol. 285, pp. H1563–H1575, October. 2003. [DOI] [PubMed] [Google Scholar]
- [13].Luo J and Konofagou EE, “High-frame rate, full-view myocardial elastography with automated contour tracking in murine left ventricles in vivo.” IEEE Trans Ultrason Ferroelectr Freq Control, vol. 55, no. 1, pp. 240–248, January 2008. [Online]. Available: 10.1109/TUFFC.2008.633 [DOI] [PubMed] [Google Scholar]
- [14].——, “Imaging of wall motion coupled with blood flow velocity in the heart and vessels in vivo: a feasibility study.” Ultrasound Med Biol, vol. 37, pp. 980–995, June. 2011. [DOI] [PMC free article] [PubMed] [Google Scholar]
- [15].Li Y, Garson CD, Xu Y, Beyers RJ, Epstein FH, French BA, and Hossack JA, “Quantification and MRI validation of regional contractile dysfunction in mice post myocardial infarction using high resolution ultrasound.” Ultrasound Med Biol, vol. 33, pp. 894–904, June. 2007. [DOI] [PMC free article] [PubMed] [Google Scholar]
- [16].Li Y, Garson CD, Xu Y, French BA, and Hossack JA, “High frequency ultrasound imaging detects cardiac dyssynchrony in noninfarcted regions of the murine left ventricle late after reperfused myocardial infarction,” Ultrasound Med Biol, vol. 34, no. 7, pp. 1063–1075, 2008. [DOI] [PMC free article] [PubMed] [Google Scholar]
- [17].Fadnes S, Bjærum S, Torp H, and Lovstakken L, “Clutter filtering influence on blood velocity estimation using speckle tracking,” IEEE Trans Ultrason Ferroelectr Freq Control, vol. 62, no. 12, pp. 2079–2091, December 2015. [Online]. Available: 10.1109/TUFFC.2015.007247 [DOI] [PubMed] [Google Scholar]
- [18].Tanter M and Fink M, “Ultrafast imaging in biomedical ultrasound.” IEEE Trans Ultrason Ferroelectr Freq Control, vol. 61, no. 1, pp. 102–119, January 2014. [Online]. Available: 10.1109/TUFFC.2014.6689779 [DOI] [PubMed] [Google Scholar]
- [19].Bercoff J, Montaldo G, Loupas T, Savery D, Mézière F, Fink M, and Tanter M, “Ultrafast compound Doppler imaging: providing full blood flow characterization.” IEEE Trans Ultrason Ferroelectr Freq Control, vol. 58, no. 1, pp. 134–147, January 2011. [Online]. Available: 10.1109/TUFFC.2011.1780 [DOI] [PubMed] [Google Scholar]
- [20].Udesen J, Gran F, Hansen KL, Jensen JA, Thomsen C, and Nielsen MB, “High frame-rate blood vector velocity imaging using plane waves: simulations and preliminary experiments.” IEEE Trans Ultrason Ferroelectr Freq Control, vol. 55, no. 8, pp. 1729–1743, August 2008. [Online]. Available: 10.1109/TUFFC.2008.858 [DOI] [PubMed] [Google Scholar]
- [21].Faurie J, Baudet M, Poree J, Cloutier G, Tournoux F, and Garcia D, “Coupling myocardium and vortex dynamics in diverging-wave echocardiography.” IEEE Trans Ultrason Ferroelectr Freq Control, vol. 66, pp. 425–432, March. 2019. [DOI] [PubMed] [Google Scholar]
- [22].Correia M, Provost J, Tanter M, and Pernot M, “4D ultrafast ultrasound flow imaging: in vivo quantification of arterial volumetric flow rate in a single heartbeat.” Phys Med Biol, vol. 61, pp. L48–L61, December. 2016. [DOI] [PubMed] [Google Scholar]
- [23].Wigen MS, Fadnes S, Rodriguez-Molares A, Bjastad T, Eriksen M, Stensath KH, Stoylen A, and Lovstakken L, “4-D intracardiac ultrasound vector flow imaging-feasibility and comparison to phase-contrast MRI.” IEEE Trans Med Imaging, vol. 37, pp. 2619–2629, December. 2018. [DOI] [PubMed] [Google Scholar]
- [24].Papadacci C, Finel V, Villemain O, Goudot G, Provost J, Messas E, Tanter M, and Pernot M, “4D simultaneous tissue and blood flow Doppler imaging: revisiting cardiac doppler index with single heart beat 4D ultrafast echocardiography.” Phys Med Biol, vol. 64, p. 085013, April. 2019. [DOI] [PubMed] [Google Scholar]
- [25].Ekroll IK, Swillens A, Segers P, Dahl T, Torp H, and Lovstakken L, “Simultaneous quantification of flow and tissue velocities based on multi-angle plane wave imaging.” IEEE Trans Ultrason Ferroelectr Freq Control, vol. 60, pp. 727–738, April. 2013. [DOI] [PubMed] [Google Scholar]
- [26].Demené C, Deffieux T, Pernot M, Osmanski B-F, Biran V, Gennisson J-L, Sieu L-A, Bergel A, Franqui S, Correas J-M, Cohen I, Baud O, and Tanter M, “Spatiotemporal clutter filtering of ultrafast ultrasound data highly increases Doppler and fultrasound sensitivity.” IEEE Trans Med Imaging, vol. 34, no. 11, pp. 2271–2285, November 2015. [Online]. Available: 10.1109/TMI.2015.2428634 [DOI] [PubMed] [Google Scholar]
- [27].Salles S, Chee AJY, Garcia D, Yu ACH, Vray D, and Liebgott H, “2-D arterial wall motion imaging using ultrafast ultrasound and transverse oscillations.” IEEE Trans Ultrason Ferroelectr Freq Control, vol. 62, no. 6, pp. 1047–1058, June 2015. [Online]. Available: 10.1109/TUFFC.2014.006910 [DOI] [PubMed] [Google Scholar]
- [28].Swillens A, Shcherbakova D, Trachet B, Segers P, Ekroll IK, and Løvstakken L, “A multi-angle plane wave imaging approach for high frequency 2D flow visualization in small animals: simulation study in the murine arterial system,” in Proc. IEEE Int. Ultrasonics Symp. (IUS), 2014, pp. 1710–1713. [Google Scholar]
- [29].Osmanski B, Maresca D, Messas E, Tanter M, and Pernot M, “Transthoracic ultrafast doppler imaging of human left ventricular hemodynamic function,” IEEE Trans. Ultrason., Ferroelectr., Freq. Control, vol. 61, no. 8, pp. 1268–1275, 2014. [DOI] [PMC free article] [PubMed] [Google Scholar]
- [30].Hansen KL, Møller-Sørensen H, Pedersen MM, Hansen PM, Kjaergaard J, Lund JT, Nilsson JC, Jensen JA, and Nielsen MB, “First report on intraoperative vector flow imaging of the heart among patients with healthy and diseased aortic valves.” Ultrasonics, vol. 56, pp. 243–250, February. 2015. [DOI] [PubMed] [Google Scholar]
- [31].Nyrnes SA, Fadnes S, Wigen MS, Mertens L, and Lovstakken L, “Blood speckle-tracking based on high-frame rate ultrasound imaging in pediatric cardiology,” J. Am. Soc. Echocardiogr, vol. 33, no. 4, pp. 493–503.e5, 2020. [Online]. Available: http://www.sciencedirect.com/science/article/pii/S0894731719311149 [DOI] [PubMed] [Google Scholar]
- [32].Fadnes S, Ekroll IK, Nyrnes SA, Torp H, and Lovstakken L, “Robust angle-independent blood velocity estimation based on dual-angle plane wave imaging.” IEEE Trans Ultrason Ferroelectr Freq Control, vol. 62, no. 10, pp. 1757–1767, October 2015. [Online]. Available: 10.1109/TUFFC.2015.007108 [DOI] [PubMed] [Google Scholar]
- [33].Hansen KL, Juul K, Møller-Sørensen H, Nilsson JC, Jensen JA, and Nielsen MB, “Pediatric transthoracic cardiac vector flow imaging –a preliminary pictorial study,” Ultrasound Int Open, vol. 05, no. 01, pp. E20–E26, 2019. [DOI] [PMC free article] [PubMed] [Google Scholar]
- [34].Urs R, Silverman RH, and Ketterling JA, “Ultrafast ultrasound imaging of ocular anatomy and blood flow,” Invest Ophthalmol Vis Sci, vol. 57, no. 8, pp. 3810–3816, 2016. [DOI] [PMC free article] [PubMed] [Google Scholar]
- [35].Park DS, Shekhar A, Marra C, Lin X, Vasquez C, Solinas S, Kelley K, Morley G, Goldfarb M, and Fishman GI, “Fhf2 gene deletion causes temperature-sensitive cardiac conduction failure.” Nat. Commun, vol. 7, p. 12966, October. 2016. [DOI] [PMC free article] [PubMed] [Google Scholar]
- [36].Brugada P and Brugada J, “Right bundle branch block, persistent st segment elevation and sudden cardiac death: A distinct clinical and electrocardiographic syndrome: A multicenter report,” J. Am. Coll. Cardiol, vol. 20, no. 6, pp. 1391–1396, 1992. [Online]. Available: http://www.sciencedirect.com/science/article/pii/073510979290253J [DOI] [PubMed] [Google Scholar]
- [37].Barber FE, Baker DW, Nation AWC, Strandness DE, and Reid JM, “Ultrasonic duplex echo-Doppler scanner,” IEEE Trans. Biomed. Eng, vol. BME-21, no. 2, pp. 109–113, 1974. [DOI] [PubMed] [Google Scholar]
- [38].Tremblay-Darveau C, Williams R, Milot L, Bruce M, and Burns PN, “Combined perfusion and Doppler imaging using plane-wave nonlinear detection and microbubble contrast agents,” IEEE Trans. Ultrason., Ferroelectr., Freq. Control, vol. 61, no. 12, pp. 1988–2000, 2014. [DOI] [PubMed] [Google Scholar]
- [39].Provost J, Papadacci C, Demene C, Gennisson J-L, Tanter M, and Pernot M, “3-D ultrafast Doppler imaging applied to the noninvasive mapping of blood vessels in vivo.” IEEE Trans Ultrason Ferroelectr Freq Control, vol. 62, pp. 1467–1472, August. 2015. [DOI] [PMC free article] [PubMed] [Google Scholar]
- [40].Yiu BYS, Tsang IKH, and Yu ACH, “GPU-based beamformer: fast realization of plane wave compounding and synthetic aperture imaging,” IEEE Trans Ultrason Ferroelectr Freq Control, vol. 58, no. 8, pp. 1698–1705, August 2011. [Online]. Available: 10.1109/TUFFC.2011.1999 [DOI] [PubMed] [Google Scholar]
- [41].Yiu BYS and Yu ACH, “Least-squares multi-angle Doppler estimators for plane wave vector flow imaging.” IEEE Trans Ultrason Ferroelectr Freq Control, vol. 63, no. 11, pp. 1733–1744, 2016. [Online]. Available: 10.1109/TUFFC.2016.2582514 [DOI] [PubMed] [Google Scholar]
- [42].Digital S Signal Processing Committee of the IEEE Acoustics and S. P. Society, Eds., Programs for Digital Signal Processing. New York: IEEE Press, 1979. [Google Scholar]
- [43].Dunmire B, Beach KW, Labs K, Plett M, and Strandness D, Jr, “Cross-beam vector Doppler ultrasound for angle-independent velocity measurements.” Ultrasound Med Biol, vol. 26, no. 8, pp. 1213–1235, October 2000. [DOI] [PubMed] [Google Scholar]
- [44].Kasai C, Namekawa K, Koyano A, and Omoto R, “Real-time two-dimensional blood flow imaging using an autocorrelation technique,” IEEE Trans. Sonics Ultrason, vol. 32, no. 3, pp. 458–464, May 1985. [Google Scholar]
- [45].Yiu BYS, Lai SSM, and Yu ACH, “Vector projectile imaging: time-resolved dynamic visualization of complex flow patterns.” Ultrasound Med Biol, vol. 40, no. 9, pp. 2295–2309, September 2014. [Online]. Available: 10.1016/j.ultrasmedbio.2014.03.014 [DOI] [PubMed] [Google Scholar]
- [46].Ketterling JA, Aristizábal O, Yiu BYS, Turnbull DH, Phoon CKL, Yu ACH, and Silverman RH, “High-speed, high-frequency ultrasound, in utero vector-flow imaging of mouse embryos.” Sci Rep, vol. 7, p. 16658, November. 2017. [DOI] [PMC free article] [PubMed] [Google Scholar]
- [47].Chen EJ, Jenkins WK, and O’Brien WD, “The impact of various imaging parameters on ultrasonic displacement and velocity estimates,” IEEE Trans. Ultrason., Ferroelectr., Freq. Control, vol. 41, no. 3, pp. 293–301, 1994. [Google Scholar]
- [48].Carerj S, Micari A, Trono A, Giordano G, Cerrito M, Zito C, Luzza F, Coglitore S, Arrigo F, and Oreto G, “Anatomical M-mode: An old–new technique,” Echocardiography, vol. 20, no. 4, pp. 357–361, 2003. [Online]. Available: https://onlinelibrary.wiley.com/doi/abs/10.1046/j.1540-8175.2003.03041.x [DOI] [PubMed] [Google Scholar]
- [49].Claus P, Omar AMS, Pedrizzetti G, Sengupta PP, and Nagel E, “Tissue tracking technology for assessing cardiac mechanics: Principles, normal values, and clinical applications.” JACC Cardiovasc. Imaging, vol. 8, pp. 1444–1460, December. 2015. [DOI] [PubMed] [Google Scholar]
- [50].Faludi R, Szulik M, D’hooge J, Herijgers P, Rademakers F, Pedrizzetti G, and Voigt J-U, “Left ventricular flow patterns in healthy subjects and patients with prosthetic mitral valves: an in vivo study using echocardiographic particle image velocimetry.” J. Thorac. Cardiovasc. Surg, vol. 139, pp. 1501–1510, June. 2010. [DOI] [PubMed] [Google Scholar]
- [51].Luff J, Drouillard T, Rompage A, Linne MA, and Hertzberg J, “Experimental uncertainties associated with particle image velocimetry (PIV) based vorticity algorithms,” Exp. Fluids, vol. 26, no. 1–2, pp. 36–54, 1999. [Google Scholar]
- [52].Morris PD, Narracott A, von Tengg-Kobligk H, Silva Soto DA, Hsiao S, Lungu A, Evans P, Bressloff NW, Lawford PV, Hose DR, and Gunn JP, “Computational fluid dynamics modelling in cardiovascular medicine.” Heart, vol. 102, pp. 18–28, January. 2016. [DOI] [PMC free article] [PubMed] [Google Scholar]
- [53].Wong KKL, Wang D, Ko JKL, Mazumdar J, Le T-T, and Ghista D, “Computational medical imaging and hemodynamics framework for functional analysis and assessment of cardiovascular structures.” Biomedical Engineering Online, vol. 16, p. 35, March. 2017. [DOI] [PMC free article] [PubMed] [Google Scholar]
- [54].Posada D, Porée J, Pellissier A, Chayer B, Tournoux F, Cloutier G, and Garcia D, “Staggered multiple-PRF ultrafast color Doppler,” IEEE Trans. Med. Imag, vol. 35, no. 6, pp. 1510–1521, 2016. [DOI] [PubMed] [Google Scholar]
- [55].Podkowa AS, Oelze MA, and Ketterling JA, “High frame rate Doppler ultrasound using a repeated transmit sequence,” Appl. Sci, vol. 8, no. 2, p. 227, 2018. [DOI] [PMC free article] [PubMed] [Google Scholar]
- [56].Muth S, Dort S, Sebag IA, Blais M-J, and Garcia D, “Unsupervised dealiasing and denoising of color-Doppler data,” Med Image Anal, vol. 15, pp. 577–588, August. 2011. [DOI] [PubMed] [Google Scholar]
- [57].Lai X, Torp H, and Kristoffersen K, “An extended autocorrelation method for estimation of blood velocity,” IEEE Trans. Ultrason., Ferroelectr., Freq. Control, vol. 44, no. 6, pp. 1332–1342, November 1997. [Google Scholar]
- [58].Bohs LN, Geiman BJ, Anderson ME, Breit SM, and Trahey GE, “Ensemble tracking for 2D vector velocity measurement: Experimental and initial clinical results,” IEEE Trans. Ultrason. Ferroelect. Freq. Contr, vol. 45, no. 4, pp. 912–924, July. 1998. [DOI] [PubMed] [Google Scholar]
- [59].Foster FS, Hossack J, and Adamson SL, “Micro-ultrasound for preclinical imaging.” Interface Focus, vol. 1, no. 4, pp. 576–601, August 2011. [Online]. Available: 10.1098/rsfs.2011.0037 [DOI] [PMC free article] [PubMed] [Google Scholar]
Associated Data
This section collects any data citations, data availability statements, or supplementary materials included in this article.


