

Abstract
Background
Mass incarceration has collateral consequences for community health, which are reflected in county-level health indicators, including county mortality rates. County jail incarceration rates are associated with all-cause mortality rates in the USA. We assessed the causes of death that drive the relationship between county-level jail incarceration and mortality.
Methods
In this retrospective, longitudinal study, we assessed the association between county-level jail incarceration rates and county-level cause-specific mortality using county jail incarceration data (1987–2017) for 1094 counties in the USA obtained from the Vera Institute of Justice and cause-specific mortality data for individuals younger than 75 years in the total county population (1988–2018) obtained from the US National Vital Statistics System. We fitted quasi-Poisson models for nine common causes of death (cerebrovascular disease, chronic lower respiratory disease, diabetes, heart disease, infectious disease, malignant neoplasm, substance use, suicide, and unintentional injury) with county fixed effects, controlling for all unmeasured stable county characteristics and measured time-varying confounders (county median age, county poverty rate, county percentage of Black residents, county crime rate, county unemployment rate, and state incarceration rate). We lagged county jail incarceration rates by 1 year to assess the short-term, by 5 years to assess the medium-term, and by 10 years to assess the long-term associations of jail incarceration with premature mortality.
Findings
A 1 per 1000 within-county increase in jail incarceration rate was associated with a 6·5% increase in mortality from infectious diseases (risk ratio 1·065, 95% CI 1·061–1·070), a 4·9% increase in mortality from chronic lower respiratory disease (1·049, 1·045–1·052), a 2·6% increase in mortality induced from substance use (1·026, 1·020–1·032), a 2·5% increase in suicide mortality (1·025, 1·020–1·029), and smaller increases in mortality from heart disease (1·021, 1·019–1·023), unintentional injury (1·015, 1·011–1·018), malignant neoplasm (1·014, 1·013–1·016), diabetes (1·013, 1·009–1·018), and cerebrovascular disease (1·010, 1·007–1·013) after 1 year. Associations between jail incarceration and cause-specific mortality rates weakened as time lags increased, but to a greater extent for causes of death with generally shorter latency periods (infectious disease and suicide) than for those with generally longer latency periods (heart disease, malignant neoplasm, and cerebrovascular disease).
Interpretation
Jail incarceration rates are potential drivers of many causes of death in US counties. Jail incarceration can be harmful not only to the health of individuals who are incarcerated, but also to public health more broadly. Our findings suggest important points of intervention, including disinvestment from carceral systems and investment in social and public health services, such as community-based treatment of substance-use disorders.
Introduction
Mass incarceration is associated with widespread consequences for community health, some of which extend beyond people who are and have been incarcerated and their immediate networks. Residents of neighbourhoods with high rates of prison incarceration have a higher risk of major depressive disorder, generalised anxiety disorder, dyslipidaemia, and metabolic syndrome than do residents of neighbourhoods with low prison incarceration rates.1,2 Nosrati and colleagues3 found that a standard deviation increase in the rate of county jail admissions was associated with a 2% increase in county-level mortality from drug use disorder. We previously found that an increase from the first to the second quartile of within-county rates of jail incarceration was associated with a 3% increase in the all-cause mortality rate.4
Jail incarceration in the USA operates as an institutional product of structural racism that disproportionately affects Black Americans. Black people are nearly four times more likely to be incarcerated in local jails than white people.5 Moreover, the US criminal legal system disproportionately criminalises and punishes poor people.6 The health effects of community-level exposure to high rates of jail incarceration might contribute to and worsen existing racialised and class-based health disparities. For example, during the COVID-19 pandemic, jails exacerbated the spread of the virus in communities that were already at a disproportionately higher risk of infection.7
Increases in rates of county jail incarceration are associated with subsequent increases in county all-cause mortality rates.4 However, all-cause mortality is a heterogeneous outcome that includes deaths caused by chronic diseases, injuries, and infectious diseases. Identification of the specific causes of death that drive the observed association can help to elucidate potential mechanisms. Furthermore, if the relationship between the rates of county jail incarceration and county mortality is causal and not merely a shared consequence of concentrated and racialised disadvantage, we would expect jail incarceration rates to influence deaths from different causes to differing degrees and via differing mechanisms.
For example, jails contribute to the community spread of infectious disease, as shown most recently during the COVID-19 pandemic.7 Thus, increases in the rates of county jail incarceration are expected to lead to increased infectious disease mortality in the short term, whereas the short-term effects of the rates of jail incarceration on mortality from diseases with longer latency periods, such as heart disease or cancer, are less probable. Additionally, high rates of incarceration directly harm the psychosocial and material or economic wellbeing of communities.8 Thus, increases in the rates of county jail incarceration are likely to have pronounced effects on the number of deaths caused by diseases linked with psychosocial and economic resource deprivation, such as substance-induced deaths and suicide.9,10 Moreover, these causes of mortality and morbidity are expected to be of increasing importance as the psychosocial and economic effects of the COVID-19 pandemic persist.
Initial insights into the relationship between the rates of jail incarceration and county mortality focused on drug use disorders.3 Furthermore, earlier studies estimated the short-term effects of jail incarceration by analysing panel data cross-sectionally or with a 1-year lag.3,4
In this study, we build on the existing evidence by identifying which specific causes of death drive the association observed in earlier research; and using different time lags to differentiate short-term (1-year lag), medium-term (5-year lag), and long-term (10-year lag) effects. We focus on nine common causes of death: cerebrovascular disease, chronic lower respiratory disease, diabetes, heart disease, infectious disease, malignant neoplasm, substance use, suicide, and unintentional injury. We hypothesise that there will be pronounced short-term associations observed between the rates of jail incarceration and death caused by infectious disease, substance use, and suicide given the links among mass incarceration, infectious disease, and socioeconomic deprivation. We further hypothesise that, although these associations will weaken as the time lags increase, associations with deaths caused by diseases with generally longer latency periods (eg, heart disease) will strengthen as the lag increases. Finally, we integrated the available theoretical and empirical evidence to propose plausible mechanisms that explain the observed relationships to guide future research.
Methods
Study design and data sources
We did a retrospective, longitudinal analysis of county-level jail incarceration rates and subsequent cause-specific mortality rates in the USA using public data. We obtained county jail data (1987–2017) from the Vera Institute of Justice Incarceration Trends Dataset, described in detail elsewhere.11 In brief, the Vera Institute of Justice linked county-level data from the Bureau of Justice Statistics Census of Jails, Deaths in Custody Reporting Program, and Annual Survey of Jails, and used linear interpolation for county-years with missing data.11 We obtained county mortality data from the National Vital Statistics System from the Centers for Disease Control and Prevention (CDC) Underlying Cause of Death database.12
We considered several time-varying confounders, including county-level sociodemographic measures and state-level measures of incarceration and political party control. County demographic data, including the total population, median age, and Black resident population, came from the Census Bureau’s Intercensal Estimates. We obtained county poverty data from the Census Bureau’s Small Area Income and Poverty Estimates system, county unemployment data from the Bureau of Labor Statistics, county crime data from the Federal Bureau of Investigation Uniform Crime Reporting programme, state incarceration data from the Bureau of Justice Statistics National Prisoner Statistics Program, and party control of state legislature data from the National Conference of State Legislatures. Confounder data were obtained for 1986–2016. Any county-years with missing data were replaced with the corresponding county’s data from the preceding year. Poverty and unemployment data were missing for early years (1986–88 for poverty, and 1986–89 for unemployment); for these years we carried subsequent poverty and unemployment observations backwards for each county.
Exposures and outcomes
The exposure of interest was the county jail incarceration rate (1987–2017, to maximise the data availability for all variables), calculated by dividing the average daily county jail population by the total county population. The average daily population is the most stable measure of jail populations. If the average daily population was unavailable for a given county-year, the daily confined population at midyear (roughly the last weekday in June) was used.11
The outcomes of interest were the rates of cause-specific county mortality for all county residents younger than 75 years for 1988–2018. This age restriction was informed by earlier research reporting a weak association between county jail incarceration and county mortality for individuals aged 75 years or older.4 We modelled nine common causes of death with the use of International Classification of Diseases (ICD)-10 codes for 1999–2017 and ICD-9 codes for 1988–98 (appendix p 1). We selected the seven most common causes of death for individuals younger than 75 years (cerebrovascular disease, chronic lower respiratory disease, diabetes, heart disease, malignant neoplasm, suicide, and unintentional injury)12 and two additional categories of a priori interest (infectious disease deaths and substance-induced deaths).
The CDC suppresses mortality counts lower than 10, resulting in missing data for counties with low numbers of deaths from particular causes. We included all counties with at least 2 years of complete data for all nine causes of death (appendix p 2).
We identified and adjusted for potential time-varying factors that might confound the relationship between jail incarceration and mortality, because the fixed-effects modelling approach controls for all unobserved stable differences between counties and any nationwide trends over the study period, but not time-varying county differences. These potential time-varying confounders were: county median age, county poverty rate, county percentage of Black residents, county crime rate, county unemployment rate, state incarceration rate, and political party control of state legislature. Theoretical and empirical justifications for each of these potential confounders because of their hypothesised relationships with jail incarceration and mortality are described in depth elsewhere.4
Statistical analysis
We first described jail incarceration rates and unadjusted cause-specific mortality rates for people younger than 75 years over time for our sample of 1094 counties. We then modelled the nine cause-specific mortality rates using quasi-Poisson regression models with county fixed effects, controlling for year; the within-county change was the unit of analysis. Quasi-Poisson models were used to account for overdispersed count data. We used a fixed-effects approach to control for potential confounding caused by any unobserved stable differences between counties. As a result, each county is compared only to itself over time. These models allowed us to assess whether a change in the county’s jail incarceration rate was associated with a subsequent change in the county’s mortality rate.
We used time lags for our exposure and confounders to ensure the correct temporal ordering with the outcome. We lagged all potential time-varying confounder data such that these data preceded the county jail incarceration rate data by 1 year. Additionally, we used 1-year jail incarceration lags to assess short-term associations, 5-year lags to assess medium-term associations, and 10-year lags to assess long-term associations. We modelled jail incarceration rates continuously, estimating the change in mortality rate associated with a 1 per 1000 increase in the jail incarceration rate. We did all analyses using R (version 4.0).
We did three sensitivity analyses. The first assessed the potential bias due to suppressed mortality counts. We replaced all the cause-specific mortality counts that were suppressed for the 1094 counties with 0 and then with 9 (the extremes of the range of possible values) and repeated the analyses described above. With this approach, we aimed to estimate the bounds for the magnitude of potential bias resulting from the suppressed mortality counts for the rarer causes of death. The second sensitivity analysis made use of a random intercepts approach to establish whether our findings were robust to the different assumptions required for estimating between-county rather than within-county associations. We used the methods described for the main analysis but fit a multilevel model with random intercepts for each county rather than a fixed-effects model. The third sensitivity analysis assessed the role of sample size differences between the models with differing lags. We restricted the 1-year and 5-year lagged models such that the jail incarceration data were from 1987 to 2008, rather than using all available data, so that the exposure period was the same across all models.
Role of the funding source
The funder of the study had no role in the study design, data collection, data analysis, data interpretation, or writing of the report.
Results
1094 counties (36% of all US counties) had at least 2 years of complete data for all nine causes of death, representing 33 882 county-years over the 31-year study period. Substance-induced mortality had the highest amount of data suppression, which resulted in our sample being skewed towards larger, non-rural counties. Aside from size and urbanicity, the included counties had higher average crime rates than did excluded counties. Excluded and included counties were similar with respect to other sociodemographic variables and the jail incarceration rate (data not shown).
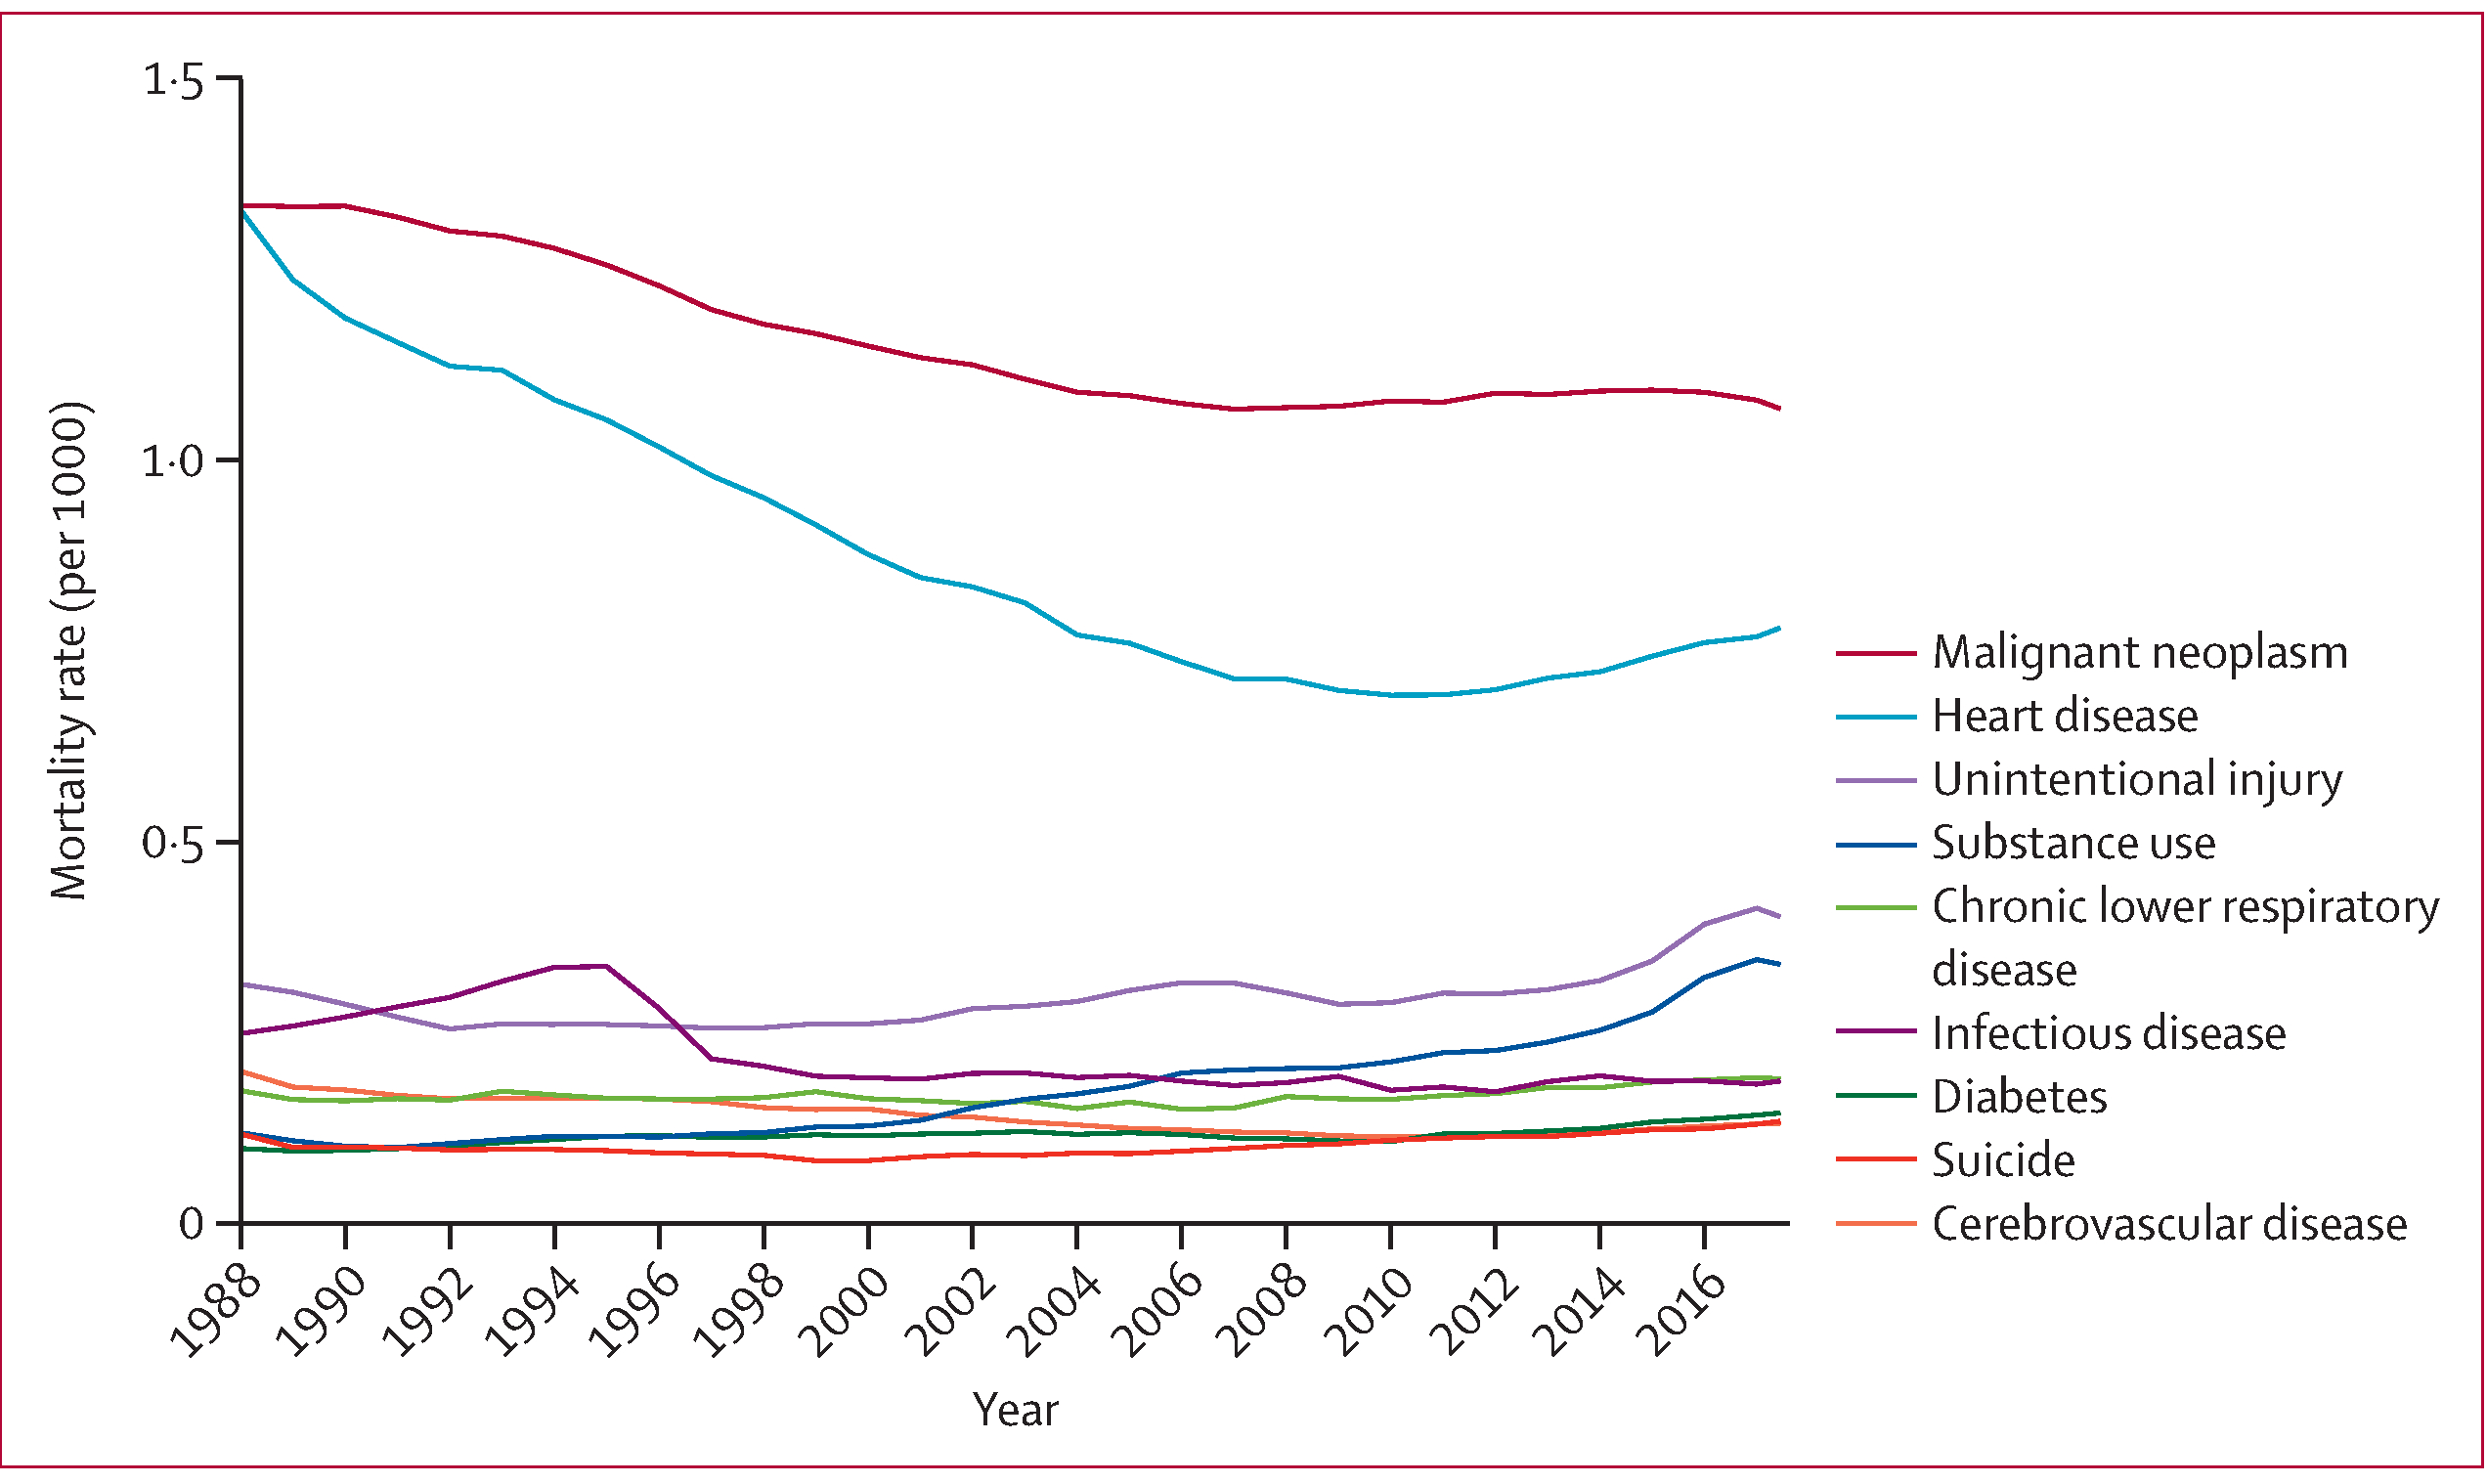
Overall, jail incarceration rates for the sample increased over the study period. The median within-county change in jail incarceration rate was 1·9 per 1000, with 81 counties experiencing an increase of 5·0 per 1000 or more over the study period (figure 1). Across all 33 882 county-years, the median all-cause mortality rate for people younger than 75 years was 4·4 per 1000 (3·6–5·3; table 1). Malignant neoplasm and heart disease had the highest cause-specific mortality rates throughout the study period, whereas the cause-specific mortality rates for cerebrovascular disease, suicide, and diabetes were among the lowest (figure 2).
Figure 1: County jail incarceration rates and distribution of maximum change in incarceration rate in the USA, 1987–2017.
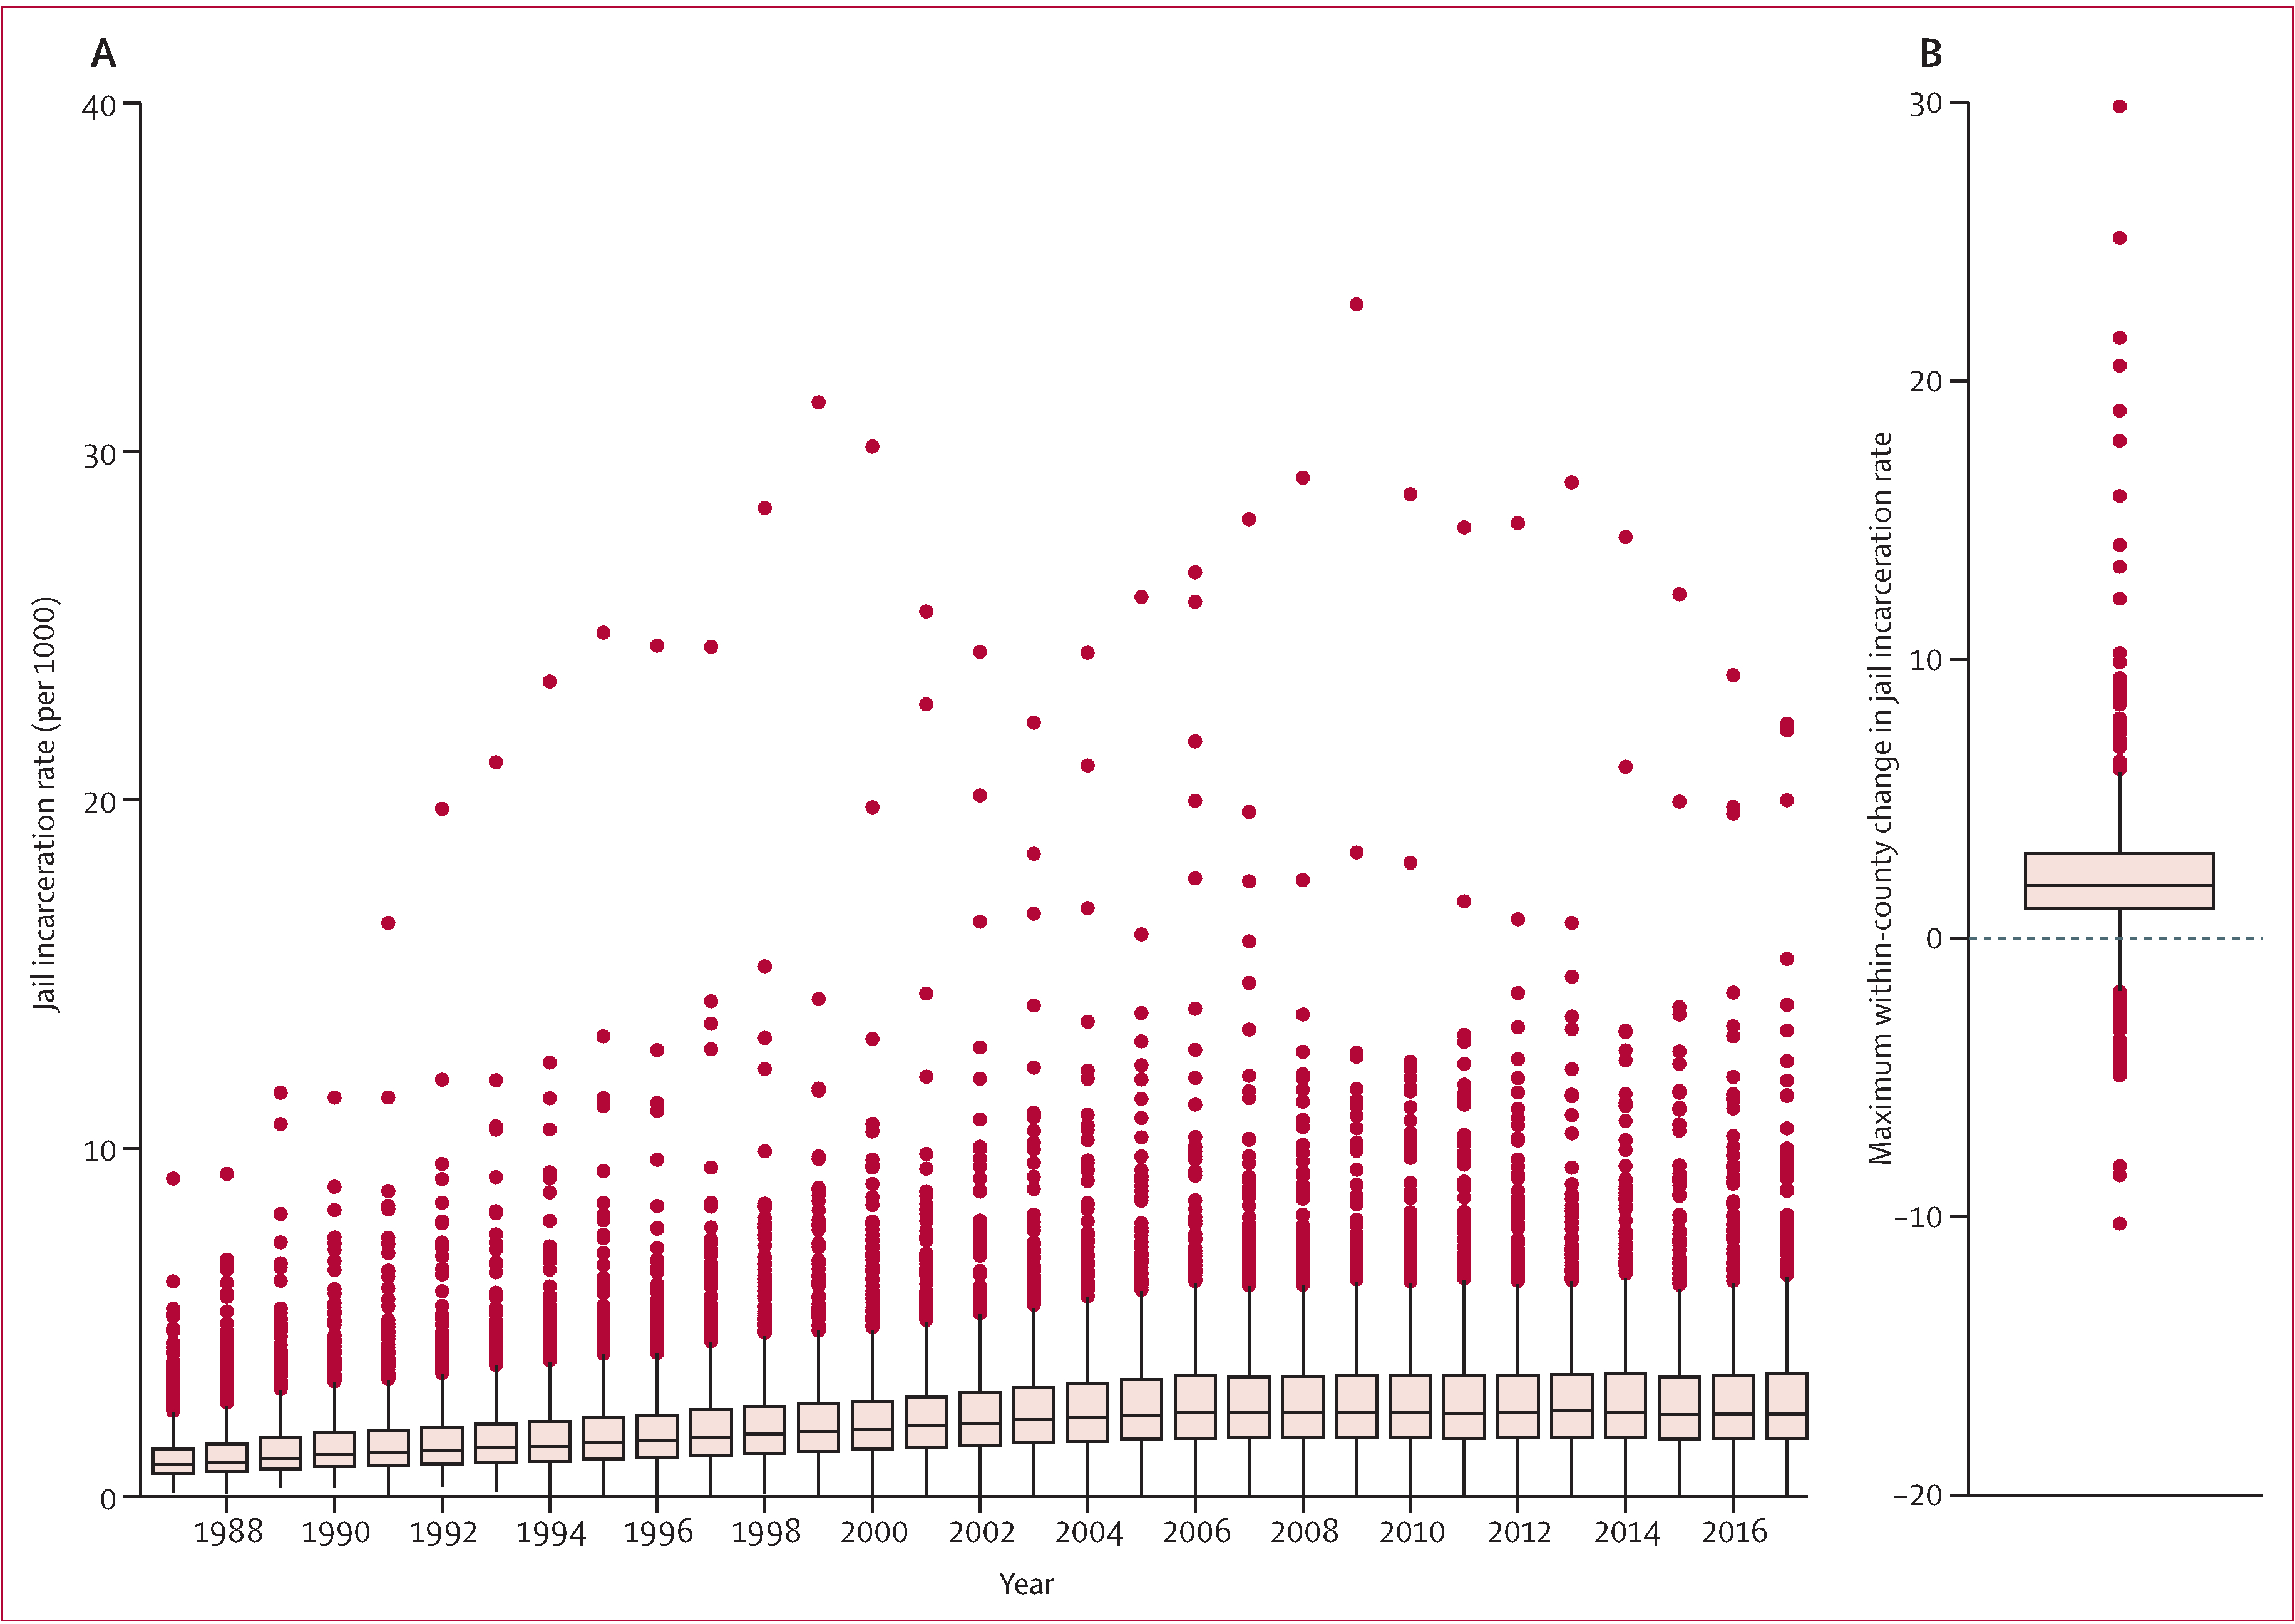
(A) Annual distribution of county jail incarceration rate (per 1000 people in the population) for the 1094 counties in the final analysis. (B) Distribution of each county’s maximum change in jail incarceration rate (positive if the change represents an increase over time and negative if the change represents a decrease over time). The line represents the median and the box represents the IQR.
Table 1:
Sociodemographic characteristics of 33 882 US county-years, 1987–2017
| Total (33 882 county-years) | First quartile* (8471 county-years) | Second quartile† (8470 county-years) | Third quartile‡ (8470 county-years) | Fourth quartile§ (8471 county-years) | |
|---|---|---|---|---|---|
| All-cause mortality rate for people <75 years (per 1000) | 4·4 (3·6–5·3) | 4·2 (3·3–5·0) | 4·3 (3·5–5·1) | 4·4 (3·6–5·3) | 4·9 (4·1–5·8) |
| Total county population (in 1000s) | 92·2 (54·8–199·7) | 83·5 (51·5–165·7) | 99·1 (58·2–223·7) | 102·8 (57·4–244·3) | 85·7 (52·6–181·0) |
| Percentage of population in poverty | 13·3% (9·9–17·0) | 10·9% (7·9–14·3) | 12·4% (9·4–15·5) | 13·9% (10·8–17·3) | 16·2% (12·8–19·8) |
| Total crime rate (per 1000) | 31·7 (21·3–45·2) | 24·9 (15·3–36·1) | 30·3 (20·7–43·3) | 33·8 (23·5–47·6) | 37·8 (27·3–52·4) |
| Percentage Black residents in county | 5·1% (1·6–14·0) | 2·5% (0·8–7·1) | 4·0% (1·4–11·1) | 6·0% (1·9–14·6) | 10·7% (3·6–25·7) |
| Percentage of population unemployed | 5·7% (4·4–7·5) | 5·5% (4·2–7·1) | 5·6% (4·3–7·2) | 5·9% (4·5–7·7) | 6·0% (4·7–7·9) |
| State incarceration rate (per 1000) | 3·5 (2·6–4·3) | 2·8 (1·9–3·6) | 3·5 (2·6–4·2) | 3·8 (3·0–4·6) | 4·0 (3·0–4·8) |
Data are median (IQR). 1094 unique counties were included in this analysis.
First quartile: jail incarceration rate 0·01–1·23 per 1000 (percentiles: 0·72 [25th], 0·91 [50th], and 1·07 [75th]).
Second quartile: jail incarceration rate 1·24–1·91 per 1000 (percentiles: 1·39 [25th], 1·56 [50th], and 1·73 [75th]).
Third quartile: jail incarceration rate 1·92–2·86 per 1000 (percentiles: 2·11 [25th], 2·32 [50th], and 2·56 [75th]).
Fourth quartile: jail incarceration rate 2·87–34·2 per 1000 (percentiles: 3·26 [25th], 3·87 [50th], and 4·85 [75th]).
Figure 2: Annual overall mortality rates for individuals younger than 75 years for nine causes of death for 1094 US counties (excluding suppressed counts), 1988–2018.
Models using a 1-year lag reflect the short-term relationships between the change in jail incarceration rates and county mortality. Changes in the county jail incarceration rate were most strongly associated with deaths caused by infectious disease, chronic lower respiratory disease, substance use, and suicide (table 2). A 1 per 1000 within-county increase in the jail incarceration rate was associated with a 6·5% increase in the infectious disease mortality, a 4·9% increase in chronic lower respiratory disease mortality, a 2·6% increase in substance-induced mortality, and a 2·5% increase in suicide mortality (in people younger than 75 years after 1 year; table 2). Increases in jail incarceration were also associated with modest increases in mortality rates caused by all other causes of death of interest in the year after the within-county increase in jail incarceration rate was measured (table 2).
Table 2:
Within-county associations between a 1 per 1000 change in county jail incarceration rate and change in county mortality rates for nine common causes of death with 1-year, 5-year, and 10-year lags, 1987–2017
| 1-year lag | 5-year lag | 10-year lag | % attenuation from 1-year to 10-year lag | |
|---|---|---|---|---|
| Infectious disease | 1·065 (1·061–1·070) | 1·038 (1·034–1·043) | 1·011 (1·007–1·015) | 5·1% |
| Chronic lower respiratory disease | 1·049 (1·045–1·052) | 1·041 (1·038–1·045) | 1·028 (1·024–1·032) | 2·0% |
| Substance use | 1·026 (1·020–1·032) | 1·020 (1·014–1·026) | 1·008 (1·002–1·014) | 1·8% |
| Suicide | 1·025 (1·020–1·029) | 1·008 (1·003–1·012) | 0·999 (0·995–1·004) | 2·5% |
| Heart disease | 1·021 (1·019–1·023) | 1·016 (1·014–1·018) | 1·012 (1·010–1·014) | 0·9% |
| Unintentional injury | 1·015 (1·011–1·018) | 1·012 (1·008–1·016) | 1·008 (1·004–1·012) | 0·7% |
| Malignant neoplasm | 1·014 (1·013–1·016) | 1·008 (1·007–1·010) | 1·004 (1·002–1·006) | 1·0% |
| Diabetes | 1·013 (1·009–1·018) | 1·001 (0·996–1·006) | 0·997 (0·992–1·002) | 1·6% |
| Cerebrovascular disease | 1·010 (1·007–1·013) | 1·007 (1·003–1·010) | 1·005 (1·001–1·009) | 0·5% |
Data are RR (95% CI) unless otherwise stated. All models included the jail incarceration rate, county and year fixed effects, and the county poverty rate, county crime rate, county Black resident population, county unemployment rate, state incarceration rate, and party control of state legislature lagged 1-year before the jail incarceration rate for 1094 unique counties. RR=risk ratio.
Associations between county jail incarceration and cause-specific mortality rates weakened for all causes of death as the lag increased from 1 year to 10 years. As hypothesised, the decrease in the magnitude of the association was particularly pronounced for causes of death with generally shorter latency periods, most notably for infectious diseases and suicide (table 2; figure 3). Associations with causes of death with generally longer latency periods such as heart disease, malignant neoplasm, and cerebrovascular disease also declined with increased lags, but the decline was less pronounced (table 2).
Figure 3: Model-predicted slopes for cause-specific mortality rates as a function of the within-county change in the rate of jail incarceration with 1-year, 5-year, and 10-year lags for death caused by chronic lower respiratory disease, substance use, suicide, and infectious disease.
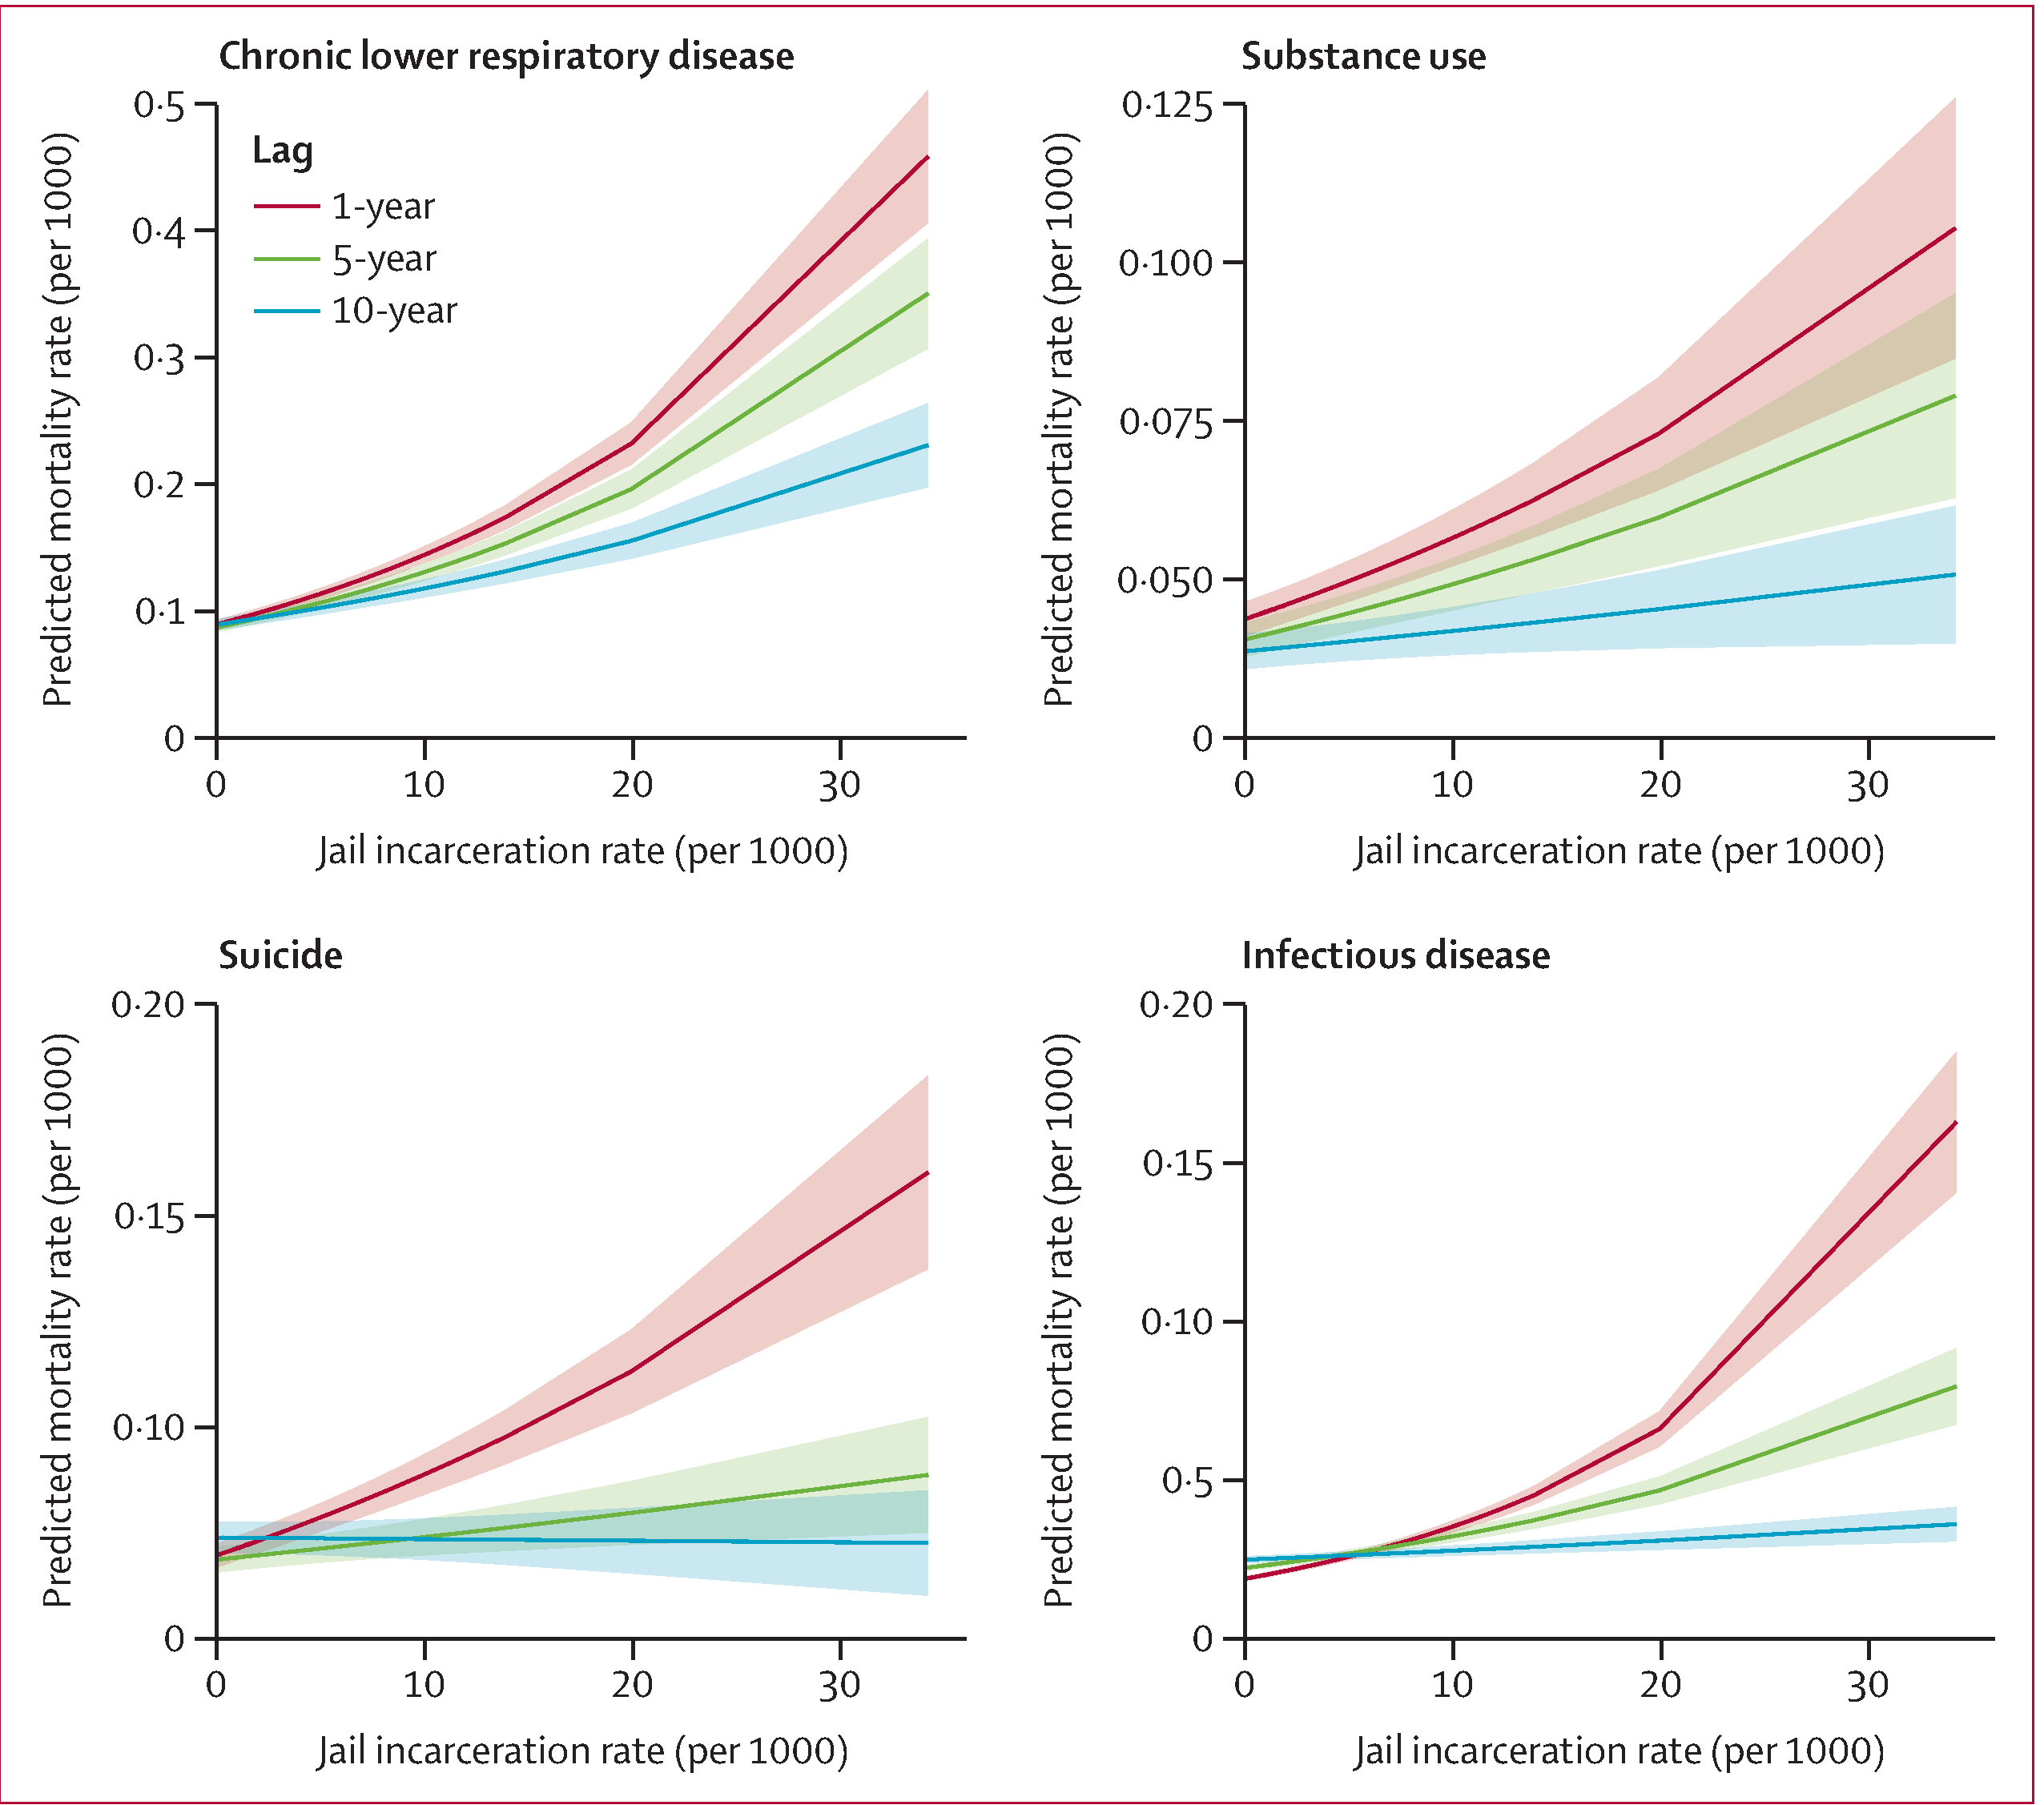
The four causes of death (chronic lower respiratory disease, substance use, suicide, and infectious disease) with strongest observed associations with incarceration rates were selected, and the 95% CIs are indicated by the shaded regions.
The sensitivity analyses in which suppressed mortality counts were replaced with 0 and 9 produced nearly equivalent results for most cause-specific mortality outcomes (appendix p 3). However, there was more variability in the estimates for the cause-specific mortality outcomes with more data suppression (ie, suicide, diabetes, and substance use). These bounds provide rough estimates of the potential bias due to suppressed data for these outcomes. For substance-induced deaths, the bounds are 1·3% and 7·3%. For suicide deaths, the bounds are 1·3% and 4·3%. The results from the multilevel model with county random intercepts were nearly equivalent to those obtained from the fixed effects approach (appendix p 3). Results from the final sensitivity analysis show no meaningful differences between the final results and those obtained from models restricted to the same exposure period (1987–2008; appendix p 4).
Discussion
We did a retrospective, longitudinal analysis stratified by the cause of death to elaborate on the previously documented relationship between county jail incarceration and all-cause mortality, with the use of lags of different lengths to explore short-term, medium-term, and long-term effects of different causes of death. In larger, predominantly non-rural counties, we found that a 1 per 1000 increase in the county jail incarceration rate was associated with increases in mortality caused by all causes of death of interest in the subsequent year, ranging from 1·0% to 6·5% increases.
Mortality due to infectious disease, chronic lower respiratory disease, substance use, and suicide were the strongest drivers of the short-term association between county jail incarceration and mortality. This finding supports our hypothesis that there would be strong observed associations for these causes of death because of the substantial epidemiological evidence linking mass incarceration with community infectious disease spread and acute psychosocial and economic resource deprivation. The strong association observed with deaths from chronic lower respiratory disease is also likely to reflect the direct mechanisms operating through incarceration conditions (eg, overcrowding and poor ventilation)13 and resource deprivation, given that risk factors for chronic lower respiratory disease include poor housing conditions, smoking, pollution, and frequent lower respiratory infections during childhood.14
We found that the associations between county jail incarceration and cause-specific mortality were consistent or decreased with increasing time lags. In particular, the associations for mortality due to infectious disease and suicide decreased appreciably. The associations with causes of death with a longer latency also decreased with increasing lags, contrary to our expectations. However, the decrease was less pronounced. Given that the peak of jail incarceration rates for these counties was in 2008, we might observe these longer-term associations more clearly in more current data.
In light of our findings and existing theoretical and empirical evidence, we propose potential mechanisms through which jail incarceration affects county mortality. The direct and indirect pathways that might underlie the observed associations between increased jail incarceration and increased county mortality are as follows: (1) the direct pathogenic effects of jail incarceration, (2) the racialised psychosocial pathway, and (3) the racialised material or economic pathway (figure 4). These hypothesised pathways are racialised because substantial empirical evidence shows that, at each point along these pathways, racist structures and institutions produce differential effects across different racialised groups.2,5,7 Racialised disparities are a central feature of the public health consequences of mass incarceration. Although we were unable to explore racialised health disparities in our analysis because of the unreliability of race-stratified outcome data, the conceptual model here provides a framework to inform subsequent research towards that end.
Figure 4: Conceptual diagram of hypothesised mechanistic theories to explain the observed association between increased jail incarceration rates and increased county mortality.
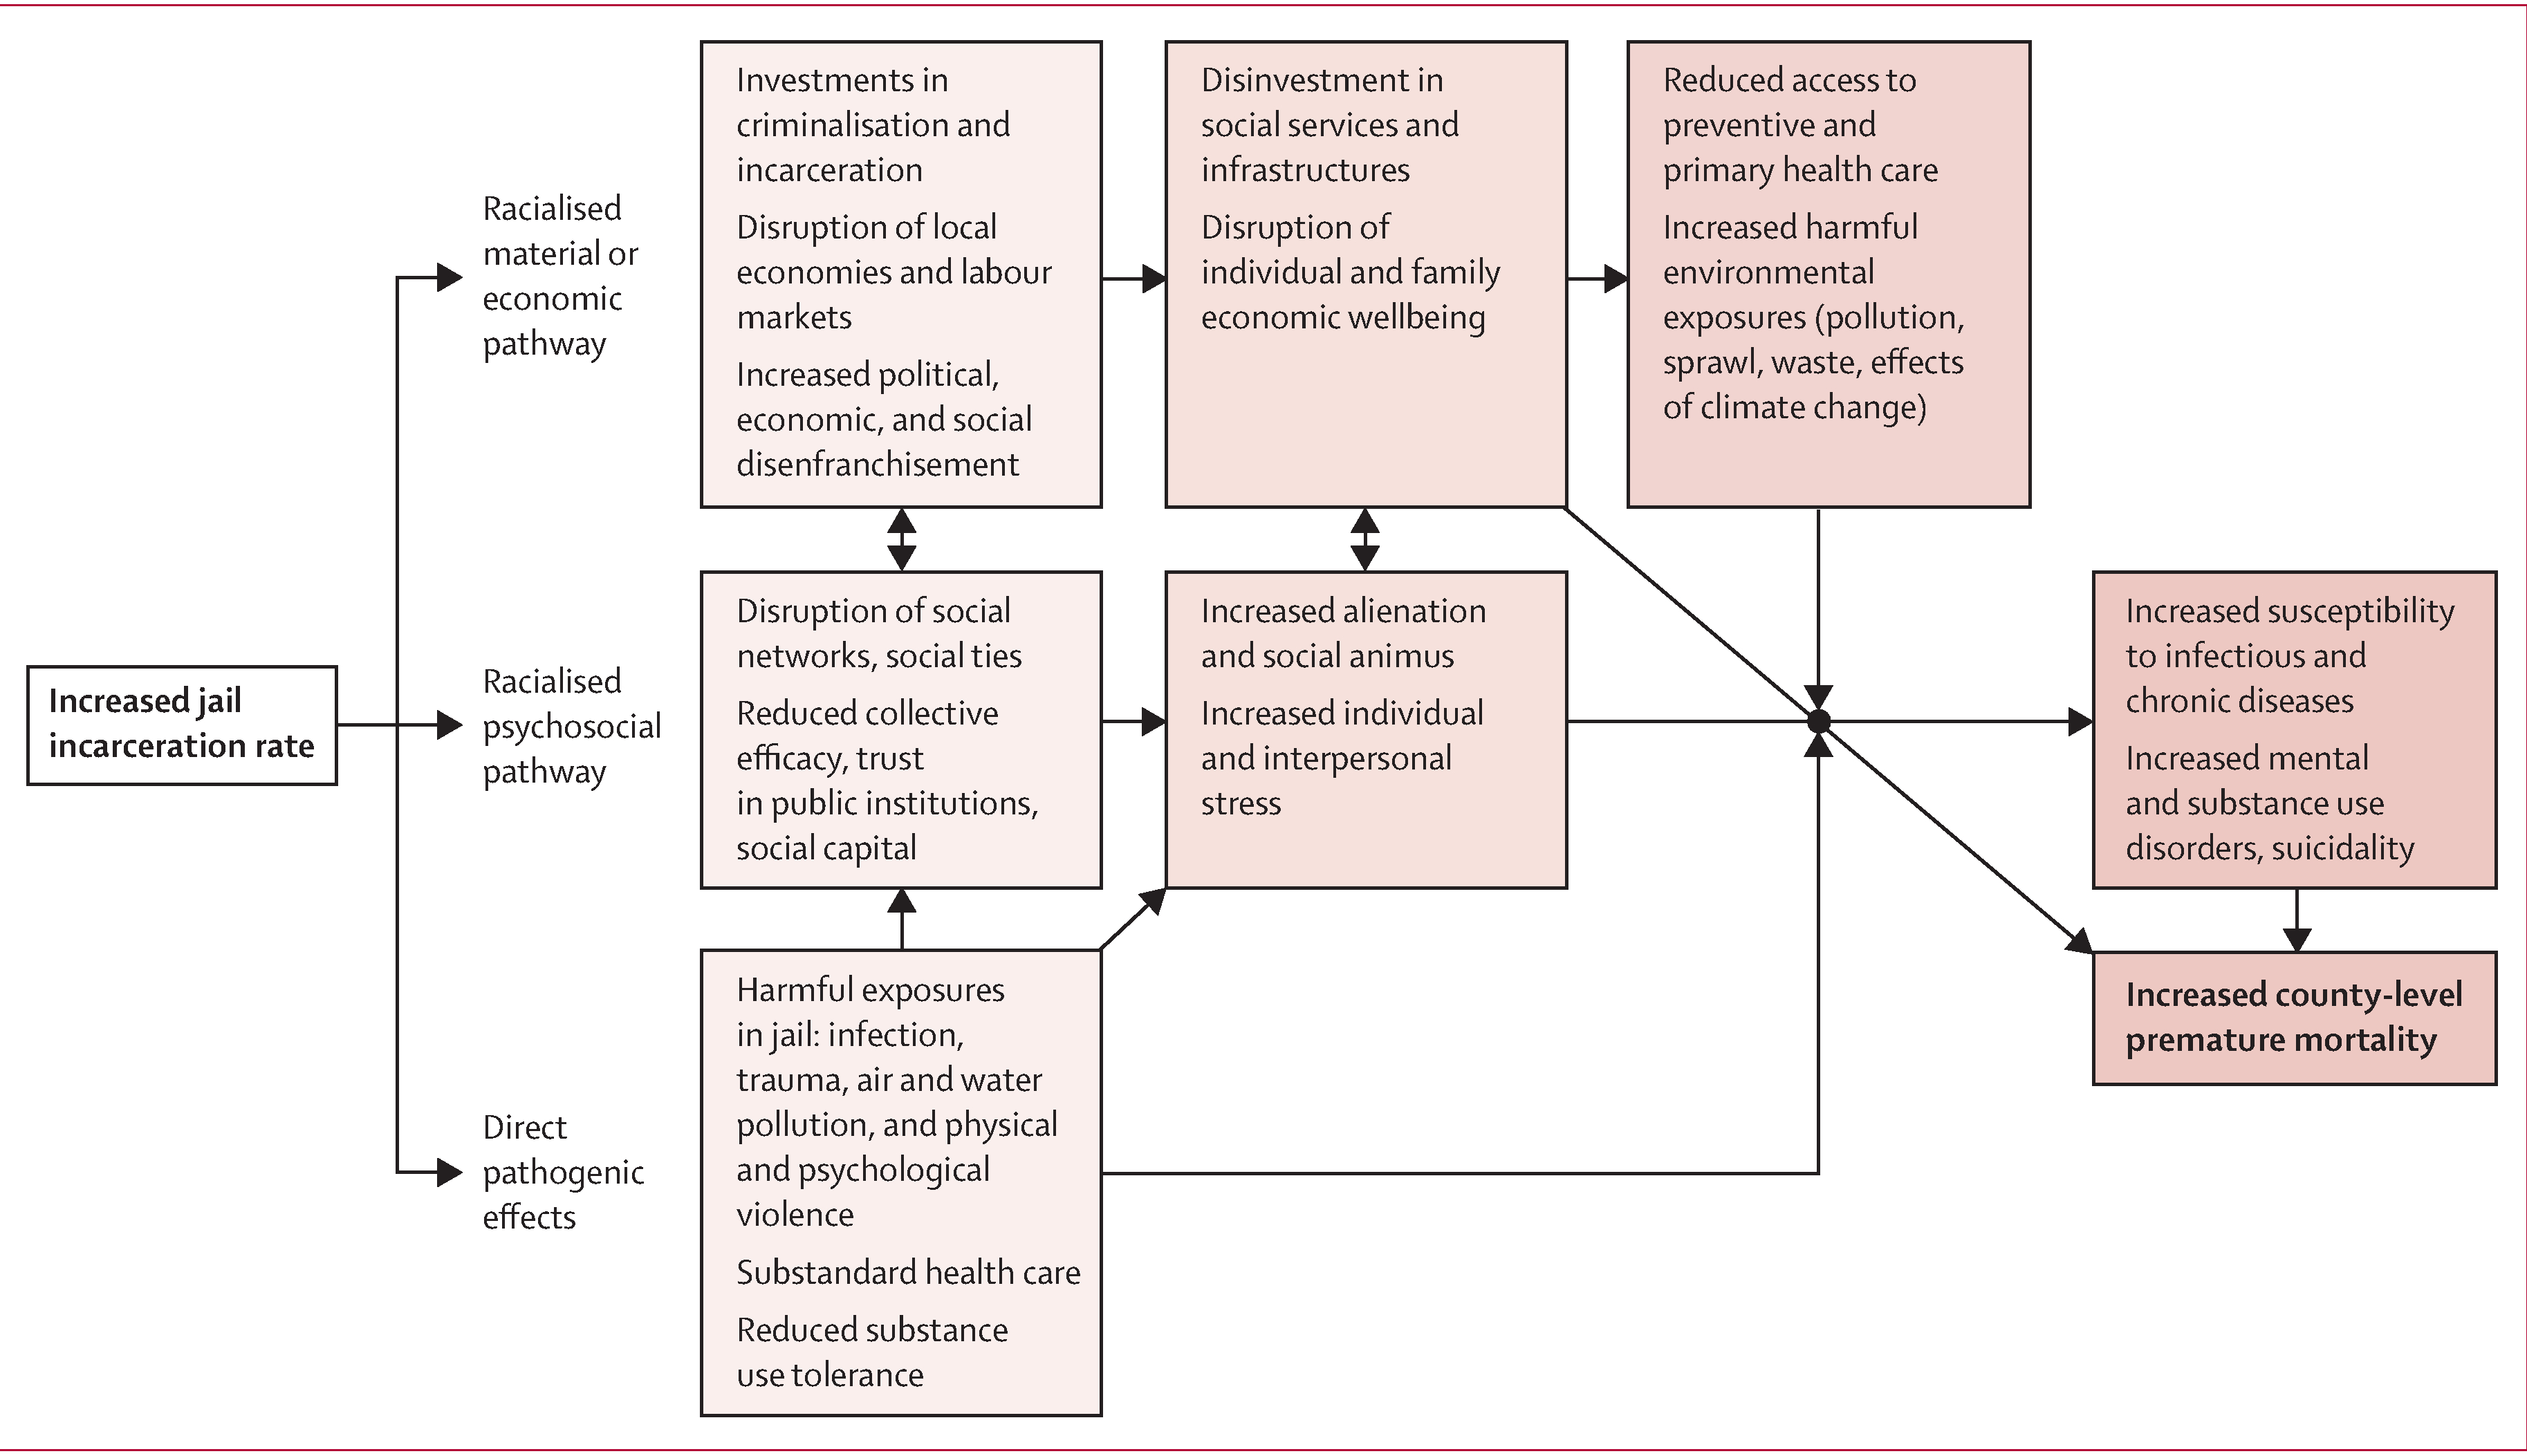
The three theories are: (1) the direct pathogenic effects of jail incarceration, (2) the racialised psychosocial pathway, and (3) the racialised material or economic pathway.
The first pathway is direct pathogenic effects of jail incarceration: people face harmful exposures during incarceration. Not only do jails have disproportionately high rates of infectious disease7 and expose people to contaminated water and air,13 but incarceration itself is also a traumatic and often violent experience.15 Despite having higher rates of infectious disease and co-occurring substance use and psychiatric disorders, prisoners have reduced access to testing and treatment and face substantial barriers to care.16 It is well documented that the criminalisation of people who use substances has contributed to an increased risk of an overdose death because of reduced substance-related tolerance during incarceration.17,18 As the rates of jail incarceration increase, the health of an increasing number of individuals is likely to be affected, which in turn might be reflected in a county’s overall mortality rate.
The second pathway is the racialised psychosocial pathway: this pathway describes the psychosocial public health consequences19 of community destruction. Psychosocial wellbeing reduces the risk of suicide and substance use, which we identified in this study as important drivers of the jail–mortality relationship.20,21 High community rates of jail incarceration disrupt social ties and support networks, which are protective for community health.8 Additionally, there are psychosocial harms for the family members of incarcerated people: divorce rates are higher among formerly incarcerated people, and the stress of separation for parents and children has long-lasting effects.22
The third pathway is the racialised material or economic pathway: susceptibility to death because of infectious disease, chronic lower respiratory disease, substance use, and suicide is also driven by economic resource deprivation.9,10,14 Increased jail incarceration rates lead to large-scale material investments in the criminal legal system, restricting the funding available for investment in social services, including those tied to public health.23 For example, in the USA, the majority of state funding for kindergarten to 12th grade education (children aged 5–18 years) and incarceration comes from the same discretionary fund.24 Over the past three decades in the USA, government spending on incarceration increased at three times the rate of spending on kindergarten to 12th grade education.25 Exposure to the criminal legal system also has clear disenfranchising and depoliticising effects, is a driver of job loss and wage inequality, and harms local economies because of the removal of working-age individuals from the labour force.26–28 As a result, standard labour force data underestimate US unemployment rates, particularly among Black men.29 These material or economic consequences are likely to shape county-level health and mortality, especially through the causes of death documented in our study.
Notably, all three pathways described here might produce feedback loops that in turn lead to increased rates of jail incarceration, given the ways in which the criminal legal system disproportionately criminalises poor and marginalised communities. The conceptual model we introduce here can guide future research—eg, by identifying potential mediational pathways for subsequent analysis, and by ensuring that research questions are situated within a theoretical context.
This study has several limitations. First, as with any observational study that uses fixed-effects models, there is a risk of unmeasured time-varying confounders. For example, some other measure of county economic wellbeing or crime could be a common cause of within-county changes in jail incarceration and cause-specific mortality. In our study, we mitigate this concern by including county and year fixed effects and several time-varying covariates to account for potential confounding. Second, administrative data sources were missing data for some county-years. In particular, the CDC suppresses death counts lower than 10, so there was more substantial missingness for rarer causes of death, such as substance-induced deaths. We estimated the bounds for the potential bias produced by the suppression of data and present these findings in the sensitivity analyses. Third, the use of mortality as our outcome of interest is an extreme outcome that only partly reflects the range of potential community health effects of jail incarceration. These findings complement existing research on the health consequences of community-level exposure to incarceration.1,2 Fourth, the validity of administrative data might vary by jurisdiction.30 Lastly, counties represent large, heterogeneous geographical areas and, as a result, our findings might not reflect more localised effects of jail incarceration. Individual-level inference cannot be made given the use of county-level data.
In conclusion, we find evidence that county-level exposure to increased jail incarceration rates is associated with harmful consequences for public health. Specifically, mortality caused by infectious disease, chronic lower respiratory disease, substance use, and suicide is the strongest driver of the association between jail incarceration and county mortality. These findings suggest that interventions to reduce incarceration might result in broader community mortality benefits. Moreover, responses to the current most pressing public health challenges, including the COVID-19 pandemic, overdose epidemic, and their physical and mental health sequelae, require a reckoning with the effects of carceral systems. Given the ongoing COVID-19 pandemic, these findings highlight the immediate need to account for jails as drivers of infectious disease spread in the community. In the longer term, the conceptual model we introduce can guide future research and intervention planning, including substance use disorder treatment, social service investments, and ultimately decarceration.
Supplementary Material
Research in context
Evidence before this study
There is a growing body of evidence concerning the public health consequences of mass incarceration. We searched PubMed, Google Scholar, and Web of Science from database inception up to Oct 31, 2020, with combinations of the search terms “jail”, “incarceration”, “mortality”, “collateral consequences”, “spillover effects”, “public health”, and “population health”. Two studies that used three decades of US data found that increases in county jail incarceration rates were associated with increases in county mortality rates. However, these studies analysed panel data cross-sectionally or with a 1-year lag, prioritising the short-term effects of jail incarceration. Existing theories and evidence suggest that jail incarceration rates also have long-lasting effects on communities. Furthermore, if these relationships are causal, we would expect jail incarceration rates to influence different causes of deaths to different degrees and by different mechanisms.
Added value of this study
We identified which specific causes of death drive the association between jail incarceration rates and mortality that was observed in earlier research, and assessed short-term, medium-term, and long-term effects of jail incarceration on community health. We found that county mortality rates caused by infectious disease, chronic lower respiratory disease, substance use, and suicide are most strongly associated with county jail incarceration rates. These results suggest causal inference about the relationship between jail incarceration and generalised premature mortality.
Implications of all the available evidence
We integrated the available theoretical and empirical data to propose plausible mechanisms that explain the observed relationships. The findings add to the substantial body of evidence suggesting that decarceration strategies would improve public health and identify additional points of intervention that could mitigate the harmful effects of community-level exposure to high jail incarceration rates, including substance use disorder treatment and investment in social services. Given the ongoing COVID-19 pandemic, policy makers should account for jails as potential drivers of infectious disease mortality in communities.
Acknowledgments
This study was supported in part by the National Institute on Drug Abuse of the US National Institutes of Health (awards K01 DA045955 and K01 DA045224). We thank Louise Lassen for her graphic design of the conceptual model.
Funding
US National Institute on Drug Abuse (National Institutes of Health).
Footnotes
Declaration of interests
KMK reports personal fees related to consultation with plaintiff representatives in ongoing opioid product litigation. All other authors declare no competing interests.
Data sharing
Data used in the present study are available in the Decarceration and Public Health Research Collaborative GitHub repository (https://github. com/DPHRC/JailIncarceration-CauseSpecificMortality). SK and SJP were responsible for accessing and verifying the data.
Contributor Information
Sandhya Kajeepeta, Department of Epidemiology, Columbia University Mailman School of Public Health, New York, NY, USA.
Pia M Mauro, Department of Epidemiology, Columbia University Mailman School of Public Health, New York, NY, USA.
Katherine M Keyes, Department of Epidemiology, Columbia University Mailman School of Public Health, New York, NY, USA.
Abdulrahman M El-Sayed, Department of Criminal Justice and Department of Public Health, Wayne State University, Detroit, MI, USA.
Caroline G Rutherford, Department of Epidemiology, Columbia University Mailman School of Public Health, New York, NY, USA.
Seth J Prins, Department of Epidemiology, Columbia University Mailman School of Public Health, New York, NY, USA.
References
- 1.Hatzenbuehler ML, Keyes K, Hamilton A, Uddin M, Galea S. The collateral damage of mass incarceration: risk of psychiatric morbidity among nonincarcerated residents of high-incarceration neighborhoods. Am J Public Health 2015; 105: 138–43. [DOI] [PMC free article] [PubMed] [Google Scholar]
- 2.Topel ML, Kelli HM, Lewis TT, et al. High neighborhood incarceration rate is associated with cardiometabolic disease in nonincarcerated black individuals. Ann Epidemiol 2018; 28: 489–92. [DOI] [PMC free article] [PubMed] [Google Scholar]
- 3.Nosrati E, Kang-Brown J, Ash M, McKee M, Marmot M, King LP. Economic decline, incarceration, and mortality from drug use disorders in the USA between 1983 and 2014: an observational analysis. Lancet Public Health 2019; 4: e326–33. [DOI] [PubMed] [Google Scholar]
- 4.Kajeepeta S, Rutherford CG, Keyes KM, El-Sayed AM, Prins SJ. County jail incarceration rates and county mortality rates in the United States, 1987–2016. Am J Public Health 2020; 110: S109–15. [DOI] [PMC free article] [PubMed] [Google Scholar]
- 5.Subramanian R, Riley K, Mai C. Divided justice: trends in black and white jail incarceration, 1990–2013. February, 2018. https://www.safetyandjusticechallenge.org/wp-content/uploads/2018/02/Divided-Justice-full-report.pdf (accessed Feb 10, 2021).
- 6.Wacquant L. Punishing the poor: the neoliberal government of social insecurity. Durham: Duke University Press, 2009. [Google Scholar]
- 7.Reinhart E, Chen DL. Incarceration and its disseminations: COVID-19 pandemic lessons from Chicago’s Cook County Jail. Health Aff(Millwood) 2020; 39: 1412–18. [DOI] [PubMed] [Google Scholar]
- 8.Morenoff JD, Harding DJ. Incarceration, prisoner reentry, and communities. Annu Rev Sociol 2014; 40: 411–29. [DOI] [PMC free article] [PubMed] [Google Scholar]
- 9.Monnat SM. Factors associated with county-level differences in U.S. drug-related mortality rates. Am J Prev Med 2018; 54: 611–19. [DOI] [PMC free article] [PubMed] [Google Scholar]
- 10.Kerr WC, Kaplan MS, Huguet N, Caetano R, Giesbrecht N, McFarland BH. Economic recession, alcohol, and suicide rates: comparative effects of poverty, foreclosure, and job loss. Am J Prev Med 2017; 52: 469–75. [DOI] [PMC free article] [PubMed] [Google Scholar]
- 11.Kang-Brown J. Incarceration trends: data and methods for historical jail populations in U.S. counties, 1970–2014. December, 2015. https://storage.googleapis.com/vera-web-assets/downloads/Publications/in-our-own-backyard-confronting-growth-and-disparities-in-american-jails/legacy_downloads/incarceration-trends-data-and-methods.pdf (accessed Feb 10, 2021).
- 12.Centers for Disease Control and Prevention, National Center for Injury Prevention and Control. WISQARS leading causes of death reports, 1981–2018. https://webappa.cdc.gov/sasweb/ncipc/leadcause.html (accessed Aug 12, 2020). [Google Scholar]
- 13.Bernd C, Loftus-Farren Z, Mitra MN. America’s toxic prisons: the environmental injustices of mass incarceration. Earth Island Journal, 2017. https://earthisland.org/journal/americas-toxicprisons/ (accessed Feb 10, 2021).
- 14.WHO. Global surveillance, prevention and control of chronic respiratory diseases. August 25, 2007. https://www.who.int/publications/i/item/global-surveillance-prevention-and-control-of-chronic-respiratory-diseases (accessed Feb 10, 2021).
- 15.DeVeaux M. The trauma of the incarceration experience. Harvard Civil Rights 2013; 48: 22. [Google Scholar]
- 16.Rich JD, Beckwith CG, Macmadu A, et al. Clinical care of incarcerated people with HIV, viral hepatitis, or tuberculosis. Lancet 2016; 388: 1103–14. [DOI] [PMC free article] [PubMed] [Google Scholar]
- 17.Lim S, Seligson AL, Parvez FM, et al. Risks of drug-related death, suicide, and homicide during the immediate post-release period among people released from New York City jails, 2001–2005. Am J Epidemiol 2012; 175: 519–26. [DOI] [PMC free article] [PubMed] [Google Scholar]
- 18.Binswanger IA, Blatchford PJ, Mueller SR, Stern MF. Mortality after prison release: opioid overdose and other causes of death, risk factors, and time trends from 1999 to 2009. Ann Intern Med 2013; 159: 592–600. [DOI] [PMC free article] [PubMed] [Google Scholar]
- 19.Martikainen P, Bartley M, Lahelma E. Psychosocial determinants of health in social epidemiology. Int J Epidemiol 2002; 31: 1091–93. [DOI] [PubMed] [Google Scholar]
- 20.Sinha R. Chronic stress, drug use, and vulnerability to addiction. Ann N Y Acad Sci 2008; 1141: 105–30. [DOI] [PMC free article] [PubMed] [Google Scholar]
- 21.Compton MT, Thompson NJ, Kaslow NJ. Social environment factors associated with suicide attempt among low-income African Americans: the protective role of family relationships and social support. Soc Psychiatry Psychiatr Epidemiol 2005; 40: 175–85. [DOI] [PubMed] [Google Scholar]
- 22.Arditti JA. A family stress-proximal process model for understanding the effects of parental incarceration on children and their families. Couple Family Psychol 2016; 5: 65–88. [Google Scholar]
- 23.Henrichson C, Rinaldi J, Delaney R. The price of jails: measuring the taxpayer cost of local incarceration. Vera Institute of Justice; May, 2015. https://www.vera.org/publications/the-price-of-jails-measuring-the-taxpayer-cost-of-local-incarceration (accessed Feb 10, 2021). [Google Scholar]
- 24.National Association of State Budget Officers. State expenditure report. https://www.nasbo.org/reports-data/state-expenditure-report (accessed Aug 10, 2020).
- 25.Stullich S, Morgan I, Schak O. State and local expenditures on corrections and education: a brief from the U.S. Department of Education. July, 2016. https://www2.ed.gov/rschstat/eval/other/expenditures-corrections-education/brief.pdf (accessed Feb 10, 2021). [Google Scholar]
- 26.Reich AD, Prins SJ. The disciplining effect of mass incarceration on labor organization. Am J Sociol 2020; 125: 1303–44. [DOI] [PMC free article] [PubMed] [Google Scholar]
- 27.Weaver VM, Lerman AE. Political consequences of the carceral state. Am Polit Sci Rev 2010; 104: 817–33. [Google Scholar]
- 28.Western B. The impact of incarceration on wage mobility and inequality. Am Sociol Rev 2002; 67: 526–46. [Google Scholar]
- 29.Western B, Pettit B. Incarceration and racial inequality in men’s employment. ILR Review 2016; 54: 3–16. [Google Scholar]
- 30.Gove WR, Hughes M, Geerken M. Are uniform crime reports a valid indicator of the index crimes? An affirmative answer with minor qualifications. Criminology 1985; 23: 451–501. [Google Scholar]
Associated Data
This section collects any data citations, data availability statements, or supplementary materials included in this article.