

Abstract
Mutation of C9ORF72 is the most prevalent defect in amyotrophic lateral sclerosis (ALS) and frontal temporal degeneration (FTD)1. Together with hexanucleotide repeat expansion2,3, haploinsufficiency of C9ORF72 contributes to neuronal dysfunction4–6. We determined the structure of the C9orf72-SMCR8-WDR41 complex by cryo-EM. C9orf72 and SMCR8 are both longin-DENN domain proteins7, while WDR41 is a beta-propeller protein that binds to SMCR8 such that the whole structure resembles an eye slip hook. Contacts between WDR41 and SMCR8DENN drive lysosomal localization in amino acid starvation. The structure suggested that C9orf72-SMCR8 was a small GTPase activating protein (GAP). We found that C9orf72-SMCR8-WDR41 is a GAP for Arf family small GTPases. These data rationalize the function of C9orf72 both in normal physiology and in ALS/FTD.
Expansion of hexanucleotide GGGGCC repeats in the first intron of C9ORF72 is the most prevalent genetic cause of amyotrophic lateral sclerosis (ALS) and frontal temporal degeneration (FTD) accounts for approximately 40 % of familial ALS, 5 % of sporadic ALS and 10–50 % of FTD1. Two hypotheses, not mutually exclusive, could explain how the mutation leads to progressive loss of neurons. The toxic gain of function hypothesis suggests that toxic molecules, including RNA and dipeptide repeat aggregates, disrupt neural function and lead to their destruction. The loss of function hypothesis is based on the observation of a reduction in C9orf72 mRNA and protein levels in patients. The endogenous function of C9orf72 is essential for microglia4 and for normal axonal actin dynamics in motor neurons5, and restoring normal C9orf72 protein expression rescues function in c9orf72 model neurons6.
C9orf72 is a longin and DENN (differentially expressed in normal and neoplastic cells) domain-containing protein7 (Fig. 1a). C9orf72 exists as a stable complex with another longin and DENN protein, Smith-Magenis syndrome chromosome region, candidate 8 (SMCR8), and the WD repeat protein 41 (WDR41)8–13 (Fig. 1a). WDR41 targets C9orf72-SMCR8 to lysosomes14 via an interaction with the transporter PQ loop repeat-containing 2 (PQLC2)15. Various proposed functions of C9orf72-SMCR8 include the regulation of Rab-positive endosomes16, regulation of RAB8A and RAB39B in membrane transport8,12, regulation of the ULK1 complex in autophagy9,12,13,17, and regulation of mTORC1 at lysosomes10,11,18. Thus far it has been difficult to deconvolute which of these roles are direct vs. indirect. In order to gain more insight, we reconstituted and purified the complex, determined its structure, and assessed its function as a purified complex.
Fig. 1: Cryo-EM structure of the C9orf72-SMCR8-WDR41 complex.
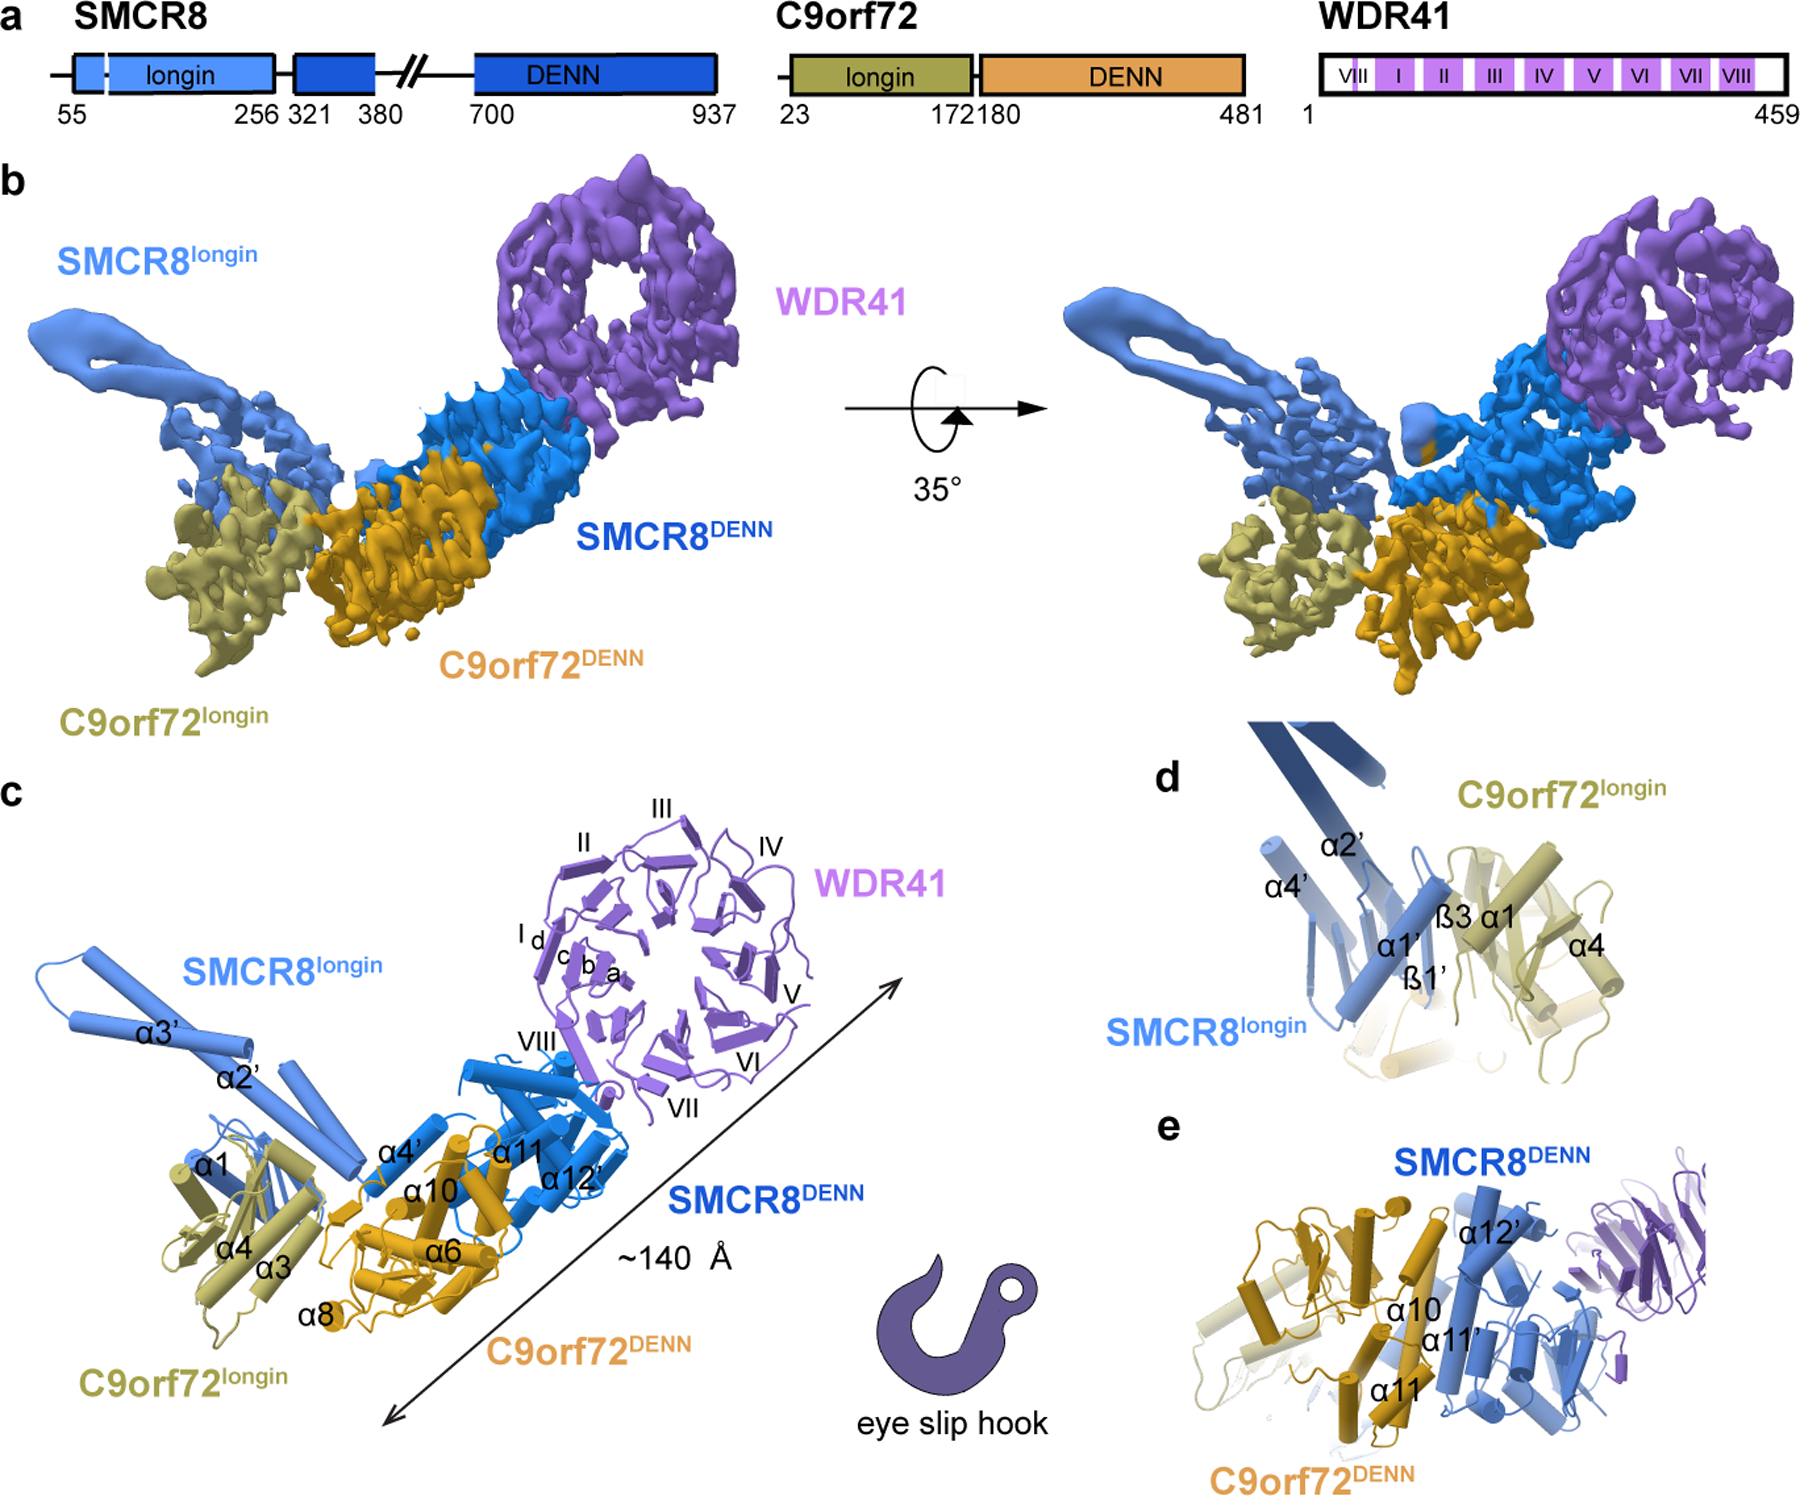
a, Schematic diagram of the domain structure of C9orf72-SMCR8-WDR41 complex. b, Cryo-EM density map (localfilter map, b-factor −50 Å2) and c, the refined coordinates of the complex shown as pipes and planks for α-helices and β-sheets, respectively. The domains color-coded as follows: SMCR8longin, cornflower blue; SMCR8DENN, dodger blue; C9orf72longin, olive; C9orf72DENN, goldenrod; WDR41, medium purple. Organizations of d, SMCR8longin: C9orf72longin and e, SMCR8DENN: C9orf72DENN arrangement.
Full length human C9orf72-SMCR8 and C9orf72-SMCR8-WDR41 were expressed and purified (Extended Data Fig. 1a–c). The structure of C9orf72-SMCR8-WDR41 was determined at a resolution of 3.8 Å by cryo-electron microscopy (cryo-EM) (Fig. 1b–c, Extended Data Fig. 2–3, Table 1). We were able to visualize the ordered ~120 kDa portion of the complex, corresponding to about 60 % of the total mass of the complex. Portions of the density, notably in the C9orf72 and SMCR8 DENN domains, were very well resolved such that side-chain density was clear. Other regions, particularly the longin domains, and the portion of WDR41 most distal to SMCR8, were less resolved and not clear enough for side-chain placement. The structure has the shape of an eye slip hook with a long dimension of ~140 Å (Fig. 1c). The ring of the hook was straightforward to assign to WDR41 by its appearance as an eight-bladed β-propeller. The remainder of the density evidenced two longin domains at the tip of the hook, with the bulk of the hook made up of two DENN domains. The SMCR8DENN domain is in direct contact with WDR41, whilst C9orf72 has no direct contact with WDR41. The hook tip portion of the SMCR8longin domain was assigned to residues I165-A219, which were predicted to comprise a long helical extension unique to SMCR8longin. SMCR8longin and SMCR8DENN are near each other but not in direct contact, and are connected by a helical linker consisting of residues K320-V383. Both domains of C9orf72 are positioned between SMCR8longin and SMCR8DENN. This linear arrangement of domains gives the overall complex an elongated shape.
To map WDR41 interactions and facilitate interpretation of less well-resolved portions of the cryo-EM structure, C9orf72-SMCR8 and C9orf72-SMCR8-WDR41 complexes were subjected to hydrogen deuterium exchange mass spectrometry (HDX-MS) for 0.5, 5, 50, 500 and 50,000 sec and compared to each other (Fig. 2, Extended Data Fig. 1d–f, 4, 5, Supplementary Dataset 1). Excellent peptide coverage (89, 87 and 80 % for SMCR8, C9orf72 and WDR41, respectively) was achieved and consistent patterns were observed at all experimental time points. Several regions in SMCR8 including the N-terminal 54 residues, residues V104-V118, E212-I230, P257-F315, V378-I714 and V788-Y806 showed more than 50 % deuterium uptake at 0.5 sec, indicating these regions are intrinsically disordered regions (IDRs), consistent with sequence-based predictions. Nearly all of C9orf72 was protected from exchange, except for the N-terminal 21 residues and the C-terminus. For WDR41, the N-terminal 24 residues, and the loops connecting blade II-III (R128-C131), blade V-VI (R260-D270, L277-I284), internal loop of blade VII and the loop connecting to blade VIII (R352-L357, M369-E396) were flexible.
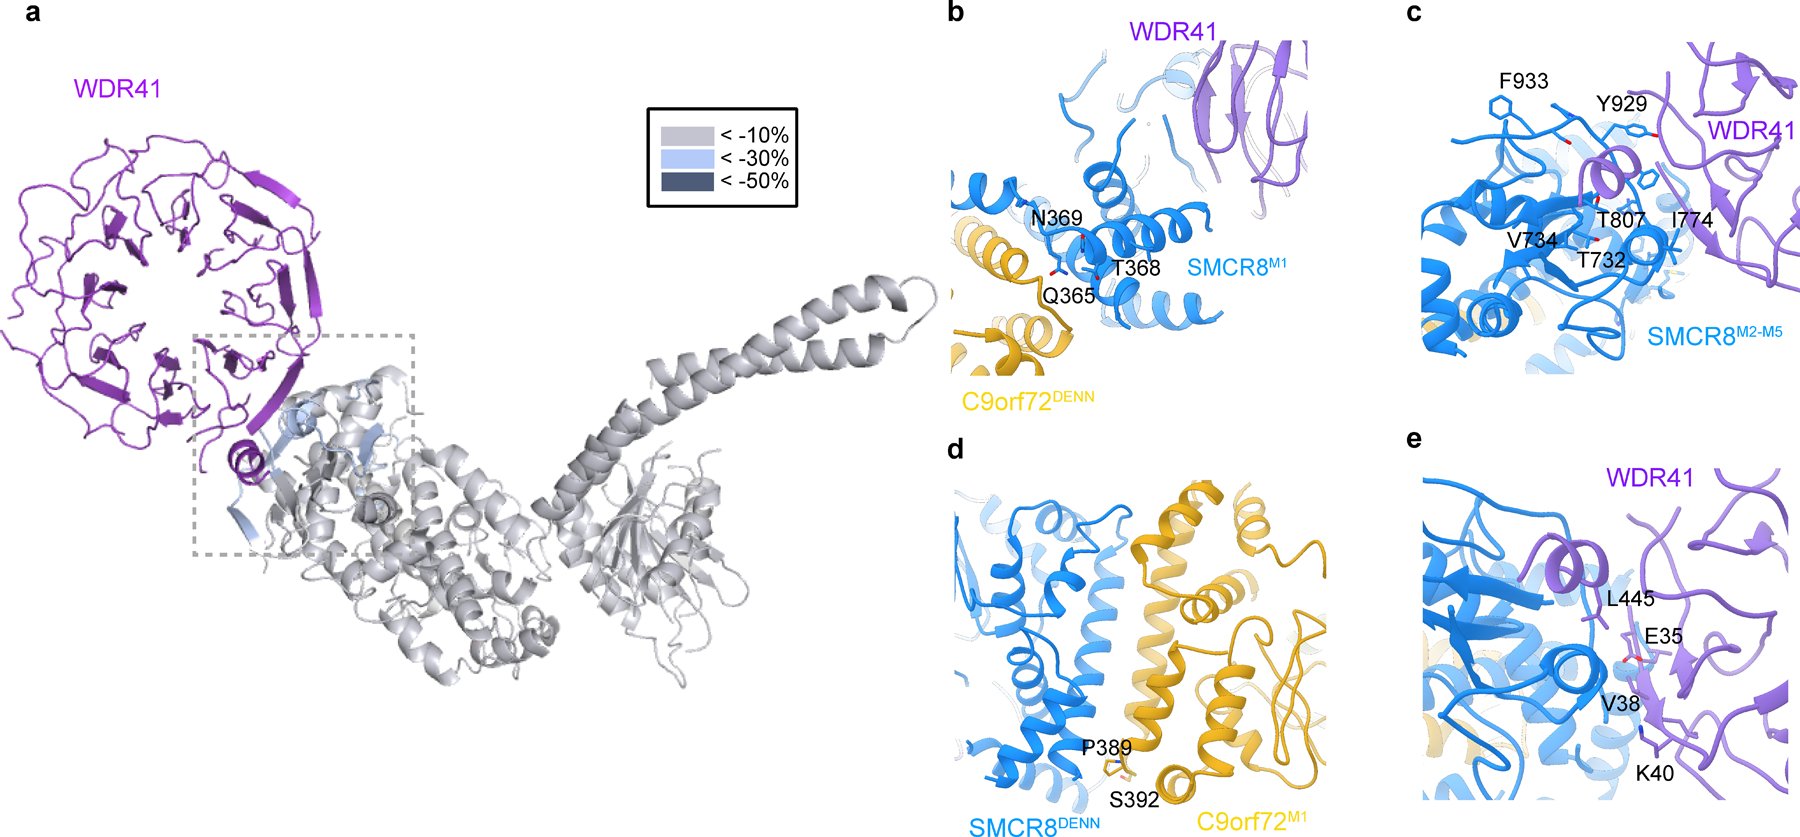
Fig. 2: HDX-MS of C9orf72-SMCR8 in the absence of WDR41.
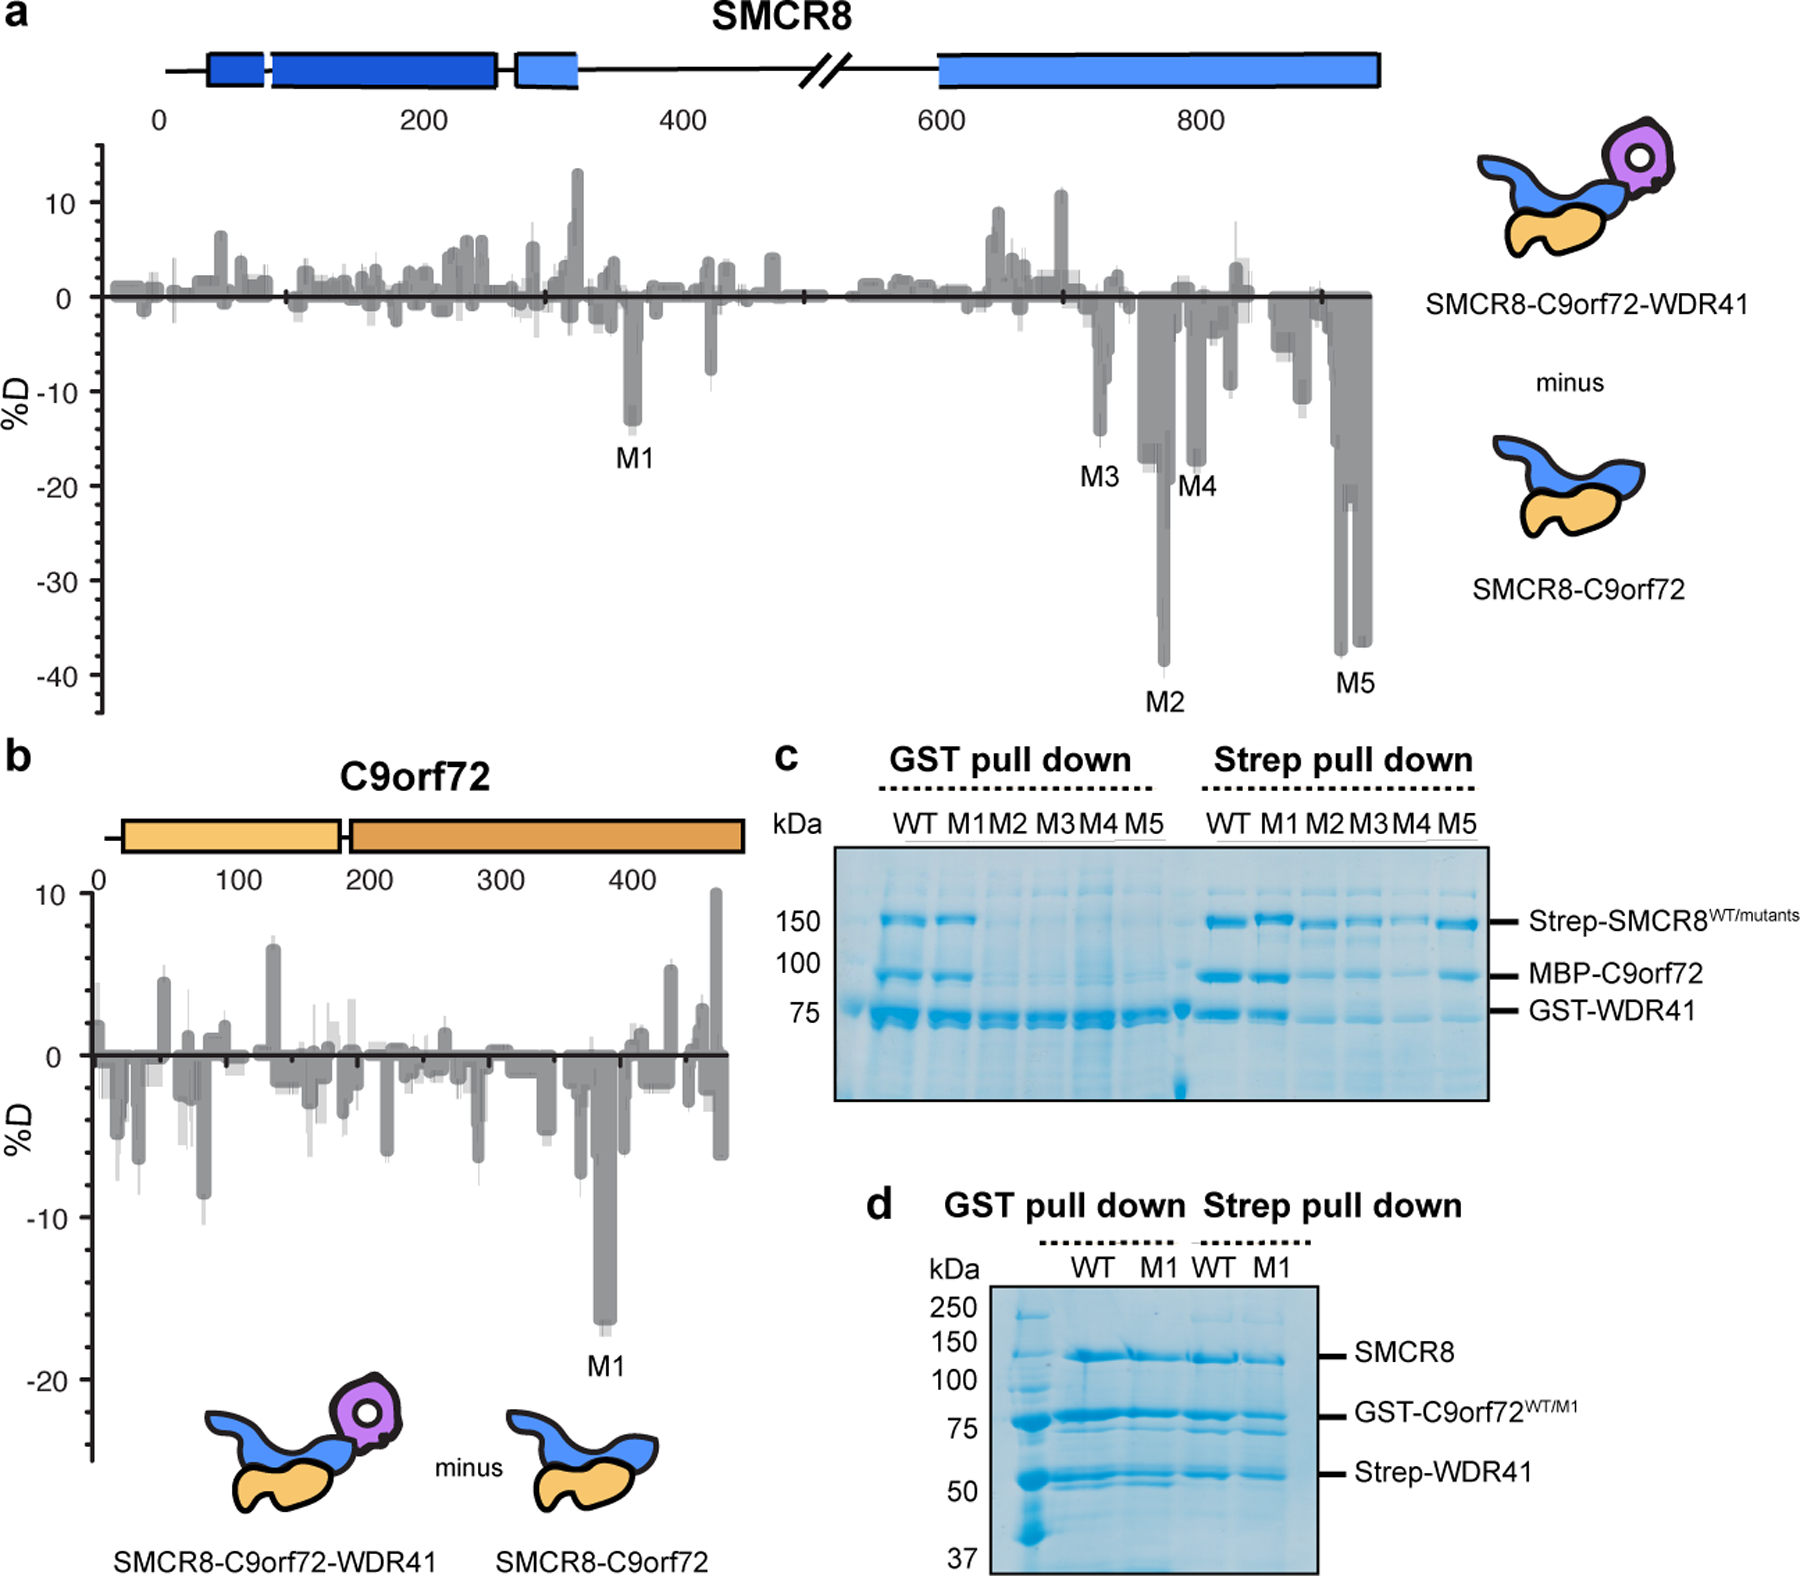
a, Difference plot of percentage of deuteron incorporation of SMCR8 in heterotrimer versus dimer at 5 sec timepoint. b, Difference plot of percentage of deuteron incorporation of C9orf72 in heterotrimer versus dimer at 0.5 sec timepoint. c, Coexpression and pull down experiment of Strep-tagged SMCR8 mutants with wild type MBP-C9orf72 and GST-WDR41. d, Coexpression and pull down experiments of GST-C9orf72 mutant with wild type untagged SMCR8 and Strep-WDR41. The pull down experiments were repeated at least twice with similar results (c-d).
Difference heat maps for C9orf72 and SMCR8 (Fig. 2a–b) showed that in presence of WDR41, regions of the SMCR8DENN including K363-L372 (SMCR8M1), P763-Q770 (SMCR8M2), S729-V735 (SMCR8M3), T807-D811 (SMCR8M4) and C-terminal K910-Y935 (SMCR8M5) were protected from exchange (Fig. 2–3, Extended Data Fig. 4, 5, 6), consistent with the structure. There was no significant change in C9orf72, with the exception of K388-R394 (C9orf72M1) (Fig. 2–3). Regions showing protection changes were mutagenized and tested in coexpression and pull down experiments (Fig. 2c–d). Except for the helical linker mutant SMCR8M1, the mutations including SMCR8M2–M5 abolished the interaction with WDR41. When WDR41 failed to pull down SMCR8 mutants, wild-type C9orf72 was not detected either. This confirms the structural finding that SMCR8 bridges the other two components. Because C9orf72M1 retained interaction with SMCR8-WDR41, we concluded that this region was protected by a conformational change induced upon WDR41 binding, consistent with the lack of direct interaction in the cryo-EM structure. The interface between SMCR8 and C9orf72 is extensive, mediated by longin:longin and DENN:DENN dimerization (Fig.1d–e). Mutations of C9orf72 F397E/T411W disrupt the interaction with SMCR8, shown by coexpression and pull down experiments (Extended Data Fig.7a–b). The cryo-EM structure showed that SMCR8 bound to blade VIII and the C terminal helix of WDR41 (Fig. 3a, Extended Data Fig.6). The pull down experiment showed that the N-terminal residues E35-K40 of blade VIII and the C-terminal helix S442-V459 are required for SMCR8 binding (Extended Data Fig.7c). Collectively, the HDX-MS and mutational results corroborate the structural interpretation.
Fig. 3: SMCR8 mutants fail to localize on lysosome.
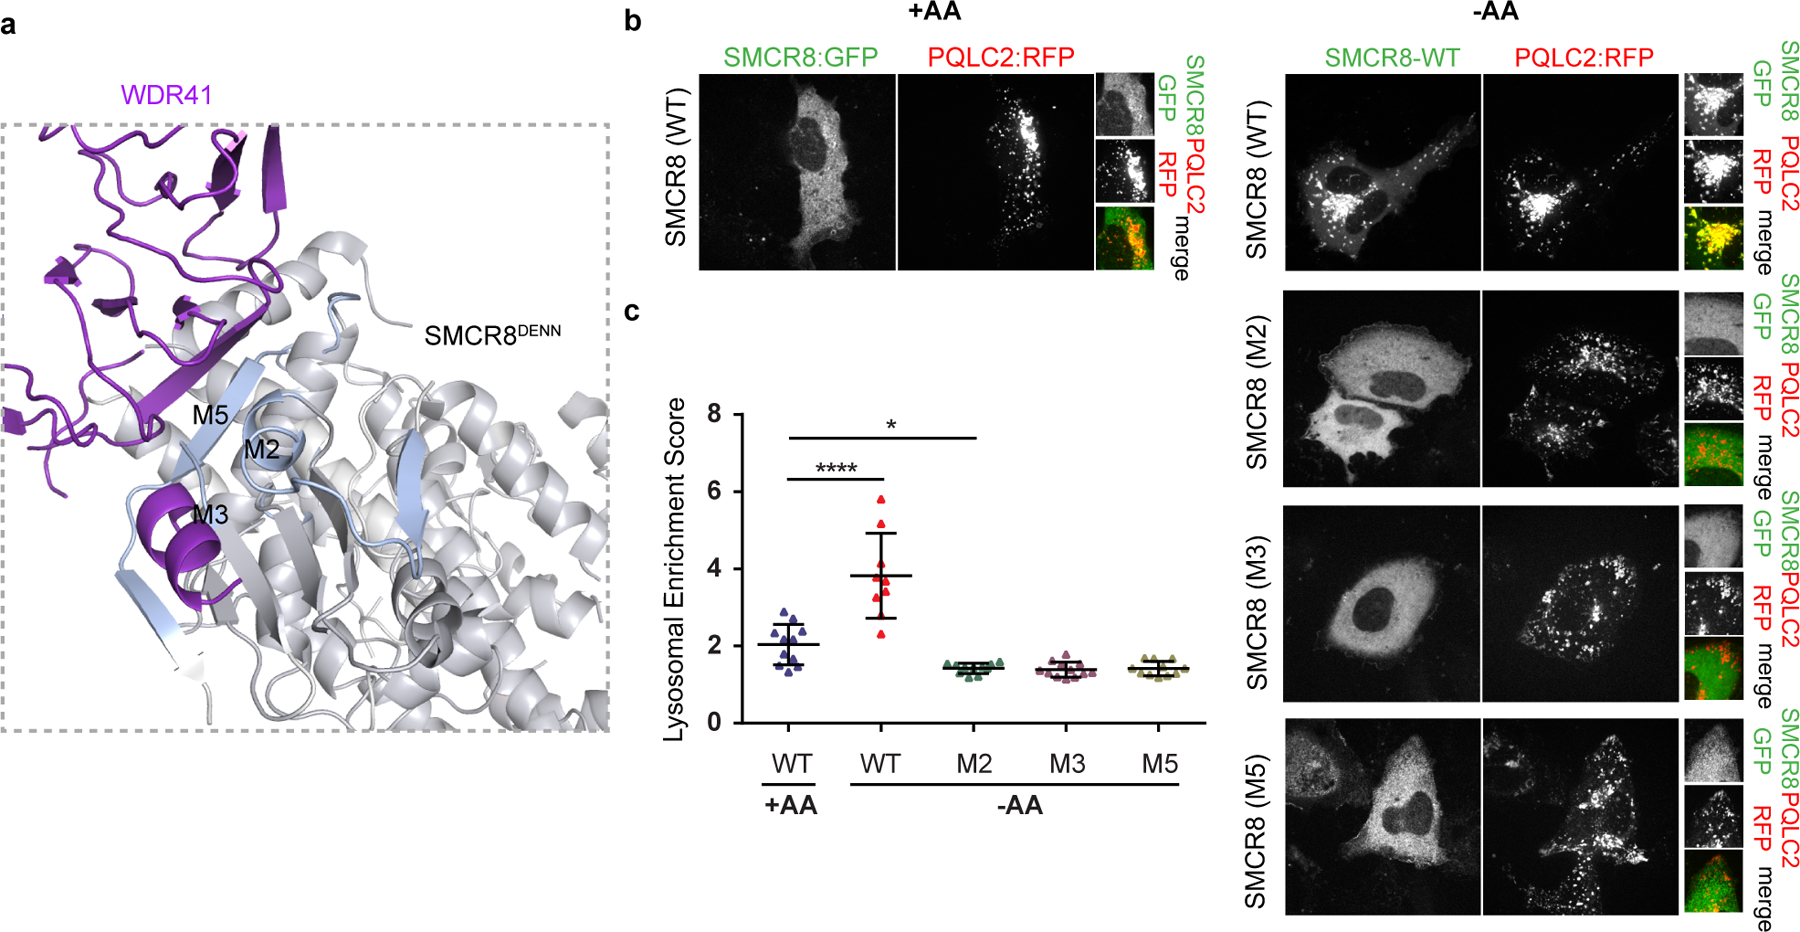
a, The HDX uptake difference at 0.5 sec was mapped on C9orf72-SMCR8. Close view of SMCR8-WDR41 interface, highlighting the SMCR8 mutants. b, SMCR8-PQLC2 lysosome colocalization experiment in cells expressing the indicated SMCR8 constructs under the indicated nutrient conditions. −AA indicates cells starved for amino acids for one hr and +AA indicates cells starved and the restimulated with amino acids for 10 min. The experiment was repeated at least three times independently with similar results. c, Quantification of SMCR8 lysosomal enrichment score for immunofluorescence images in b. Plotted are mean and SD, (left to right n=11, 9, 11, 12 and 11) cells were quantified for each condition. * (p value < 0.05) and **** (p value < 0.0001) were evaluated by one-way ANOVA analysis.
WDR41 is responsible for the reversible targeting of C9orf72-SMCR8 to lysosomes in nutrient depletion14. WDR41 in turns binds to lysosomes via PQLC215. We co-transfected DNA encoding GFP-SMCR8, C9orf72, WDR41 and PQLC2-mRFP in HEK293A cells. SMCR8 clustered on PQLC2-positive lysosomes in amino acid depletion and was diffusely localized in the cytosol upon refeeding (Fig. 3b), consistent with these reports14,15. SMCR8 mutants deficient in WDR41 binding in vitro did not colocalize with PQLC2-postive lysosomes, but rather were diffusely localized in the cytosol even under amino acid-starved conditions (Fig. 3b–c). These findings confirm that the WDR41 binding site on SMCR8 as mapped by cryo-EM and HDX-MS is responsible for the lysosomal localization of the complex in amino-acid starvation.
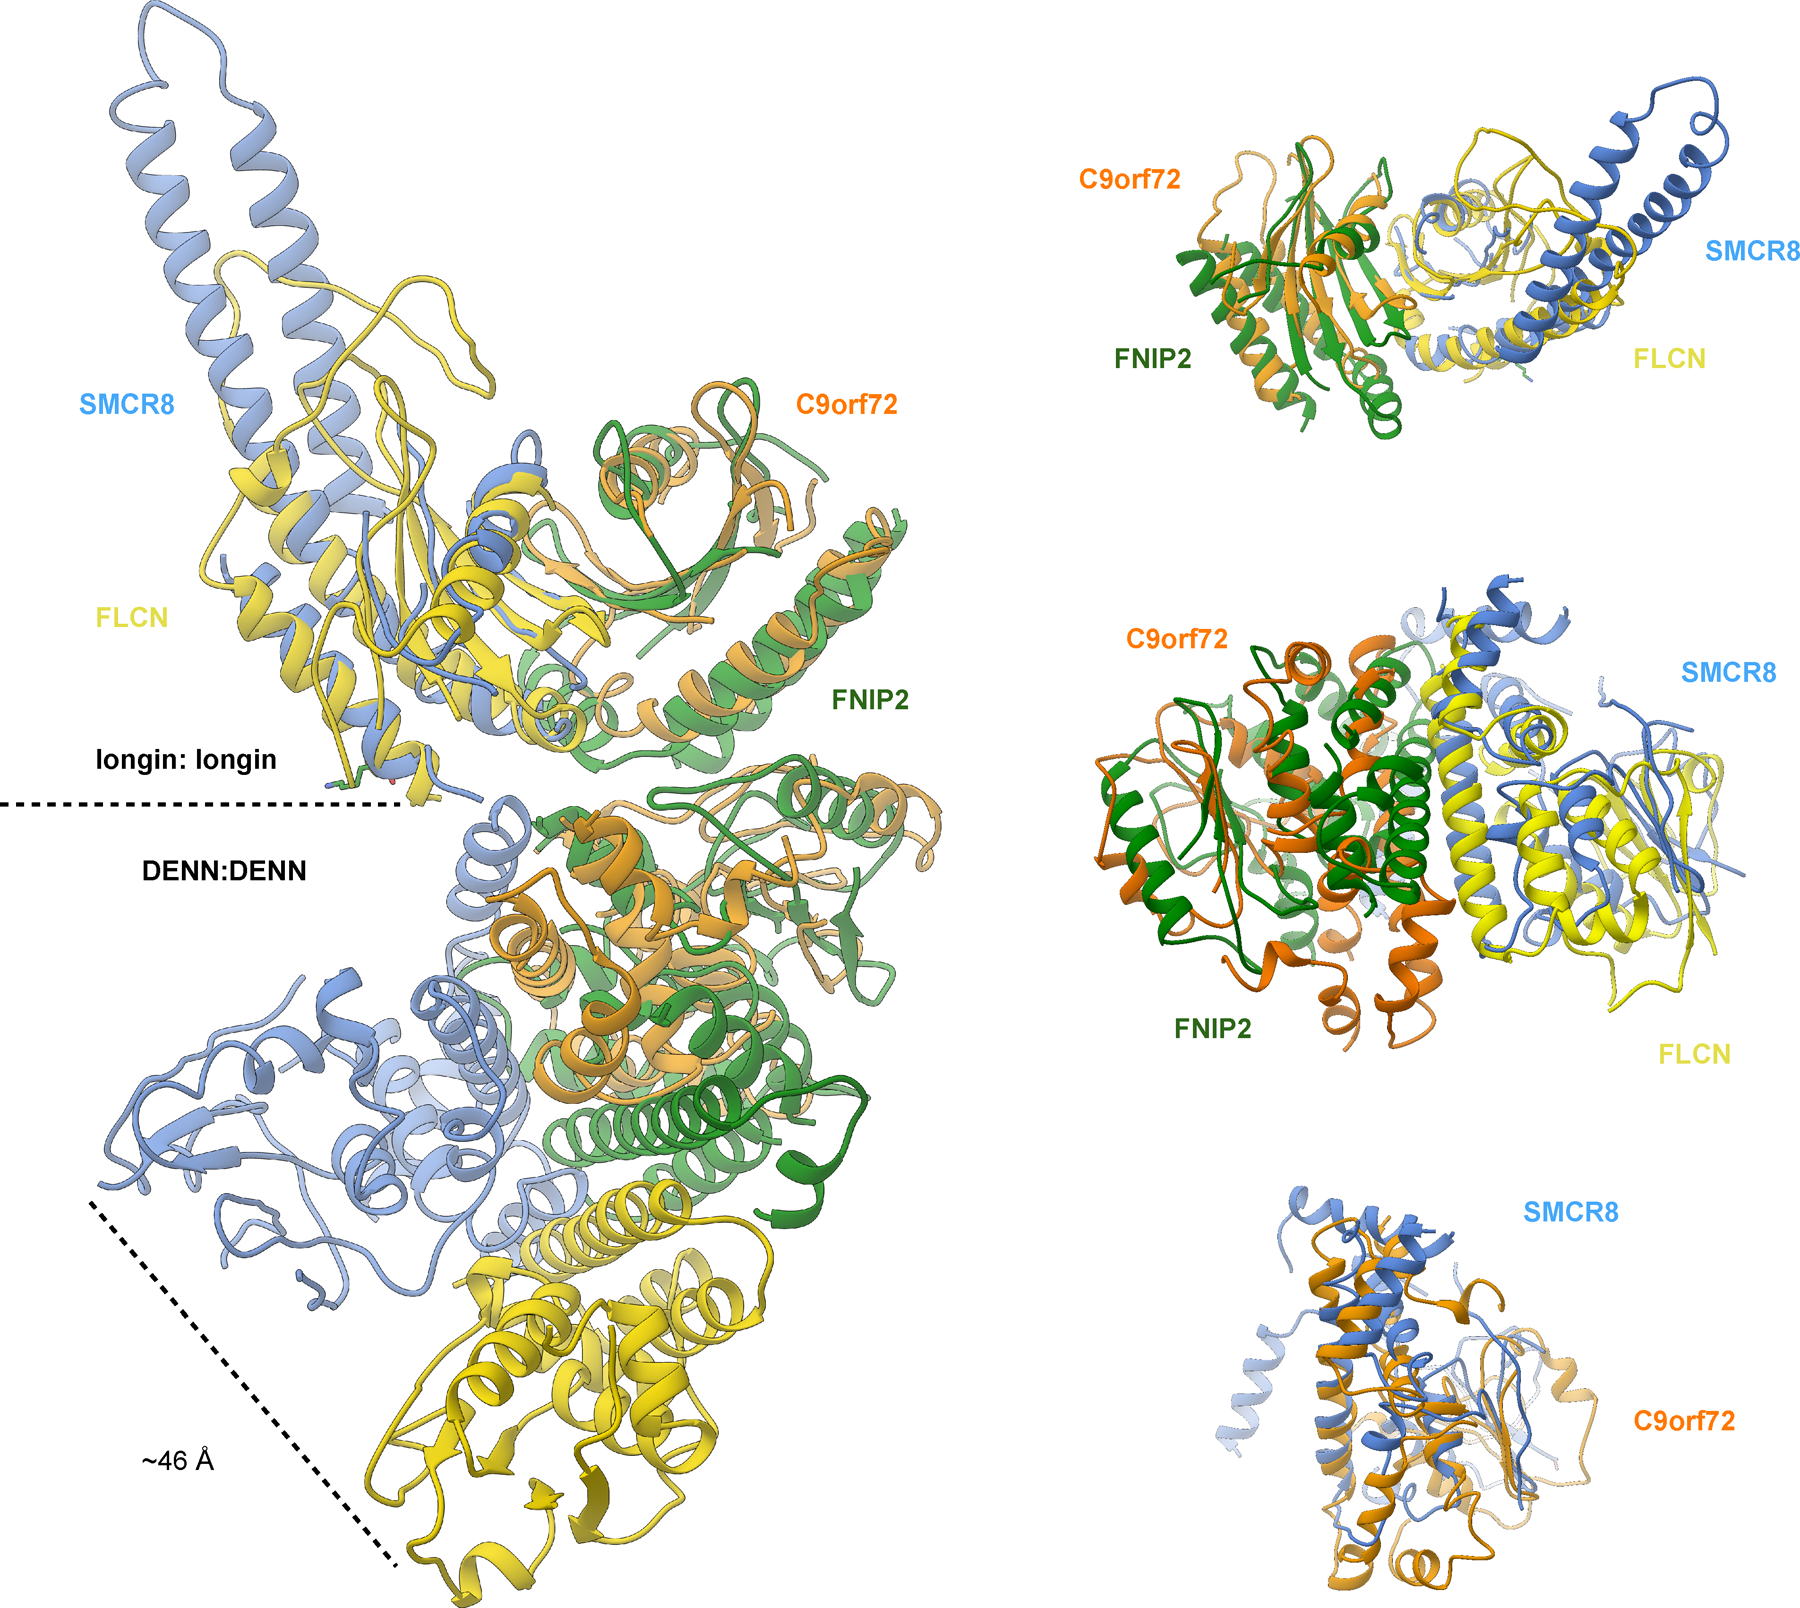
The structure showed that SMCR8longin forms a heterodimer with C9orf72longin in the same manner as Nprl2-Nprl3 of the GATOR1 complex19 and FLCN-FNIP2 in the Lysosomal Folliculin Complex (LFC)20,21. The Nprl2 and FLCN subunits of these complexes are the GTPase activating proteins (GAPs) for the lysosomal small GTPases RagA22 and RagC23, respectively. Structure-based alignment of SMCR8 with FLCN and Nprl2 showed they shared a conserved Arg finger residue20,21,24 (Fig. 4a), corresponding to SMCR8 R147. This Arg residue is exposed on the protein surface near the center of a large concave surface that appears suitable for binding a small GTPase (Extended Data Fig.8). Using a Trp fluorescence and HPLC-based assay, we assayed C9orf72-SMCR8 for GAP activity with respect to RagA or RagC and found none detectable (Extended Data Fig. 9a, b, d). We also assayed for GAP activity with respect to RAB1A17 and the late endosomal RAB7A16, and again, activity was undetectable (Extended Data Fig. 9a, b, d).
Fig. 4: C9orf72-SMCR8 is a GAP for Arf proteins.

a, Structure comparison of FNIP2-FLCN and C9orf72-SMCR8, implying a potential binding site for substrates. The conserved Arg residue was shown in spherical representation. b, Tryptophan fluorescence GTPase signal was measured for ARF1WT or Q71L before and after addition of C9orf72-SMCR8WT or C9orf72-SMCR8R147A -WDR41, C9orf72-SMCR8, FLCN-FNIP2 or GATOR1 complex. The fluorescence signal upon GAP addition was normalized to 1 for each experiment. Plots were the mean and standard deviation of triplicate technical experiments. c, Model for Arf protein family activation by C9orf72-SMCR8-WDR41.
It has been reported that C9orf72 interacts with the small GTPases ARF1 and ARF625 in neurons5. We found that C9orf72-SMCR8-WDR41 was an efficient GAP for ARF1 on the basis of both Trp fluorescence and HPLC-based assays (Fig. 4). The ARF1Q71L GTP locked mutant had no activity (Fig.4b, Extended Data Fig.10), nor did the version of the complex containing the SMCR8R147A finger mutation. FLCN-FNIP2 and GATOR1 had no GAP activity towards ARF1. C9orf72-SMCR8 was as active as C9orf72-SMCR8-WDR41, consistent with the location of WDR41 on the opposite side of the complex from R147. C9orf72-SMCR8-WDR41 has activity against the other Arf family members, ARF5 and ARF6 (Extended Data Fig. 9a, c, d), but not against the lysosomal Arf-like proteins ARL8A and ARL8B (Extended Data Fig. 9a, b, d). These observations clarify the nature of the reported C9orf72-Arf interaction by showing that the role of C9orf72 is to stabilize a complex with SMCR8, which is in turn an efficient and selective GAP for Arf GTPases.
RAB5A26, RAB7A26, RAB8A8 and RAB39B19,12 have all been reported to be GEF substrates of C9orf72. We tested the activity of the purified complex with respect to these Rabs and another putative C9orf72 interactor, RAB1A17. Compared to a Rabex5/RAB5A positive control, no exchange was observed on any of these upon addition of C9orf72-SMCR8-WDR41 (Extended Data Fig.11a–b). The RAB35 GEF DENND1B structure27 had been previously used as a basis for modeling26. Comparing C9orf72 in our structure with that of DENND1B in complex with RAB3527, the alignment of the longin domains showed that RAB35 collides with SMCR8longin, while superimposition of DENN domains indicated that RAB35 collides with C9orf72longin, consistent with our result that C9orf72-SMCR8 does not have DENND1B-like GEF activity (Extended Data Fig.11c).
These data shed light on the normal function of C9orf72, which is thought to contribute to neuronal loss of function in ALS and FTD6. The structure shows that C9orf72 is the central component of its complex with SMCR8. The longin and DENN domains of SMCR8 flank and are stabilized by C9orf72. SMCR8 contains the binding site for WDR41 responsible for lysosomal localization during amino acid starvation. C9orf72-SMCR8 belongs to the same class of double-longin domain GAP complexes as GATOR119 and FLCN-FNIP220,21. Unlike GATOR1 and FLCN-FNIP2, C9orf72-SMCR8 is inactive against Rag GTPases, but is active against Arf GTPases instead. The GAP active site is located at the opposite end of the complex from the lysosomal targeting site on WDR41.
Our in vitro observation that C9orf72-SMCR8 and C9orf72-SMCR8-WDR41 have comparable GAP activities suggests that, in cells, C9orf72-SMCR8 may regulate Arf GTPases both in full nutrient conditions, when the complex is primarily localized in the cytosol, and under amino acid starvation, when it relocalizes to the lysosomal membrane via WDR41-PQLC2 interaction. However, additional factors could limit or augment the Arf-GAP activity in either condition and restrict or enhance access to the GTP-bound Arf substrate. Arf proteins are not observed on lysosomes, and their closest lysosomal cousins, ARL8A and ARL8B, are not substrates for C9orf72-SMCR8. Thus, sequestration of C9orf72-SMCR8-WDR41 on lysosomes could prevent it from regulating the Arfs in cis under unfavorable metabolic conditions. Alternatively, C9orf72-SMCR8-WDR41 could act in trans on Arf bound to the membrane of a compartment other than the lysosome. Arf GTPases are found on the Golgi, endosomes, plasma membrane, cytoskeleton, and in the cytosol25, and function on membranes in their active GTP-bound form. C9orf72 can associate with endosomes6,16,28 and the cytoskeleton5, which are could be loci of the Arf substrate of C9orf72-SMCR8. The potential trans GAP activity of C9orf72-SMCR8-WDR41 vs. endosomal or cytoskeletal Arf would be facilitated by its elongated structure and the distal positioning of the GAP and lysosomal localization sites (Fig. 4d).
Haploinsufficient ARFGAP activity could contribute to ALS/FTD disease in several ways. Defects in actin dynamics in neurons could contribute to problems with endosomal transport5. Indeed, multiple reports connect C9orf72 to endosomal sorting6,16,28, a process in which the role of Arfs is well-established25. It has been reported that ARF1 promotes mTORC1 activation29, so the Arf GAP function of C9orf72-SMCR8 could explain how this complex antagonizes mTORC118. mTORC1 negatively regulates autophagy, so the ARF1-mTORC1 connection could explain how haploinsufficient C9orf72 leads to a decrease in autophagy, which has in turn been linked to multiple neurodegenerative diseases30. While our paper was under review, a cryo-EM structure of a dimeric form of this complex was reported and proposed to serve as a GAP for RAB8A and RAB11A31. The relative roles of GAP activity with respect to different small GTPases in normal function and disease remain to be determined. The structural and in vitro biochemical data reported here and by Tang et al.31 provide a framework and a foothold for understanding how the normal functions of C9orf72 relate to lysosomal signaling, autophagy, and neuronal survival.
Methods
Protein expression and purification
Synthetic genes encoding SMCR8 were amplified by PCR and cloned into the pCAG vector coding for an N-terminal twin-STREP-FLAG (TSF) tag using KpnI and XhoI restriction sites. The pCAG vector encoding an N-terminal GST followed by a TEV restriction site or uncleaved MBP tag was used for expression of C9orf72. WDR41 was cloned into pCAG vector without a tag or with a GST tag for pull down experiments. For the mutations of SMCR8 identified from HDX experiments, SMCR8M1 (K363-L371) was mutated to MSDYDIPTTE, which is a 10-residue linker derived from the pETM11 vector. SMCR8M2 (P771-Q778) or (K762-L782) for lysosome localization experiments was mutated to GGKGSGGS. SMCR8M3 (S729-V735) and SMCR8M4 (T807-D811) were made by mutating these regions to GGKGSGG and GGKGS, respectively. SMCR8M5 was made by truncation after residue K910. C9orf72M1 (K388-L393) was mutated to polyAla. The SMCR8 arginine finger mutation R147A, C9orf72 F397E and T411W mutants were made using two step PCR and cloned into the expression vector.
HEK293-GnTi cells adapted for suspension were grown in Freestyle media supplemented with 1% FBS and 1% antibiotic-antimycotic at 37 °C, 80 % humidity, 5 % CO2, and shaking at 140 rpm. Once the cultures reached 1.5–2 million cells mL−1 in the desired volume, they were transfected as followed. For a 1 L transfection, 3 mL PEI (1 mg ml−1, pH 7.4, Polysciences) was added to 50 mL hybridoma media (Invitrogen) and 1 mg of total DNA (isolated from transformed E. coli XL10-gold) in another 50 mL hybridoma media. 1 mg of transfection DNA contained equal mass ratio of C9orf72 complex expression plasmids. PEI was added to the DNA, mixed and incubated for 15 min at room temperature. 100 mL of the transfection mix was then added to each 1 L culture. Cells were harvested after 3 days.
Cells were lysed by gentle rocking in lysis buffer containing 50 mM HEPES, pH 7.4, 200 mM NaCl, 2 mM MgCl2, 1% (vol/vol) Triton X-100, 0.5 mM TCEP, protease inhibitors (AEBSF, Leupeptin and Benzamidine) and supplemented with phosphatase inhibitors (50 mM NaF and 10 mM beta-glycerophosphate) at 4 °C. Lysates were clarified by centrifugation (15,000 g for 40 min at 4 °C) and incubated with 5 mL glutathione Sepharose 4B (GE Healthcare) for 1.5 hr at 4 °C with gentle shaking. The glutathione Sepharose 4B matrix was applied to a gravity column, washed with 100 mL wash buffer (20 mM HEPES, pH 7.4, 200 mM NaCl, 2 mM MgCl2, and 0.5 mM TCEP), and purified complexes were eluted with 40 mL wash buffer containing 50 mM reduced glutathione. Eluted complexes were treated with TEV protease at 4 °C overnight. TEV-treated complexes were purified to homogeneity by injection on Superose 6 10/300 (GE Healthcare) column that was pre-equilibrated in gel filtration buffer (20 mM HEPES, pH 7.4, 200 mM NaCl, 2 mM MgCl2, and 0.5 mM TCEP). For long-term storage, fractions from the gel filtration chromatography were frozen using liquid nitrogen and kept at −80 °C. C9orf72-SMCR8 and C9orf72-SMCR8-WDR41 were expressed and purified using the same protocol (Supplementary Fig.1).
For expression of human His6-tagged ARF1 (residue E17-K181), ARF1 Q71L, ARF5 (residue Q17-Q180), ARF6 (residue R15-S175), ARF6 Q67L, His6-RAB1A, His6-ARL8A (E20-S186), His6-ARL8B (E20-S186), His6-RAB39B, and bovine His6-Rabex5 helix bundle-Vps9 domain (S133-E398), plasmids were transformed into E.coli BL21 DE3 star cells and induced with 0.5 mM IPTG at 18° C overnight. The cells were lysed in 50 mM Tris-HCl pH 8.0, 300 mM NaCl, 2 mM MgCl2, 5 mM imidazole, 0.5 mM TCEP and 1 mM PMSF by ultrasonication. The lysate was centrifuged at 15,000 g for 30 min. The supernatant was loaded into Ni-NTA resin and washed with 20 mM imidazole and eluted with 300 mM imidazole. The eluate was further purified on a Superdex 75 10/300 (GE Healthcare) column equilibrated in 20 mM HEPES, pH 7.4, 200 mM NaCl, 2 mM MgCl2, and 0.5 mM TCEP. Rag, FLCN-FNIP2 and GATOR1 complex were purified as described previously20. GST-tagged human RAB7A or RAB5A (Canis familiaris) was expressed in the same conditions as above and purified with GST resin, eluted in 50 mM reduced glutathione buffer and applied on Superdex 200 column. Twin-STREP-FLAG tag RAB8A was expressed in HEK293-GnTi cells and purified by Strep resin and eluted in 10 mM desthiobiotin buffer. The eluted protein was applied on Superdex 75 10/300 column.
Hydrogen/Deuterium exchange experiment
Sample quality was assessed by SDS-PAGE before each experiment. Amide hydrogen exchange mass spectrometry was initiated by a 20-fold dilution of 10 μM C9orf72-SMCR8-WDR41 or C9orf72-SMCR8 into 95 μl D2O buffer containing 20 mM HEPES pH (pD 8.0), 200 mM NaCl, 1 mM TCEP at 30° C. Incubations in deuterated buffer were performed at intervals from 0.5, 5, 50, 500 and 50,000 sec (0.5 sec was carried out by incubating proteins with ice cold D2O for 5 sec). All exchange reactions were carried out in triplicate or quadruplicate. Backbone amide exchange was quenched at 0° C by the addition of ice-cold quench buffer (400 mM KH2PO4/H3PO4, pH 2.2). The 50,000 sec sample served as the maximally labeled control. Quenched samples were injected onto a chilled HPLC setup with in-line peptic digestion and then eluted onto a BioBasic 5 μM KAPPA Capillary HPLC column (Thermo Fisher Scientific), equilibrated in buffer A (0.05 % TFA), using 10–90 % gradient of buffer B (0.05 % TFA, 90 % acetonitrile) over 30 mins. Desalted peptides were eluted and directly analyzed by an Orbitrap Discovery mass spectrometer (Thermo Fisher Scientific). The spray voltage was 3.4 kV and the capillary voltage was 37 V. The HPLC system was extensively cleaned between samples. Initial peptide identification was performed via tandem MS/MS experiments. A Proteome Discoverer 2.1 (Thermo Fisher Scientific) search was used for peptide identification and coverage analysis against entire complex components, with precursor mass tolerance ± 10 ppm and fragment mass tolerance of ± 0.6 Da. Mass analysis of the peptide centroids was performed using HDExaminer (Sierra Analytics), followed by manual verification of each peptide. The difference plots were prepared using Origin 6.0.
Cryo-EM grid preparation and data acquisition
The purified C9orf72-SMCR8-WDR41 complex was diluted to 0.8 μM in 20 mM HEPES pH 7.4, 2 mM MgCl2, and 0.5 mM TCEP and applied to glow-discharged C-flat (1.2/1.3, Au 300 mesh) grids. The sample was vitrified after blotting for 2 sec using a Vitrobot Mark IV (FEI) with 42 sec incubation, blot force 8 and 100 % humidity. The complex was visualized with a Titan Krios electron microscope (FEI) operating at 300 kV with a Gatan Quantum energy filter (operated at 20 eV slit width) using a K2 summit direct electron detector (Gatan, Inc.) in super-resolution counting mode, corresponding to a super-resolution pixel size of 0.5745 Å on the specimen level. In total, 3,508 movies were collected in nanoprobe mode using Volta phase plate (VPP) with defocus collected around −60 nm. Movies consisted of 49 frames, with a total dose of 59.8 e-/Å2, a total exposure time of 9.8 sec, and a dose rate of 8.1 e−/pixel/sec. Data were acquired with SerialEM using custom macros for automated single particle data acquisition. Imaging parameters for the data set are summarized in Extended Data Table 1.
Cryo-EM data processing
Preprocessing was performed during data collection within Focus32. Drift, beam induced motion and dose weighting were corrected with MotionCor233 using 5 × 5 patches and fourier cropping with a factor of 0.5 after motion correction. CTF fitting and phase shift estimation were performed using Gctf v1.0634, which yielded the characterized pattern of phase shift accumulation over time for each position. The data were manually inspected and micrographs with excess ice-contamination or shooting on the carbon were removed. A total of 4,810,184 particles from 3,220 micrographs were picked using gautomatch (http://www.mrc-lmb.cam.ac.uk/kzhang/Gautomatch/) and extracted with binning 4. All subsequent classification and reconstruction steps were performed using Relion3-beta35 or cryoSPARC v236. The particles were subjected to 3D classification (K=5) using a 60 Å low-pass filtered ab initio reference generated in cryoSPARC. Around 2.2 million particles from the two best classes were selected for 3D auto-refinement and another round of 3D classification (K=8 classes, T=8, E-step=8 Å) without alignment. Some 1.8 millions particles from the best 6 classes were reextracted with binning 2 and refined to 4.9 Å, and further subjected to 2D classification without alignment for removing contamination and junk particles. After another round of 3D classification (K=4) with alignment, the best class was extracted and imported into cryoSPARC v2 for another round of 2D classification. The cleaned up 571,002 particles were applied to CTF refinement, Bayesian polishing and further particles at edges were removed in Relion 3. Final 381, 450 particles resulted in final resolution of 3.8 Å with a measured map B-factor of −102 Å2. More extensive 3D classification, focus classification in Relion3 did not improve the quality of the reconstruction. Local filtering and B-factor sharpening were done in cryoSPARC v2. All reported resolutions are based on the gold-standard FSC 0.143 criterion.
Atomic model building and refinement
The model of WDR41 was generated with I-Tasser37 and used 5nnz, 2ymu, 5wlc, 4nsx and 6g6m as starting models. The model of the C9orf72longin domain was generated based on the Nprl2longin domain (pdb 6ces) in Modeller38. The model of SMCR8DENN domain was generated from Modeller and RaptorX39 using the FLCNDENN domain (pdb 3v42) or the DENND1BDENN domain (pdb 3tw8) as templates. The SMCR8longin and C9orf72DENN domain were generated with Phyre240 using FLCNlongin and FNIP2DENN domain (pdb 6nzd) as templates. Secondary structure predictions of each protein were carried out with Phyre240 or Psipred41. The models were docked into the 3D map as rigid bodies in UCSF Chimera42. The coordinates of the structures were manually adjusted and rebuilt in Coot43. The resulting models were refined using Phenix.real_space.refine in the Phenix suite with secondary structure restraints and a weight of 0.144,45. Model quality was assessed using MolProbity46 and the map-vs-model FSC (Extended Data Table 1 and Extended Data Fig. 3c). Data used in the refinement excluded spatial frequencies beyond 4.2 Å to avoid over fitting. A half-map cross-validation test showed no indication of overfitting (Extended Data Fig. 3d). Figures were prepared using UCSF Chimera42 and PyMOL v1.7.2.1. The cryo-EM density map has been deposited in the Electron Microscopy Data Bank under accession code EMD-21048 and the coordinates have been deposited in the Protein Data Bank under accession number 6V4U.
Live cell imaging
800,000 HEK 293A cells were plated onto fibronectin-coated glass-bottom Mattek dishes and transfected with the indicated wild type GFP-SMCR8 or mutants, C9orf72, WDR41 and PQLC2-mRFP constructs with transfection reagent Xtremegene. 24 hrs later, cells were starved for amino acids for one hr (-AA) or starved and restimulated with amino acids for 10 mins (+AA). Cells in the -AA condition were transferred to imaging buffer (10 mM HEPES, pH7.4, 136 mM NaCl, 2.5 mM KCl, 2 mM CaCl2, 1.2 mM MgCl2) and cells in the +AA condition were transferred to imaging buffer supplemented with amino acids, 5 mM glucose, and 1% dialyzed FBS (+AA) and imaged by spinning-disk confocal microscopy. Lysosomal enrichment was scored as described20 using a home-built Matlab script to determine the lysosomal enrichment of GFP SMCR8. The score was analyzed for at least ten cells for each condition. The one-way analysis of variance (ANOVA) were calculated using Prism 6 (Graphpad).
HPLC analysis of nucleotides
The nucleotides bound to small GTPases were assessed by heating the protein to 95 °C for 5 min followed by 5 min centrifugation at 16,000 g. The supernatant was loaded onto a HPLC column (Eclipse XDB-C18, Agilent). Nucleotides were eluted with HPLC buffer (10 mM tetra-n-butylammonium bromide, 100 mM potassium phosphate pH 6.5, 7.5 % acetonitrile). The identity of the nucleotides was compared to GDP and GTP standards.
HPLC-based GAP assay
HPLC-based GTPase assays were carried out by incubating 30 μl of GTPases (30 μM) with or without GAP complex at a 1:50 molar ratio for 30 min at 37 °C. Samples were boiled for 5 min at 95 °C and centrifuged for 5 min at 16,000 g The supernatant was injected onto an HPLC column as described above. The experiments were carried out in triplicate and one representative plot was shown.
Tryptophan fluorescence-based GAP assay
Fluorimetry experiments were performed using a FluoroMax-4 (Horiba) instrument and a quartz cuvette compatible with magnetic stirring (Starna Cells), a pathlength of 10 mm, and were carried out in triplicate. The Trp fluorescence signal was collected using 297 nm excitation (1.5 nm slit) and 340 nm emission (20 nm slit). Experiments were performed in gel filtration buffer at room temperature with stirring. Data collection commenced with an acquisition interval of 1 sec. 2 μM GTPase was added to the cuvette initially. Once the signal was equilibrated, C9orf72-SMCR8WT, C9orf72-SMCR8R147A-WDR41 or C9orf72-SMCR8, FLCN-FNIP2, or GATOR1 complex was pipetted into the cuvette at a 1: 10 molar ratio. Time t = 0 corresponds to GAP addition. The fluorescence signal upon GAP addition was normalized to 1 for each experiment. Mean and standard error of the mean of three replicates per conditions or one representative plot were plotted.
mantGDP loading for GEF assay
To load GTPases for the mant fluorescence-based GEF assay, purified GTPases were diluted at least 1:10 into PBS buffer without MgCl2 (10 mM Na2HPO4, 1.8 mM KH2PO4, 137 mM NaCl, 2.7 mM KCl). EDTA was added to a final concentration of 5 mM and incubated at room temperature for 10 min. A 10-fold molar excess of mantGDP nucleotide (Millipore Sigma) was added to the GTPases and incubated for 30 min at room temperature. After addition of MgCl2 to a final concentration of 20 mM and incubation at room temperature for 10 min, unbound nucleotides were removed by buffer exchange into gel filtration buffer using a PD-10 column (GE Healthcare).
GEF assay
GEF assays were carried out with the same instrument and cuvette as the tryptophan fluorescence assays (see above). Mant fluorescence was collected using a 360 nm excitation (10 nm slit) and 440 nm emission (10 nm slit). Experiments were performed in gel filtration buffer at room temperature. 500 μl of gel filtration buffer were added to the cuvette and after baseline equilibration 20 μl of the respective GTPase with or without Rabex5 or C9orf72-SMCR8-WDR41 were added to a final concentration of 350 nM. After signal equilibration, the assay commenced by addition of 20 μl of GTP to a final concentration of 5 μM (~15-fold molar excess over the respective GTPase) and fluorescence was measured in 1 s intervals for 1400 s. All experiments were performed in triplicates. Data was baseline subtracted and normalized to the signal right after GTP addition which also is the 0 s time point in the plots. Plots are the mean and standard deviation of each triplicate experiment.
Cell lines authentication
Both HEK293 GnTi and HEK 293A cell lines were purchased from the UC Berkeley Cell Culture Facility and were authenticated by short-tandem repeat analysis and confirmed to be mycoplasma negative by nuclear staining and fluorescence microscopy screening.
Extended Data
Extended Data Fig. 1: Purification of the C9orf72-SMCR8-WDR41 and C9orf72-SMCR8 complex as well as the HDX data for trimer.
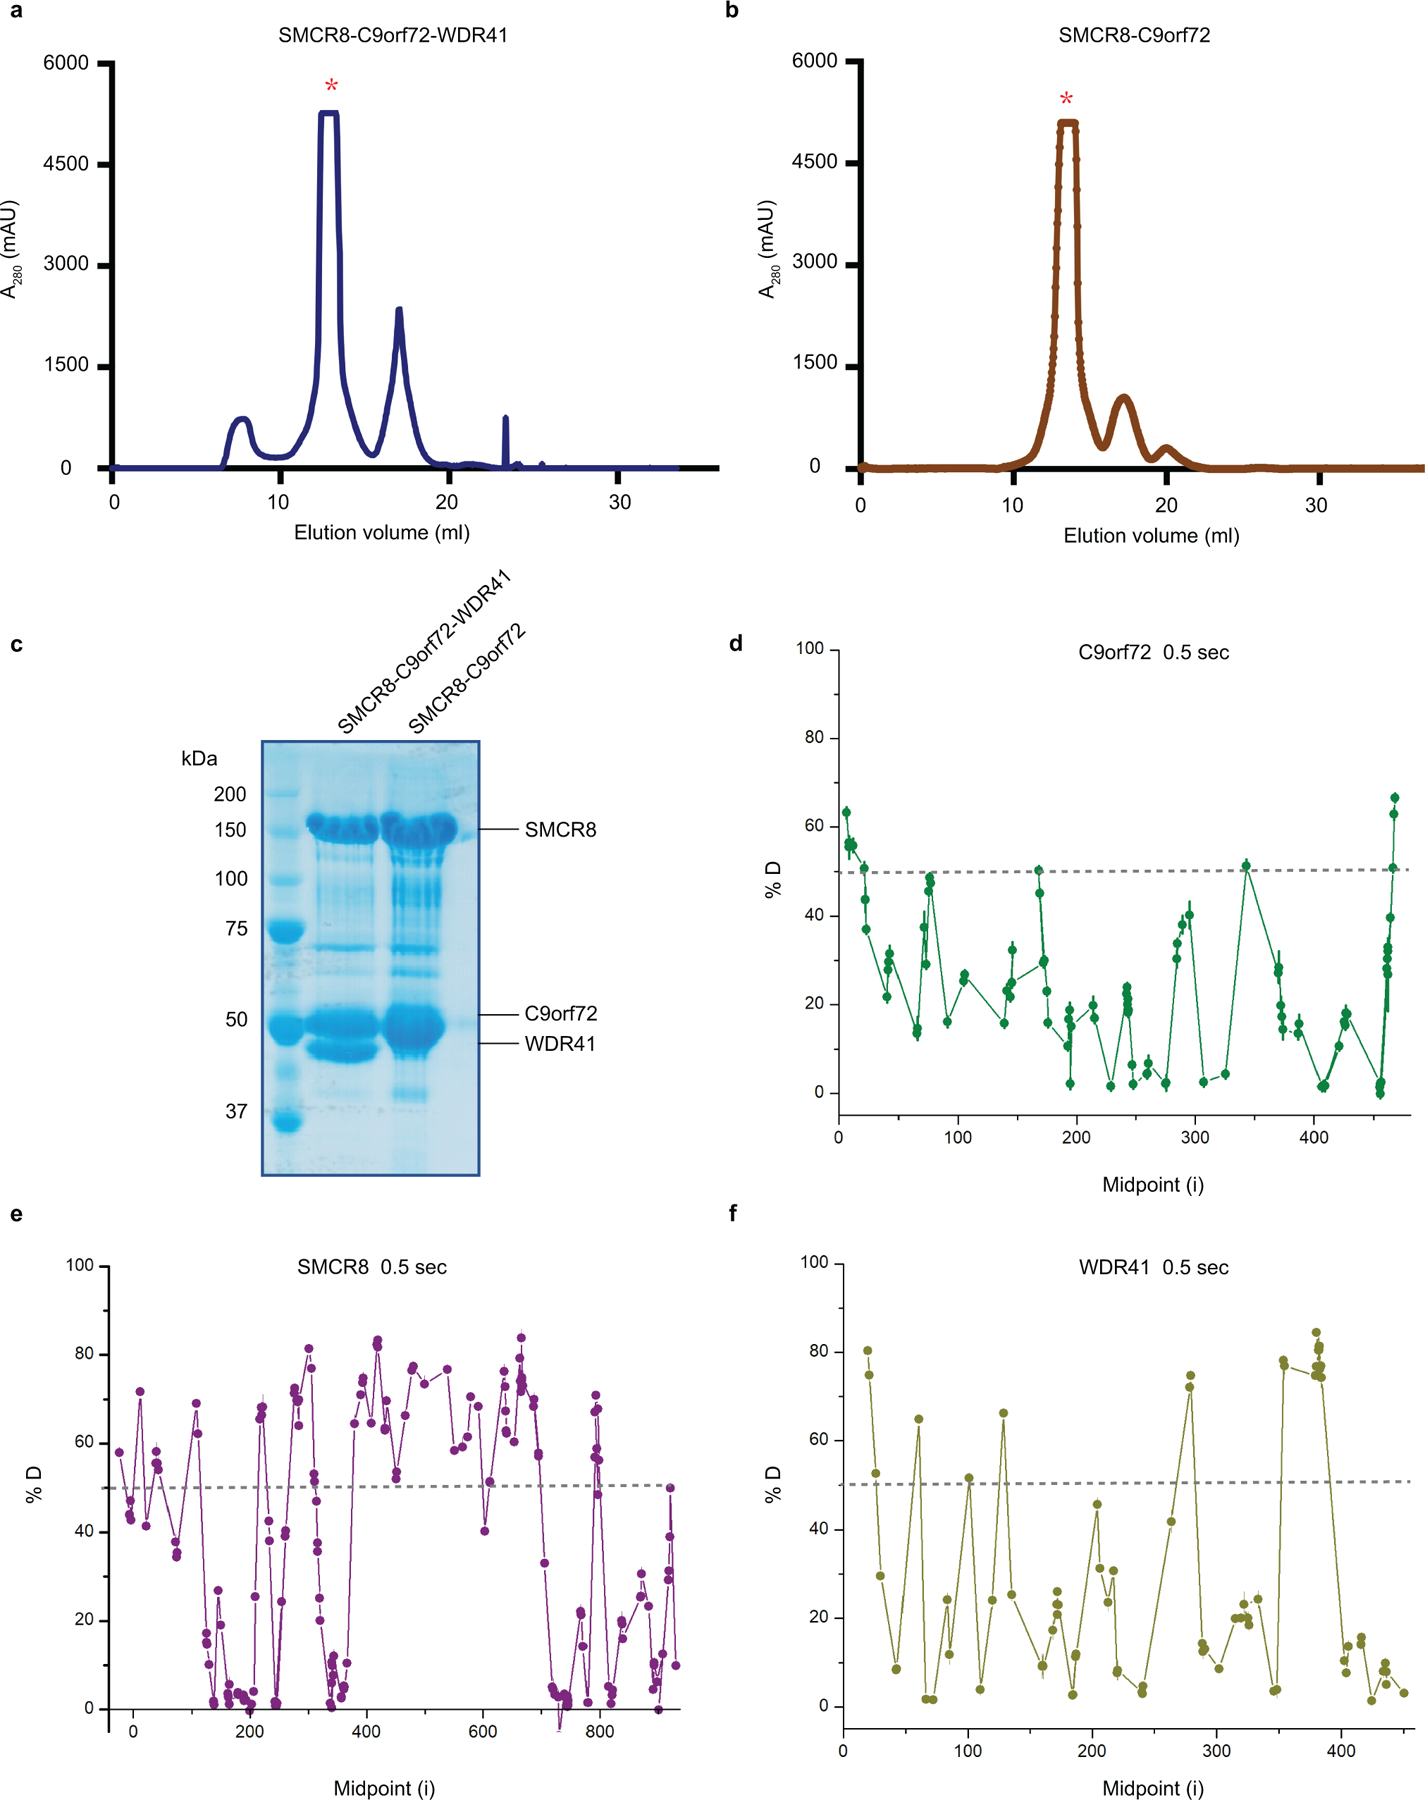
a, The superose 6 gel filtration elution profile for C9orf72-SMCR8-WDR41 complex. b, The superose 6 gel filtration elution profile for C9orf72-SMCR8 complex. mAU, milli-absorbance units. c, The purified full length C9orf72-SMCR8-WDR41 and C9orf72-SMCR8 were analyzed by SDS-PAGE. The proteins were purified at least five times with similar result (a-c). d-f, Deuterium uptake data for C9orf72-SMCR8-WDR41 complex at 0.5 sec timepoint with error bars from triplicate technical measurements. Peptides with more than 50 % deuterium uptake are the flexible regions. Y axis represents the average percent deuteration. X axis demonstrates the midpoint of a single peptic peptide.
Extended Data Fig. 2: Cryo-EM data processing.
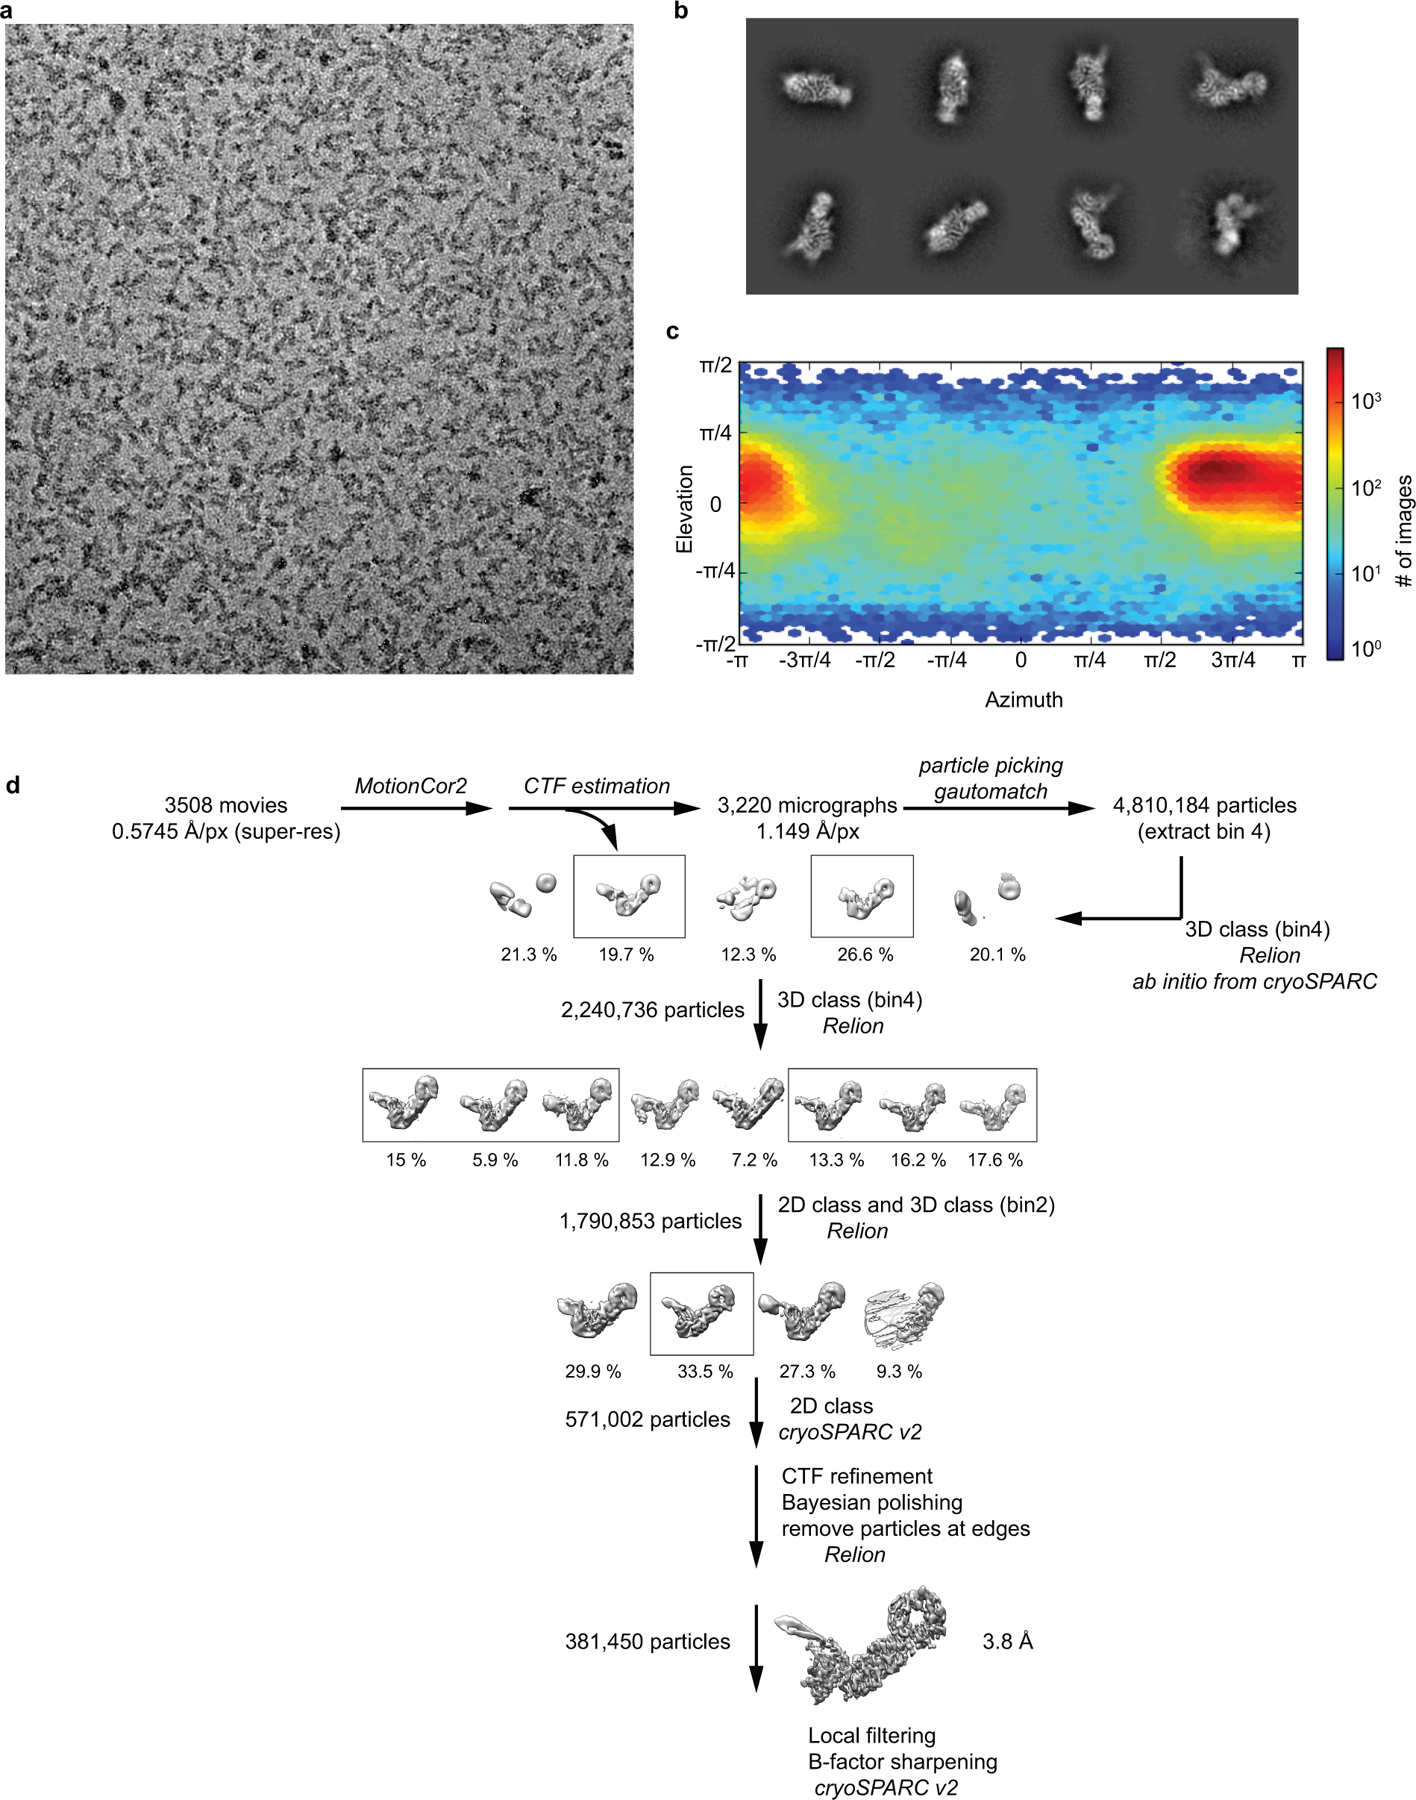
a, A representative cryo-EM micrograph of C9orf72-SMCR8-WDR41 complex. b, Representative 2D classes. c, Orientation distribution of the aligned C9orf72-SMCR8-WDR41 particles. d, Image processing procedure.
Extended Data Fig. 3: Resolution estimation of the cryo-EM map as well as model building and validation.
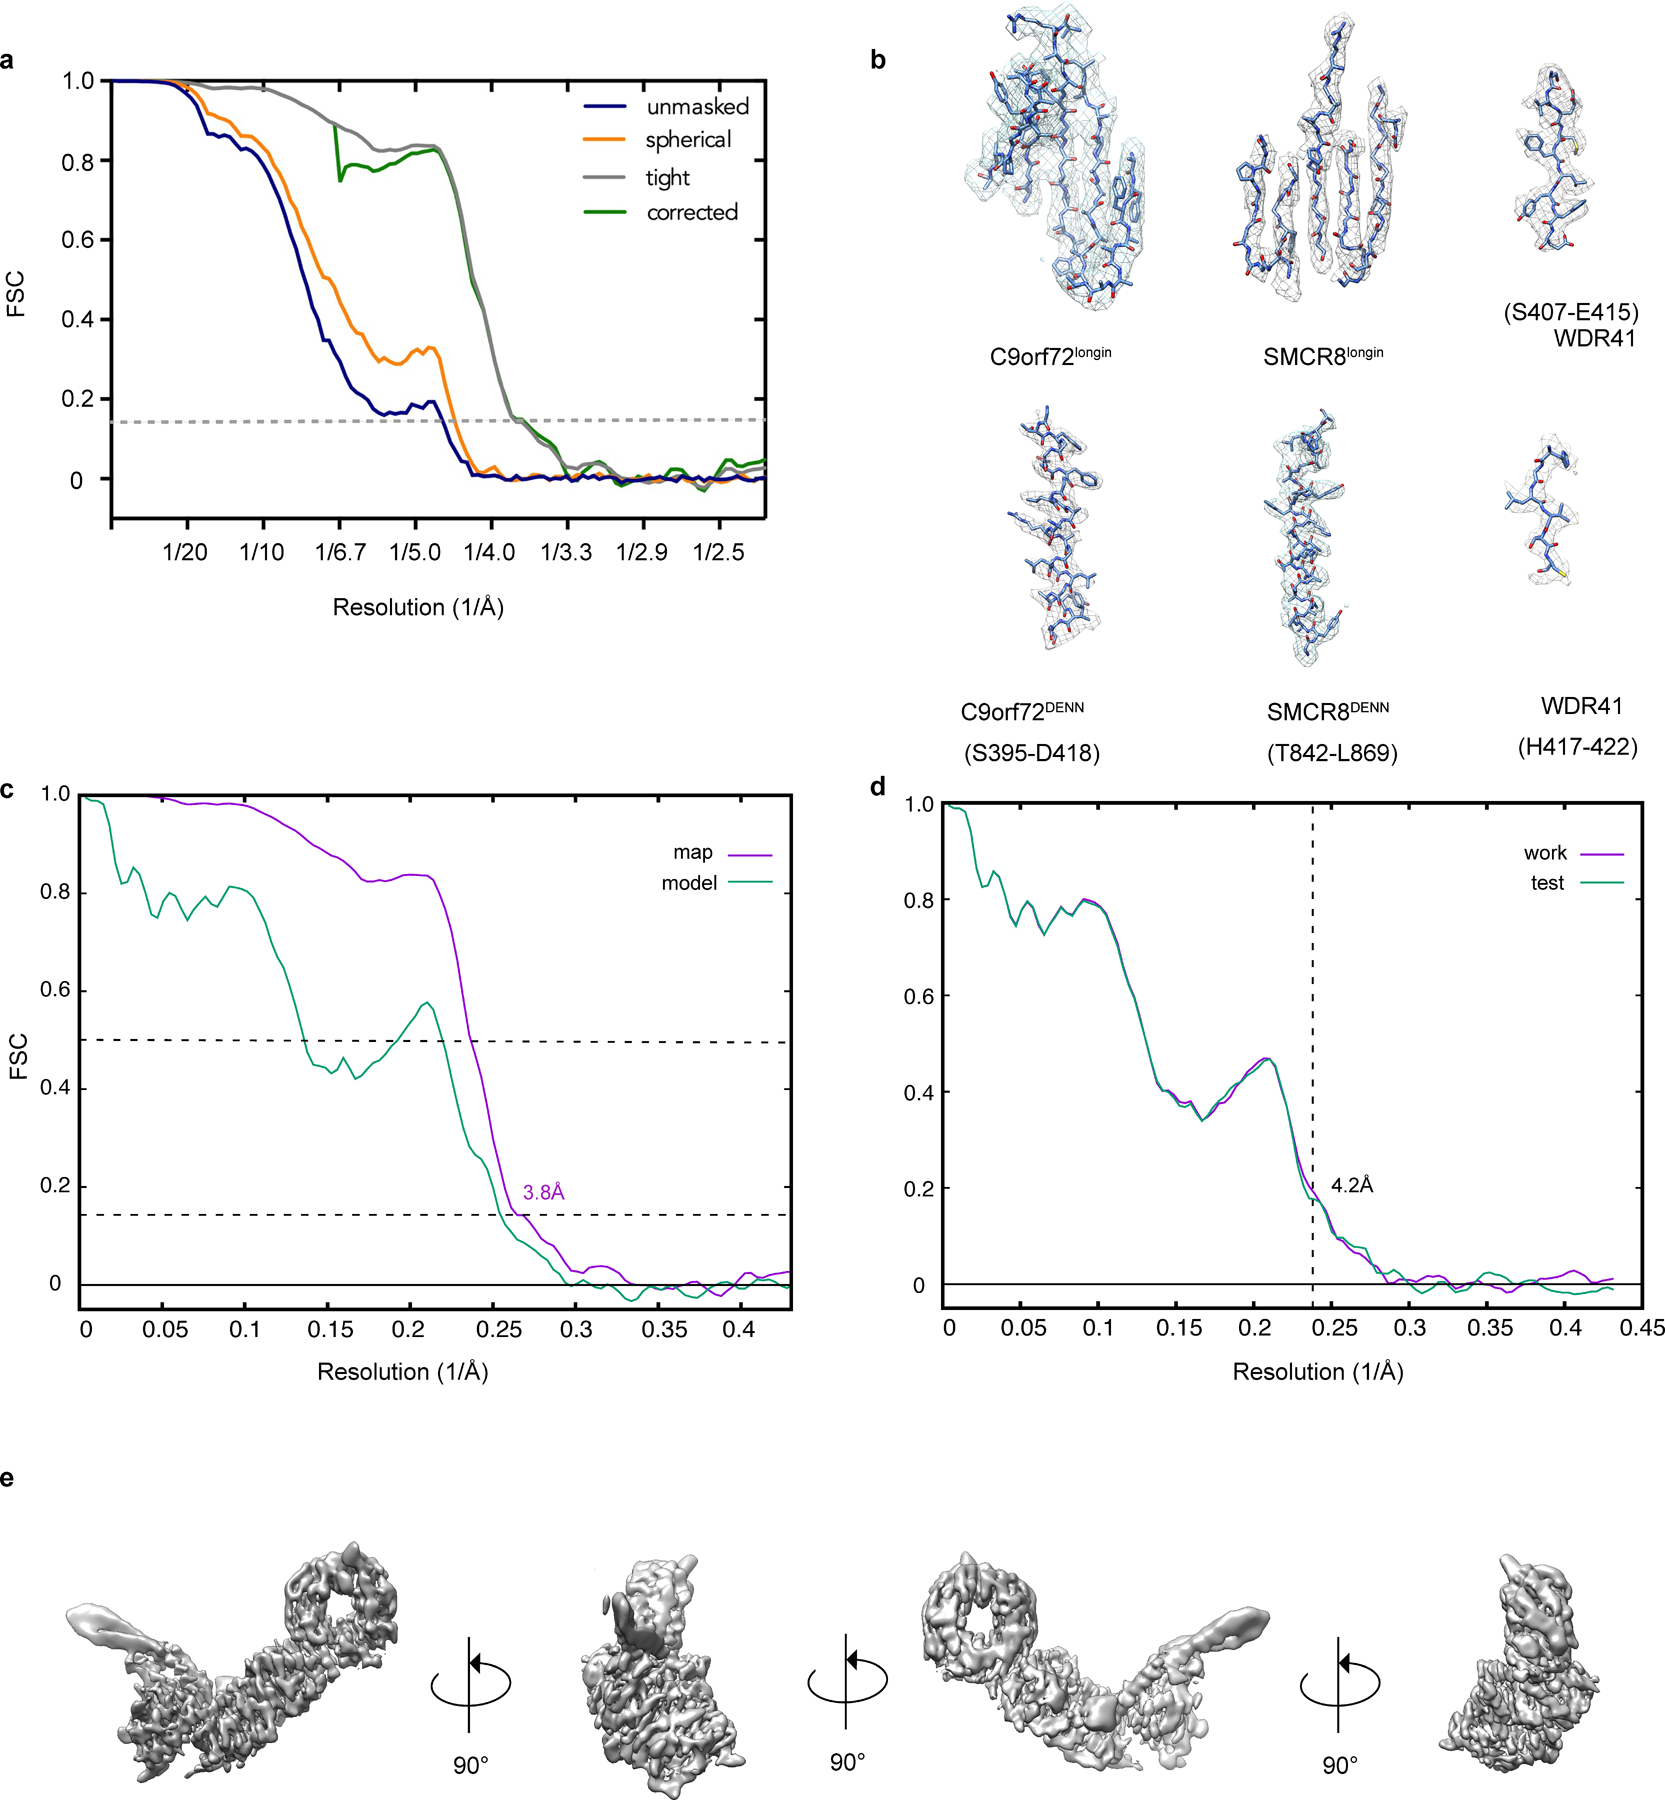
a, Comparison between FSC curves. b, Refined coordinate model fit of the indicated region in the cryo-EM density. c, Refinement and map-vs-model FSC. d, Cross-validation test FSC curves to assess overfitting. The refinement target resolution (4.2 Å) is indicated. e. Different views of the final reconstruction.
Extended Data Fig. 4: Deuterium uptake of C9orf72-SMCR8-WDR41.
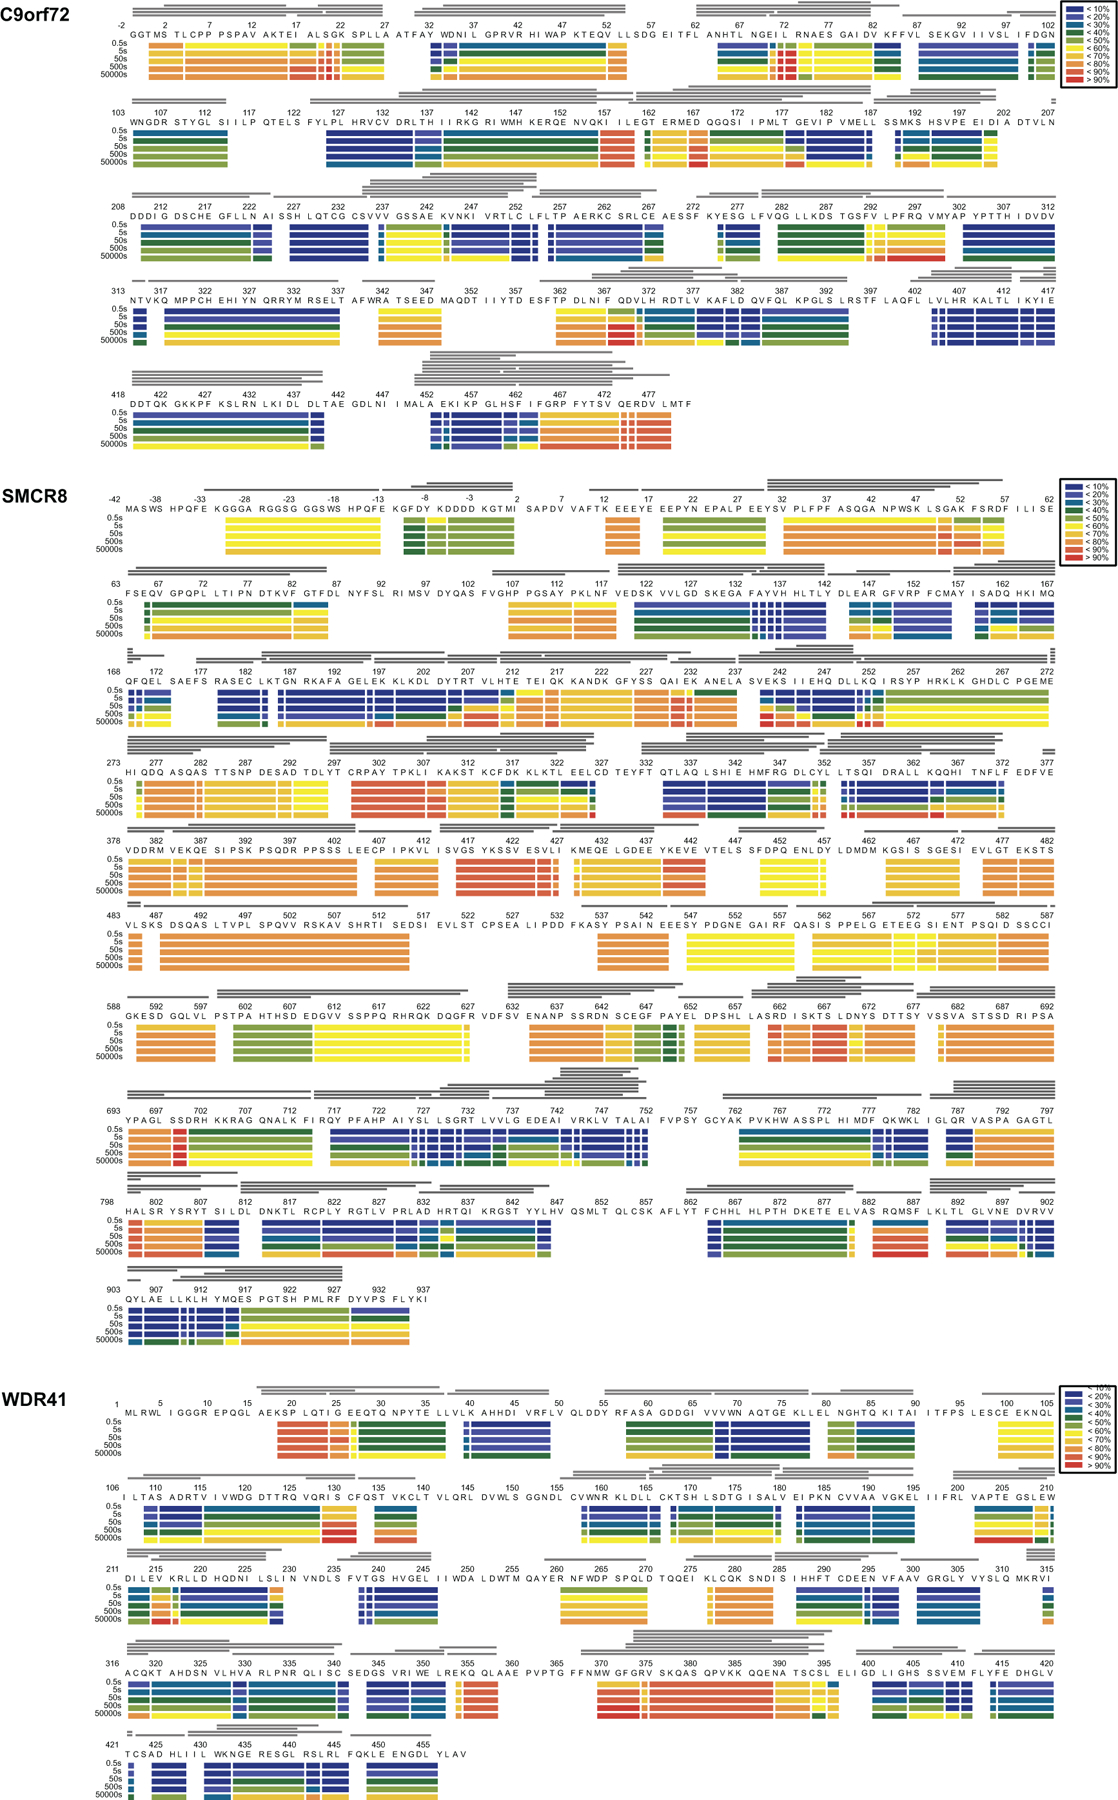
HDX- MS data are shown in heatmap format where peptides were represented using rectangular strips above the protein sequence. Absolute deuterium uptake after 0.5, 5, 50, 500 and 50,000 sec were indicated by a color gradient below the protein sequence.
Extended Data Fig. 5: Deuterium uptake of C9orf72-SMCR8 complex.
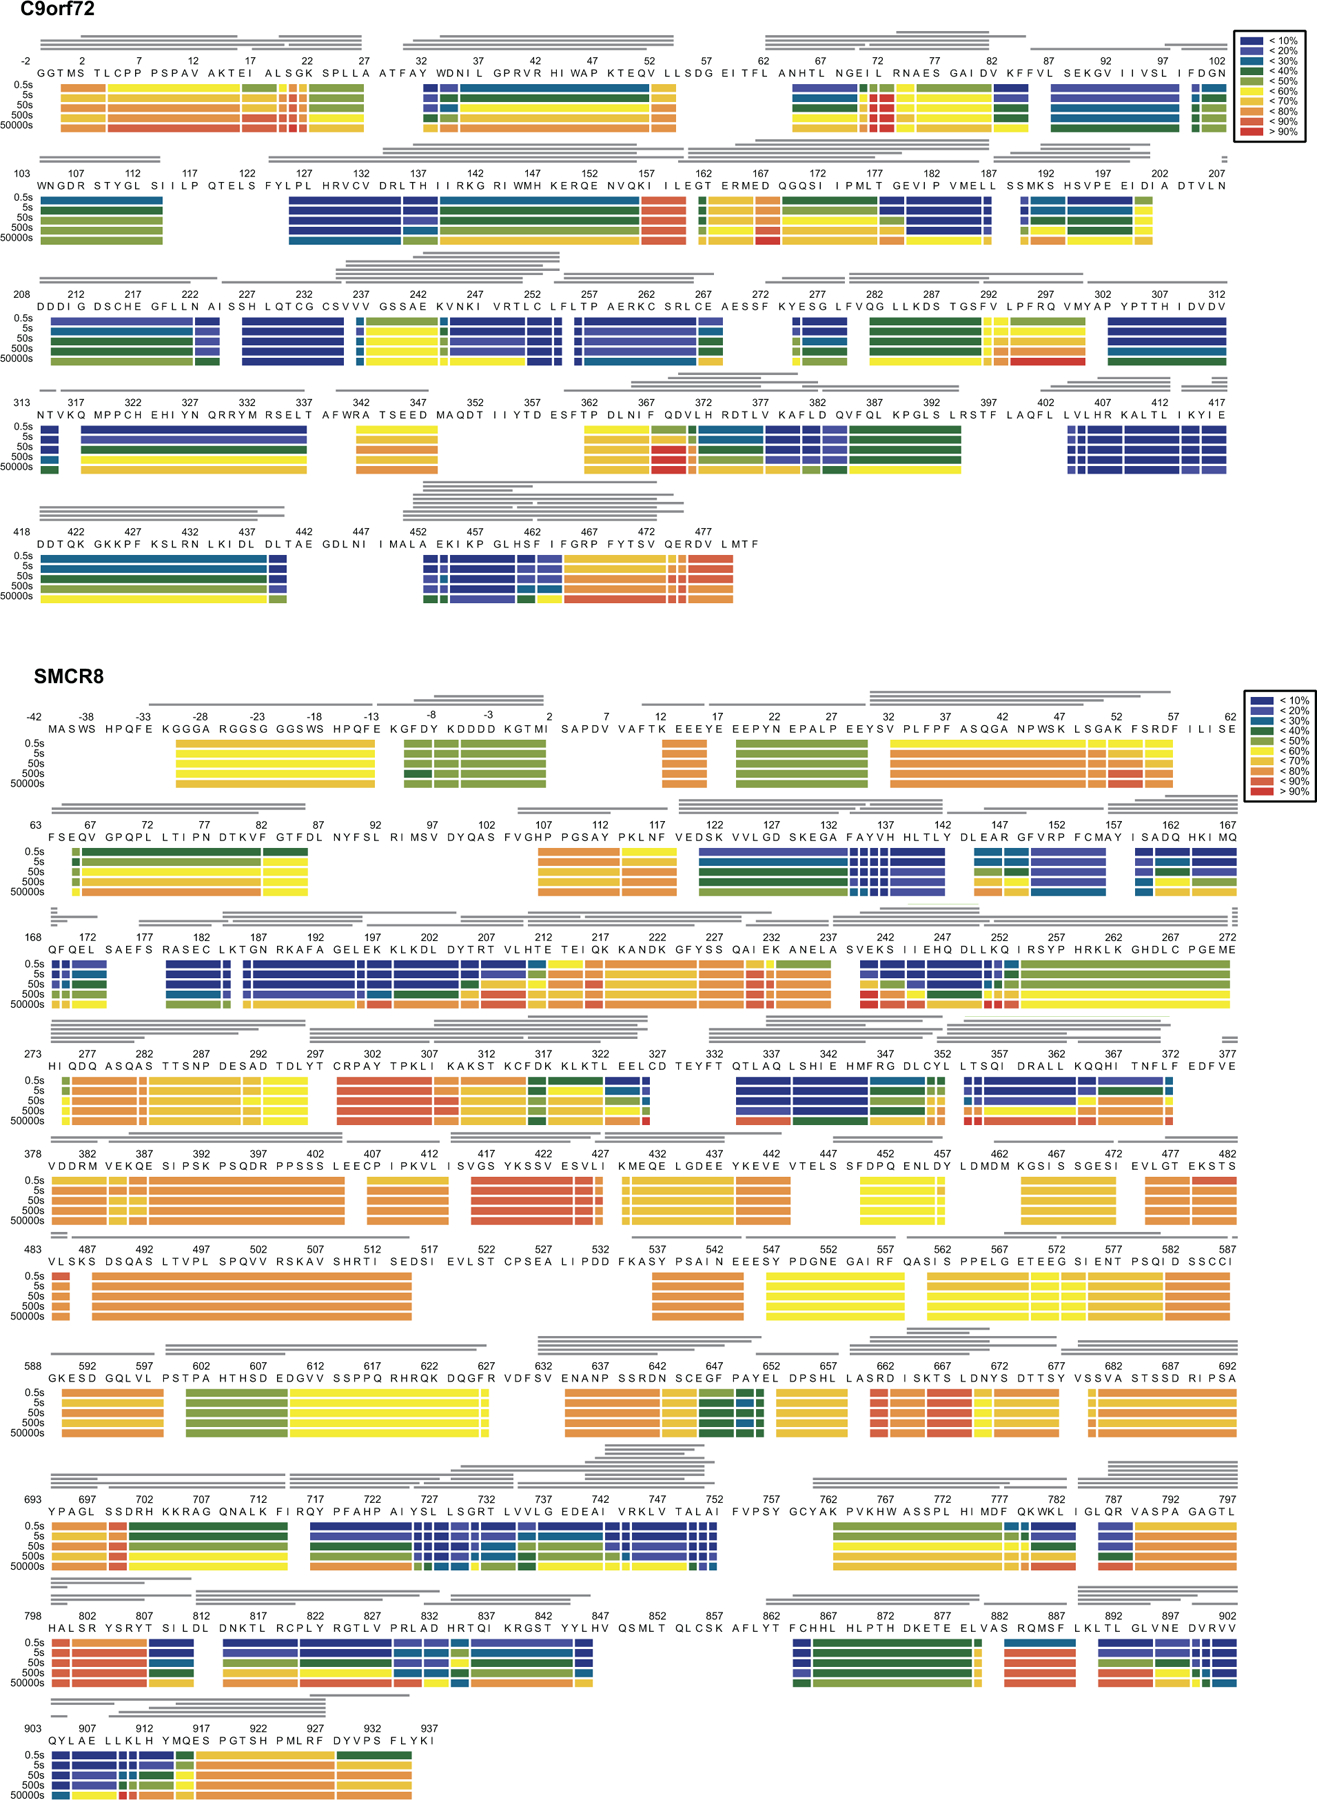
HDX- MS data are shown in heatmap format where peptides were represented using rectangular strips above the protein sequence. Absolute deuterium uptake after 0.5, 5, 50, 500 and 50,000 sec were indicated by a color gradient below the protein sequence.
Extended Data Fig. 6. Mapping the protected region from HDX result on the SMCR8-C9orf72-WDR41 structure.
a, The HDX uptake difference at 0.5 sec was mapped on C9orf72-SMCR8. Close view of SMCR8-WDR41 interface, highlighting the SMCR8 mutants. Close view of b, SMCR8M1, c, SMCR8M2–M5 and d, C9orf72M1 region. e, Zoom in view of WDR41 residues in SMCR8-WDR41 interface.
Extended Data Fig. 7: Coexpression and pull down validation of C9orf72-SMCR8 and SMCR8-WDR41 interface.
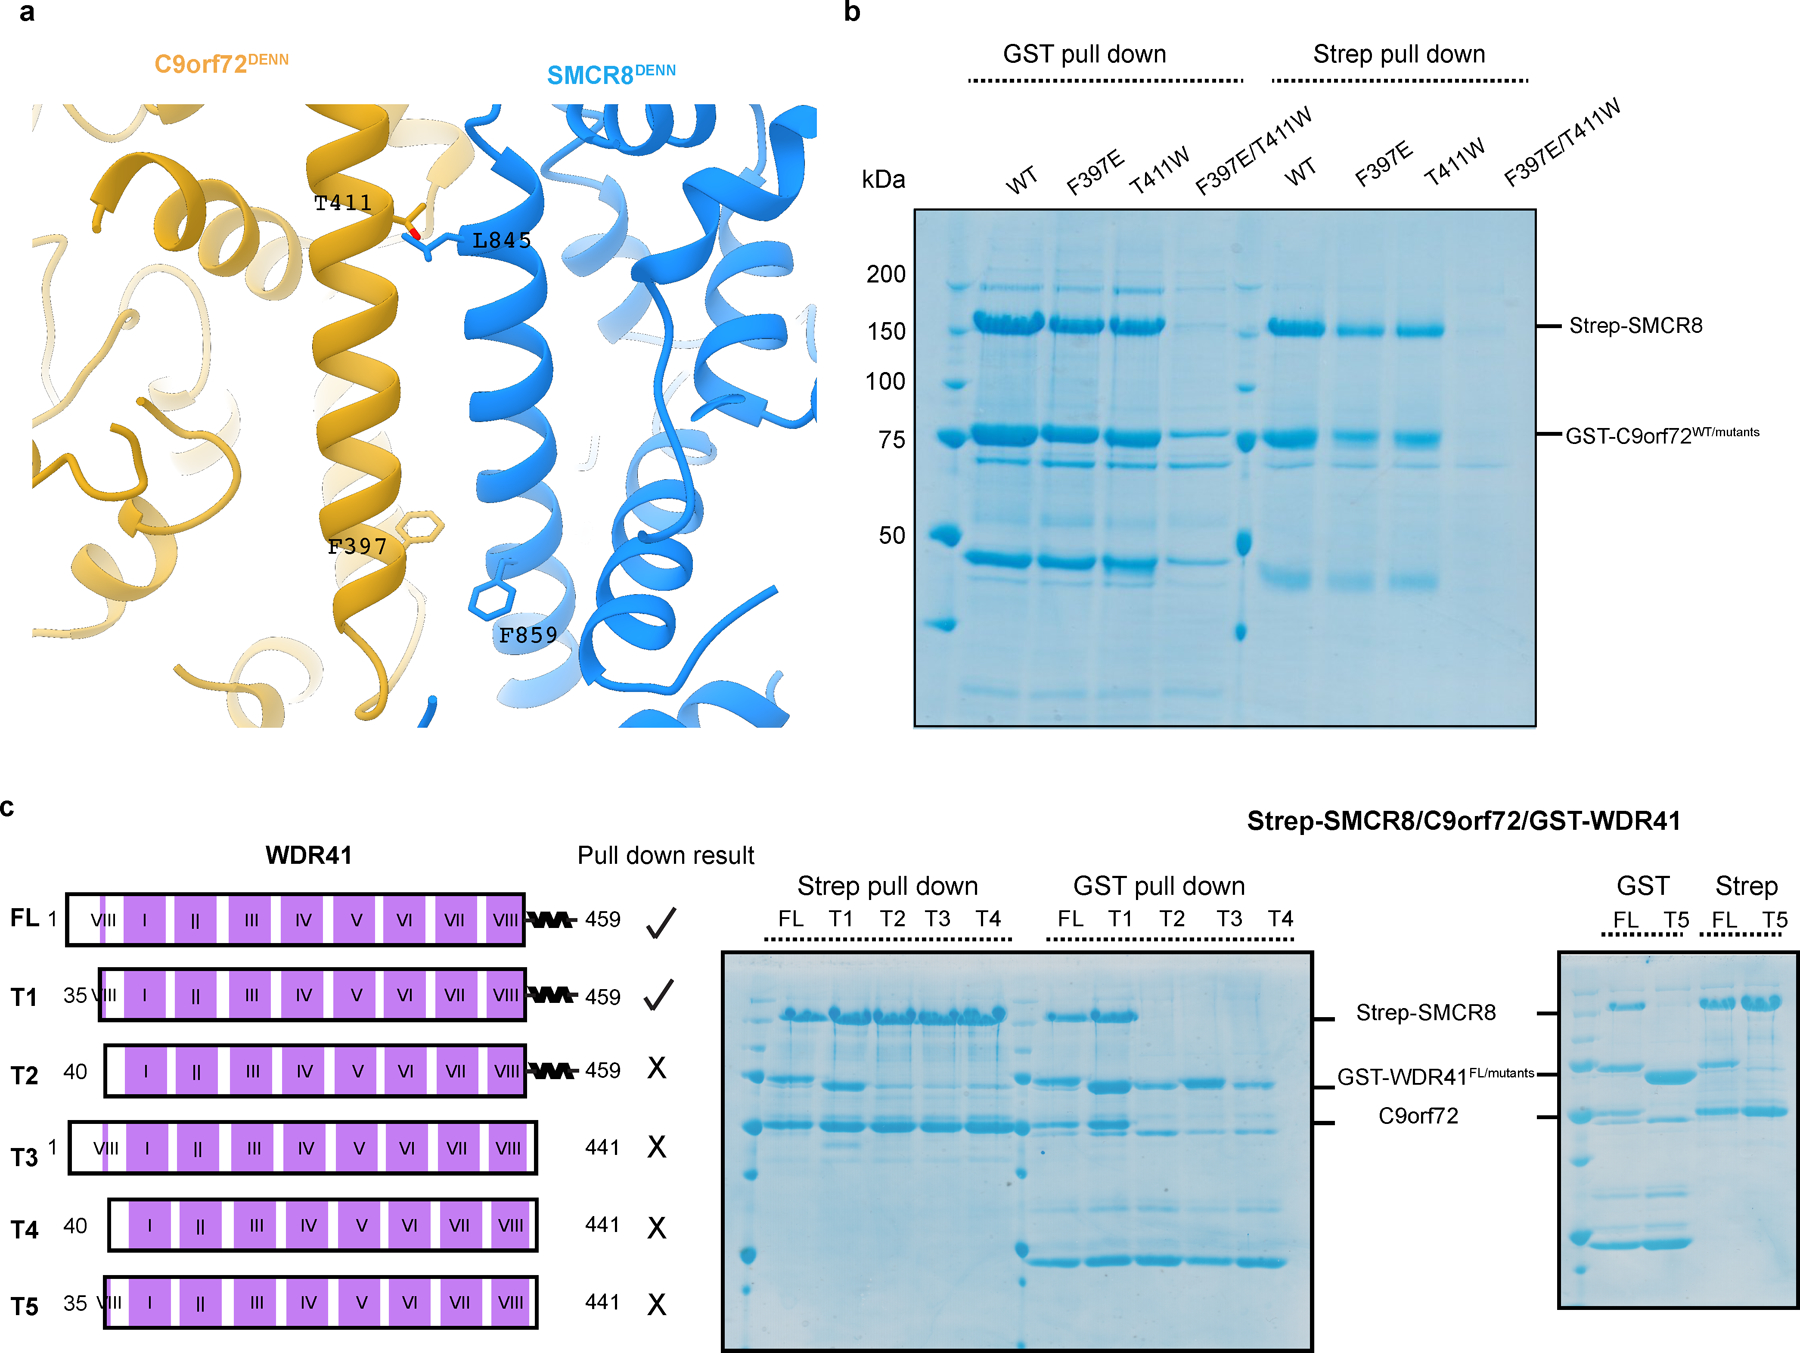
a, Close view of the residues mediating the DENN: DENN dimerization between C9orf72-SMCR8. b, Coexpression and pull down experiment of Strep-tag SMCR8 with GST-C9orf72 mutants and WDR41. c, Pull down experiment of GST-WDR41 mutants with C9orf72-SMCR8. The pull down experiments were carried out at least twice with similar results (b,c).
Extended Data Fig. 8:
Structural comparison between C9orf72-SMCR8 and FNIP2-FLCN.
Extended Data Fig. 9: GTPase assay for different small GTPases with C9orf72-SMCR8-WDR41.
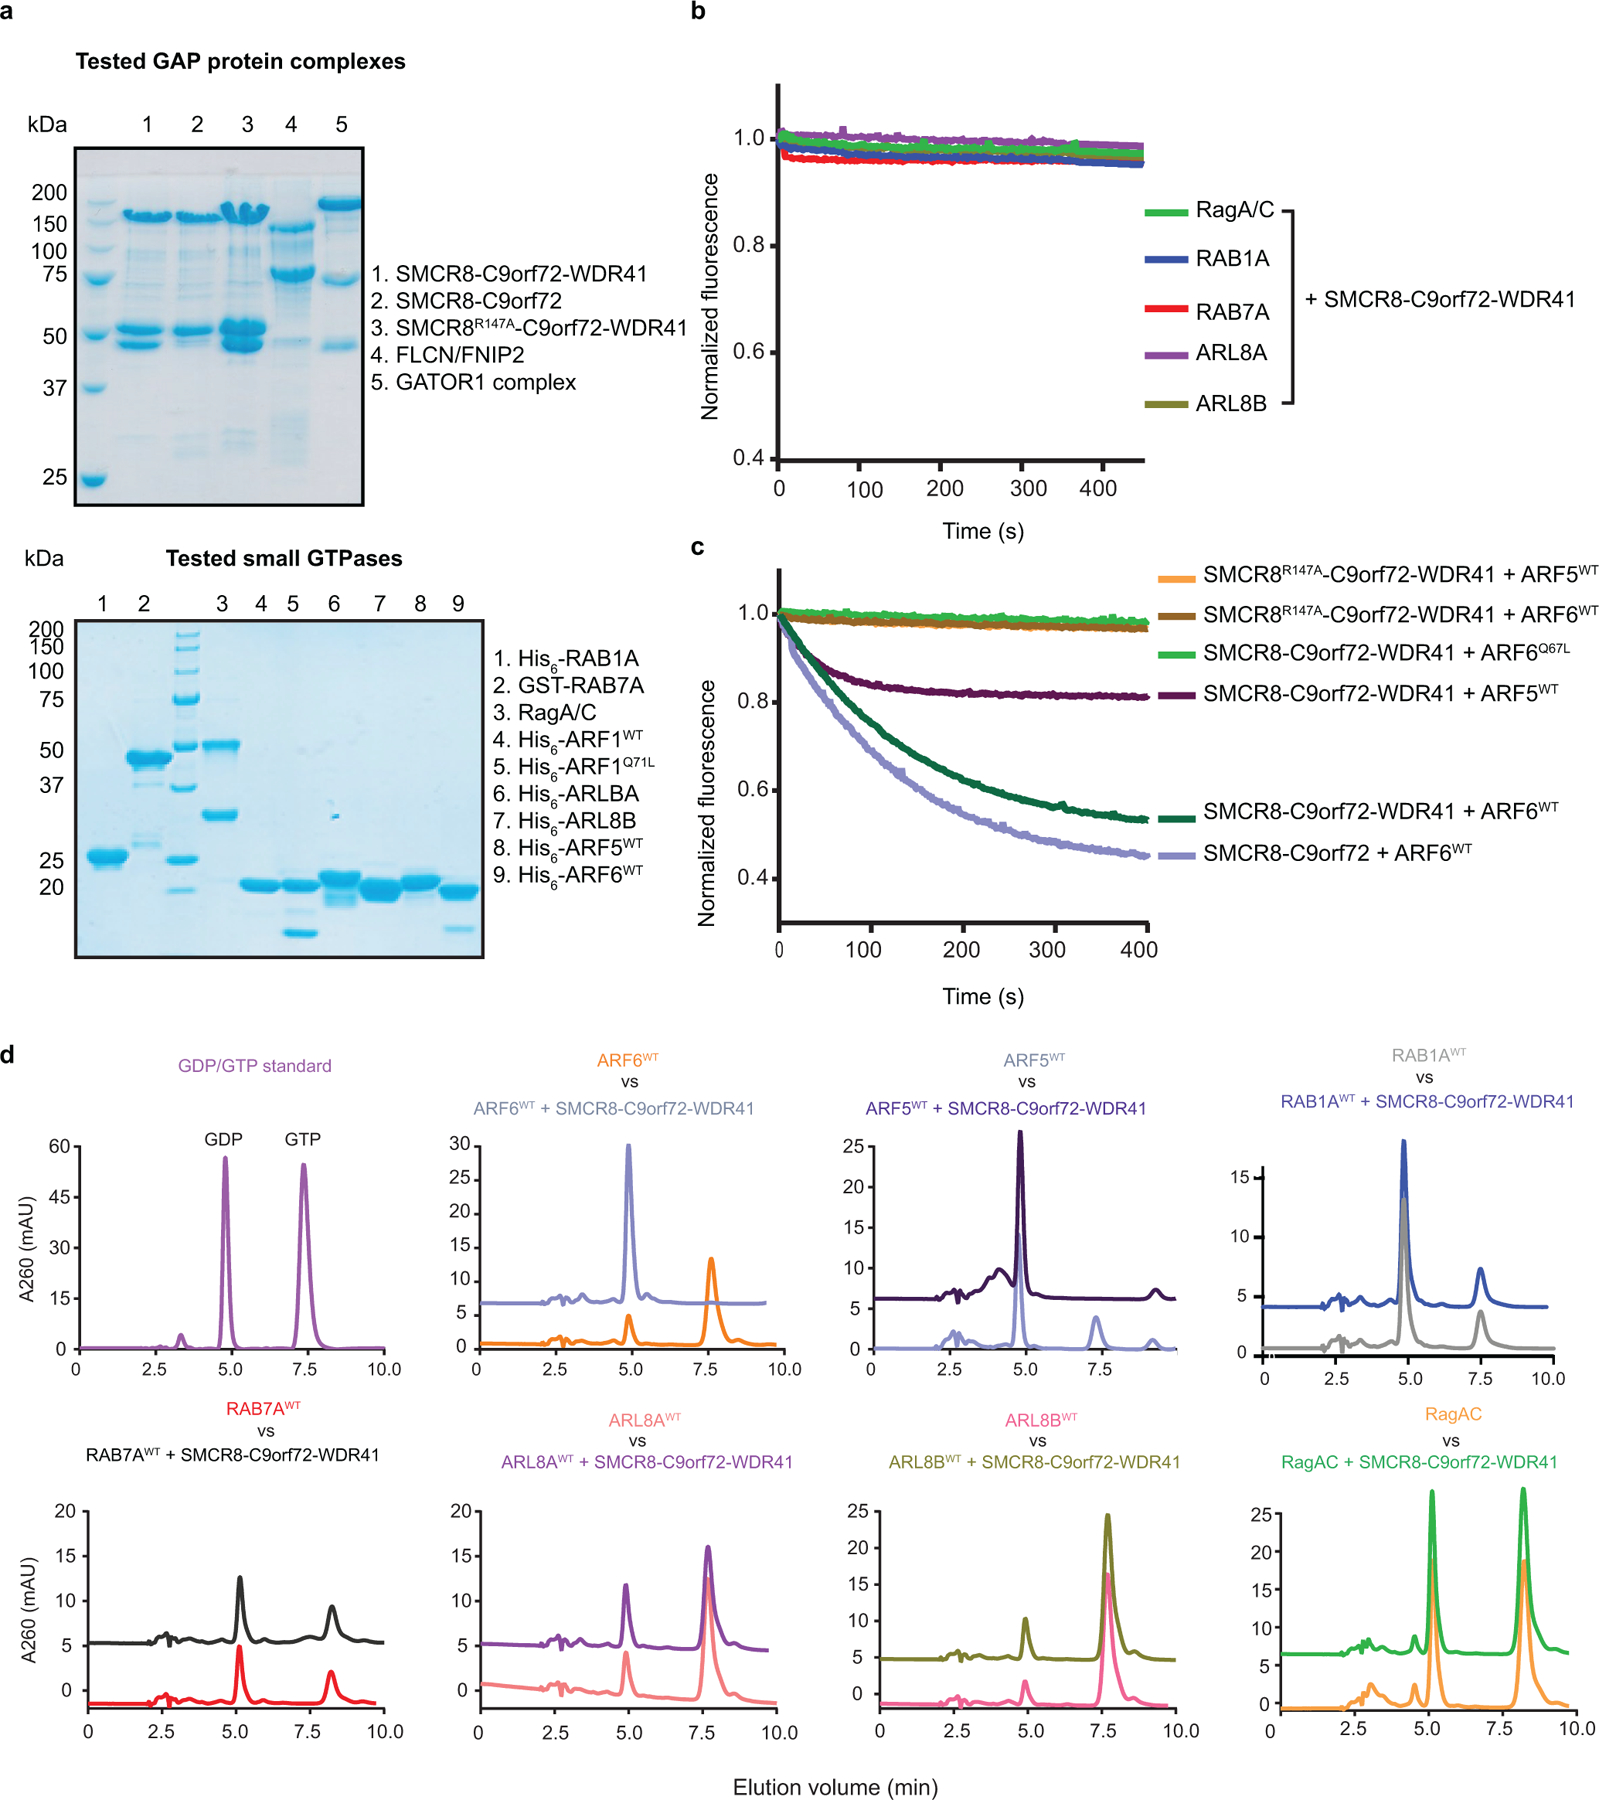
a, SDS-PAGE of GAP protein complex (top) and GTPase proteins (bottom) used in the experiments. b, Tryptophan fluorescence GTPase signal was measured for purified RagA/C, ARL8A, ARL8B, RAB1A and RAB7A before and after addition of C9orf72-SMCR8-WDR41. The fluorescence signal upon GAP addition was normalized to 1 for each experiment. The experiments were carried out in triplicate and one representative plot was plotted. c, Tryptophan fluorescence GTPase signal was measured for purified ARF6WT or Q67L or ARF5WT and before and after addition of C9orf72-SMCR8WT-WDR41. C9orf72-SMCR8R147A- WDR41 or C9orf72-SMCR8WT. d, HPLC-based GTPase assay with ARF6, ARF5, RAB1A, RAB7A, ARL8A, ARL8B and RagA/C proteins in the absence and addition of C9orf72-SMCR8-WDR41 complex as indicated. The experiments were carried out in triplicate and one representative plot was shown. All experiments were carried out at least three times independently with similar results (a-d).
Extended Data Fig. 10:
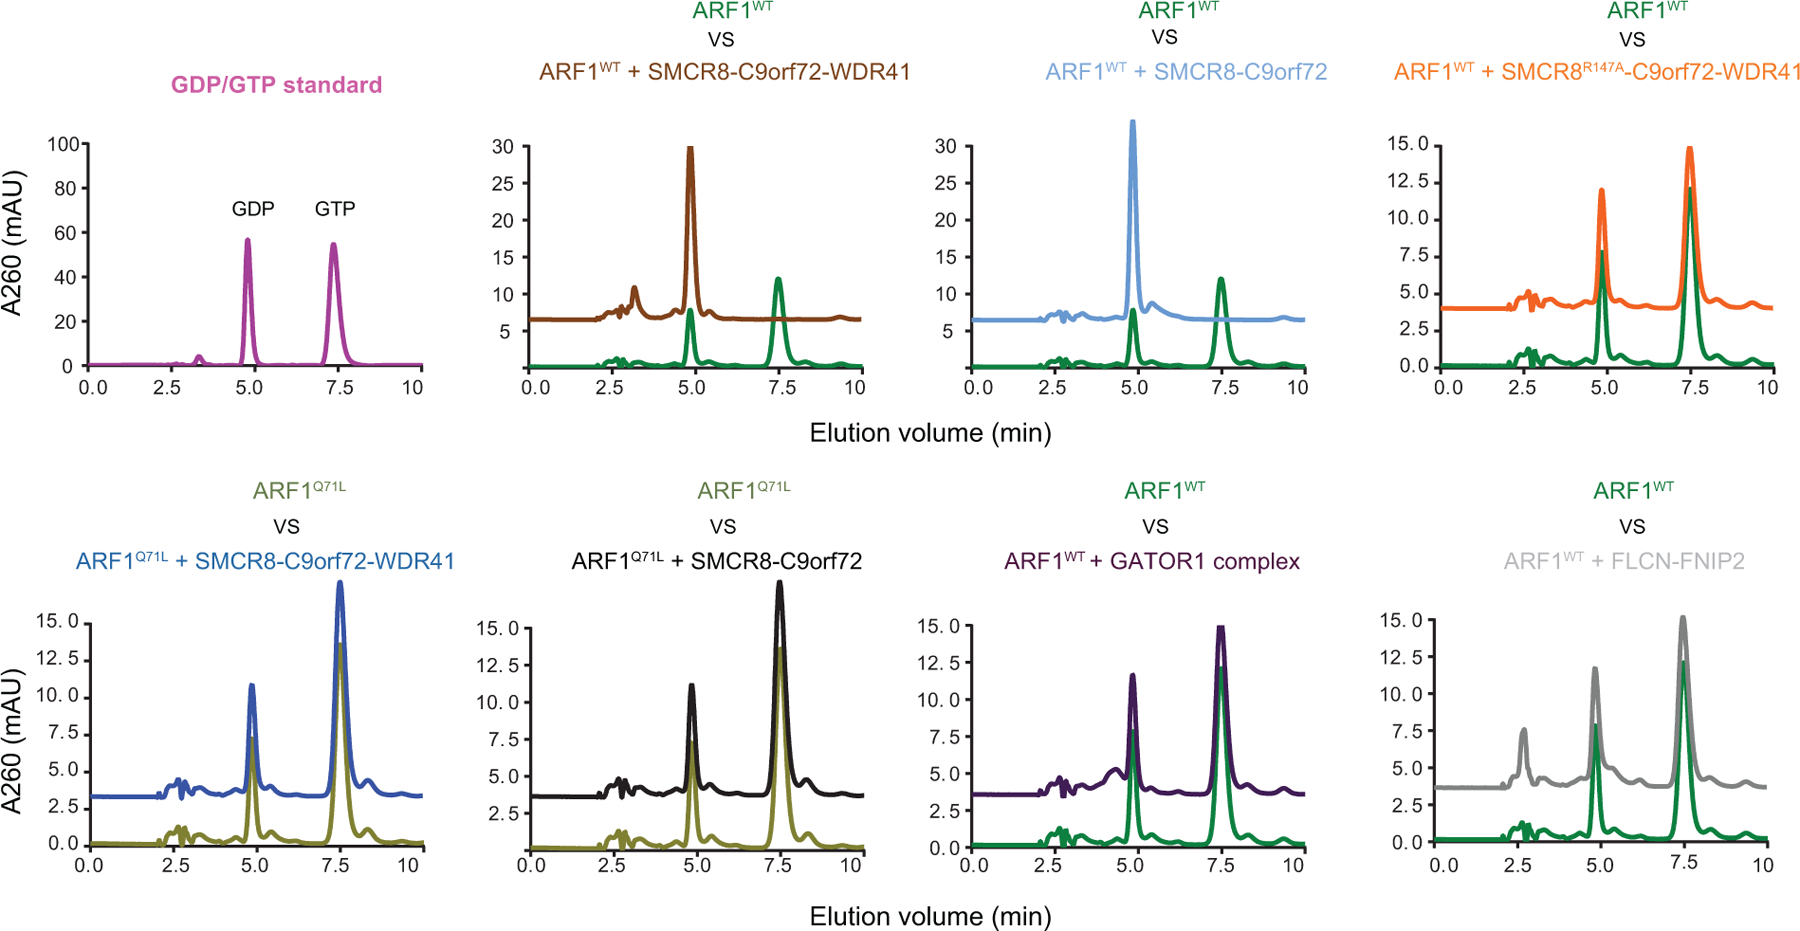
HPLC-based GTPase assay with ARF1WT or Q71L proteins in the absence and addition of GAP complex as indicated. The experiments were carried out in triplicate and one representative plot was shown. All experiments were carried out at least three times independently with similar results.
Extended Data Fig.11: GEF assay for different small GTPases with C9orf72-SMCR8-WDR41.
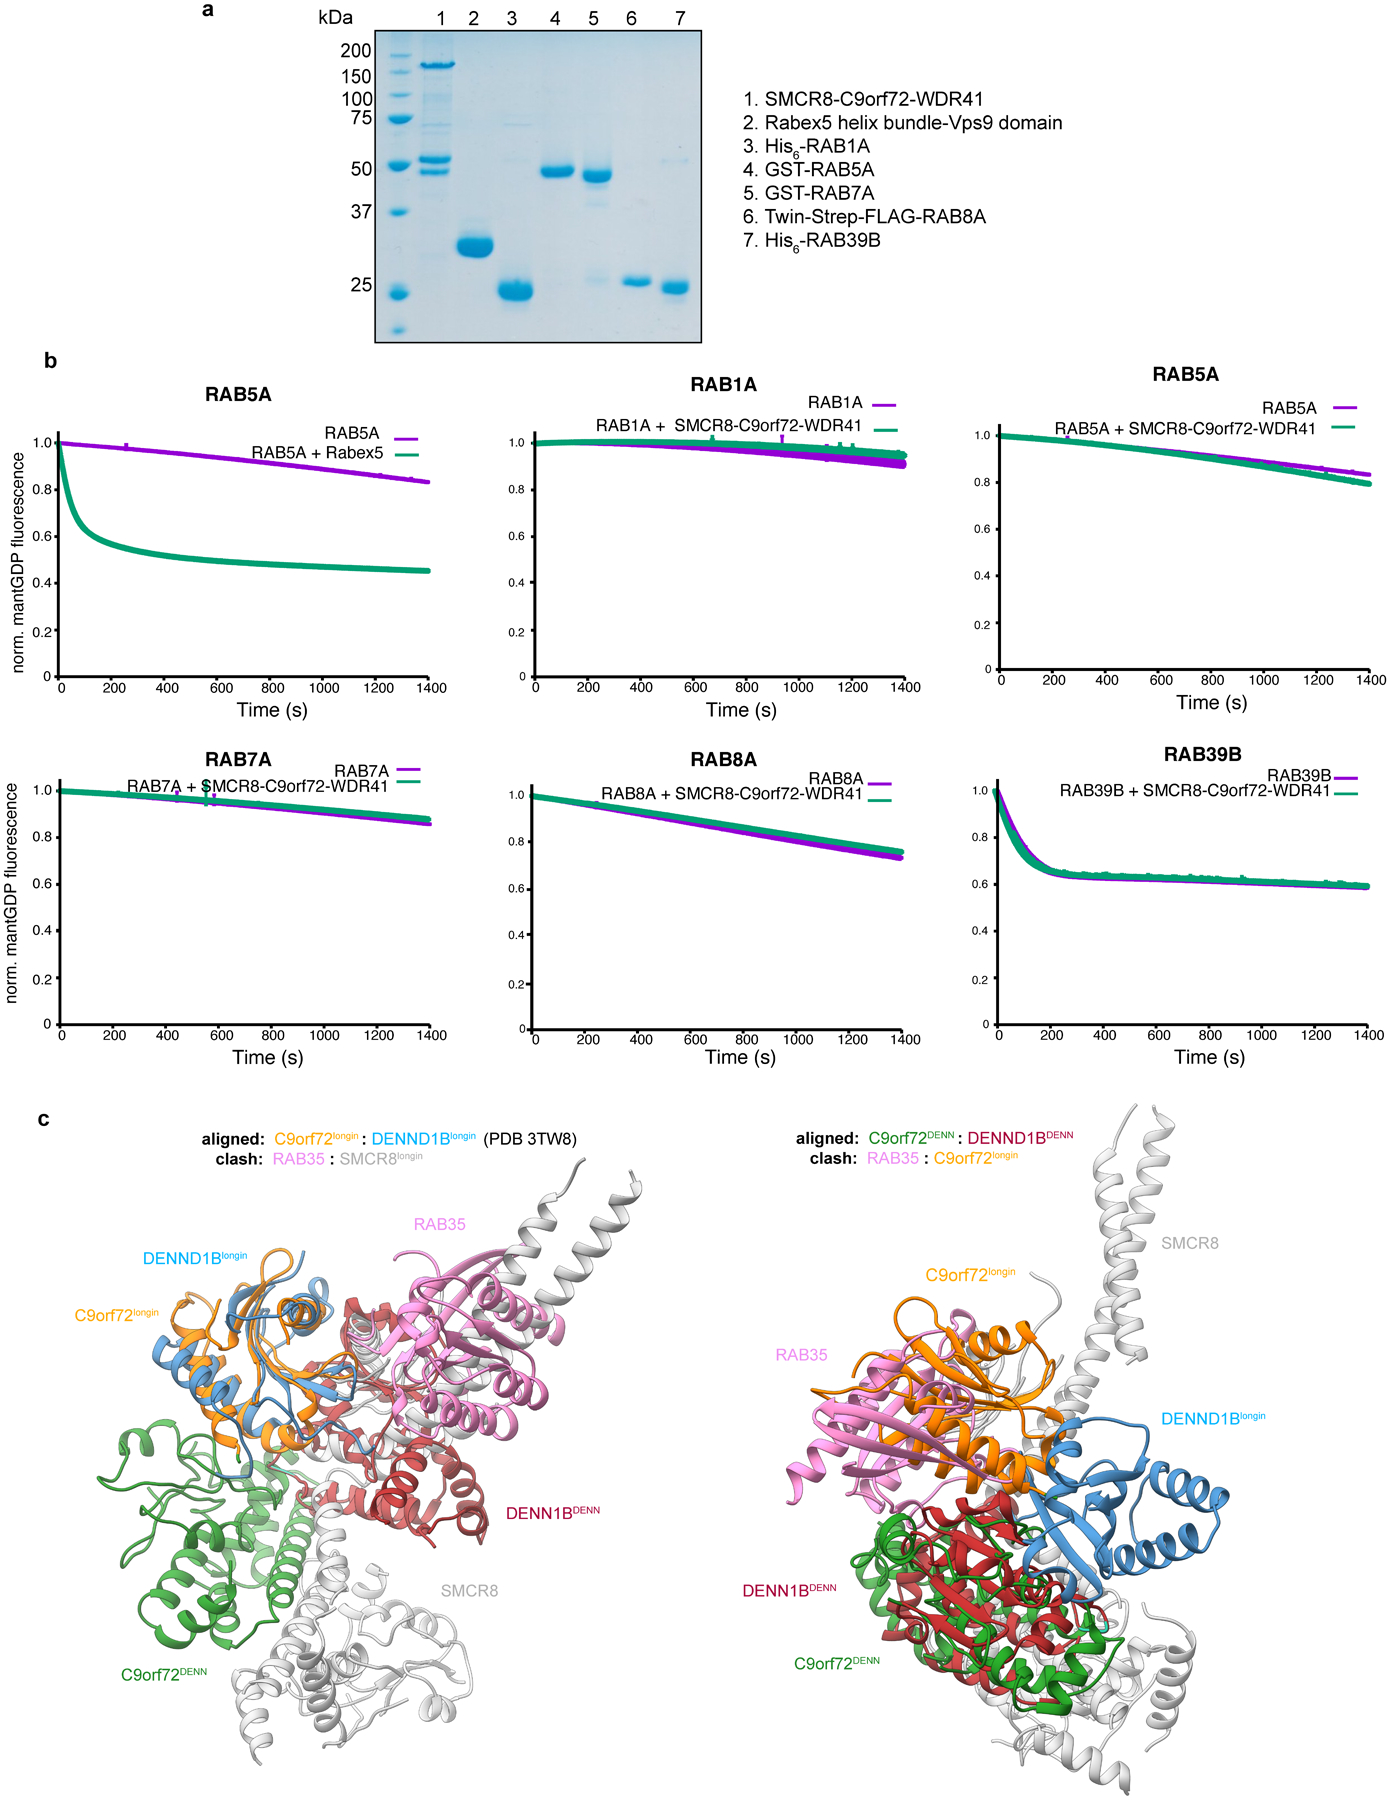
a, SDS-PAGE of C9orf72-SMCR8-WDR41 complex and GTPase proteins used in the experiments. b, GEF assay with mantGDP reloaded RAB1A, RAB5A, RAB7A, RAB8A and RAB39B proteins in the absence and addition of C9orf72-SMCR8-WDR41 complex as indicated. RAB5A treated with Rabex5 was used as a positive control reaction. Data was baseline subtracted and normalized to the signal right after GTP addition which also is the 0 s time point in the plots. Plots were the mean and standard deviation of each technical triplicate experiment. All experiments were carried out at least twice independently with similar results (a,b). c, Structural alignment of C9orf72-SMCR8-WDR41 with DENND1B-RAB35 (PDB 3TW8).
Extended Data Table 1:
Cryo-EM data collection, refinement and validation statistics
| C9orf72-SMCR8-WDR41 (EMDB-21048) (PDB 6V4U) |
|
|---|---|
| Data collection and processing | |
| Magnification (calibrated) | 43,516 |
| Voltage (kV) | 300 |
| Electron exposure (e−/Å2) | 59.6 |
| Defocus range (μm) | 0.06 |
| Pixel size (Å) | 1.149 |
| Symmetry imposed | C1 |
| Initial particle images (no.) | 4,810,184 |
| Final particle images (no.) | 381,450 |
| Map resolution (Å) | 3.80 |
| FSC threshold | 0.143 |
| Map resolution range (Å) | 3.3–11 |
| Refinement | |
| Initial model used (PDB code) | - |
| Model resolution (Å) | 4.5 |
| FSC threshold | 0.5 |
| Model resolution range (Å) | n.a. |
| Map sharpening B factor (Å2) | −50 |
| Model composition | |
| Non-hydrogen atoms | 7,073 |
| Protein residues | 1,106 |
| Ligands | 0 |
| B factors (Å2) | |
| Protein | 108.36 |
| Ligand | |
| R.m.s. deviations | |
| Bond lengths (Å) | 0.002 |
| Bond angles (°) | 0.472 |
| Validation | |
| MolProbity score | 1.60 |
| Clashscore | 4.14 |
| Poor retainers (%) | 0 |
| Ramachandran plot | |
| Favored (%) | 93.89 |
| Allowed (%) | 6.11 |
| Disallowed (%) | 0.00 |
Supplementary Material
Acknowledgments:
We thank D. Toso, K. L. Morris, V. Kasinath and P. Tobias for cryo-EM advice and support, X. Shi for HDX support, C. Behrends and G. Stjepanovic for suggestions and contributions to the early stages of the project, R. Lawrence and M. Lehmer for cell imaging advice, and X. Ren for assistance with cloning. This work was supported by NIH grants R01GM111730 (J.H.H.) and R01GM130995 (R.Z.), Department of Defense Peer Reviewed Medical Research Program Discovery Award W81XWH2010086 (J.H.H.), the Bakar Fellows program (J.H.H.), the Pew-Stewart Scholarship for Cancer Research and Damon Runyon-Rachleff Innovation Award (R.Z.), a postdoctoral fellowship from the Association for Frontotemporal Degeneration (M.-Y.S.) and an EMBO Long-Term Fellowship (S.A.F.).
J.H.H. is a scientific founder and receives research funding from Casma Therapeutics. R.Z. is co-founder and stockholder in Frontier Medicines Corp.
Footnotes
Data availability:
EM density map has been deposited in the EMDB with accession number EMD-21048. Atomic coordinates for C9orf72-SMCR8-WDR41 have been deposited in the PDB with accession number 6V4U.
References:
- 1.Majounie E et al. Frequency of the C9orf72 hexanucleotide repeat expansion in patients with amyotrophic lateral sclerosis and frontotemporal dementia: a cross-sectional study. Lancet Neurol 11, 323–330 (2012). [DOI] [PMC free article] [PubMed] [Google Scholar]
- 2.DeJesus-Hernandez M et al. Expanded GGGGCC hexanucleotide repeat in noncoding region of C9ORF72 causes chromosome 9p-linked FTD and ALS. Neuron 72, 245–256 (2011). [DOI] [PMC free article] [PubMed] [Google Scholar]
- 3.Renton AE et al. A hexanucleotide repeat expansion in C9ORF72 is the cause of chromosome 9p21-linked ALS-FTD. Neuron 72, 257–268 (2011). [DOI] [PMC free article] [PubMed] [Google Scholar]
- 4.O’Rourke JG et al. C9orf72 is required for proper macrophage and microglial function in mice. Science (New York, N.Y.) 351, 1324–1329 (2016). [DOI] [PMC free article] [PubMed] [Google Scholar]
- 5.Sivadasan R et al. C9ORF72 interaction with cofilin modulates actin dynamics in motor neurons. Nature neuroscience 19, 1610–1618 (2016). [DOI] [PubMed] [Google Scholar]
- 6.Shi Y et al. Haploinsufficiency leads to neurodegeneration in C9ORF72 ALS/FTD human induced motor neurons. Nat Med 24, 313–325 (2018). [DOI] [PMC free article] [PubMed] [Google Scholar]
- 7.Zhang D, Iyer LM, He F & Aravind L Discovery of Novel DENN Proteins: Implications for the Evolution of Eukaryotic Intracellular Membrane Structures and Human Disease. Front Genet 3, 283 (2012). [DOI] [PMC free article] [PubMed] [Google Scholar]
- 8.Sellier C et al. Loss of C9ORF72 impairs autophagy and synergizes with polyQ Ataxin-2 to induce motor neuron dysfunction and cell death. EMBO J 35, 1276–1297 (2016). [DOI] [PMC free article] [PubMed] [Google Scholar]
- 9.Sullivan PM et al. The ALS/FTLD associated protein C9orf72 associates with SMCR8 and WDR41 to regulate the autophagy-lysosome pathway. Acta Neuropathol Commun 4, 51 (2016). [DOI] [PMC free article] [PubMed] [Google Scholar]
- 10.Amick J, Roczniak-Ferguson A & Ferguson SM C9orf72 binds SMCR8, localizes to lysosomes, and regulates mTORC1 signaling. Mol Biol Cell 27, 3040–3051 (2016). [DOI] [PMC free article] [PubMed] [Google Scholar]
- 11.Ugolino J et al. Loss of C9orf72 Enhances Autophagic Activity via Deregulated mTOR and TFEB Signaling. PLoS Genet 12, e1006443 (2016). [DOI] [PMC free article] [PubMed] [Google Scholar]
- 12.Yang M et al. A C9ORF72/SMCR8-containing complex regulates ULK1 and plays a dual role in autophagy. Sci Adv 2, e1601167 (2016). [DOI] [PMC free article] [PubMed] [Google Scholar]
- 13.Jung J et al. Multiplex image-based autophagy RNAi screening identifies SMCR8 as ULK1 kinase activity and gene expression regulator. Elife 6 (2017). [DOI] [PMC free article] [PubMed] [Google Scholar]
- 14.Amick J, Tharkeshwar AK, Amaya C & Ferguson SM WDR41 supports lysosomal response to changes in amino acid availability. Mol Biol Cell 29, 2213–2227 (2018). [DOI] [PMC free article] [PubMed] [Google Scholar]
- 15.Amick J, Tharkeshwar AK, Talaia G & Ferguson SM PQLC2 recruits the C9orf72 complex to lysosomes in response to cationic amino acid starvation. The Journal of cell biology 219 (2020). [DOI] [PMC free article] [PubMed] [Google Scholar]
- 16.Farg MA et al. C9ORF72, implicated in amytrophic lateral sclerosis and frontotemporal dementia, regulates endosomal trafficking. Human molecular genetics 23, 3579–3595 (2014). [DOI] [PMC free article] [PubMed] [Google Scholar]
- 17.Webster CP et al. The C9orf72 protein interacts with Rab1a and the ULK1 complex to regulate initiation of autophagy. Embo Journal 35, 1656–1676 (2016). [DOI] [PMC free article] [PubMed] [Google Scholar]
- 18.Lan Y, Sullivan PM & Hu F SMCR8 negatively regulates AKT and MTORC1 signaling to modulate lysosome biogenesis and tissue homeostasis. Autophagy 15, 871–885 (2019). [DOI] [PMC free article] [PubMed] [Google Scholar]
- 19.Shen K et al. Architecture of the human GATOR1 and GATOR1-Rag GTPases complexes. Nature 556, 64–69 (2018). [DOI] [PMC free article] [PubMed] [Google Scholar]
- 20.Lawrence RE et al. Structural mechanism of a Rag GTPase activation checkpoint by the lysosomal folliculin complex. Science (New York, N.Y.) (2019). [DOI] [PMC free article] [PubMed] [Google Scholar]
- 21.Shen K et al. Cryo-EM Structure of the Human FLCN-FNIP2-Rag-Ragulator Complex. Cell (2019). [DOI] [PMC free article] [PubMed] [Google Scholar]
- 22.Bar-Peled L et al. A Tumor Suppressor Complex with GAP Activity for the Rag GTPases That Signal Amino Acid Sufficiency to mTORC1. Science (New York, N.Y.) 340, 1100–1106 (2013). [DOI] [PMC free article] [PubMed] [Google Scholar]
- 23.Tsun ZY et al. The Folliculin Tumor Suppressor Is a GAP for the RagC/D GTPases That Signal Amino Acid Levels to mTORC1. Molecular Cell 52, 495–505 (2013). [DOI] [PMC free article] [PubMed] [Google Scholar]
- 24.Shen K, Valenstein ML, Gu X & Sabatini DM Arg78 of Nprl2 catalyzes GATOR1-stimulated GTP hydrolysis by the Rag GTPases. The Journal of biological chemistry (2019). [DOI] [PMC free article] [PubMed] [Google Scholar]
- 25.Sztul E et al. ARF GTPases and their GEFs and GAPs: concepts and challenges. Mol Biol Cell 30, 1249–1271 (2019). [DOI] [PMC free article] [PubMed] [Google Scholar]
- 26.Iyer S, Subramanian V & Acharya KR C9orf72, a protein associated with amyotrophic lateral sclerosis (ALS) is a guanine nucleotide exchange factor. PeerJ 6, e5815 (2018). [DOI] [PMC free article] [PubMed] [Google Scholar]
- 27.Wu X et al. Insights regarding guanine nucleotide exchange from the structure of a DENN-domain protein complexed with its Rab GTPase substrate. Proc Natl Acad Sci U S A 108, 18672–18677 (2011). [DOI] [PMC free article] [PubMed] [Google Scholar]
- 28.Corrionero A & Horvitz HR A C9orf72 ALS/FTD Ortholog Acts in Endolysosomal Degradation and Lysosomal Homeostasis. Current biology : CB 28, 1522–1535 e1525 (2018). [DOI] [PubMed] [Google Scholar]
- 29.Jewell JL et al. Metabolism. Differential regulation of mTORC1 by leucine and glutamine. Science (New York, N.Y.) 347, 194–198 (2015). [DOI] [PMC free article] [PubMed] [Google Scholar]
- 30.Nixon RA The role of autophagy in neurodegenerative disease. Nature Medicine 19, 983–997 (2013). [DOI] [PubMed] [Google Scholar]
- 31.Tang D et al. Cryo-EM structure of C9ORF72-SMCR8-WDR41 reveals the role as a GAP for Rab8a and Rab11a. Proc Natl Acad Sci U S A (2020). [DOI] [PMC free article] [PubMed] [Google Scholar]
- 32.Biyani N et al. Focus: The interface between data collection and data processing in cryo-EM. J Struct Biol 198, 124–133 (2017). [DOI] [PubMed] [Google Scholar]
- 33.Zheng SQ et al. MotionCor2: anisotropic correction of beam-induced motion for improved cryo-electron microscopy. Nat Methods 14, 331–332 (2017). [DOI] [PMC free article] [PubMed] [Google Scholar]
- 34.Zhang K Gctf: Real-time CTF determination and correction. J Struct Biol 193, 1–12 (2016). [DOI] [PMC free article] [PubMed] [Google Scholar]
- 35.Zivanov J et al. New tools for automated high-resolution cryo-EM structure determination in RELION-3. Elife 7 (2018). [DOI] [PMC free article] [PubMed] [Google Scholar]
- 36.Punjani A, Rubinstein JL, Fleet DJ & Brubaker MA cryoSPARC: algorithms for rapid unsupervised cryo-EM structure determination. Nat Methods 14, 290–296 (2017). [DOI] [PubMed] [Google Scholar]
- 37.Zhang Y I-TASSER server for protein 3D structure prediction. BMC Bioinformatics 9, 40 (2008). [DOI] [PMC free article] [PubMed] [Google Scholar]
- 38.Webb B & Sali A Protein structure modeling with MODELLER. Methods Mol Biol 1137, 1–15 (2014). [DOI] [PubMed] [Google Scholar]
- 39.Peng J & Xu J RaptorX: exploiting structure information for protein alignment by statistical inference. Proteins 79 Suppl 10, 161–171 (2011). [DOI] [PMC free article] [PubMed] [Google Scholar]
- 40.Kelley LA, Mezulis S, Yates CM, Wass MN & Sternberg MJ The Phyre2 web portal for protein modeling, prediction and analysis. Nat Protoc 10, 845–858 (2015). [DOI] [PMC free article] [PubMed] [Google Scholar]
- 41.McGuffin LJ, Bryson K & Jones DT The PSIPRED protein structure prediction server. Bioinformatics 16, 404–405 (2000). [DOI] [PubMed] [Google Scholar]
- 42.Pettersen EF et al. UCSF Chimera--a visualization system for exploratory research and analysis. J Comput Chem 25, 1605–1612 (2004). [DOI] [PubMed] [Google Scholar]
- 43.Emsley P & Cowtan K Coot: model-building tools for molecular graphics. Acta Crystallogr D Biol Crystallogr 60, 2126–2132 (2004). [DOI] [PubMed] [Google Scholar]
- 44.Afonine PV et al. Real-space refinement in PHENIX for cryo-EM and crystallography. Acta Crystallogr D Struct Biol 74, 531–544 (2018). [DOI] [PMC free article] [PubMed] [Google Scholar]
- 45.Adams PD et al. PHENIX: a comprehensive Python-based system for macromolecular structure solution. Acta Crystallogr D Biol Crystallogr 66, 213–221 (2010). [DOI] [PMC free article] [PubMed] [Google Scholar]
- 46.Chen VB et al. MolProbity: all-atom structure validation for macromolecular crystallography. Acta Crystallogr D Biol Crystallogr 66, 12–21 (2010). [DOI] [PMC free article] [PubMed] [Google Scholar]
Associated Data
This section collects any data citations, data availability statements, or supplementary materials included in this article.