Figure 6.

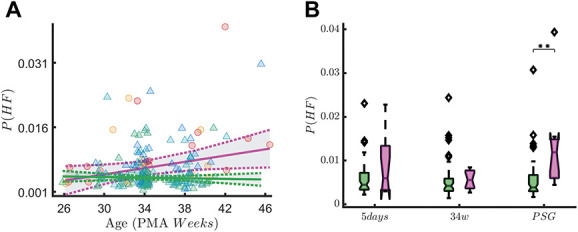
High-frequency oscillations in QUIET sleep. The figure shows the association between HF oscillations of the tachogram P(HF) and early skin-breaking procedure (SBPs). Data are reported for the entire data set during QUIET sleep (QS). The left panel show how P(HF) maturational trend differs in case of high SBPs (magenta curve, SBP ≥50) compared to low SBPs (green curve, SBP < 50). SBPs seem to increase the power of HF oscillations. The right panel shows the boxplot trend as output of the two-way ANOVA: the division between HIGH SBPs and LOW SBPs is reported for each recording time. The HF oscillations increases over time (main effect of measuring point: F(2,191) = 5.97, P ≤ 0.01), but statistically significant interaction effect between measuring point and SBP group is found (F(2,191) = 4.56, P ≤ 0.01). The simple main-effect analysis shows a higher P(HF) in HIGH SBPs group at the PSG recording time (P ≤ 0.01, indicated as ** in the figure), but there is no difference for the 5-day (P = 0.43) or 34w (P = 1) recording time. ANOVA, analysis of variance; HF, high-frequency; SBP, skin-breaking procedures.
