

Abstract
Background.
The prognosis and behavior of pancreatic neuroendocrine tumors (PNETs) vary and may be divergent even at the same stage or tumor grade. Markers of systemic inflammatory response are readily available and are inexpensive, and have been shown to be prognostic factors in several cancers.
Objective.
The aim of this study was to evaluate the prognostic utility of markers of systemic inflammatory response in patients with PNETs.
Methods.
A prospective study of 97 patients with PNETs was performed (median follow-up of 15 months, range 12–73 months). Neutrophil-to-lymphocyte ratios (NLRs) and lymphocyte-to-monocyte ratios (LMRs) were calculated at baseline and preoperatively. The primary outcome measures were progression-free survival (PFS) and recurrence-free survival (RFS) after curative resection.
Results.
Among all patients, an NLR>2.3 [hazard ratio (HR) 2.53, 95% confidence interval (CI) 1.05–6.08, p = 0.038] and the presence of distant metastases (HR 2.8, 95% CI 1.26–6.21, p = 0.012) were independent predictors of disease progression. Among patients who did not undergo surgery during the study period, both platelet-to-lymphocyte ratio (PLR)>160.9 (HR 5.86, 95% CI 1.27–27.08, p = 0.023) and mean platelet volume>10.75 fL (HR 6.63, 95% CI 1.6–27.48, p = 0.009) were independently associated with worse PFS on multivariable analysis. Among patients who underwent complete resection, an LMR<3.46 was associated with a worse RFS (HR 9.72, 95% CI 1.19–79.42, p = 0.034).
Conclusions.
PLR>160.9 and an MPV>10.75 fL at baseline are independent predictors of disease progression, while an LMR<3.46 is an independent predictor of tumor recurrence after complete resection in patients with PNETs.
Pancreatic neuroendocrine tumors (PNETs) are rare tumors that arise from the islets of Langerhans and account for approximately 3% of all pancreatic neoplasms.1 The natural history of PNETs is highly variable, with many tumors manifesting with an indolent course, while other tumors are associated with local invasion and metastases at lymph nodes and distant locations.
There is a paucity of clinical or biochemical parameters that determine the clinical course of patients, especially those with distant metastases. Panzuto and colleagues reported a large series of patients with small bowel tumors and PNETs with distant metastases and determined that the extent of metastases (liver unilobar vs. bilobar vs. extra-abdominal metastases) and higher Ki-67 index predicted overall survival (OS) and progression-free survival (PFS).2 However, finding biomarkers to aid in determining prognosis is important. After surgical resection with curative intent, predicting the likelihood of recurrence is important to guide the extent of resection, follow-up, and treatment. Genç and colleagues identified tumor grade 2, lymph node metastasis, and perineural invasion as possible predictors of recurrence;3 however, these variables are determined after resection with curative intent. Preoperative markers are needed to predict recurrence, which in turn may alter the surgical approach and management of these patients.
Several markers of systemic inflammatory response have been associated with more aggressive clinical behavior in several malignancies. Consequently, their clinical use in predicting tumor behavior has been proposed.4 A recent retrospective study suggested a prognostic association for systemic inflammatory markers in NETs, where an elevated baseline neutrophil-to-lymphocyte ratio (NLR) or platelet-to-lymphocyte ratio (PLR) prior to chemotherapy was found to be associated with shorter PFS.5 Whether these systemic inflammatory markers were independent prognostic markers was not assessed, and, furthermore, a comprehensive analysis of additional systemic inflammatory markers with respect to prognosis has not been explored in patients with PNETs.6–9 The aim of this study was to determine the prognostic utility of systemic inflammatory markers in patients with PNETs.
METHODS
Patient Population
Patients with a history of PNETs based on prior imaging studies—including either computed tomography (CT), magnetic resonance imaging (MRI), or 18Fluorodeoxyglucose positron emission tomography (18F-FDG PET)/CT scan—and pathologic confirmation were enrolled in a prospective Institutional Review Board (IRB)-approved protocol (NCI NCT01967537) at the National Institutes of Health Clinical Center (NIH, Bethesda, MD, USA). Written informed consent was obtained from all study participants. Patients whose follow-up period was <1 year were excluded. Patients with low-grade (G1) tumors were followed annually, and patients with intermediate-grade 2 (G2) or high-grade 3 (G3) tumors were followed at semi-annual or quarterly intervals. Anatomical imaging (CT, MRI), functional imaging (18F-FDG PET/CT and 68Ga-DOTATATE PET/CT), and biochemical studies (complete blood count with differential, basic metabolic panel, neuroendocrine tumor markers) were completed at each annual visit.
NLRs, PLRs, lymphocyte-to-monocyte ratios (LMR), and mean platelet volumes (MPVs) were calculated at the time of enrollment for all patients, as well as preoperatively for patients who underwent resection with curative intent. The primary outcome measures were PFS and recurrence-free survival (RFS). PFS was defined as per Response Evaluation Criteria in Solid Tumors (RECIST) 1.1 criteria: development of new malignant lesions or ≥ 20% increase (as well as an absolute increase ≥ 5 mm) in the sum of diameters of target lesions, using the smallest sum on study as a reference.10 Baseline tumor sizes were measured with CT, and separate groups were based on the 8th edition of the American Joint Commission on Cancer and European NET Society staging systems (<2, 2–4, >4 cm);11,12 however, in patients who underwent curative surgery, sizes 2–4 cm and >4 cm were considered together due to only two patients having tumors larger than 4 cm. Tumor sizes were not available for patients who were enrolled after resection of their primary tumor at an outside institution, whose tumors were only localized by functional imaging preoperatively and not by anatomical imaging, or whose information was obtained through biochemical evidence without radiographic correlation (e.g. those with insulinomas).
Statistical Analyses
Kaplan–Meier curves were constructed and univariate analysis was performed using the log-rank test. Multivariable analysis with the inclusion of statistically significant parameters on univariate analysis was analyzed using the Cox proportional hazards model. Optimal cut-offs for each marker were determined by receiver operating characteristic (ROC) analysis, by identifying the points with the maximal Youden’s index (i.e. sensitivity + specificity—1). The outcomes for ROC analysis included progression and recurrence at 1 year of follow-up. A two-tailed t test, paired t-test, and analysis of variance (ANOVA) were used to identify differences between groups. Statistical analysis was performed using SPSS version 21.0. (IBM Corporation, Armonk, NY, USA). A p-value <0.05 was considered significant.
RESULTS
Inflammatory Markers and Progression-Free Survival (PFS) in the Entire Cohort
Overall, 97 patients [47 males, 50 females, median age at enrollment 52 years, median follow-up 15 months (range 12–73 months)] were included in the final analysis. During follow-up, 33 patients (34%) had progression of their disease, with a median time to progression of 13 months, and five patients (5.2%) died because of their disease. The demographic, clinical, and pathologic information is summarized in Table 1. Areas under the curve (AUC) of the ROC curves for progression at 1 year of follow-up were 0.62 for NLR, 0.57 for LMR, 0.62 for PLR, and 0.59 for MPV (Fig. 1). The optimal cut-offs for each marker were 2.3 for NLR, 4.83 for LMR, 146.6 for PLR, and 10.25 for MPV.
TABLE 1.
Demographic, clinical, and pathologic data of the study cohort
| Variable | Patients not undergoing surgery [n = 63] | Patients undergoing surgery [n = 34] |
|---|---|---|
| Median age at enrollment, years | 52 (23–83) | 46 (20–78) |
| Sex | ||
| Female | 34 (54) | 16 (47.1) |
| Male | 29 (46) | 18 (52.9) |
| Type of PNET | ||
| Sporadic | 29 (46) | 11 (32.4) |
| MEN1 | 17 (27) | 10 (29.4) |
| VHL | 15 (23.8) | 13 (38.2) |
| NF1 | 1 (1.03) | – |
| Cowden syndrome | 1 (1.03) | – |
| Tumor gradea | ||
| 1 | 16 (25.4) | 25 (73.5) |
| 2 | 10 (15.9) | 8 (23.5) |
| 3 | 1 (1.6) | 1 (2.9) |
| Extent of disease | ||
| Locoregional | 39 (61.9) | N0: 22 (64.7) |
| Distant metastases | 24 (38.1) | N1: 12 (35.3) |
| M0: 30 (88.2) | ||
| M1: 4 (11.8) | ||
| Primary tumor size at baseline, cm | 1.35 (0.4–13.1) | |
| < 2: 35 (55.6) | < 2: 18 (52.9) | |
| 2–4: 6 (9.5) | ≥ 2: 12 (35.3) | |
| > 4: 5 (7.9) | ||
| NLR | 1.98 (0.66–34.7) | 1.87 (0.65–6.2) |
| LMR | 3.34 (0.27–17) | 3.52 (1.56–13.9) |
| PLRb | 139.7 (71–764.7) | 111.7 (50.9–250.4) |
| MPVb | 10.4 (8.7–12.5) | 10.4 (8.9–12.2) |
| Progression during follow-up | 18 (28.6) | – |
| Recurrence during follow-up | – | 10 (29.4) |
| Mortality during follow-up | 2 (3.2) | 3 (8.8) |
Data are expressed as n (%) or median (range)
MEN1 multiple endocrine neoplasia type 1, VHL von Hippel–Lindau syndrome, NF1 neurofibromatosis type 1, NLR neutrophil-to-lymphocyte ratio, LMR lymphocyte-to-monocyte ratio, PLR platelet-to-lymphocyte ratio, MPV mean platelet volume, PNET pancreatic neuroendocrine tumor
According to the World Health Organization 2010 NET grading system
Platelet count and MPV could not be assessed in one patient because platelets were clotted
FIG. 1.
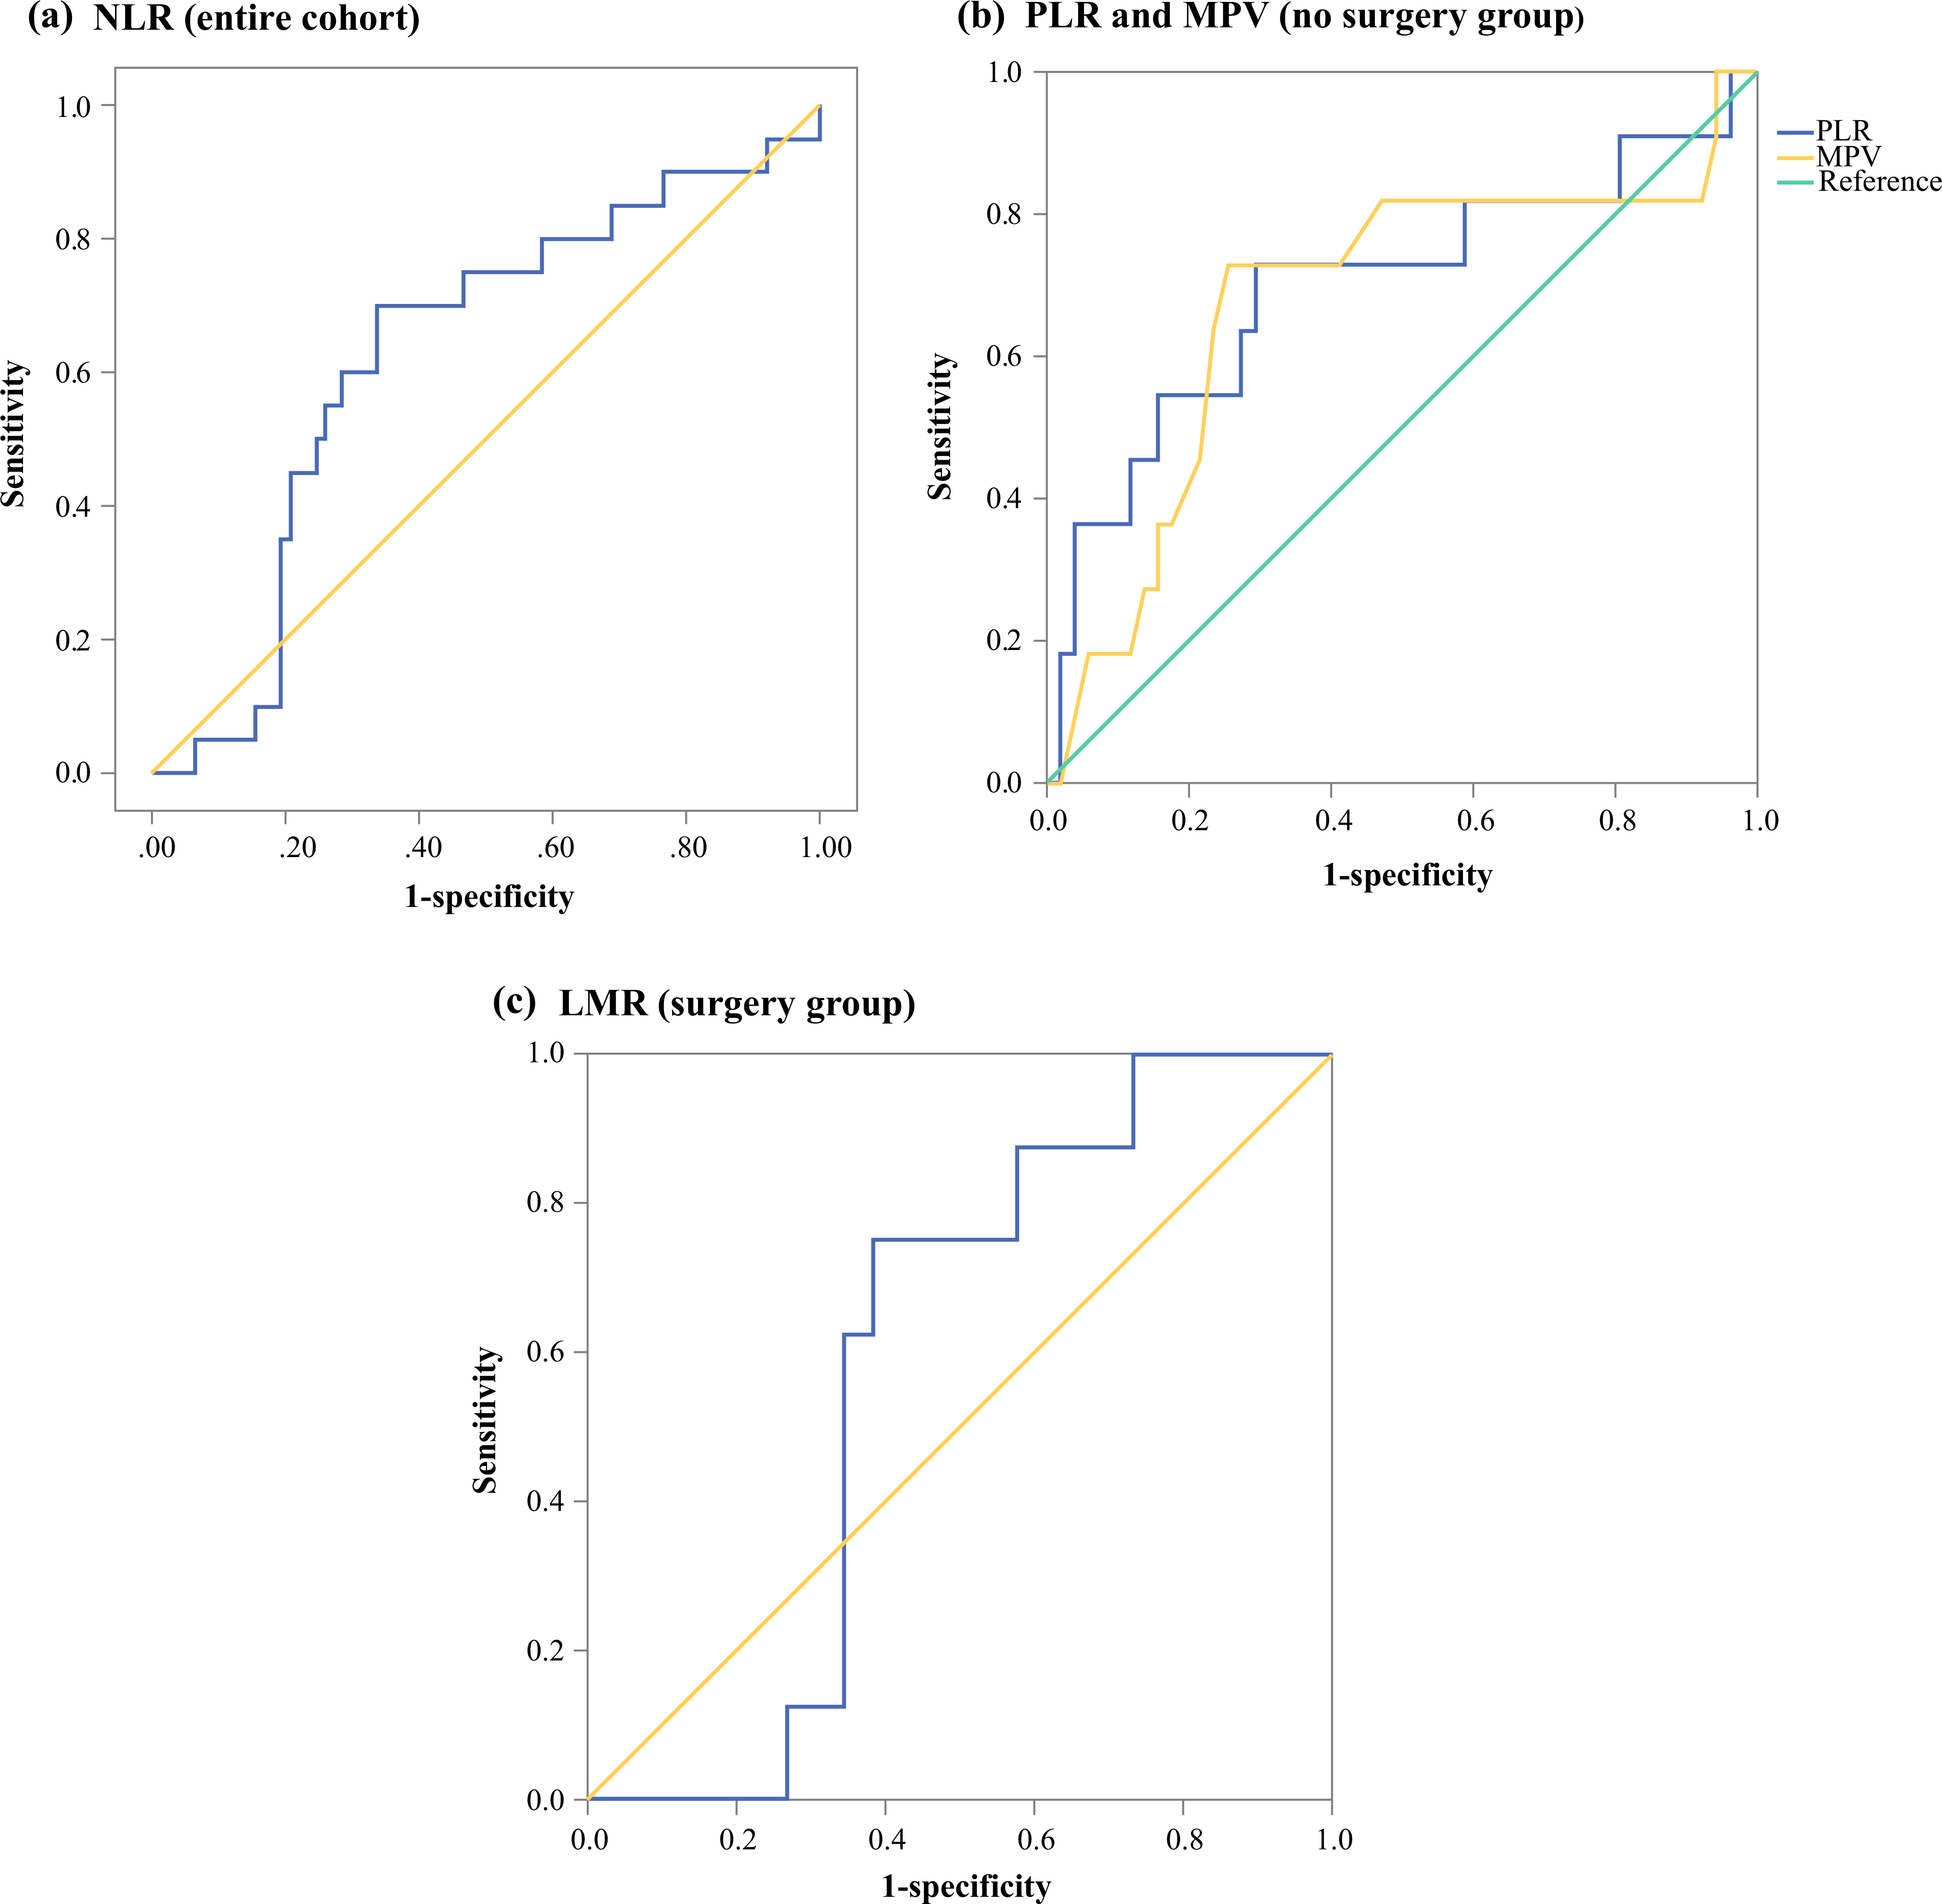
Receiver operating characteristic curves for a NLR and progression at 1 year in the entire cohort (AUC 0.62); b PLR (AUC 0.7) and MPV (AUC 0.68) and progression at 1 year in patients who did not undergo surgery; and c LMR (AUC 0.58) and recurrence at 1 year in patients who underwent surgery. NLR neutrophil-to-lymphocyte ratio, AUC area under the curve, PLR platelet-to-lymphocyte ratio, MPV mean platelet volume, LMR lymphocyte-to-monocyte ratio
On univariate analysis, an NLR>2.3 (median 37.9 vs. 25.3 months, p = 0.005), an LMR<4.83 (median 36.2 months vs. not reached, p = 0.048), tumor grade (G1 vs. G2–G3, median 37.9 vs. 13 months, p = 0.016), and distant metastatic disease (median 15.47 months vs. not reached, p<0.001) were associated with worse PFS. On multivariable analysis, both distant metastatic disease [hazard ratio (HR) 2.8, 95% confidence interval (CI) 1.26–6.21, p = 0.012] and NLR>2.3 (HR 2.53, 95% CI 1.05–6.08, p = 0.038) were associated with worse PFS (Fig. 2, Table 2).
FIG. 2.
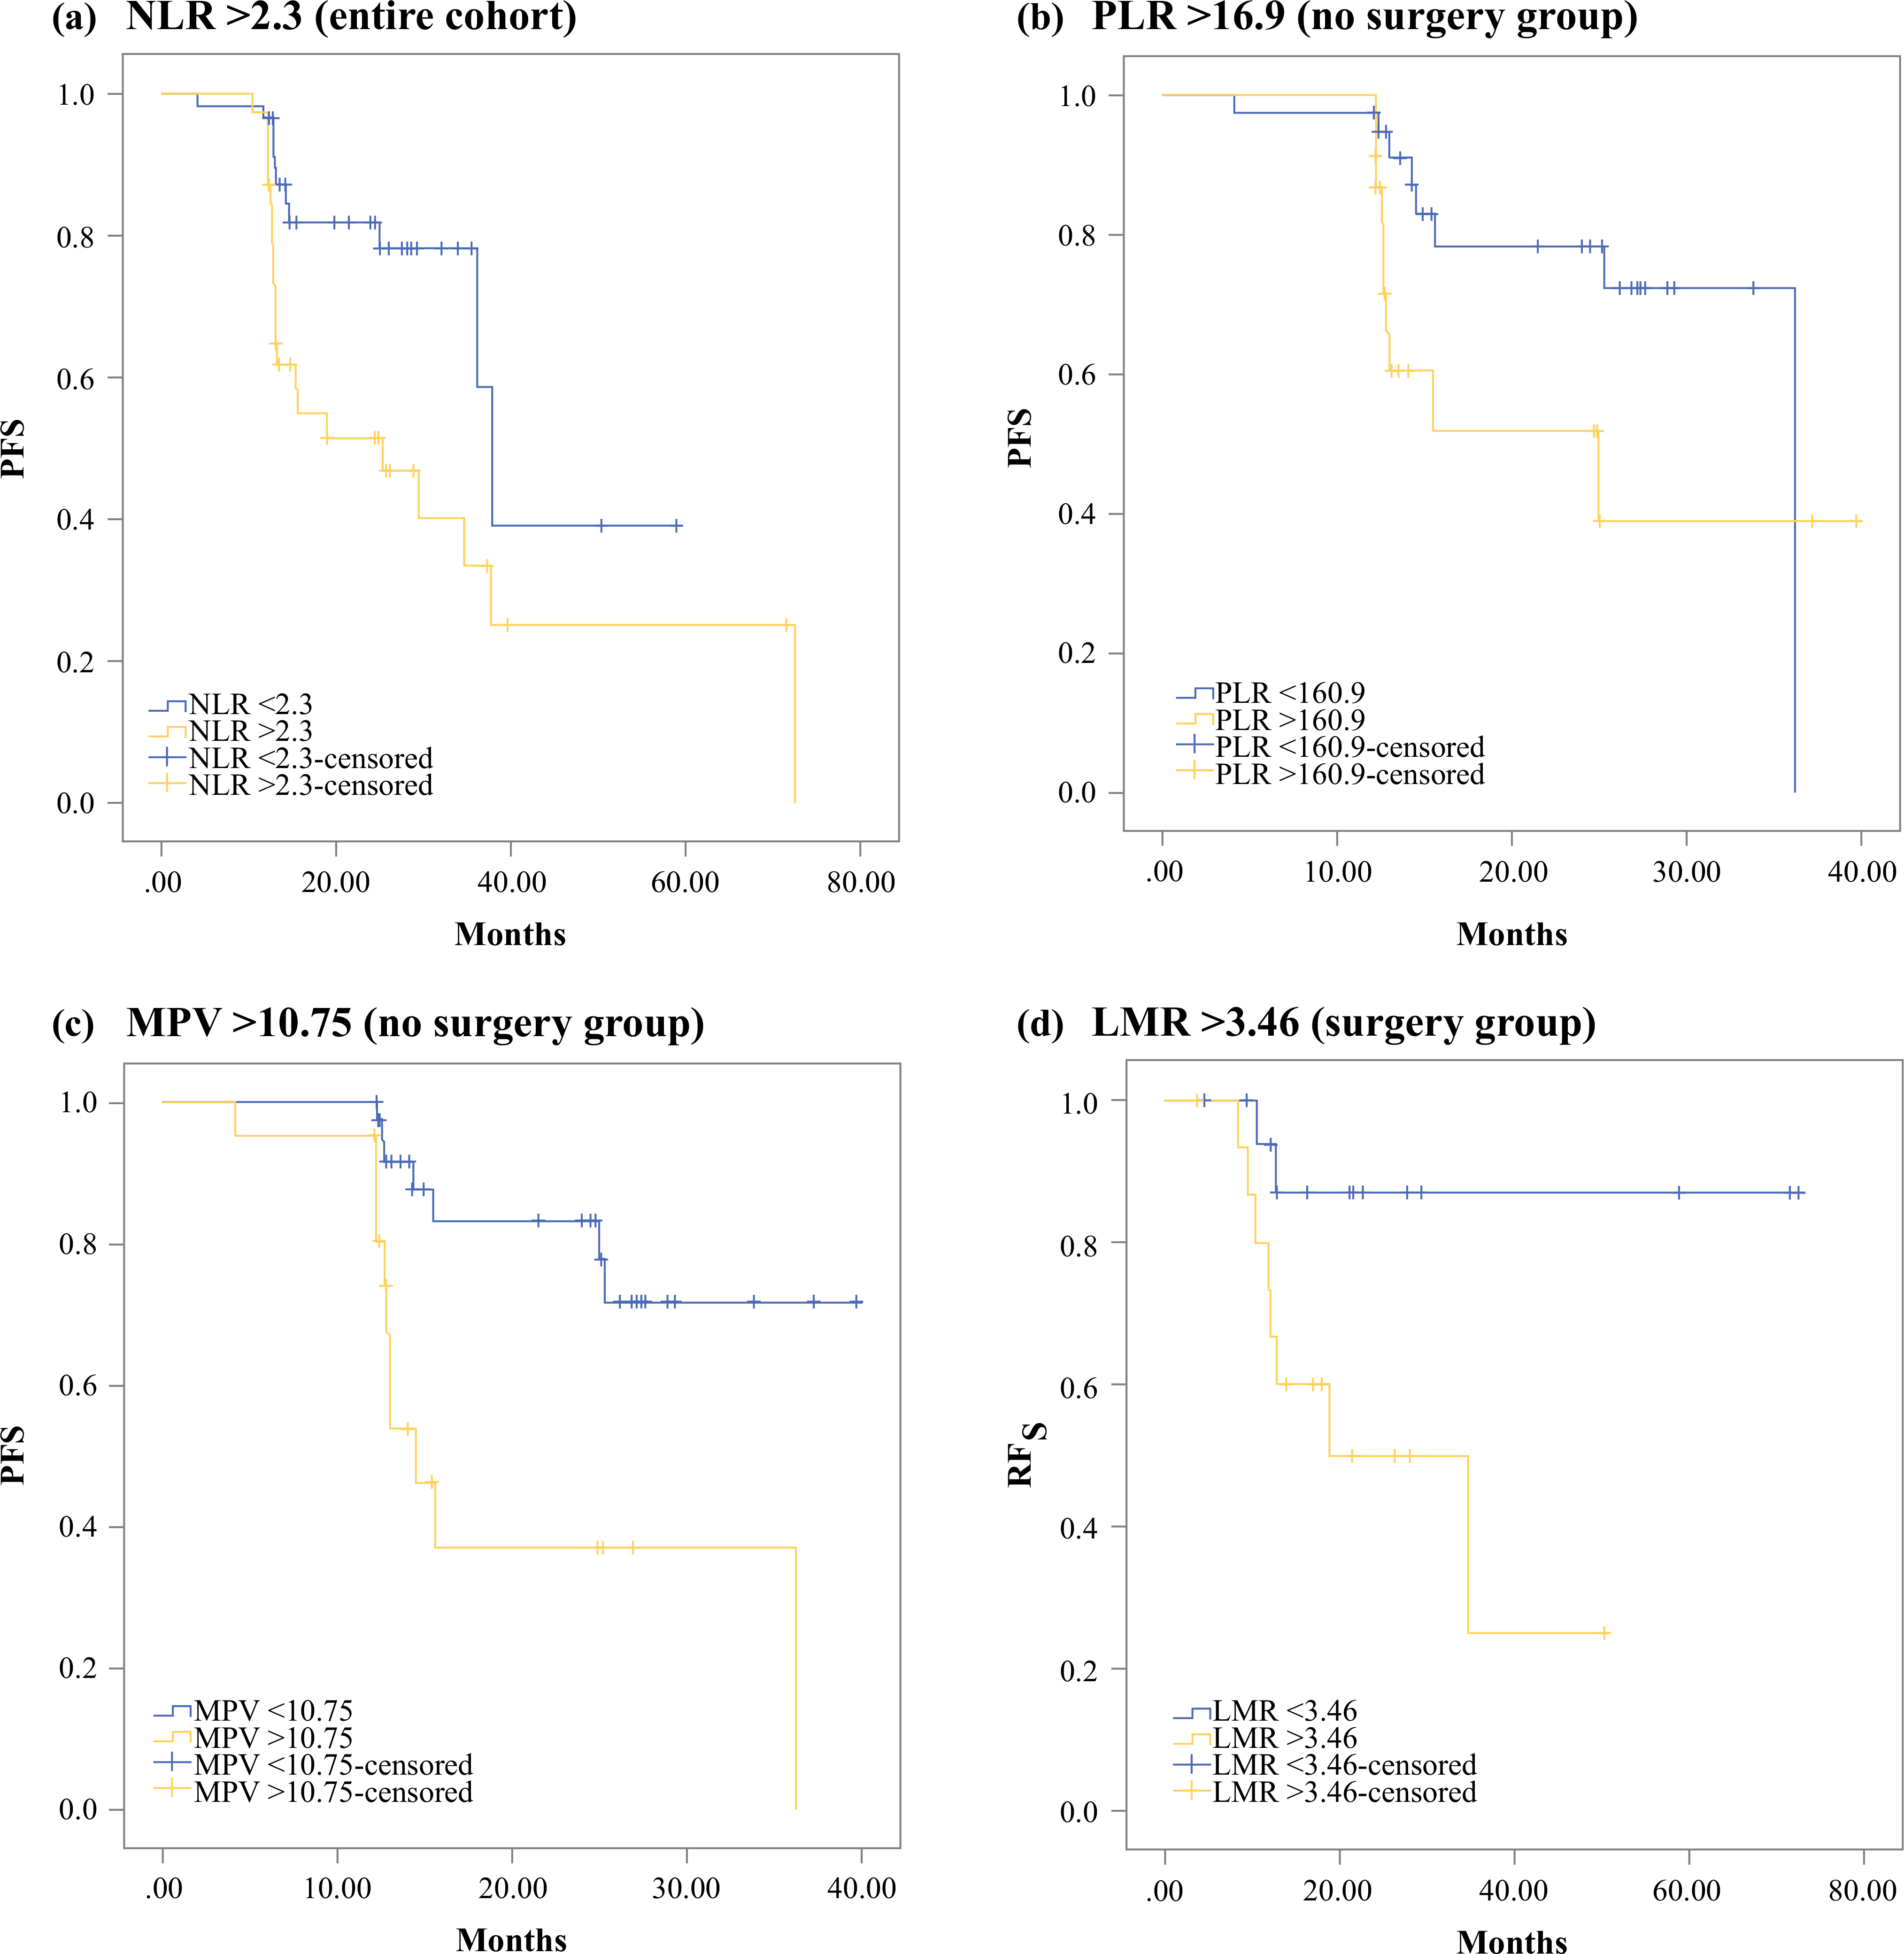
Kaplan–Meier curves for progression-free survival by a NLR>2.3 in the entire cohort (HR 2.53, 95% CI 1.05–6.08, p = 0.038); b PLR>160.9 in patients who did not undergo surgery (HR 5.86, 95% CI 1.27–27.08, p = 0.023); and c MPV>10.75 in patients who did not undergo surgery (HR 6.63, 95% CI 1.6–27.48, p = 0.009). d Kaplan–Meier curve for RFS by LMR<3.46 in patients who underwent surgery (HR 9.72, 95% CI 1.19–79.42, p = 0.034). NLR neutrophil-to-lymphocyte ratio, HR hazard ratio, CI confidence interval, PLR platelet-to-lymphocyte ratio, MPV mean platelet volume, RFS recurrence-free survival, LMR lymphocyte-to-monocyte ratio
TABLE 2.
Results of univariate and multivariable analyses for progression-free survival and recurrence-free survival after curative surgical resection
| Variable | Univariate p-value | HR (95% CI) | Multivariable p-value |
|---|---|---|---|
| Entire cohort (n = 97) | |||
| Age ≥ 52 years | 0.138 | – | – |
| Sex | 0.418 | – | – |
| Germline mutation | 0.061 | – | – |
| Tumor grade G2–3 | 0.016 | 1.82 (0.81–4.1) | 0.15 |
| Distant metastases | < 0.001 | 2.8 (1.26–6.21) | 0.012 |
| Tumor size (< 2 cm, 2–4 cm, > 4 cm) | 0.437 | – | – |
| NLR > 2.3 | 0.005 | 2.53 (1.05–6.08) | 0.038 |
| LMR < 4.83 | 0.048 | 1.43 (0.38–5.41) | 0.596 |
| PLR > 146.6 | 0.103 | – | – |
| MPV > 10.25 | 0.186 | – | – |
| Patients not undergoing surgery (n = 63) | |||
| Age ≥ 52 years | 0.056 | – | – |
| Sex | 0.159 | – | – |
| Germline mutation | 0.041 | 2.08 (0.45–9.66) | 0.351 |
| Tumor grade G2–3 | 0.036 | 0.75 (0.12–4.79) | 0.761 |
| Distant metastases | < 0.001 | 1.29 (0.085–19.59) | 0.853 |
| Tumor size (< 2 cm, 2–4 cm, > 4 cm) | 0.098 | – | – |
| NLR > 2.5 | 0.027 | 2.39 (0.58–9.82) | 0.229 |
| LMR < 2.59 | 0.291 | – | – |
| PLR > 160.9 | 0.035 | 5.86 (1.27–27.08) | 0.023 |
| MPV > 10.75 | 0.001 | 6.63 (1.6–27.48) | 0.009 |
| Patients undergoing curative resection for PNETs (n = 34) | |||
| Age ≥ 46 years | 0.34 | – | – |
| Sex | 0.418 | – | – |
| Germline mutation | 0.061 | – | – |
| Tumor grade (G1 vs. G2–3) | 0.484 | – | – |
| Nodal metastases | 0.712 | – | – |
| Distant metastases | 0.101 | – | – |
| Tumor size ≥ 2 cm | 0.033 | 2.04 (0.41–10.12) | 0.385 |
| NLR > 1.51 | 0.093 | – | – |
| LMR < 3.46 | 0.018 | 9.72 (1.19–79.42) | 0.034 |
| PLR > 156.3 | 0.009 | 47.15 (0.25–8796.8) | 0.149 |
| MPV > 12 | 0.189 | – | – |
HR hazard ratio, CI confidence interval, NLR neutrophil-to-lymphocyte ratio, LMR lymphocyte-to-monocyte ratio, PLR platelet-to-lymphocyte ratio, MPV mean platelet volume
Inflammatory Markers and PFS in Patients Not Undergoing Surgery
A subanalysis of 63 patients who did not undergo surgery during the study period was performed. Patients were followed for a median period of 14 months (range 12–40 months). AUCs of the ROC curves for progression at 1 year were 0.66 for NLR, 0.64 for LMR, 0.7 for PLR, and 0.68 for MPV. The optimal cut-offs were 2.5 for NLR, 2.59 for LMR, 160.9 for PLR, and 10.75 for MPV.
On univariate analysis, an NLR>2.5 (median 25.3 vs. 36.2 months, p = 0.027), a PLR>160.9 (median 25 vs. 36.2 months, p = 0.035), an MPV>10.75 fL (median 14.5 months vs. not reached, p = 0.001), presence of a germline mutation (median 36.2 months vs. not reached, p = 0.041), tumor grade (G1 vs. G2–G3, median not reached vs. 13 months, p = 0.036), and distant metastatic disease (median 14.5 months vs. not reached, p<0.001) were significantly associated with worse PFS. On multivariable analysis, PLR>160.9 (HR 5.86, 95% CI 1.27–27.08, p = 0.023) and MPV>10.75 fL (HR 6.63, 95% CI 1.6–27.48, p = 0.009) were independently associated with worse PFS (Table 2).
Sensitivity for predicting disease progression for PLR>160 .9 was 55.6% (95% CI 30.8–78.5%), specificity was 70.5% (95% CI 54.8–83.4%), positive predictive value (PPV) was 43.5% (95% CI 29.4–58.7%), and negative predictive value (NPV) was 79.5% (95% CI 69.1–87.1%). For MPV>10.75 fL, sensitivity for predicting disease progression was 61.1% (95% CI 35.8–82.7%), specificity was 77.3% (95% CI 62.2–88.5%), PPV was 52.4% (95% CI 36.3–67.8%), and NPV was 82.9% (95% CI 72.7–89.9%). Among patients who progressed, there were no significant differences between biomarker levels at baseline and at the time of progression (NLR: p = 0.299; LMR: p = 0.744; PLR: p = 0.497; MPV: p = 1).
Inflammatory Markers and RFS After Complete Resection
A subanalysis of 34 patients (median follow-up 21 months, range 12–73 months) who underwent complete surgical resection was performed to identify whether there is an association between RFS and preoperative levels of inflammatory markers. Four patients (11.8%) had distant metastases at the time of the operation that were completely resected.
AUC of the ROC curves for recurrence at 1 year were 0.49 for NLR, 0.58 for LMR, 0.63 for PLR, and 0.46 for MPV. The optimal cut-offs were 1.51 for NLR, 3.46 for LMR, 156.3 for PLR, and 12 for MPV. LMR<3.46 (median RFS 18.9 months vs. not reached, p = 0.018), PLR>156.3 (median RFS 34.7 months vs. not reached, p = 0.009), and tumor size ≥ 2 cm (median RFS 37.4 vs. not reached, p = 0.033) were associated with worse RFS on univariate analysis. On multivariable analysis, only LMR<3.46 was an independent predictor of worse RFS (HR 9.72, 95% CI 1.19–79.42, p = 0.034) [Table 2].
No significant differences in biomarker levels were identified between preoperative levels and levels at the first postoperative follow-up visit (NLR: p = 0.913; LMR: p = 0.321; PLR: p = 0.182; MPV: p = 0.164). In addition, no significant changes were identified between preoperative levels and levels at the time of recurrence among patients who recurred (NLR: p = 0.1; LMR: p = 0.296; PLR: p = 0.085; MPV: p = 0.716).
Association Between Inflammatory Markers and Clinical Characteristics
Since the serum levels of white blood cells are influenced by many factors besides tumor biology (e.g. patients’ sex, sex hormones),13–15 an analysis was performed to identify which clinical factors may be associated with biomarker levels and to help avoid false positive results. Higher NLR was associated with increasing tumor size (p = 0.008). Lower LMR was associated with male sex (p = 0.004), patients with sporadic and non-VHL germline mutations (p = 0.001), and the presence of distant metastases (p = 0.006). A high PLR was associated with metastatic disease (p = 0.031) (Table 3).
TABLE 3.
Association between levels of inflammatory markers and clinical characteristics
| NLR (mean ± SD) | p-Value | LMR (mean ± SD) | p-Value | PLR (mean ± SD) | p-Value | MPV (mean ± SD) | p-Value | |
|---|---|---|---|---|---|---|---|---|
| Sex | ||||||||
| Female | 2.38 ± 1.72 | 0.203 | 5.27 ± 4.47 | 0.004 | 179.74 ± 130.35 | 0.057 | 10.53 ± 0.83 | 0.59 |
| Male | 3.29 ± 4.95 | 3.21 ± 1.65 | 139.39 ± 60.74 | 10.43 ± 0.96 | ||||
| Mutation status | ||||||||
| VHL patients | 3.15 ± 2.43 | 0.569 | 6.15 ± 5.75 | 0.001 | 170.9 ± 126.19 | 0.511 | 10.46 ± 0.79 | 0.903 |
| Others | 2.68 ± 4.07 | 3.51 ± 1.59 | 155.48 ± 93.81 | 10.49 ± 0.93 | ||||
| Tumor size, cm | ||||||||
| < 2 | 2.28 ± 1.62 | 0.008 | 4.74 ± 3.06 | 0.211 | 153.88 ± 101.26 | 0.523 | 10.47 ± 0.97 | 0.478 |
| 2n–4 | 2.74 ± 1.56 | 4.85 ± 6.27 | 141.03 ± 40.49 | 10.33 ± 0.65 | ||||
| > 4 | 7.24 ± 12.14 | 2.03 ± 1.23 | 188.71 ± 104.28 | 10.81 ± 0.44 | ||||
| Tumor grade | ||||||||
| 1 | 2.36 ± 1.45 | 0.475 | 4.77 ± 4.55 | 0.103 | 144.63 ± 48.15 | 0.104 | 10.38 ± 0.89 | 0.144 |
| 2–3 | 2.6 ± 0.82 | 3.04 ± 1.39 | 186.35 ± 143.5 | 10.75 ± 0.91 | ||||
| Distant metastases | ||||||||
| M0 | 2.37 ± 1.77 | 0.074 | 4.93 ± 4 | 0.006 | 144.61 ± 89.08 | 0.031 | 10.39 ± 0.87 | 0.156 |
| M1 | 3.81 ± 6 | 2.8 ± 1.37 | 193.83 ± 125.76 | 10.67 ± 0.92 | ||||
NLR neutrophil-to-lymphocyte ratio, LMR lymphocyte-to-monocyte ratio, PLR platelet-to-lymphocyte ratio, MPV mean platelet volume, VHL von Hippel–Lindau syndrome, SD standard deviation
DISCUSSION
The clinical course of patients with PNETs can be difficult to determine. Prognosis is based on the grade of the tumor and the presence of metastatic disease. Systemic inflammatory markers are inexpensive and readily available biomarkers that were associated with PFS and RFS in patients with PNETs. An NLR>2.3 was independently associated with worse PFS in the entire cohort, regardless of undergoing surgical treatment during the study period. In patients not undergoing surgical resection during the study period, both PLR>160.9 and MPV>10.75 fL were independently associated with worse PFS. Finally, in patients undergoing complete surgical resection, an LMR<3.46 was found to be an independent predictor of worse RFS.
A high NLR was associated with decreased PFS in the entire cohort, regardless of surgical treatment. Associations between a high NLR and decreased PFS have been reported in the literature for other malignancies, such as metastatic renal cell carcinoma,16 locally advanced esophageal cancer,17 and small cell lung cancer.18 A higher NLR was also associated with increased tumor size, which has previously been reported for thyroid cancer.19,20 Both a higher PLR and elevated MPV were independent predictors of disease progression in patients who did not undergo surgery during the follow-up period. Elevated MPV has been associated with worse OS in colorectal cancer,21 while elevated PLR has been associated with both worse OS and PFS in locally advanced pancreatic cancer.22 A lower preoperative LMR was found to be an independent predictor of worse RFS after R0 resection. Several studies have described associations between the same marker and reduced RFS and OS after curative resection in other types of cancer, such as hepatocellular carcinoma,23 stage II/III gastric cancer,24 stage I non-small cell lung cancer,25 and pancreatic adenocarcinoma.26 This marker takes into consideration the population of two cell types that are thought to contribute to tumor growth through two opposing ways. Depletion of intratumoral lymphocytes is associated with decreased immune surveillance and, subsequently, tumor growth, recurrence, and metastasis.27,28 In contrast, monocyte-derived tumor-associated macrophages (TAMs) are thought to promote tumor growth, invasion, metastasis, angiogenesis and immunosuppression via the M2 phenotype.29,30 Patients with VHL germline mutations were found to be associated with higher LMR values, and caution should be given for potential false negative results in patients with VHL-associated PNETs undergoing curative resection. This is explained by the fact that VHL inactivation leads to inflammation via the inflammatory nuclear factor (NF)-κB pathway and induction of macrophage chemotaxis.31–34 PNETs in patients with VHL germline mutations have also been found to have upregulated pathways related to angiogenesis and immune response, as well as greater stromal content, when compared with MEN1 and sporadic PNETs, which may explain the differences in the LMR.35
To our knowledge, this is the first prospective comprehensive study evaluating the prognostic role of inflammatory markers in PNETs. Salman and colleagues retrospectively examined the prognostic role of pretreatment chemotherapy NLR and PLR in gastro-enteropancreatic NETs.5 Patients with a higher median NLR and PLR were found to have a worse PFS. However, the findings of this study may have been influenced by the type of chemotherapeutic regimen and prior treatments, which were not discussed or considered. In this study, patients were followed either preoperatively or during the natural course of their disease during clinic and imaging visits. Luo and colleagues retrospectively assessed the prognostic role of only NLR in patients with PNETs.36 Although this study identified that an NLR>2.3 was an independent predictor of worse PFS among all patients with PNETs, a significant portion of patients underwent surgical resection during the study period, which would therefore decrease their chance of demonstrating disease progression compared with patients who did not undergo resection. In contrast, both a PLR>160.9 and an MPV>10.75 fL were independent predictors of worse PFS among patients who did not undergo operative management during the study period. Patients with a preoperative LMR<3.46 could potentially benefit from more frequent surveillance after curative resection, or adjuvant therapy could be considered in such cases.
There are several limitations to this study. The study was conducted at a tertiary referral center where the patient population consists of many patients with inherited PNETs; however, the rates of somatic MEN1 mutations in patients with PNETs can be up to 30–80%.37 The various clinical factors that were shown to be associated with the levels of these inflammatory markers (e.g. sex, VHL germline mutations, tumor size) also need to be considered when establishing an optimal cut-off in clinical practice. A larger cohort of patients will be required for further validation of these findings in future studies.
CONCLUSIONS
A high PLR and MPV at baseline are independently associated with worse PFS among patients not undergoing surgical management. A lower preoperative LMR is independently associated with decreased RFS in patients having complete surgical resection of PNETs. LMR levels are associated with patients’ sex, VHL germline mutations, and presence of distant metastases, while NLR levels are associated with tumor size and PLR levels are associated with the presence of distant metastases.
Acknowledgments
FUNDING This research was supported by the Intramural Research Program of the Center for Cancer Research, National Cancer Institute, National Institutes of Health.
Footnotes
DISCLOSURE Apostolos Gaitanidis, Dhaval Patel, Naris Nilubol, Amit Tirosh, Samira Sadowski, and Electron Kebebew have no disclosures to declare.
REFERENCES
- 1.Fesinmeyer MD, Austin MA, Li CI, De Roos AJ, Bowen DJ. Differences in Survival by Histologic Type of Pancreatic Cancer. Cancer Epidemiol Biomarkers Prev. 2005;14(7):1766–773. [DOI] [PubMed] [Google Scholar]
- 2.Panzuto F, Merola E, Rinzivillo M, et al. Advanced Digestive Neuroendocrine Tumors. Pancreas. 2014;43(2):212–18. [DOI] [PubMed] [Google Scholar]
- 3.Genç CG, Jilesen AP, Partelli S, et al. A New Scoring System to Predict Recurrent Disease in Grade 1 and 2 Nonfunctional Pancreatic Neuroendocrine Tumors. Ann Surg. 10.1097/SLA.0000000000002123. [DOI] [PubMed] [Google Scholar]
- 4.Templeton AJ, Ace O, McNamara MG, et al. Prognostic Role of Platelet to Lymphocyte Ratio in Solid Tumors: A Systematic Review and Meta-Analysis. Cancer Epidemiol Biomarkers Prev. 2014;23(7):1204–212. [DOI] [PubMed] [Google Scholar]
- 5.T, Kazaz SN, Varol U, et al. Prognostic Value of the Pretreatment Neutrophil-to-Lymphocyte Ratio and Platelet-to-Lymphocyte Ratio for Patients with Neuroendocrine Tumors: An Izmir Oncology Group Study. Chemotherapy. 2016;61(6):281–86. [DOI] [PubMed] [Google Scholar]
- 6.Gu M, Zhai Z, Huang L, et al. Pre-treatment mean platelet volume associates with worse clinicopathologic features and prognosis of patients with invasive breast cancer. Breast Cancer. 2016;23(5):752–60. [DOI] [PubMed] [Google Scholar]
- 7.Zhang F, Chen Z, Wang P, Hu X, Gao Y, He J. Combination of platelet count and mean platelet volume (COP-MPV) predicts postoperative prognosis in both resectable early and advanced stage esophageal squamous cell cancer patients. Tumor Biol. 2016;37(7):9323–331. [DOI] [PMC free article] [PubMed] [Google Scholar]
- 8.Ozawa T, Ishihara S, Kawai K, et al. Impact of a lymphocyte to monocyte ratio in stage IV colorectal cancer. J Surg Res. 2015;199(2):386–92. [DOI] [PubMed] [Google Scholar]
- 9.Stotz M, Pichler M, Absenger G, et al. The preoperative lymphocyte to monocyte ratio predicts clinical outcome in patients with stage III colon cancer. Br J Cancer. 2014;110(2):435–40. [DOI] [PMC free article] [PubMed] [Google Scholar]
- 10.Eisenhauer EA, Therasse P, Bogaerts J, et al. New response evaluation criteria in solid tumours: Revised RECIST guideline (version 1.1). Eur J Cancer. 2009;45(2):228–47. [DOI] [PubMed] [Google Scholar]
- 11.Amin MB, Edge SB, American Joint Committee on Cancer. AJCC Cancer Staging Manual. Available at: http://www.springer.com/us/book/9783319406176. Accessed 5 May 2017.
- 12.Rindi G, Klöppel G, Alhman H, et al. TNM staging of foregut (neuro)endocrine tumors: a consensus proposal including a grading system. Virchows Arch. 2006;449(4):395–401. [DOI] [PMC free article] [PubMed] [Google Scholar]
- 13.Mahlknecht U, Kaiser S. Age-related changes in peripheral blood counts in humans. Exp Ther Med. 2010;1(6):1019–25. [DOI] [PMC free article] [PubMed] [Google Scholar]
- 14.Goto M, Nishioka K. Age- and sex-related changes of the lymphocyte subsets in healthy individuals: an analysis by two-dimensional flow cytometry. J Gerontol. 1989;44(2):M51–6. [DOI] [PubMed] [Google Scholar]
- 15.Tollerud DJ, Clark JW, Brown LM, Neuland CY, Pankiw-Trost LK, Blattner WA, et al. The influence of age, race, and gender on peripheral blood mononuclear-cell subsets in healthy nonsmokers. J Clin Immunol. 1989;9(3):214–22. [DOI] [PubMed] [Google Scholar]
- 16.Keizman D, Ish-Shalom M, Huang P, Eisenberger MA, Pili R, Hammers H, et al. The association of pre-treatment neutrophil to lymphocyte ratio with response rate, progression free survival and overall survival of patients treated with sunitinib for metastatic renal cell carcinoma. Eur J Cancer. 2012;48(2):202–08. [DOI] [PMC free article] [PubMed] [Google Scholar]
- 17.Yoo EJ, Park JC, Kim EH, et al. Prognostic value of neutrophil-to-lymphocyte ratio in patients treated with concurrent chemoradiotherapy for locally advanced oesophageal cancer. Dig Liver Dis. 2014;46(9):846–53. [DOI] [PubMed] [Google Scholar]
- 18.Kang MH, Go S-I, Song H-N, et al. The prognostic impact of the neutrophil-to-lymphocyte ratio in patients with small-cell lung cancer. Br J Cancer. 2014;111(3):452–60. [DOI] [PMC free article] [PubMed] [Google Scholar]
- 19.Liu C-L, Lee J-J, Liu T-P, Chang Y-C, Hsu Y-C, Cheng S-P. Blood neutrophil-to-lymphocyte ratio correlates with tumor size in patients with differentiated thyroid cancer. J Surg Oncol. 2013;107(5):493–97. [DOI] [PubMed] [Google Scholar]
- 20.Gong W, Yang S, Yang X, Guo F. Blood preoperative neutrophil-to-lymphocyte ratio is correlated with TNM stage in patients with papillary thyroid cancer. Clinics. 2016;71(6):311–14. [DOI] [PMC free article] [PubMed] [Google Scholar]
- 21.Li N, Yu Z, Zhang X, Liu T, Sun Y, Wang R, Yu K. Elevated mean platelet volume predicts poor prognosis in colorectal cancer. Sci Rep. 2017;7(1):10261. [DOI] [PMC free article] [PubMed] [Google Scholar]
- 22.Lee BM, Chung SY, Chang JS, Lee KJ, Song SY, Seong J. Neutrophil-lymphocyte ratio and platelet-lymphocyte ratio as prognostic factors for locally advanced pancreatic cancer patients. J Clin Oncol. 2017;35(4 Suppl):326–26. [Google Scholar]
- 23.Lin Z-X, Ruan D-Y, Li Y, et al. Lymphocyte-to-monocyte ratio predicts survival of patients with hepatocellular carcinoma after curative resection. World J Gastroenterol. 2015;21(38):10898. [DOI] [PMC free article] [PubMed] [Google Scholar]
- 24.Zhou X, Du Y, Xu J, et al. The preoperative lymphocyte to monocyte ratio predicts clinical outcomes in patients with stage II/III gastric cancer. Tumor Biol. 2014;35(11):11659–666. [DOI] [PubMed] [Google Scholar]
- 25.Xia H, Sun Z, Deng L, Zhu D, Wang D. Prognostic Significance of the Preoperative Lymphocyte to Monocyte Ratio in Patients With Stage I Non-Small Cell Lung Cancer Undergoing Complete Resection. Cancer Invest. 2016;34(8):378–84. [DOI] [PubMed] [Google Scholar]
- 26.Ji J-J, Gao B-Q, Xu H-W, Li G-J, Yang F. Prognostic value of preoperative lymphocyte-to-monocyte ratio in pancreatic adenocarcinoma. Onco Targets Ther. 2016;9:1085. [DOI] [PMC free article] [PubMed] [Google Scholar]
- 27.Mlecnik B, Tosolini M, Kirilovsky A, et al. Histopathologic-Based Prognostic Factors of Colorectal Cancers Are Associated With the State of the Local Immune Reaction. J Clin Oncol. 2011;29(6):610–18. [DOI] [PubMed] [Google Scholar]
- 28.Bindea G, Mlecnik B, Tosolini M, et al. Spatiotemporal Dynamics of Intratumoral Immune Cells Reveal the Immune Landscape in Human Cancer. Immunity. 2013;39(4):782–95. [DOI] [PubMed] [Google Scholar]
- 29.Pollard JW. Opinion: Tumour-educated macrophages promote tumour progression and metastasis. Nat Rev Cancer. 2004;4(1):71–8. [DOI] [PubMed] [Google Scholar]
- 30.Galdiero MR, Bonavita E, Barajon I, Garlanda C, Mantovani A, Jaillon S. Tumor associated macrophages and neutrophils in cancer. Immunobiology. 2013;218(11):1402–410. [DOI] [PubMed] [Google Scholar]
- 31.Mantovani A, Allavena P, Sica A, Balkwill F. Cancer-related inflammation. Nature. 2008;454(7203):436–44. [DOI] [PubMed] [Google Scholar]
- 32.Staller P, Sulitkova J, Lisztwan J, Moch H, Oakeley EJ, Krek W. Chemokine receptor CXCR4 downregulated by von Hippel?Lindau tumour suppressor pVHL. Nature. 2003;425(6955):307–11. [DOI] [PubMed] [Google Scholar]
- 33.Morais C, Gobe G, Johnson DW, Healy H. The emerging role of nuclear factor kappa B in renal cell carcinoma. Int J Biochem Cell Biol. 2011;43(11):1537–549. [DOI] [PubMed] [Google Scholar]
- 34.Palazon A, Goldrath A, Nizet V, Johnson R. HIF Transcription Factors, Inflammation, and Immunity. Immunity. 2014;41(4):518–28. [DOI] [PMC free article] [PubMed] [Google Scholar]
- 35.Keutgen XM, Boufraqech M, Gara S, et al. MicroRNA and Gene Expression Profiling in Syndromic and Sporadic Non-Functioning Pancreatic Neuroendocrine Tumors: An Integrated Analysis. Journal of the American College of Surgeons. 2016;223(4 Suppl 2):e13–e14. [Google Scholar]
- 36.Luo G, Liu C, Cheng H, et al. Neutrophil-lymphocyte ratio predicts survival in pancreatic neuroendocrine tumors. Oncol Lett. 2017;13(4):2454–458. [DOI] [PMC free article] [PubMed] [Google Scholar]
- 37.Sadowski SM, Triponez F. Management of pancreatic neuroendocrine tumors in patients with MEN 1. Gland Surg. 2015;4(1):63–8. [DOI] [PMC free article] [PubMed] [Google Scholar]