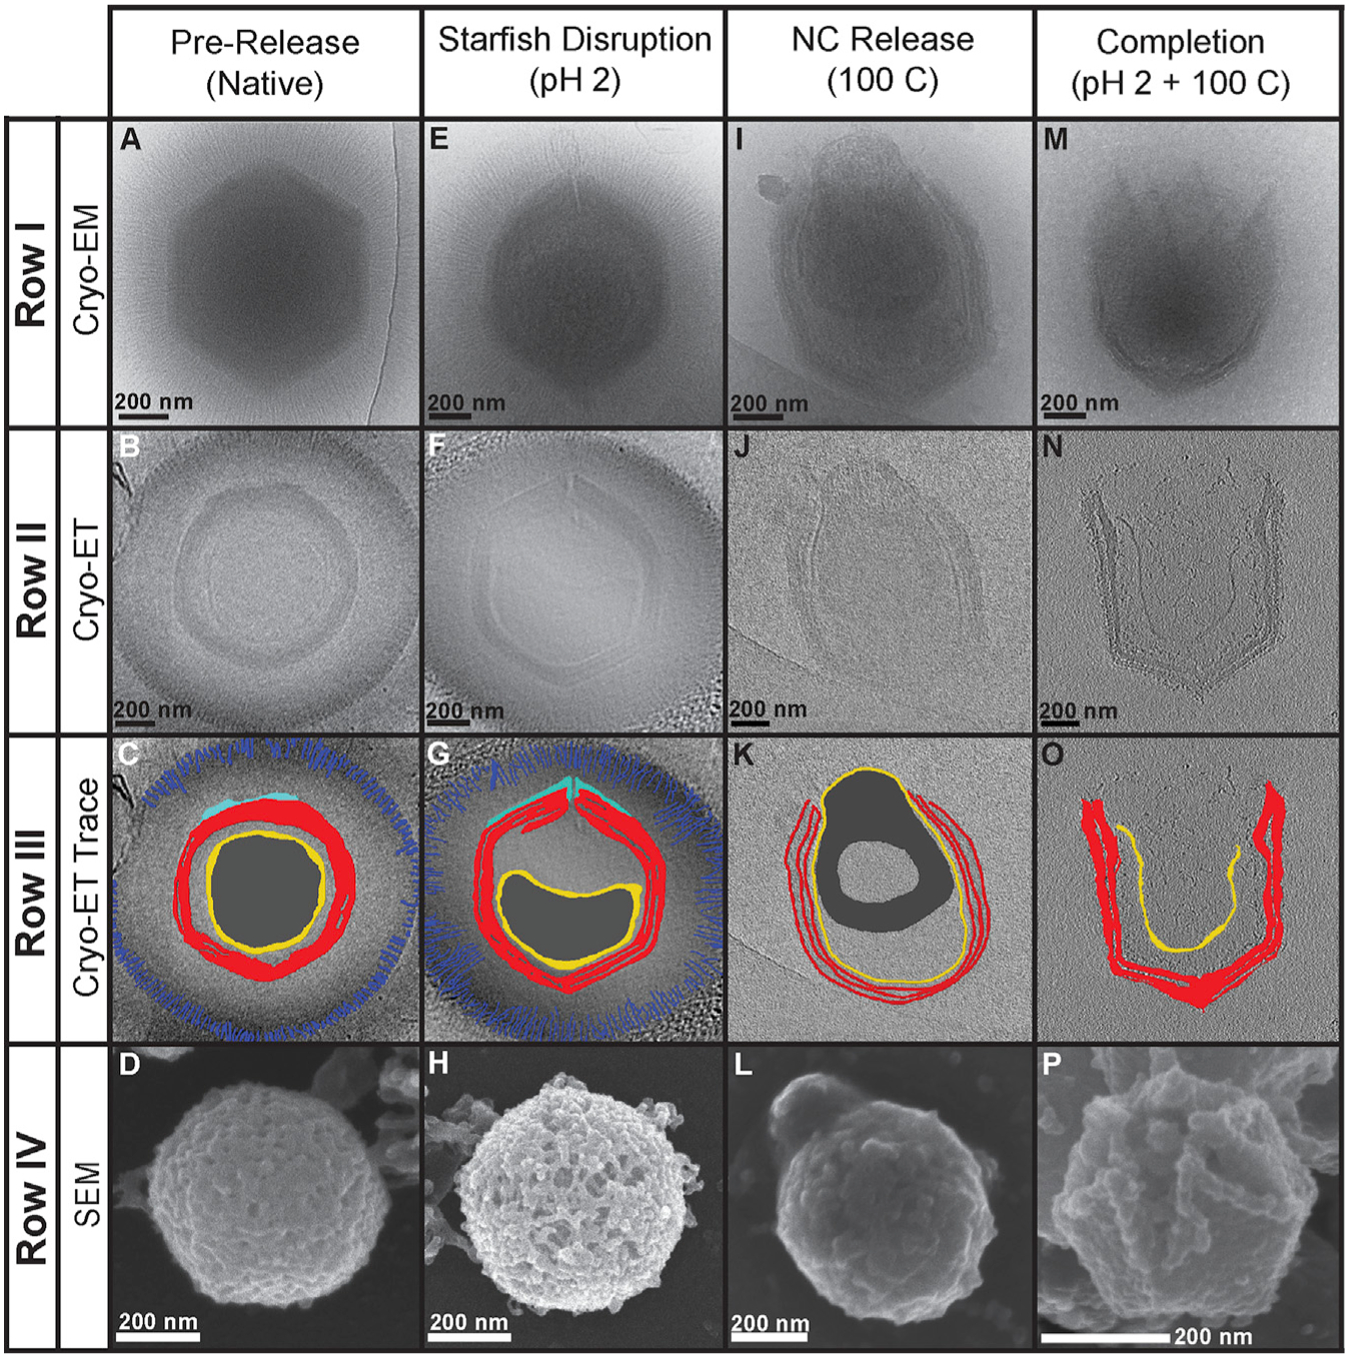
Figure 2. Electron Microscopy of SMBV Genome Release Stages.

(Row I) 2D cryoelectron micrographs of particles following either no treatment (A) or post-incubation with pH 2 (E), 100°C (I), or both pH 2 + 100°C (M). (Row II) Central slices (z = 20) of cryoelectron tomograms of particles following either no treatment (B) or post-incubation with pH 2 (F), 100°C (J), or both pH 2 + 100°C (N). (Row III) Central slices of cryo-tomograms with key features highlighted. Blue, distal tips of the external fiber layer; cyan, starfish seal complex; dark gray, dsDNA; red, capsid; yellow, lipid membranes (nucleocapsid). Slices are shown for virions following either no treatment (C) or post-incubation with pH 2 (G), 100°C (K), or both pH 2 + 100°C (O). (Row IV) Scanning electron micrographs of particles in various stages of genome release following either no treatment (D) or post-incubation with pH 2 (H), 100°C (L), or both pH 2 + 100°C (P). See Videos S2, S3, S4, S5, S6, S7, S8, and S9 for videos of the tomograms and tilt series. See EMD-20745–20748 for tomogram volumes.
