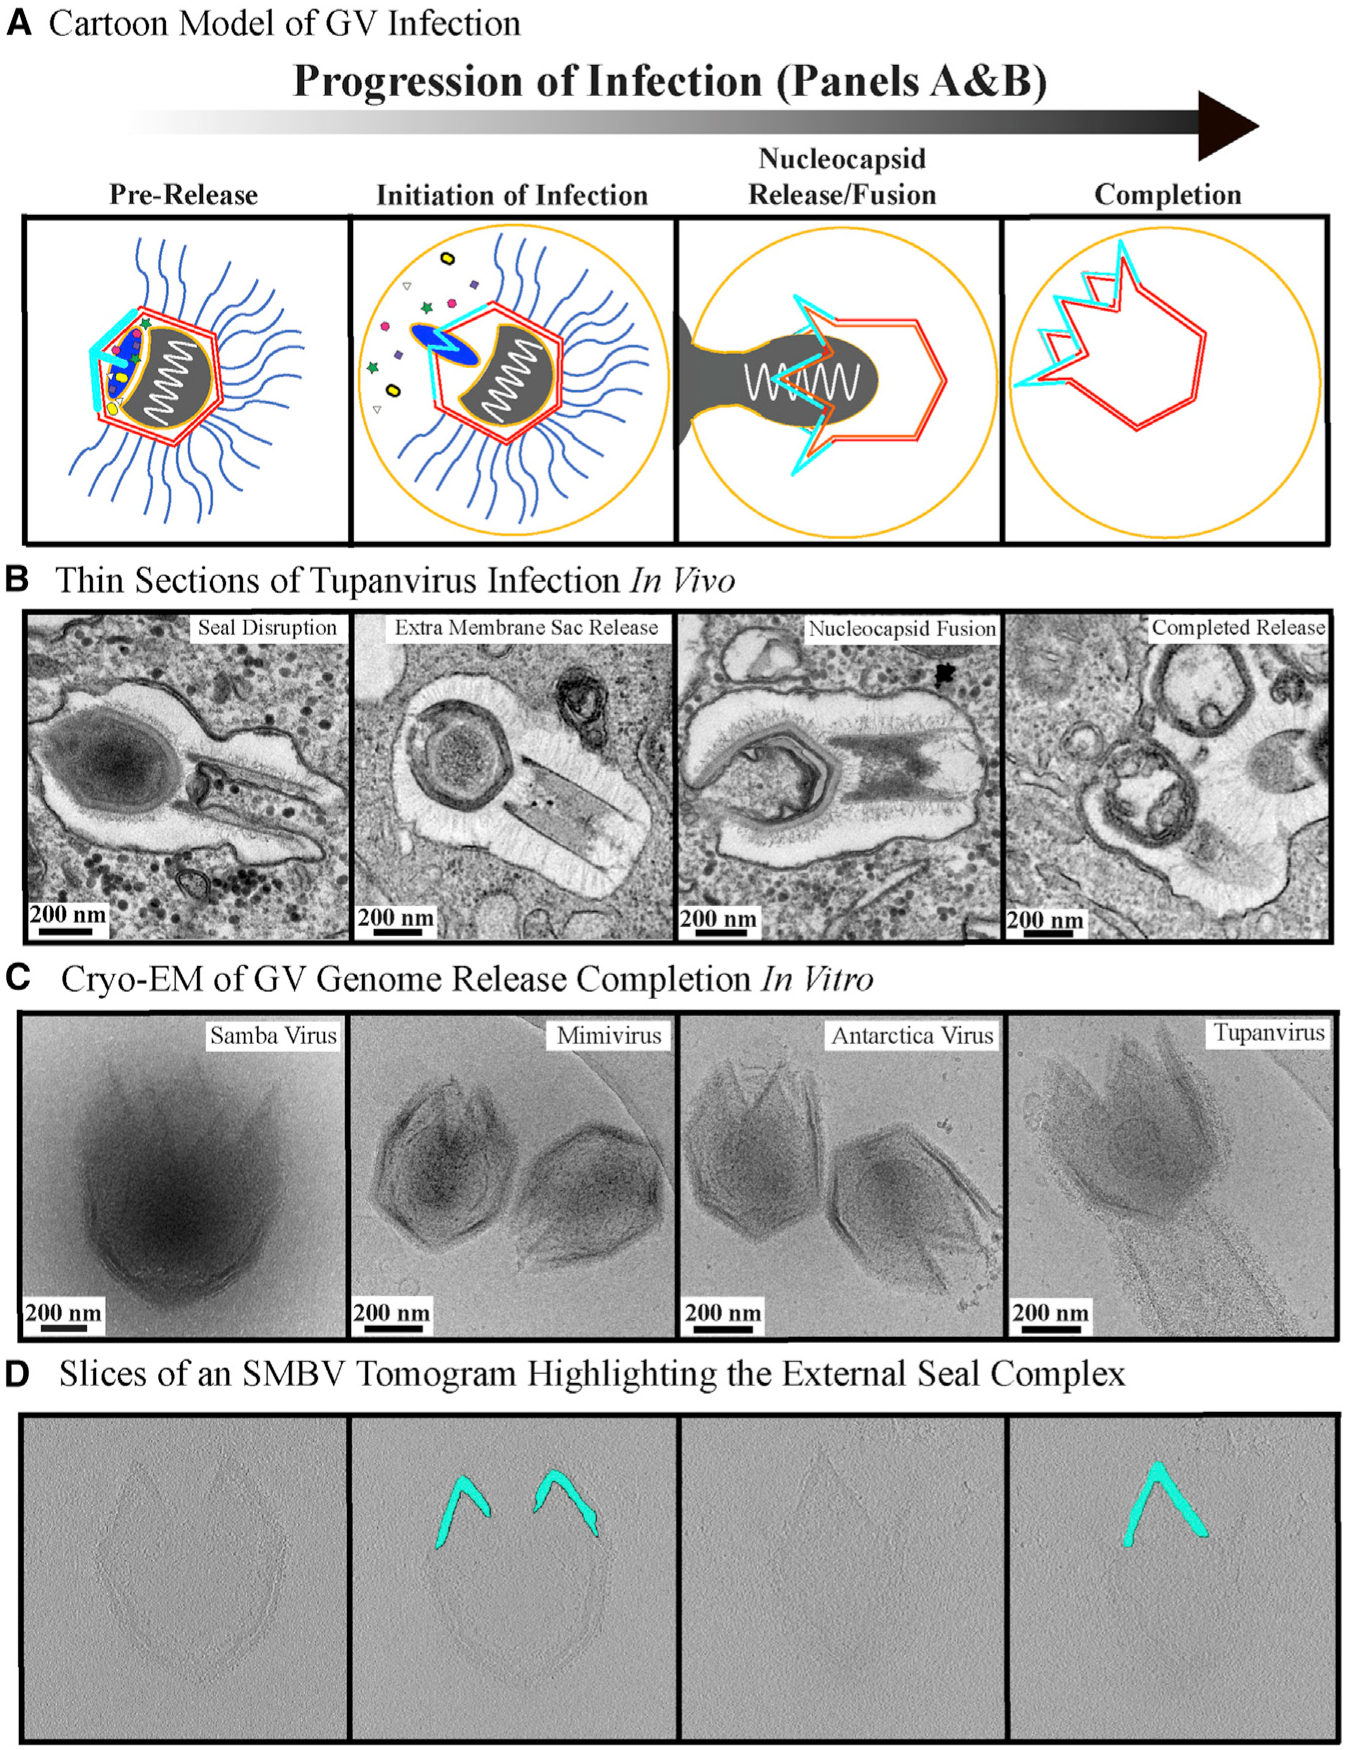
Figure 6. Giant Virus Genome Release Process.

(A and B) The progression of GV genome release depicted as a cartoon (A) and through thin section TEM images (B). The thin-section micrographs represent Tupanvirus particles visualized at varying stages of the infection process in vivo. The panels for “seal disruption” and “nucleocapsid fusion” were previously published in Abrahão et al. (2018) and shown under Creative Commons Attribution 4.0 International License, which permits unrestricted use, distribution, modification, and reproduction. The remaining two panels are original images.
(C) Cryoelectron micrographs of the completion of the in vitro genome release process for the four GVs studied here.
(D) Z slices of an SMBV tomogram of fully opened particles highlighting the density corresponding to the starfish seal.
