

Abstract
Background:
A systematic review and meta-analysis of available studies was performed to investigate the clinical characteristics that can predict COVID-19 disease severity.
Materials and Methods:
Databases including PubMed, Embase, and Web of Science were searched from December 31, 2019, to May 24, 2020. Random-effects meta-analysis was used for summarizing the Pooled odds ratio (pOR) of individual clinical characteristics to describe their association with severe COVID-19 disease.
Results:
A total of 3895 articles were identified, and finally, 22 studies comprising 4380 patients were included. Severe disease was more common in males than females (pOR: 1.36, 95% confidence interval [CI]: 1.08–1.70). Clinical features that were associated with significantly higher odds of severe disease were abdominal pain (pOR: 6.58, 95% CI: 1.56–27.67), breathlessness (pOR: 3.94, 95% CI: 2.55–6.07), and hemoptysis (pOR: 3.35, 95% CI: 1.05–10.74). pOR was highest for chronic obstructive pulmonary disease (pOR: 2.92, 95% CI: 1.70–5.02), followed by obesity (pOR: 2.84, 95% CI: 1.19–6.77), malignancy (pOR: 2.38, 95% CI: 1.25–4.52), diabetes (pOR: 2.29, 95% CI: 1.56–3.39), hypertension (pOR: 1.72, 95% CI: 1.23–2.42), cardiovascular disease (pOR: 1.61, 95% CI: 1.31–1.98) and chronic kidney disease (pOR: 1.46, 95% CI: 1.06–2.02), for predicting severe COVID-19.
Conclusion:
Our analysis describes the association of specific symptoms and comorbidities with severe COVID-19 disease. Knowledge of these clinical determinants will assist the clinicians in the risk-stratification of these patients for better triage and clinical management.
Keywords: Clinical determinants, clinical predictors, COVID-19, meta-analysis, severe disease
INTRODUCTION
The novel coronavirus, named as severe acute respiratory syndrome coronavirus 2, was identified in Wuhan, China, in December 2019. The disease caused by the virus, COVID-19, has created havoc all over the world and has been declared pandemic by the World Health Organization (WHO). As of March 21, 2020, 11,183 patients have succumbed to this disease and with the rapid spread of the disease, these numbers might run into millions.[1]
The clinical spectrum of COVID-19 disease is wide, ranging from nonsevere (asymptomatic infection and mild respiratory tract infection) to severe disease (severe pneumonia and critical illness, including multiorgan dysfunction).[2] In a case series of 44,672 confirmed COVID-19 patients, 14% had severe, and 5% had critical disease.[2] However, most of the patients present with fever, dry cough, myalgia and have a favorable prognosis.[2] Older patients and those with comorbidities progress to severe disease and have worse outcomes.[3]
With overwhelmed health-care systems and no proven treatment, it is important to identify the patients who could have a high likelihood of progression to severe disease. This will help the concerned physicians to allocate the resources judiciously. The goal of this investigation was to identify the clinical determinants which are associated with severe COVID-19 disease.
MATERIALS AND METHODS
Data sources and searches
This systematic review was performed according to the Preferred Reporting Items for Systematic Review and Meta-analysis (PRISMA). Databases including PubMed, Embase, and Web of Science were searched from December 31, 2019, to May 24, 2020. There were no restrictions in terms of country, publication language or publication date. Reference lists of all relevant articles and “related citation” search tool of PubMed were checked for any additional publications. The detailed search criteria used are available in Supplement.
Selection criteria
Study selection was performed by two independent investigators (A. S. and P. A.). We included studies that focused on individual symptoms and comorbidities of laboratory-confirmed COVID-19 patients and reported the data according to disease severity or ICU admission. Case reports, duplicate publications, reviews, editorials, letters, and family-based studies, studies with insufficient data on symptoms/comorbidities on admission in either severe or non-severe disease groups, and studies reporting exclusively on pediatric (<18 years age) or pregnant populations were excluded. Discrepancies between the reviewers were resolved in the presence of a third reviewer (J. N.).
Data abstraction and quality assessment
Data collected included: study characteristics – authors, publication date, study design, country, sample size; patient's characteristics – median age with interquartile range, sex (% men); criteria for severe disease; total number of severe and non-severe patients; and clinical characteristics (clinical features and comorbidities) at admission – overall prevalence and prevalence among severe and non-severe patients. One reviewer extracted the data (A. S.) and second reviewer (S. S) verified the data independently. The methodological quality of the study was assessed with the Appraisal tool for Cross-Sectional Studies (AXIS) tool.[4] Two authors (S. S, A. S.) performed the quality assessment separately, and disagreements were resolved by consensus in the presence of a third reviewer (P. A.). In the AXIS tool, for every correct answer, score of one was assigned to each of the twenty questions.
Quantitative data synthesis
Patient numbers were extracted across all the included studies for each group (severe and non-severe) according to the individual symptoms and comorbidities. The odds ratio (OR, 95% confidence intervals [CIs]) of individual clinical characteristics was used to describe their association with severe COVID-19 disease. These ORs were further pooled using random-effects meta-analysis. To assess the heterogeneity among studies, inconsistency statistics (I2) were calculated. I2 >50% was considered as significant heterogeneity. Publication bias was visually analyzed from Funnel plots and Egger's regression was also performed. P value for Egger's regression coefficient < 0.05 was considered as significant publication bias. All data were collected in Microsoft Excel Spreadsheet (MS Office – 2018). Random-effects analysis, generation of forest plot, assessment of heterogeneity, and publication bias were performed with the METAN platform for STATA (version-14.2); StataCorp, College Station, TX.
As the study design was a systematic review and meta-analysis, Institute Ethics Committee approval was not sought.
RESULTS
Search results and study characteristics
The literature search flow diagram is summarized in PRISMA format [Figure 1]. Using our search criteria (available in supplement), we identified 3895 studies, of which 3645 were from PubMed, 50 were from EMBASE, and 200 were from Web of Science. A total of 209 records were screened after the removal of duplicates. A total of 87 full-text articles were assessed for eligibility and 65 articles were excluded due to various reasons, as shown in Figure 1. Finally, 22 studies were included in this meta-analysis.
Figure 1.
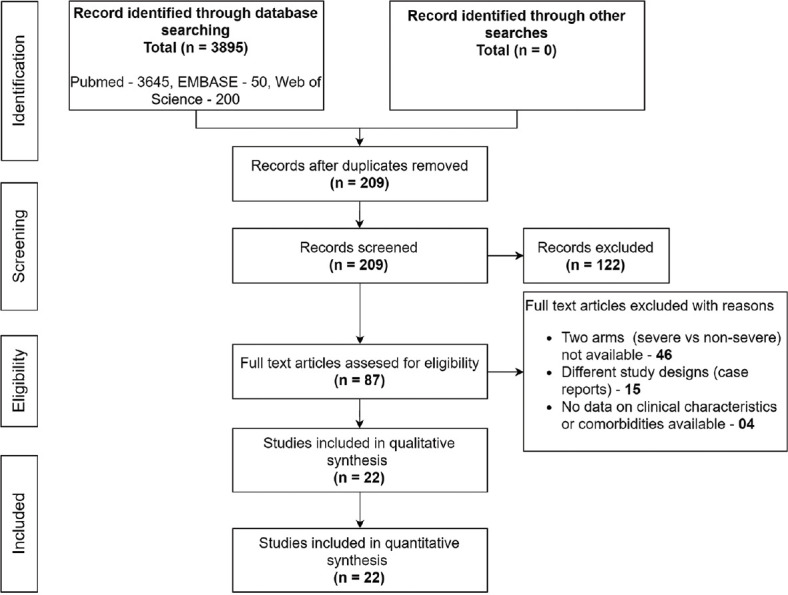
Preferred Reporting Items for Systematic Reviews and Meta-analyses (PRISMA) flow diagram
Characteristics of included studies
A total of 22 studies, consisting of 4380 patients, were selected for this meta-analysis [Table 1]. Studies were published recently between January 24, 2020 and May 24, 2020. Individual study population size ranged between 12 and 1494 patients. Fifty-six percent of the study population were males. Median age of the patients in severe disease cohort varied from 45.2 to 67 years, whereas median age in non-severe disease cohort varied from 37 to 68.5 years. Individual symptoms studied were cough,[5,6,7,9,10,12,16,18,19,20] expectoration,[5,6,7,9,10,14,18,19,21] fever,[5,6,9,10,11,13,14,15,16,17,18,19,20,21] breathlessness,[5,6,9,10,11,13,14,15,16,17,18,19,20,21] hemoptysis,[5,6] sore throat,[5,7,9,10,15,16,18,21] fatigue,[5,6,9,10,11,13,14,16,17,18] myalgia,[6,7,9,10,12,16,18,19,21] headache,[5,6,7,8,9,10,12,16,18,21] nausea/vomiting,[5,9,11,12,16,18,21] diarrhea,[5,7,9,11,12,15,16,17,18,21] abdominal pain,[9,11] anorexia,[9,11] and anosmia.[16,18] The various comorbidities studied were chronic obstructive pulmonary disease (COPD)[5,6,7,9,11,12,16,17,18,19,21,22,23,24,25,26] diabetes[5,6,7,9,11,12,13,14,16,17,18,19,21,22,23,24,25,26] obesity,[16,18,22] hypertension,[5,6,7,9,11,12,13,14,16,17,18,19,21,22,23,25,26] cardiovascular disease (CVD), [5,6,7,9,11,12,13,14,16,17,18,19,21,22,24,25] cerebrovascular accidents,[5,9,11,16,18,19,21,24] chronic kidney disease (CKD),[5,9,11,12,16,18,21,24,25,26] chronic liver disease,[6,9,11,19,21,24] malignancy,[5,6,9,16,17,19,21,23,26] and immunocompromised state.[5,18,24] Majority of the studies (13) were from China,[5,6,7,8,9,10,11,12,13,14,22,23,26] however, three studies were from the United States,[16,18,4] two from Italy[17,21] and one each from Singapore,[15] Norway,[20] South Korea[19] and Israel.[25] Each study was retrospective observational in design. The number of clinical characteristics including comorbidities reported in each study, varied from 3 in one study[20] to 21 in another study.[5] Patients with severe disease were older compared to those with non-severe disease (59.8 years vs. 50.8 years, P = 0.008). According to the WHO-China joint mission,[2] severe disease was defined as tachypnea (≥30 breaths/min) or oxygen saturation ≤ 93% at rest, or ratio of arterial oxygen saturation and fraction of inspired oxygen < 300 mmHg, and critical disease was defined as respiratory failure requiring mechanical ventilation, shock, or other organ failure that requires intensive care. Severe/critical disease were considered “Severe” in most of the studies.[5,7,8,10,12,16,23] Intensive care unit (ICU) admission was considered as “Severe/critical disease” in six studies.[18,19,20,21,24,25] Results of quality assessment of the included studies are summarized as AXIS scores in Table 1. Overall quality of studies was good, with thirteen out of twenty-two studies having scores above average (score ≥ 15).
Table 1.
Characteristics of the included studies
| Author | Publication date | Country | Sample size |
Age (median, IQR) |
Male (%) |
Clinical characteristics included |
Definition of severity | Quality of study (score out of 20)** | |||||
|---|---|---|---|---|---|---|---|---|---|---|---|---|---|
| Total | Severe | Nonsevere | Severe | Nonsevere | Severe | Nonsevere | Numbers | Characteristics* | |||||
| Huang C | January 24, 2020 | China | 41 | 13 | 28 | 49 (41-61) | 49 (41-57.5) | 85 | 68 | 13 | a, b, c, d, e, g, i, n, o, p, q, t, v | Requiring ICU care | 16 |
| Wang D | February 07, 2020 | China | 138 | 36 | 102 | 66 (57-78) | 51 (37-62) | 61.1 | 52 | 20 | a, b, c, d, f, g - t, v | Requiring ICU care | 16 |
| Liu Y | February 09, 2020 | China | 12 | 6 | 6 | 64 | 43.5 | 50 | 83.3 | 11 | a, c, h, i, j, k, n, o, p, q, s | Severe and critical disease | 12 |
| Zhang J | February 18, 2020 | China | 140 | 58 | 82 | 64 (25-87) | 51.5 (26-78) | 56.9 | 46.3 | 16 | a, c, d, g, j, k, l, m, n - t | Severe and critical disease | 15 |
| Xu Y | February 21, 2020 | China | 50 | 13 | 37 | NA | NA | 54 | 59.5 | 8 | a, b, c, d, f, g, h, i | Severe and critical disease | 14 |
| Tian S | February 27, 2020 | China | 262 | 46 | 216 | 61.4 (1-94) | 44.5 (1-93) | 56.5 | 46.8 | 4 | a, c, d, i | Severe and critical disease | 16 |
| Guan W | February 28, 2020 | China | 1099 | 173 | 926 | 52 (40-65) | 45 (34-57) | 57.8 | 58.2 | 21 | a - s, v, w | Severe and critical disease | 16 |
| Liu W | February 28, 2020 | China | 78 | 11 | 67 | 66 (51-70) | 37 (32-41) | 63.6 | 47.8 | 4 | n, o, p, v | Clinical deterioration to severe or critical disease or death | 16 |
| Li K | February 29, 2020 | China | 83 | 25 | 58 | 53.7 (12.3) | 41.9 (10.6) | 60 | 50 | 12 | a, b, c, d, f, h, i, k, n, o, p, q | Severe and critical disease | 16 |
| Yudong P | March 02, 2020 | China | 112 | 16 | 96 | 57.5 (54-63) | 62 (55-67.5) | 56.25 | 45.83 | 7 | a, c, d, g, o, p, q | Critical disease | 15 |
| Young B | March 03, 2020 | Singapore | 18 | 6 | 12 | 56 (47-73) | 37 (31-56) | 33 | 58 | 5 | a, c, d, f, k | Requiring supplemental oxygen | 12 |
| Wu C | March 13, 2020 | China | 201 | 84 | 117 | 58.5 (50-69) | 48 (40-54) | 71.4 | 58.1 | 8 | a, b, c, d, g, o, p, q | Acute respiratory distress syndrome | 17 |
| Gao Y | March 17, 2020 | China | 43 | 15 | 28 | 45.2 (7.68) | 43 (14) | 60 | 60.7 | 5 | n, o, p, q, u | Not clear | 14 |
| Chow N (CDC US) | March 31, 2020 | US | 1494 | 457 | 1037 | NA | NA | NA | NA | 7 | n, o, q, r, s, t, w | Requiring ICU care | 15 |
| Ihle-hansen H | April 10, 2020 | Norway | 42 | 9 | 33 | 71.8 | 66.8 | NA | NA | 3 | a, c, d | Requiring ICU care | 17 |
| Colaneri M | April 23, 2020 | Italy | 44 | 17 | 27 | NA | NA | 76.5 | 55.6 | 10 | a, c, d, g, k, n-q, v | Requirement for highflow oxygen | 17 |
| Hong K | April 24, 2020 | South Korea | 98 | 13 | 85 | NA | NA | 46.2 | 37.6 | 12 | a-d, h, n-r, t, v | Requiring ICU care | 16 |
| Aggarwal S | April 29, 2020 | US | 16 | 8 | 8 | 67 (38-70) | 68.5 (41-95) | 63 | 88 | 18 | a, b, d, f-k, x, n-s, u, v | Critical disease | 14 |
| Zhao X | April 29, 2020 | China | 91 | 30 | 61 | NA | NA | 46.7 | 57.4 | 6 | n-q, s, v | Not clear | 15 |
| Lagi F | April 30, 2020 | Italy | 84 | 16 | 68 | 67 (58-71) | 62 (50-72) | 87.5 | 60.3 | 17 | a-d, f, h-k, n-t, v | Requiring ICU care | 18 |
| Itelman E | May 01, 2020 | Israel | 162 | 26 | 136 | NA | NA | 80.8 | 51.9 | 5 | n-q, s | Requiring ICU care | 17 |
| Ferguson J | May 14, 2020 | US | 72 | 21 | 51 | 57.6 (42.2-70.1) | 61.7 (46.6-72.9) | 61.9 | 49 | 19 | a-d, f-k, x, n-s, u, w | Requiring ICU care | 19 |
*Clinical characteristics: Clinical symptoms - a: Cough, b: Expectoration, c: Fever, d: Dyspnea, e: Hemoptysis, f-: Sore throat, g: Fatigue, h: Myalgia, i: Headache, j: Nausea or vomiting, k: Diarrhea, l-abdominal pain, m: Anorexia; n: Chronic obstructive pulmonary disease, o: Diabetes, p: Hypertension, q: Cardiovascular diseases, r: Cerebrovascular accidents, s: Chronic kidney disease, t: Chronic liver disease, u: Obesity, v: Malignancy, w: Immunodeficiency, x: Anosmia. ^Severe disease (any of the following conditions): I, respiratory distress, RR ≥30 breaths/min; II, oxygen saturation ≤93% at rest; III, PaO2/FiO2 ≤300 mmHg (1 mmHg=0.133 kPa); AND critical disease (any of the following conditions): I, respiratory failure and a requirement for mechanical ventilation; II, shock; III, concomitant failure of other organs and requirement for ICU monitoring and treatment[2], **Scores for each study in AXIS tool. RR: Respiratory rate, PaO2/FiO2: Partial pressure of oxygen/fraction of inspired oxygen, ICU: Intensive care unit, AXIS: Appraisal tool for Cross-Sectional Studies, IQR: Interquartile range, NA: Not available
Quantitative data synthesis results
ORs of severe disease were pooled for each of the individual symptoms and comorbidities. Forest plots of pOR and funnel plots for each of the clinical determinants are depicted in Supplementary Figure S1 (220.9KB, tif) -S50 (220KB, tif) , Table 2 and Figure 2 summarizes the pOR for each clinical determinant (clinical feature at admission and comorbidities). Severe disease was more common in males than females (pOR: 1.36, 95% CI: 1.08–1.70). Clinical features associated with significantly higher odds of disease severity were abdominal pain (pOR: 6.58, 95% CI: 1.56–27.67) and breathlessness (pOR: 3.94, 95% CI: 2.55–6.07). Fever (pOR: 1.48, 95% CI: 1.19–1.85) and hemoptysis (pOR: 3.35, 95% CI: 1.05–10.74) were also associated with severe disease, although their lower confidence levels were approaching near one. Patients with comorbidities were also at higher odds of presenting with severe COVID-19 disease. pOR was highest for COPD (pOR: 2.92, 95% CI: 1.70–5.02), followed by obesity (pOR: 2.84, 95% CI: 1.19–6.77), malignancy (pOR: 2.38, 95% CI: 1.25–4.52), diabetes (pOR: 2.29, 95% CI: 1.56–3.39), hypertension (pOR: 1.72, 95% CI: 1.23–2.42), CVD (pOR: 1.61, 95% CI: 1.31–1.98) and CKD (pOR: 1.46, 95% CI: 1.06–2.02). With the exception of the studies considered for breathlessness, nausea/vomiting, anorexia, and diabetes, none of the studies included in the meta-analysis for comorbidities had statistical heterogeneity (I2 < 50%). Funnel plot analyses [Supplementary Figures: S1 (220.9KB, tif) -S50 (220KB, tif) ] and Egger's regression [Table 2] demonstrated the evidence of publication bias in the meta-analysis of studies focussing on fever, COPD and CVD.
Table 2.
Summary of meta-analyses for each of the clinical symptoms and comorbidities that are associated with severe COVID-19 infection
| Clinical characteristics | Odds ratio | Lower CL | Upper CL | Number of studies | Total patients included in meta-analysis | Prevalence of characteristics in severe disease (n/N) | Prevalence of characteristics in mild disease (n’/N’) | I2 (%) | Publication bias (Egger’s P value) |
|---|---|---|---|---|---|---|---|---|---|
| Demographic characteristics | |||||||||
| Male gender | 1.36 | 1.08 | 1.70 | 20 | 2844 | - | - | 13.4 | 0.16 |
| Clinical characteristics | |||||||||
| Cough | 1.24 | 0.98 | 1.56 | 17 | 2512 | 392/560 | 1242/1952 | 5.0 | 0.26 |
| Expectoration | 1.15 | 0.73 | 1.82 | 9 | 1866 | 132/394 | 454/1472 | 47.8 | 0.65 |
| Fever | 1.48 | 1.19 | 1.85 | 17 | 2512 | 369/560 | 1055/1952 | 0.0 | 0.03 |
| Dyspnea | 3.94 | 2.55 | 6.07 | 16 | 2500 | 251/554 | 339/1946 | 56.1 | 0.12 |
| Hemoptysis | 3.35 | 1.05 | 10.74 | 2 | 1140 | 5/186 | 7/954 | 0.0 | NA |
| Sore throat | 1.39 | 0.77 | 2.49 | 8 | 1560 | 47/298 | 168/1262 | 29.6 | 0.79 |
| Fatigue | 1.22 | 0.83 | 1.81 | 10 | 1913 | 196/439 | 607/1474 | 41.6 | 0.23 |
| Myalgia | 1.25 | 0.87 | 1.79 | 9 | 1652 | 73/311 | 249/1341 | 8.0 | 0.34 |
| Headache | 1.15 | 0.80 | 1.64 | 9 | 1857 | 44/357 | 174/1500 | 0.0 | 0.89 |
| Nausea/vomiting | 0.68 | 0.30 | 1.51 | 7 | 1561 | 29/318 | 104/1243 | 55.6 | 0.31 |
| Diarrhea | 1.43 | 0.93 | 2.21 | 10 | 1706 | 36/366 | 88/1340 | 0.0 | 0.74 |
| Abdominal pain | 6.58 | 1.56 | 27.67 | 2 | 278 | 9/94 | 2/184 | 0.0 | NA |
| Anorexia | 2.54 | 0.74 | 8.70 | 2 | 278 | 32/94 | 40/184 | 72.3 | NA |
| Anosmia | 0.61 | 0.11 | 3.48 | 2 | 88 | 2/29 | 5/59 | 0.0 | NA |
| Comorbid illness | |||||||||
| Chronic obstructive pulmonary disease | 2.92 | 1.70 | 5.02 | 16 | 3695 | 124/925 | 177/2770 | 23.3 | <0.01 |
| Diabetes | 2.29 | 1.56 | 3.39 | 18 | 4008 | 258/1025 | 413/2983 | 50.5 | 0.08 |
| Obesity | 2.84 | 1.19 | 6.77 | 3 | 131 | 18/44 | 18/87 | 0.0 | 0.43 |
| Hypertension | 1.72 | 1.23 | 2.42 | 17 | 2514 | 182/568 | 412/1946 | 41.6 | 0.41 |
| Cardiovascular disease | 1.61 | 1.31 | 1.98 | 16 | 3839 | 199/984 | 372/2855 | 0.0 | 0.01 |
| Cerebrovascular accidents | 1.68 | 0.73 | 3.84 | 8 | 3141 | 21/782 | 44/2359 | 32.1 | 0.45 |
| Chronic kidney disease | 1.46 | 1.06 | 2.02 | 10 | 3308 | 70/831 | 112/2477 | 0.0 | 0.16 |
| Chronic liver disease | 1.55 | 0.75 | 3.18 | 6 | 1995 | 12/593 | 20/1402 | 0.0 | 0.90 |
| Malignancy | 2.38 | 1.25 | 4.52 | 9 | 1689 | 19/317 | 29/1372 | 0.0 | 0.81 |
| Immunocompromised state | 1.46 | 0.98 | 2.17 | 3 | 2665 | 42/651 | 70/2014 | 0.0 | 0.33 |
CL: Confidence limits, n: Number of patients with the clinical determinant among patients with severe disease, N: Total number of patients with severe disease, n’: Number of patients with the clinical determinant among patients with mild disease, N’: Total number of patients with severe disease, I2: Heterogeneity statistics, Egger’s P<0.05: Publication bias present
Figure 2.

Summary of pooled odds ratio for each of the presenting clinical features and comorbidities. OR – pooled odds ratio, LCL – lower confidence limit of OR, UCL – upper confidence limit of OR, COPD – chronic obstructive pulmonary disease, CVD – cardiovascular diseases, CVA – cerebrovascular accidents, CLD – chronic liver disease, CKD – chronic kidney disease
DISCUSSION
COVID-19 is a rapidly progressing pandemic affecting millions of people worldwide. With the surge of cases, it is expected to overwhelm health-care systems, thereby making it important for physicians to identify clinical characteristics that could point toward progression-to-severe illness. In our meta-analysis of 4380 patients, we found that patients presenting with complaints of breathlessness, hemoptysis and/or abdominal pain, and comorbidities had significantly higher odds of having severe disease.
Multiple studies have shown that patients with breathlessness on arrival had a higher likelihood development of acute respiratory distress syndrome and ICU requirements.[7,14,9] In studies conducted by Guan et al. and Huang et al., the incidence of hemoptysis was higher among patients with severe disease as compared to that of non-severe disease, although its proportion was lower in both the study groups.[5,6] In a study by Zhang et al., few COVID-19 patients presented with atypical abdominal pain and were initially admitted to the surgical ward but subsequently required ICU. These patients were presumed to infect others during their hospital stay, and the newly infected patients also had abdominal pain at presentation. Hence, some authors have suggested the gastrointestinal tract as an alternative route for viral transmission.[27] Hence, it is necessary to not miss abdominal pain as a rare but important predictor of severe disease. Therefore, any patient presenting with SARI with suspicion of COVID-19 and complaints of breathlessness, hemoptysis and/or abdominal pain should be admitted and evaluated further before deciding further course of treatment. These symptoms, along with fever and cough, might act as warning signs of severe disease.
In most of the included studies, the patients in the severe group had a higher median age when compared to the non-severe group, which was consistent with previous reports.[14,23] Our meta-analysis showed that patients with COPD had the highest risk of the development of severe disease, followed by obesity, malignancy, diabetes, hypertension, CVD, and CKD. A previous meta-analysis of eight studies had shown CVD, respiratory illness, and hypertension as significant predictors of severe disease.[28] The study differs in terms of the inclusion of a greater number of studies and comorbidities. A weaker immune system might explain the higher likelihood of the development of severe disease among older patients with comorbidities.
There are certain limitations of this meta-analysis. The studies included are retrospective in nature with considerable heterogeneity. Further, 13 out of 22 of the studies are from a single country. The criteria of severe disease were also not similar across all the included studies, thereby limiting the strength of our observations. We have also not included the studies exclusively reporting predictors of mortality in COVID-19 patients. Finally, it is possible that newer studies might have been published between the completion of this literature review and its publication.
CONCLUSION
Our analysis describes the presence of a significant association of the severe disease with the male gender and specific presenting symptoms such as breathlessness, abdominal pain, hemoptysis, fever, and cough. The presence of comorbidities, namely, COPD, CKD, diabetes, CVD and hypertension were also significant risk factors for severe disease, which is in line with previous studies. Knowledge of these clinical determinants will assist the clinicians in the risk-stratification of the patients for better triage and clinical management.
What is already known on the subject
Patients with COVID-19 presents with a wide spectrum of clinical manifestations, i.e., asymptomatic, mild upper respiratory tract symptoms, severe disease, and critical disease
It is difficult to predict the disease progression early in the course of illness
Multiple laboratory parameters, comorbid illness, and advanced age have been shown to predict the disease prognosis.
Study's main messages
This updated meta-analysis consisted of 22 studies comprising 4380 patients
Severe disease was more common in males than females
Clinical features that were associated with significantly higher odds of severe disease were abdominal pain, breathlessness, and hemoptysis
pOR was highest for chronic obstructive pulmonary disease, followed by obesity, malignancy, diabetes, hypertension, CVD , and CKD, for predicting severe COVID-19
Knowledge of these clinical determinants will help the clinician to triage and manage the patients carefully, and appropriately allocate the resources in this resource-constraining pandemic.
Financial support and sponsorship
Nil.
Conflicts of interest
There are no conflicts of interest.
Forest plot of odds ratio for cough as a predictor of disease severity
Funnel plot of odds ratio for cough as a predictor of disease severity
Forest plot of odds ratio for expectoration as a predictor of disease severity
Funnel plot of odds ratio for expectoration as a predictor of disease severity
Forest plot of odds ratio for fever as a predictor of disease severity
Funnel plot of odds ratio for fever as a predictor of disease severity
Forest plot of odds ratio for dyspnea as a predictor of disease severity
Funnel plot of odds ratio for dyspnea as a predictor of disease severity
Forest plot of odds ratio for hemoptysis as a predictor of disease severity
Funnel plot of odds ratio for hemoptysis as a predictor of disease severity
Forest plot of odds ratio for sore throat as a predictor of disease severity
Funnel plot of odds ratio for sore throat as a predictor of disease severity
Forest plot of odds ratio for fatigue as a predictor of disease severity
Funnel plot of odds ratio for fatigue as a predictor of disease severity
Forest plot of odds ratio for myalgia as a predictor of disease severity
Funnel plot of odds ratio for myalgia as a predictor of disease severity
Forest plot of odds ratio for headache as a predictor of disease severity
Funnel plot of odds ratio for headache as a predictor of disease severity
Forest plot of odds ratio for nausea / vomiting as a predictor of disease severity
Funnel plot of odds ratio for nausea / vomiting as a predictor of disease severity
Forest plot of odds ratio for diarrhea as a predictor of disease severity
Funnel plot of odds ratio for diarrhea as a predictor of disease severity
Forest plot of odds ratio for abdominal pain as a predictor of disease severity
Funnel plot of odds ratio for abdominal pain as a predictor of disease severity
Forest plot of odds ratio for anorexia as a predictor of disease severity
Funnel plot of odds ratio for anorexia as a predictor of disease severity
Forest plot of odds ratio for anosmia as a predictor of disease severity
Funnel plot of odds ratio for anorexia as a predictor of disease severity
Forest plot of odds ratio for COPD as a predictor of disease severity
Funnel plot of odds ratio for COPD as a predictor of disease severity
Forest plot of odds ratio for diabetes as a predictor of disease severity
Funnel plot of odds ratio for diabetes as a predictor of disease severity
Forest plot of odds ratio for obesity as a predictor of disease severity
Funnel plot of odds ratio for obesity as a predictor of disease severity
Forest plot of odds ratio for hypertension as a predictor of disease severity
Funnel plot of odds ratio for hypertension as a predictor of disease severity
Forest plot of odds ratio for cardiovascular diseases as a predictor of disease severity
Funnel plot of odds ratio for cardiovascular diseases as a predictor of disease severity
Forest plot of odds ratio for cerebrovascular accidents as a predictor of disease severity
Funnel plot of odds ratio for cerebrovascular accidents as a predictor of disease severity
Forest plot of odds ratio for CKD as a predictor of disease severity
Funnel plot of odds ratio for CKD as a predictor of disease severity
Forest plot of odds ratio for chronic liver disease as a predictor of disease severity
Funnel plot of odds ratio for chronic liver disease as a predictor of disease severity
Forest plot of odds ratio for malignancy as a predictor of disease severity
Funnel plot of odds ratio for chronic liver disease as a predictor of disease severity
Forest plot of odds ratio for immunocompromised state as a predictor of disease severity
Funnel plot of odds ratio for immunocompromised state as a predictor of disease severity
Forest plot of odds ratio of gender for disease severity
Funnel plot of odds ratio of gender for disease severity
REFERENCES
- 1.Novel Coronavirus (2019-nCoV) Situation Reports 61. 2020. Mar 21, [Last accessed on 2020 Mar 21]. Available from: https://www.who.int/emergencies/diseases/novel-coronavirus-2019/situation-reports .
- 2.Wu Z, McGoogan JM. Characteristics of and important lessons from the coronavirus disease 2019 (COVID-19) outbreak in China: Summary of a report of 72 314 cases from the Chinese Center for Disease Control and Prevention. [Last accessed on 2020 Mar 28];JAMA. 2020 323(13):1239–42. doi: 10.1001/jama.2020.2648. Available from: https://jamanetwork.com/journals/jama/fullarticle/2762130 . [DOI] [PubMed] [Google Scholar]
- 3.Guan W, Ni Z, Hu Y, Liang W, Ou C, He J, et al. Clinical characteristics of coronavirus disease 2019 in China. [Last accessed on 2020 Mar 24];New England J Med. 2020 382(18):1708–20. doi: 10.1056/NEJMoa2002032. Available from: http://www.nejm.org/doi/10.1056/NEJMoa2002032 . [DOI] [PMC free article] [PubMed] [Google Scholar]
- 4.Downes MJ, Brennan ML, Williams HC, Dean RS. Development of a critical appraisal tool to assess the quality of cross-sectional studies (AXIS) BMJ Open. 2016;6:e011458. doi: 10.1136/bmjopen-2016-011458. [DOI] [PMC free article] [PubMed] [Google Scholar]
- 5.Guan WJ, Ni ZY, Hu Y, Liang WH, Ou CQ, He JX, et al. Clinical characteristics of coronavirus disease 2019 in China. N Engl J Med. 2020;382:1708–20. doi: 10.1056/NEJMoa2002032. [DOI] [PMC free article] [PubMed] [Google Scholar]
- 6.Huang C, Wang Y, Li X, Ren L, Zhao J, Hu Y, et al. Clinical features of patients infected with 2019 novel coronavirus in Wuhan, China. Lancet. 2020;395:497–506. doi: 10.1016/S0140-6736(20)30183-5. [DOI] [PMC free article] [PubMed] [Google Scholar]
- 7.Li K, Wu J, Wu F, Guo D, Chen L, Fang Z, et al. The clinical and chest CT features associated with severe and critical COVID-19 pneumonia. Investig Radiol. 2020;55:327–331. doi: 10.1097/RLI.0000000000000672. [DOI] [PMC free article] [PubMed] [Google Scholar]
- 8.Tian S, Hu N, Lou J, Chen K, Kang X, Xiang Z, et al. Characteristics of COVID-19 infection in Beijing. J Infect. 2020;80:401–6. doi: 10.1016/j.jinf.2020.02.018. [DOI] [PMC free article] [PubMed] [Google Scholar]
- 9.Wang D, Hu B, Hu C, Zhu F, Liu X, Zhang J, et al. Clinical characteristics of 138 hospitalized patients with 2019 novel coronavirus-infected pneumonia in Wuhan, China. JAMA. 2020;323(11):1061–9. doi: 10.1001/jama.2020.1585. [DOI] [PMC free article] [PubMed] [Google Scholar]
- 10.Xu YH, Dong JH, An WM, Lv XY, Yin XP, Zhang JZ, et al. Clinical and computed tomographic imaging features of novel coronavirus pneumonia caused by SARS-CoV-2. J Infect. 2020;80:394–400. doi: 10.1016/j.jinf.2020.02.017. [DOI] [PMC free article] [PubMed] [Google Scholar]
- 11.Zhang J, Dong X, Cao Y, Yuan Y, Yang Y, Yan Y, et al. Clinical characteristics of 140 patients infected with SARS-CoV-2 in Wuhan, China. Allergy. 2020;75:1730–41. doi: 10.1111/all.14238. [DOI] [PubMed] [Google Scholar]
- 12.Liu Y, Yang Y, Zhang C, Huang F, Wang F, Yuan J, et al. Clinical and biochemical indexes from 2019-nCoV infected patients linked to viral loads and lung injury. Sci China Life Sci. 2020;63:364–74. doi: 10.1007/s11427-020-1643-8. [DOI] [PMC free article] [PubMed] [Google Scholar]
- 13.Peng YD, Meng K, Guan HQ, Leng L, Zhu RR, Wang BY, et al. Clinical characteristics and outcomes of 112 cardiovascular disease patients infected by 2019-nCoV. Zhonghua Xin Xue Guan Bing Za Zhi. 2020;48:450–5. doi: 10.3760/cma.j.cn112148-20200220-00105. [DOI] [PubMed] [Google Scholar]
- 14.Wu C, Chen X, Cai Y, Xia J, Zhou X, Xu S, et al. Risk factors associated with acute respiratory distress syndrome and death in patients with coronavirus disease 2019 pneumonia in Wuhan, China. JAMA Intern Med. 2020;180(7):934. doi: 10.1001/jamainternmed.2020.0994. [DOI] [PMC free article] [PubMed] [Google Scholar]
- 15.Young BE, Ong SW, Kalimuddin S, Low JG, Tan SY, Loh J, et al. Epidemiologic features and clinical course of patients infected with SARS-CoV-2 in Singapore. JAMA. 2020;323:1488. doi: 10.1001/jama.2020.3204. [DOI] [PMC free article] [PubMed] [Google Scholar]
- 16.Aggarwal S, Garcia-Telles N, Aggarwal G, Lavie C, Lippi G, Henry BM. Clinical features, laboratory characteristics, and outcomes of patients hospitalized with coronavirus disease 2019 (COVID-19): Early report from the United States. Diagnosis (Berl) 2020;7:91–6. doi: 10.1515/dx-2020-0046. [DOI] [PubMed] [Google Scholar]
- 17.Colaneri M, Sacchi P, Zuccaro V, Biscarini S, Sachs M, Roda S, et al. Clinical characteristics of coronavirus disease (COVID-19) early findings from a teaching hospital in Pavia, North Italy, 21 to 28 February 2020. Euro Surveill. 2020;25(16):2000460. doi: 10.2807/1560-7917.ES.2020.25.16.2000460. [DOI] [PMC free article] [PubMed] [Google Scholar]
- 18.Ferguson J, Rosser JI, Quintero O, Scott J, Subramanian A, Gumma M, et al. Characteristics and outcomes of coronavirus disease patients under nmonsurge conditions, Northern California, USA, March-April 2020. Emerg Infect Dis. 2020;26:1679–85. doi: 10.3201/eid2608.201776. [DOI] [PMC free article] [PubMed] [Google Scholar]
- 19.Hong KS, Lee KH, Chung JH, Shin KC, Choi EY, Jin HJ, et al. Clinical features and outcomes of 98 patients hospitalized with SARS-CoV-2 infection in Daegu, South Korea: A brief descriptive study. Yonsei Med J. 2020;61:431–7. doi: 10.3349/ymj.2020.61.5.431. [DOI] [PMC free article] [PubMed] [Google Scholar]
- 20.Ihle-Hansen H, Berge T, Tveita A, Rønning EJ, Ernø PE, Andersen EL, et al. COVID-19: Symptoms, course of illness and use of clinical scoring systems for the first 42 patients admitted to a Norwegian local hospital. Tidsskrift Den Norske Legeforening 2020 [Ahead of print] doi: 10.4045/tidsskr.20.0301. doi-10.4045/tidsskr. 20.0301. [DOI] [PubMed] [Google Scholar]
- 21.Lagi F, Piccica M, Graziani L, Vellere I, Botta A, Tilli M, et al. Early experience of an infectious and tropical diseases unit during the coronavirus disease (COVID-19) pandemic, Florence, Italy, February to March 2020. Euro Surveill. 2020;25:25 (17):2000556. doi: 10.2807/1560-7917.ES.2020.25.17.2000556. [DOI] [PMC free article] [PubMed] [Google Scholar]
- 22.Gao Y, Li T, Han M, Li X, Wu D, Xu Y, et al. Diagnostic utility of clinical laboratory data determinations for patients with the severe COVID-19. J Med Virol. 2020;92:791–96. doi: 10.1002/jmv.25770. [DOI] [PMC free article] [PubMed] [Google Scholar]
- 23.Liu W, Tao ZW, Lei W, Ming-Li Y, Kui L, Ling Z, et al. Analysis of factors associated with disease outcomes in hospitalized patients with 2019 novel coronavirus disease. Chin Med J. 2020;133:1032–38. doi: 10.1097/CM9.0000000000000775. [DOI] [PMC free article] [PubMed] [Google Scholar]
- 24.Chow N, Fleming-Dutra K, Gierke R, Hall A, Hughes M, Pilishvili T, et al. Preliminary estimates of the prevalence of selected underlying health conditions among patients with coronavirus disease 2019 United States, February 12–March 28, 2020. MMWR Morb Mortal Wkly Rep. 2020;69:382–6. doi: 10.15585/mmwr.mm6913e2. [DOI] [PMC free article] [PubMed] [Google Scholar]
- 25.Itelman E, Wasserstrum Y, Segev A, Avaky C, Negru L, Cohen D, Turpashvili N, Anani S, Zilber E, Lasman N, Athamna A. Clinical characterization of 162 COVID-19 patients in Israel: preliminary report from a large tertiary center. The Israel Medical Association journal: IMAJ. 2020 May 1;22(5) [PubMed] [Google Scholar]
- 26.Zhao XY, Xu XX, Yin HS, Hu QM, Xiong T, Tang YY, et al. Clinical characteristics of patients with 2019 coronavirus disease in a non-Wuhan area of Hubei Province, China: A retrospective study. BMC Infect Dis. 2020;20:1–8. doi: 10.1186/s12879-020-05010-w. [DOI] [PMC free article] [PubMed] [Google Scholar]
- 27.Zhang H, Kang Z, Gong H, Xu D, Wang J, Li Z, et al. The digestive system is a potential route of 2019-nCov infection: A bioinformatics analysis based on single-cell transcriptomes. bioRxiv Cold Spring Harbor Lab. 2020.01.30.927806. doi: https://doi.org/10.1101/2020.01.30.927806. [Google Scholar]
- 28.Yang J, Zheng Y, Gou X, Pu K, Chen Z, Guo Q, et al. Prevalence of comorbidities in the novel Wuhan coronavirus (COVID-19) infection: A systematic review and meta-analysis. Int J Infect Dis. 2020;94:91–95. doi: 10.1016/j.ijid.2020.03.017. [DOI] [PMC free article] [PubMed] [Google Scholar]
Associated Data
This section collects any data citations, data availability statements, or supplementary materials included in this article.
Supplementary Materials
Forest plot of odds ratio for cough as a predictor of disease severity
Funnel plot of odds ratio for cough as a predictor of disease severity
Forest plot of odds ratio for expectoration as a predictor of disease severity
Funnel plot of odds ratio for expectoration as a predictor of disease severity
Forest plot of odds ratio for fever as a predictor of disease severity
Funnel plot of odds ratio for fever as a predictor of disease severity
Forest plot of odds ratio for dyspnea as a predictor of disease severity
Funnel plot of odds ratio for dyspnea as a predictor of disease severity
Forest plot of odds ratio for hemoptysis as a predictor of disease severity
Funnel plot of odds ratio for hemoptysis as a predictor of disease severity
Forest plot of odds ratio for sore throat as a predictor of disease severity
Funnel plot of odds ratio for sore throat as a predictor of disease severity
Forest plot of odds ratio for fatigue as a predictor of disease severity
Funnel plot of odds ratio for fatigue as a predictor of disease severity
Forest plot of odds ratio for myalgia as a predictor of disease severity
Funnel plot of odds ratio for myalgia as a predictor of disease severity
Forest plot of odds ratio for headache as a predictor of disease severity
Funnel plot of odds ratio for headache as a predictor of disease severity
Forest plot of odds ratio for nausea / vomiting as a predictor of disease severity
Funnel plot of odds ratio for nausea / vomiting as a predictor of disease severity
Forest plot of odds ratio for diarrhea as a predictor of disease severity
Funnel plot of odds ratio for diarrhea as a predictor of disease severity
Forest plot of odds ratio for abdominal pain as a predictor of disease severity
Funnel plot of odds ratio for abdominal pain as a predictor of disease severity
Forest plot of odds ratio for anorexia as a predictor of disease severity
Funnel plot of odds ratio for anorexia as a predictor of disease severity
Forest plot of odds ratio for anosmia as a predictor of disease severity
Funnel plot of odds ratio for anorexia as a predictor of disease severity
Forest plot of odds ratio for COPD as a predictor of disease severity
Funnel plot of odds ratio for COPD as a predictor of disease severity
Forest plot of odds ratio for diabetes as a predictor of disease severity
Funnel plot of odds ratio for diabetes as a predictor of disease severity
Forest plot of odds ratio for obesity as a predictor of disease severity
Funnel plot of odds ratio for obesity as a predictor of disease severity
Forest plot of odds ratio for hypertension as a predictor of disease severity
Funnel plot of odds ratio for hypertension as a predictor of disease severity
Forest plot of odds ratio for cardiovascular diseases as a predictor of disease severity
Funnel plot of odds ratio for cardiovascular diseases as a predictor of disease severity
Forest plot of odds ratio for cerebrovascular accidents as a predictor of disease severity
Funnel plot of odds ratio for cerebrovascular accidents as a predictor of disease severity
Forest plot of odds ratio for CKD as a predictor of disease severity
Funnel plot of odds ratio for CKD as a predictor of disease severity
Forest plot of odds ratio for chronic liver disease as a predictor of disease severity
Funnel plot of odds ratio for chronic liver disease as a predictor of disease severity
Forest plot of odds ratio for malignancy as a predictor of disease severity
Funnel plot of odds ratio for chronic liver disease as a predictor of disease severity
Forest plot of odds ratio for immunocompromised state as a predictor of disease severity
Funnel plot of odds ratio for immunocompromised state as a predictor of disease severity
Forest plot of odds ratio of gender for disease severity
Funnel plot of odds ratio of gender for disease severity