Abstract
We performed harmonized molecular and clinical analysis on 1,048 melanomas and discovered markedly different global genomic properties among subtypes (BRAF, (N)RAS, NF1, Triple Wild-Type), subtype-specific preferences for secondary driver genes, and active mutational processes previously unreported in melanoma. Secondary driver genes significantly enriched in specific subtypes reflected preferential dysregulation of additional pathways, such as induction of TGF-β signaling in BRAF melanomas and inactivation of the SWI/SNF complex in (N)RAS melanomas, and select co-mutation patterns coordinated selective response to immune checkpoint blockade. We also defined the mutational landscape of Triple Wild-Type melanomas and identified enrichment of DNA repair defect signatures in this subtype, which were associated with transcriptional downregulation of key DNA repair genes and may revive previously discarded or currently unconsidered therapeutic modalities for genomically stratified melanoma patient subsets. Broadly, harmonized meta-analysis of melanoma whole-exomes identified distinct molecular drivers that may point to multiple opportunities for biological and therapeutic investigation.
INTRODUCTION
Genomic characterization of melanoma led to the classification of four subtypes based on mutations in the most frequently mutated, mutually exclusive, driver genes: BRAF, (N)RAS, NF1 and Triple Wild-Type (TWT)1–2. These studies, the largest of which included 333 melanomas2, have augmented our understanding of the melanoma genomic landscape, informed development of effective therapies with targeted agents3–4 and enabled molecular stratification strategies for immune checkpoint blockade5–7. Still, only a subset of patients exhibit durable responses to therapies targeting these known genetic vulnerabilities. Furthermore, while cancer immunotherapy has revolutionized clinical management of advanced melanoma, only a subset of patients respond to these agents and new molecular targets remain a great clinical need8.
Identification of new molecular targets is challenging in melanoma due to the extremely high mutational load compared to most solid tumors, which is largely attributed to UV mutagenesis. As a result, power analysis has estimated that thousands of samples are required to saturate the landscape of significantly mutated genes (SMGs) in melanoma9. Additionally, while BRAF, (N)RAS, and NF1 mutants all converge on MAP kinase signaling, each of these melanoma subtypes is associated with distinctive clinical characteristics, outcomes and immune profiles suggesting molecular differences that could be informed by systematic characterization in sufficiently large patient cohorts1–2,10–12. Further, there has been no definitive molecular dissection of TWT melanomas for unbiased gene discovery.
We hypothesized that expanded and harmonized molecular analysis of a larger cohort of melanomas would identify new genetic drivers within and among these canonical genomic subtypes, and therapeutic vulnerabilities in genomically stratified patient subsets. Thus, we harmonized 1,048 melanoma tumor and matched germline whole-exome sequencing (WES) samples1–2,6–7,13–18 and performed uniform molecular analyses across and within established genomic subtypes to redefine the molecular properties that coordinate in heterogeneous melanoma patient populations.
RESULTS
Significantly Mutated Genes in Melanoma
In total, we aggregated and uniformly analyzed WES data from 1,048 melanomas with matched germline samples that passed joint quality control parameters (Methods, Supplementary Figure 1, Supplementary Tables 1–3, Supplementary Data 1). Our cohort comprised 494 BRAF, 290 (N)RAS, 102 NF1 and 162 TWT melanomas, with 5% of all melanomas having acral or mucosal origin. Additional histology information and raw sequencing metrics can be found in Supplementary Tables 2–3. The median nonsynonymous mutational load for the entire cohort was 7.94 mutations/Mb, and was significantly higher in the cutaneous melanomas compared to acral and mucosal melanomas (8.23 mut/Mb vs 1.87 mut/Mb; Mann-Whitney U, p = 1.01 x 10⁻¹⁵; Figure 1a).
Figure 1: Identification of consensus driver genes in melanoma.
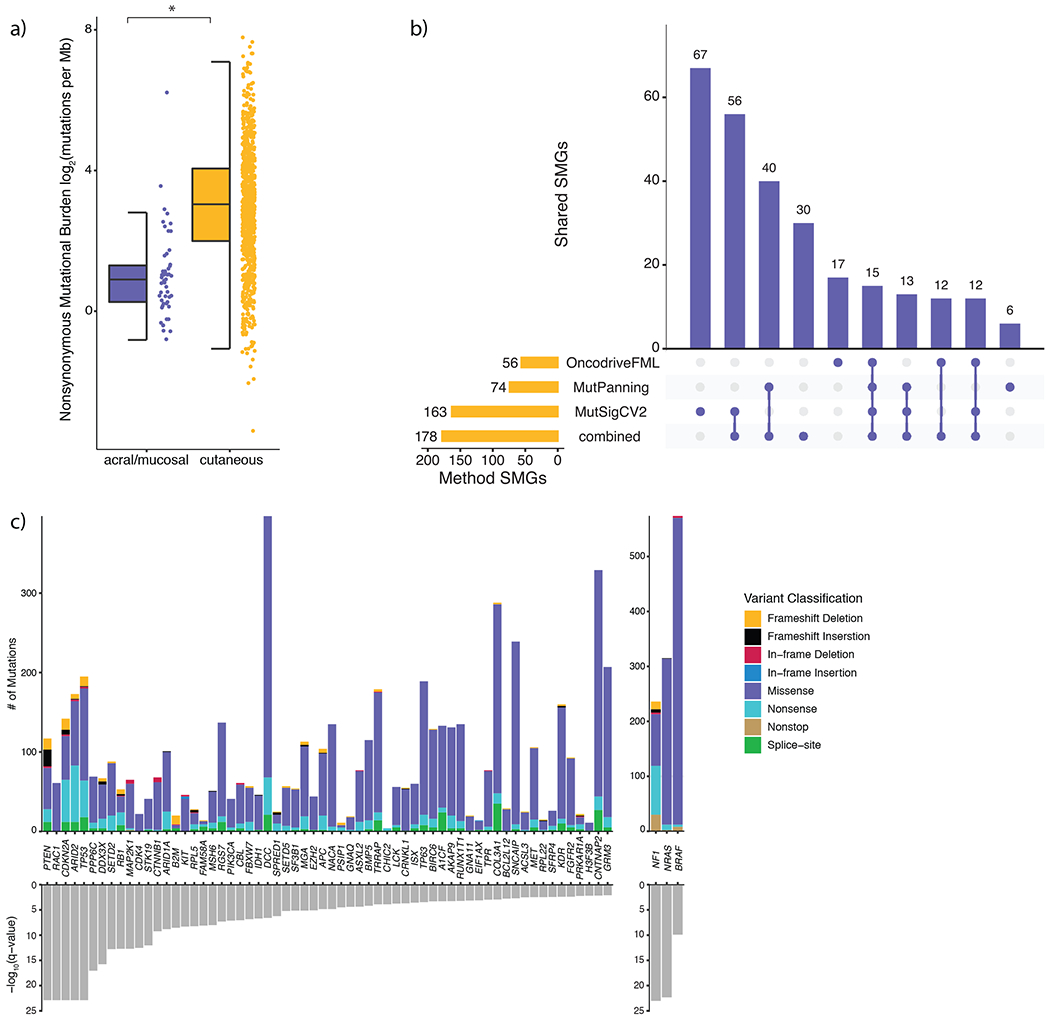
a) Nonsynonymous mutational load is significantly elevated in cutaneous (n = 871) melanomas compared to acral (n = 34) and mucosal (n = 17) melanomas (Mann-Whitney U, p = 9.79 x 10⁻¹⁶, two-sided). The data are represented as a boxplot where the middle line is the median, the lower and upper edges of the box are the first and third quartiles, the whiskers represent the interquartile range (IQR) multiplied by 1.5, and beyond the whiskers are outlier points. An asterisk denotes a Mann-Whitney U p-value < 0.05. b) The overlap between significantly mutated genes (SMGs) identified by each mutational significance algorithm (Benjamini-Hochberg, q-value cutoff < 0.05), and when combining the p-values via Brown’s method (Benjamini-Hochberg, q-value cutoff < 0.05). c) The distribution of mutation types in melanoma SMGs that are known cancer genes (CGC and OncoKB genes), ordered by statistical significance from left to right.
The statistical challenge of identifying cancer driver genes becomes increasingly difficult in cancers with high background mutation rates like melanoma9,19. To identify high-confidence melanoma driver genes, we utilized three orthogonal mutational significance algorithms that emphasize mutational recurrence, sequence context, and accumulated functional impact (MutSig2CV, MutPanning, and OncodriveFML respectively)9,19–21. We next applied Brown’s method to combine the p-values from each mutational significance algorithm, followed by a strict false discovery rate (FDR) cutoff (q < 0.01) and consideration of transcriptional activity in bulk and single cell melanoma transcriptomes to evaluate SMGs by lineage and potential function (Supplementary Figure 2–3, Methods), to reduce the number of false positive findings. This process yielded a set of 178 genes (excluding BRAF, (N)RAS, and NF1; Figure 1b, Supplementary Figures 2–5). When restricting to known cancer genes, 46 genes were present in both the COSMIC Cancer Gene Census (CGC v86) and OncoKB, while 10 and 6 genes were only present in the CGC and OncoKB, respectively (Figure 1c)22. A total of 157 novel candidate melanoma SMGs were identified through this set of high-confidence driver genes (Supplementary Data 2), 41 (26%) of which are known cancer genes. These novel SMGs have been experimentally implicated in MAPK signaling and therapeutic response (e.g. FGFR2 and LCK)23, tumor-intrinsic mediators of cancer immunotherapy (e.g. ARID1A, ASXL2, B2M, BRD7 and SETD2)24, and oncogenesis in other cancer types (e.g. CDK4 and MSH6)25–26 (Supplementary Table 4). Only 32 of the 83 SMGs previously identified in large melanoma studies (cohort size > 100), were classified as SMGs by any algorithm in our cohort (Benjamini-Hochberg q-value cutoff < 0.1, Supplementary Table 5)1–2,10,17.
Significantly Mutated Genes in Melanoma Genomic Subtypes
The median nonsynonymous mutational load varied widely between genomic subtypes (Mann-Whitney U, p < 3.82 x 10⁻⁸ for all pairwise), ranging from 2.06 mutations/Mb in TWT melanomas to 32.29 mutations/Mb in NF1 melanomas (Figure 2a), which is consistent with previous findings1–2,10,17. (N)RAS melanomas experienced a higher ratio of clonal mutations relative to the other genomic subtypes (Mann-Whitney U, p < 1.44 x 10⁻⁴ for all pairwise; Methods), whereas TWT melanomas experienced an elevated ratio of subclonal mutations (Mann-Whitney U, p < 0.014 for all pairwise). Further, BRAF and (N)RAS melanomas frequently had more clonal mutations than subclonal mutations, while NF1 and TWT melanomas had more subclonal mutations than clonal mutations (Supplementary Figure 6). These findings could not be explained by the differences in tumor purity between the genomic subtypes (Kruskal-Wallis, p = 0.23).
Figure 2: Melanoma genomic subtypes have distinct global properties and secondary driver genes.
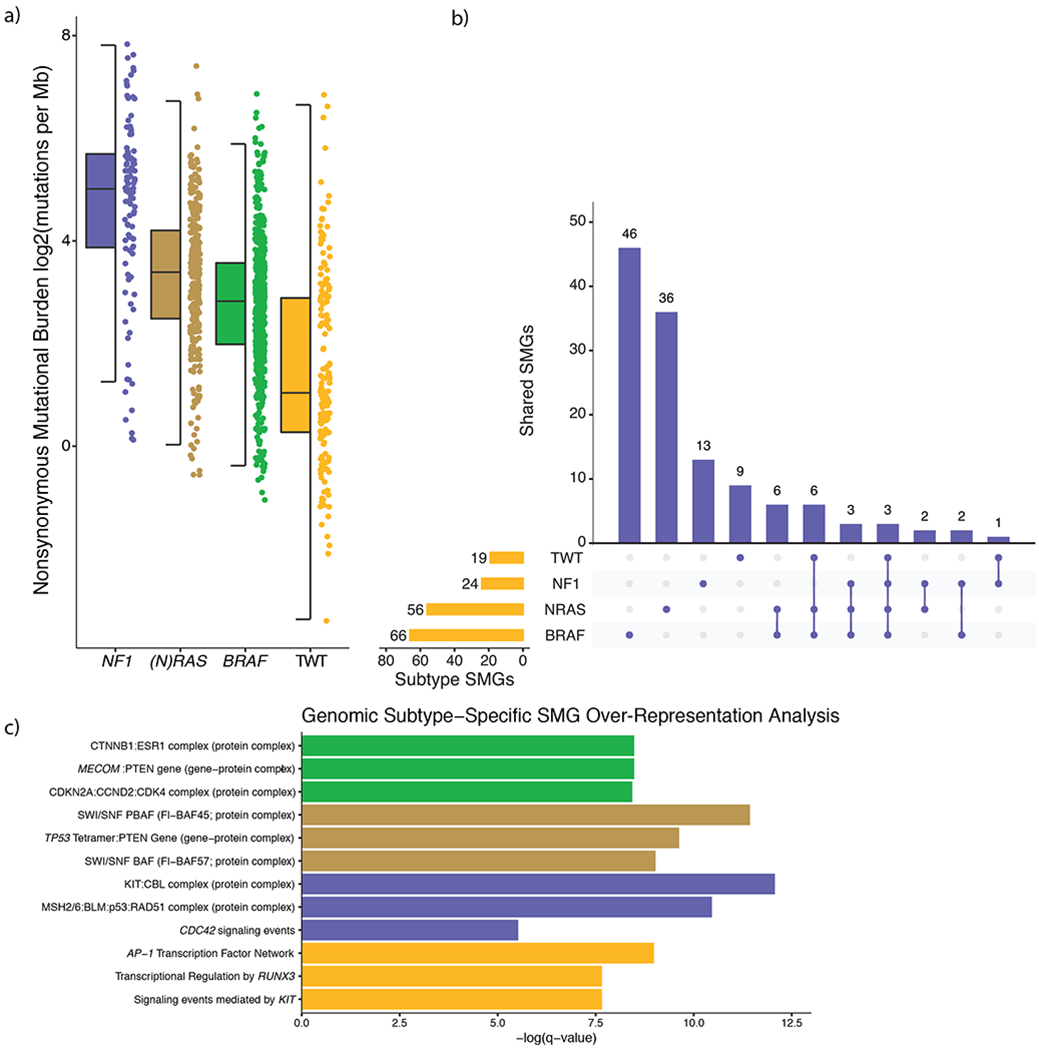
a) The nonsynonymous mutational load was significantly different between the genomic subtypes (Mann-Whitney U, p < 3.82 x 10⁻⁸ for all pairwise, two-sided). NF1 melanomas experienced the highest mutational load, whereas TWT melanomas experienced the lowest mutational load. The data are represented as a boxplot where the middle line is the median, the lower and upper edges of the box are the first and third quartiles, the whiskers represent the interquartile range (IQR) multiplied by 1.5, and beyond the whiskers are outlier points. b) We identified 66, 56, 24 and 19 significantly mutated genes (SMGs) in BRAF, (N)RAS, NF1 and TWT melanomas, respectively. Overlapping the genomic subtype SMGs, revealed that genomic subtypes seldom share the same SMGs despite BRAF, (N)RAS and NF1 all converging on the MAP kinase pathway. Specifically, 70% (46/66), 64% (36/56), 54% (13/24) and 47% (9/19) of the SMGs identified in BRAF, (N)RAS, NF1 and TWT melanomas were exclusive to their respective subtypes. In aggregate, only 18% (23/127) of the SMGs identified through the genomic subtype mutational significance analysis were found in more than one genomic subtype. c) The top 3 non-generic hits (via q-value, Benjamini-Hochberg) from pathway and protein-complex over-representation analysis of SMGs specific to each genomic subtype. This analysis revealed several recurring patterns in BRAF (e.g. cell-cycle), (N)RAS (e.g. chromatin remodeling), NF1 (e.g. DNA damage), and TWT (e.g. RUNX3 and KIT signaling) melanomas.
Due to the high mutational load of melanoma, it is unlikely that mutations in specific genes and pathways are restricted to genomic subtypes. However, we hypothesized that specific genes and pathways may be mutated more than expected or preferentially overrepresented in a subtype specific context, despite BRAF, NRAS and NF1 converging on the MAP kinase pathway. Indeed, mutational significance analysis within each of the genomic subtypes showed that candidate SMGs were seldom shared between the subtypes (Figure 2b, Extended Data 1), and putative function altering mutations in related pathways and protein complexes were significantly associated within those same genomic subtypes (Figure 2c). This suggests dysregulation of these pathways may act as co-drivers at different frequencies dependent on the genomic subtype necessitating subtype-specific significance analyses, and that subtype-specific analyses may provide further insights into additional SMGs irrespective of overall co-mutation patterns. Thus, we performed sub-type specific significance analyses to dissect the co-driver dysregulation patterns.
BRAF-mutant
A total of 66 SMGs were identified in BRAF melanomas, which included previously established co-mutations (i.e. PTEN, Figure 2b–c, Supplementary Figures 7–8). Two of the more frequent BRAF co-mutators, MECOM and BMP5 (24.7%, Figure 2c, Supplementary Figure 9), have been associated with several immune related pathways (e.g. TGF-β, IFN-α, epigenetic modification)27–30. Notably, within the subset of melanomas that received immunotherapy (n = 297), BRAF and MECOM/BMP5 co-mutated melanomas demonstrated improved clinical benefit compared to MECOM/BMP5 wild-type BRAF melanomas (Methods; 77.3% vs. 35.5%, Fisher’s exact test, p = 6.4 x 10⁻⁴, Figure 3a), even when correcting for mutational load, tumor purity, and treatment (logistic regression, p = 0.018). When restricting to MECOM/BMP5 mutated melanoma, MECOM/BMP5-mutant BRAF melanomas were significantly associated with improved clinical benefit compared to MECOM/BMP5-mutant non-BRAF melanomas (77.3% vs. 46%, Fisher’s exact test, p = 0.02, Figure 3a), further nominating MECOM and BMP5 as subtype-specific mediators of immunotherapy response in melanoma.
Figure 3: Significantly mutated genes (SMGs) exclusive to BRAF melanomas have implications for immunotherapy, and secondary drivers further segregate with V600E and V600K hotspot mutations.
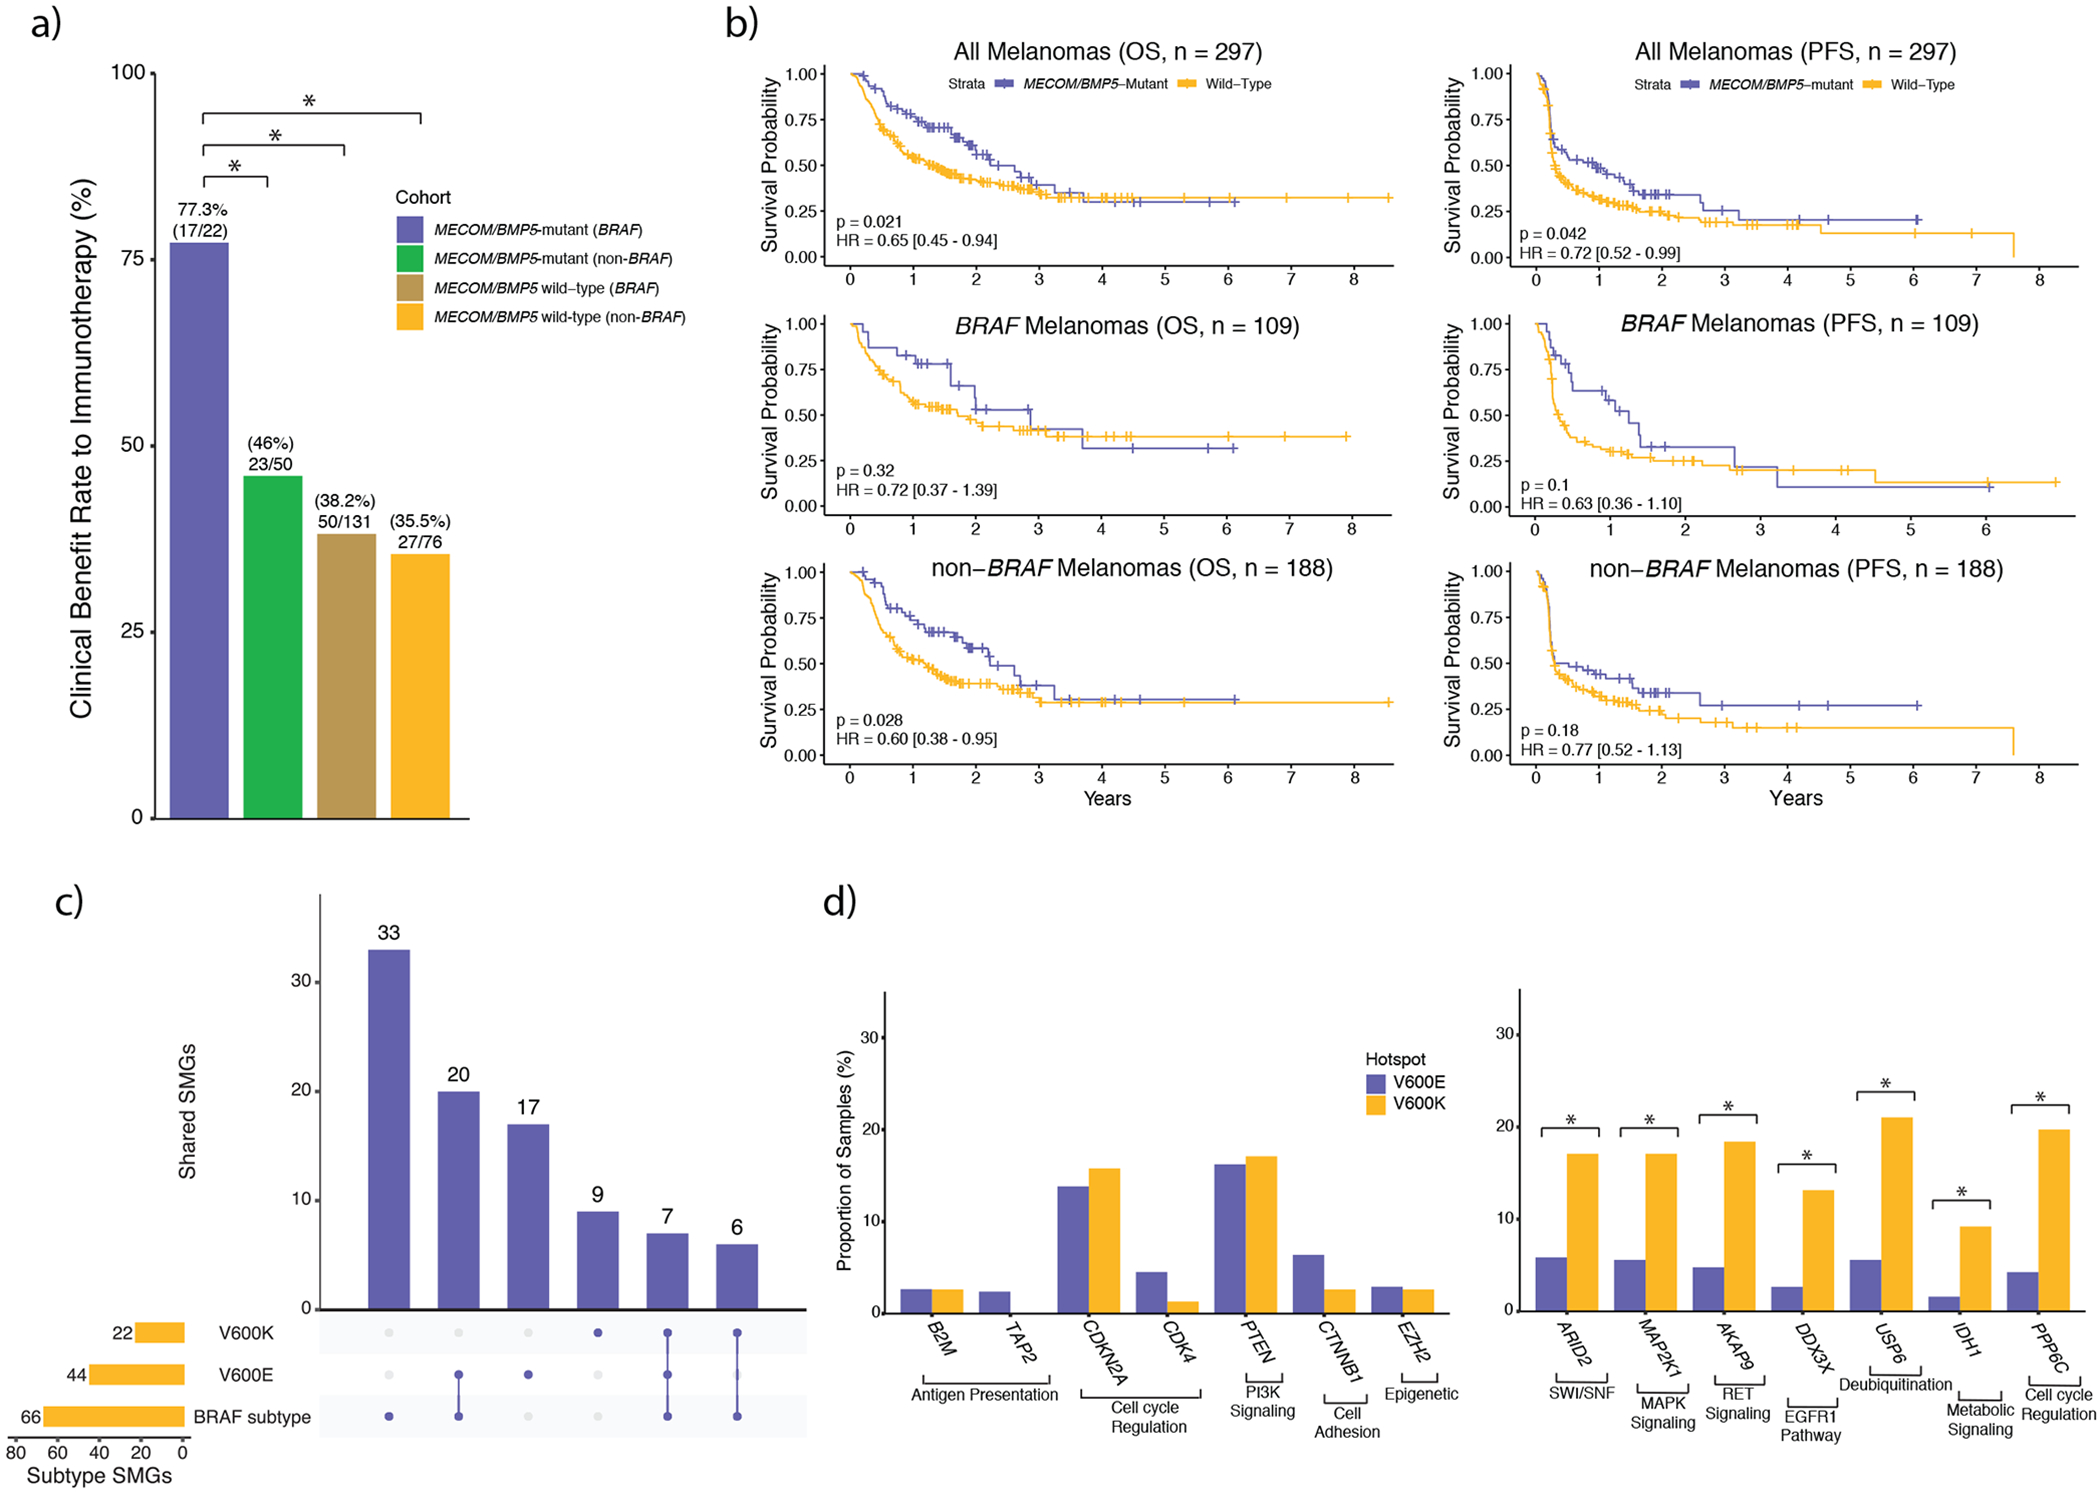
a) In BRAF melanomas, but not non-BRAF melanomas, mutations in MECOM and/or BMP5 were associated with clinical benefit to immunotherapy, as assessed by RECIST criteria. Additionally, when restricting to MECOM/BMP5-mutated melanomas, BRAF melanomas are associated with significantly better clinical benefit compared to non-BRAF melanomas (Fisher’s exact test, p = 0.02, two-sided). b) Survival curves between MECOM/BMP5-mutant and wild-type tumors in (top) all immunotherapy treated tumors (n = 297), (middle) BRAF immunotherapy treated tumors (n = 109), and (bottom) non-BRAF immunotherapy treated tumors (n = 188). c) Overlap of BRAF-mutant, BRAF V600E and BRAF V600K SMGs showed that roughly 2/3 of both the V600E and V600K SMGs were also identified through the BRAF-mutant mutational significance analysis. However, only 16% (7/44) and 32% (7/22) of the V600E and V600K SMGs overlapped with each other, respectively. d) Despite V600K tumors experiencing a two-fold enrichment of nonsynonymous mutational load, some BRAF V600E cancer gene (CGC, OncoKB) SMGs are altered in a similar or greater proportion of samples (left; p > 0.05 adjusted for mutational load between subtypes, χ2, two-sided). Conversely, some BRAFV600K cancer gene SMGs are altered in more than double the proportion of samples (right; p < 1.85 x 10⁻³ adjusted for mutational load between subtypes χ2, two-sided). In a) and d) an asterisk denotes a Mann-Whitney U p-value < 0.05. OS, overall survival; PFS, progression free survival.
When considering the entire cohort, patients with MECOM/BMP5 mutations (including BRAF melanomas) demonstrated improved clinical benefit (55.6% vs. 37.2%, Fisher’s exact test, p = 0.008), progression free survival (PFS; log-rank, p = 0.042, Figure 3b, Supplementary Table 6), and overall survival (OS; log-rank, p = 0.021). Similarly, clinical benefit remained significantly associated with MECOM/BMP5 mutations after correcting for mutational load, tumor purity, and treatment (logistic regression, p = 0.034). Although the results were concordant in this cohort and a limited external validation cohort (Extended Data 2), MECOM/BMP5 mutations were not statistically associated with improved PFS and OS after correcting for these same covariates (PFS: p = 0.053; OS: p = 0.058; Supplementary Table 6).
V600E and V600K mutant melanomas
We then examined BRAF V600E (NC_000007.13:g.140453136A>T) and V600K (NC_000007.13:g.140453136_140453137delinsTT) tumors given their diverse clinical and genomic features 31–33. BRAF V600E (n = 376) and V600K (n = 76) hotspot mutations comprised 92% of the BRAF melanomas in our cohort. Consistent with prior reports, we observed significant differences in median age of diagnosis, mutational load, and copy number burden (Supplementary Figures 10–12). Given these global differences, we aimed to determine if secondary drivers were unique to the BRAF V600E or V600K subtypes (Figure 3c, Methods). In the V600K and V600E cohorts, 13 (59%) and 19 (61.4%) SMGs were also identified as BRAF subtype SMGs. ARID2, CDKN2A, MAP2K1, PPP6C, PTEN, RAC1, and TP53 were identified as SMGs in the V600E, V600K and overall BRAF subtype cohorts. Despite the elevated mutational load in V600K tumors, CDKN2A, PTEN and TP53 were mutated in a similar proportion of V600E tumors (χ2, p > 0.05 adjusted for mutational load between subtypes), among others (Figure 3d). However, established cancer genes AKAP9, COL3A1, DDX3X, FAM131B, IDH1, and USP6 were identified as SMGs unique to V600K melanomas. Conversely, canonical cancer genes that were SMGs exclusive to the V600E cohort included B2M, CDK4, CTNNB1, EZH2, JAK1, PRKAR1A, TAP2, and TRRAP, several of which are involved in immune response (Supplementary Table 7). Thus, BRAF-mutant melanomas have distinct genomic substructures overall, and within specific mutant alleles.
(N)RAS-mutant subtype
We identified 56 SMGs in (N)RAS melanomas, excluding NRAS, KRAS and HRAS (Supplementary Figures 13–14). The chromatin remodeler SWI/SNF complex genes ARID1A, ARID1B, ARID2 and BRD7 were all classified as SMGs in (N)RAS melanomas (31% of (N)RAS-mutant melanomas and 22.5% in non-(N)RAS-mutant melanomas; Fisher’s exact test, p = 8.64 x 10⁻⁶, Figure 4a, Supplementary Figure 15). Both ARID2 and BRD7 are unique to the SWI/SNF PBAF complex, and mutations in these genes were mutually exclusive in (N)RAS melanomas (Figure 4a)34. (N)RAS melanomas were significantly associated with putative inactivating mutations in PBAF complex genes in the multivariate analysis correcting for mutation rate and tumor purity (logistic regression, p = 0.049 for all PBAF genes, p = 0.036 for unique PBAF genes, Supplementary Table 8), but not BAF complex genes (p = 0.1 for all BAF genes, p = 0.338 for unique BAF genes). Further, nonsynonymous BAF/PBAF complex mutations were disproportionately clonal (Methods) in (N)RAS melanomas relative to other genomic subtypes (χ2, p < 4.08 x 10⁻⁵ pairwise adjusted for background subtype proportions, Figure 4b), indicating that BAF/PBAF mutations may be tumor initiating events particularly when paired with activating (N)RAS mutations (Supplementary Table 9).
Figure 4: (N)RAS melanomas frequently experience clonal mutations in the PBAF complex, and PBAF complex mutations are associated with improved overall survival (OS) and progression free survival (PFS) when treated with immunotherapy.
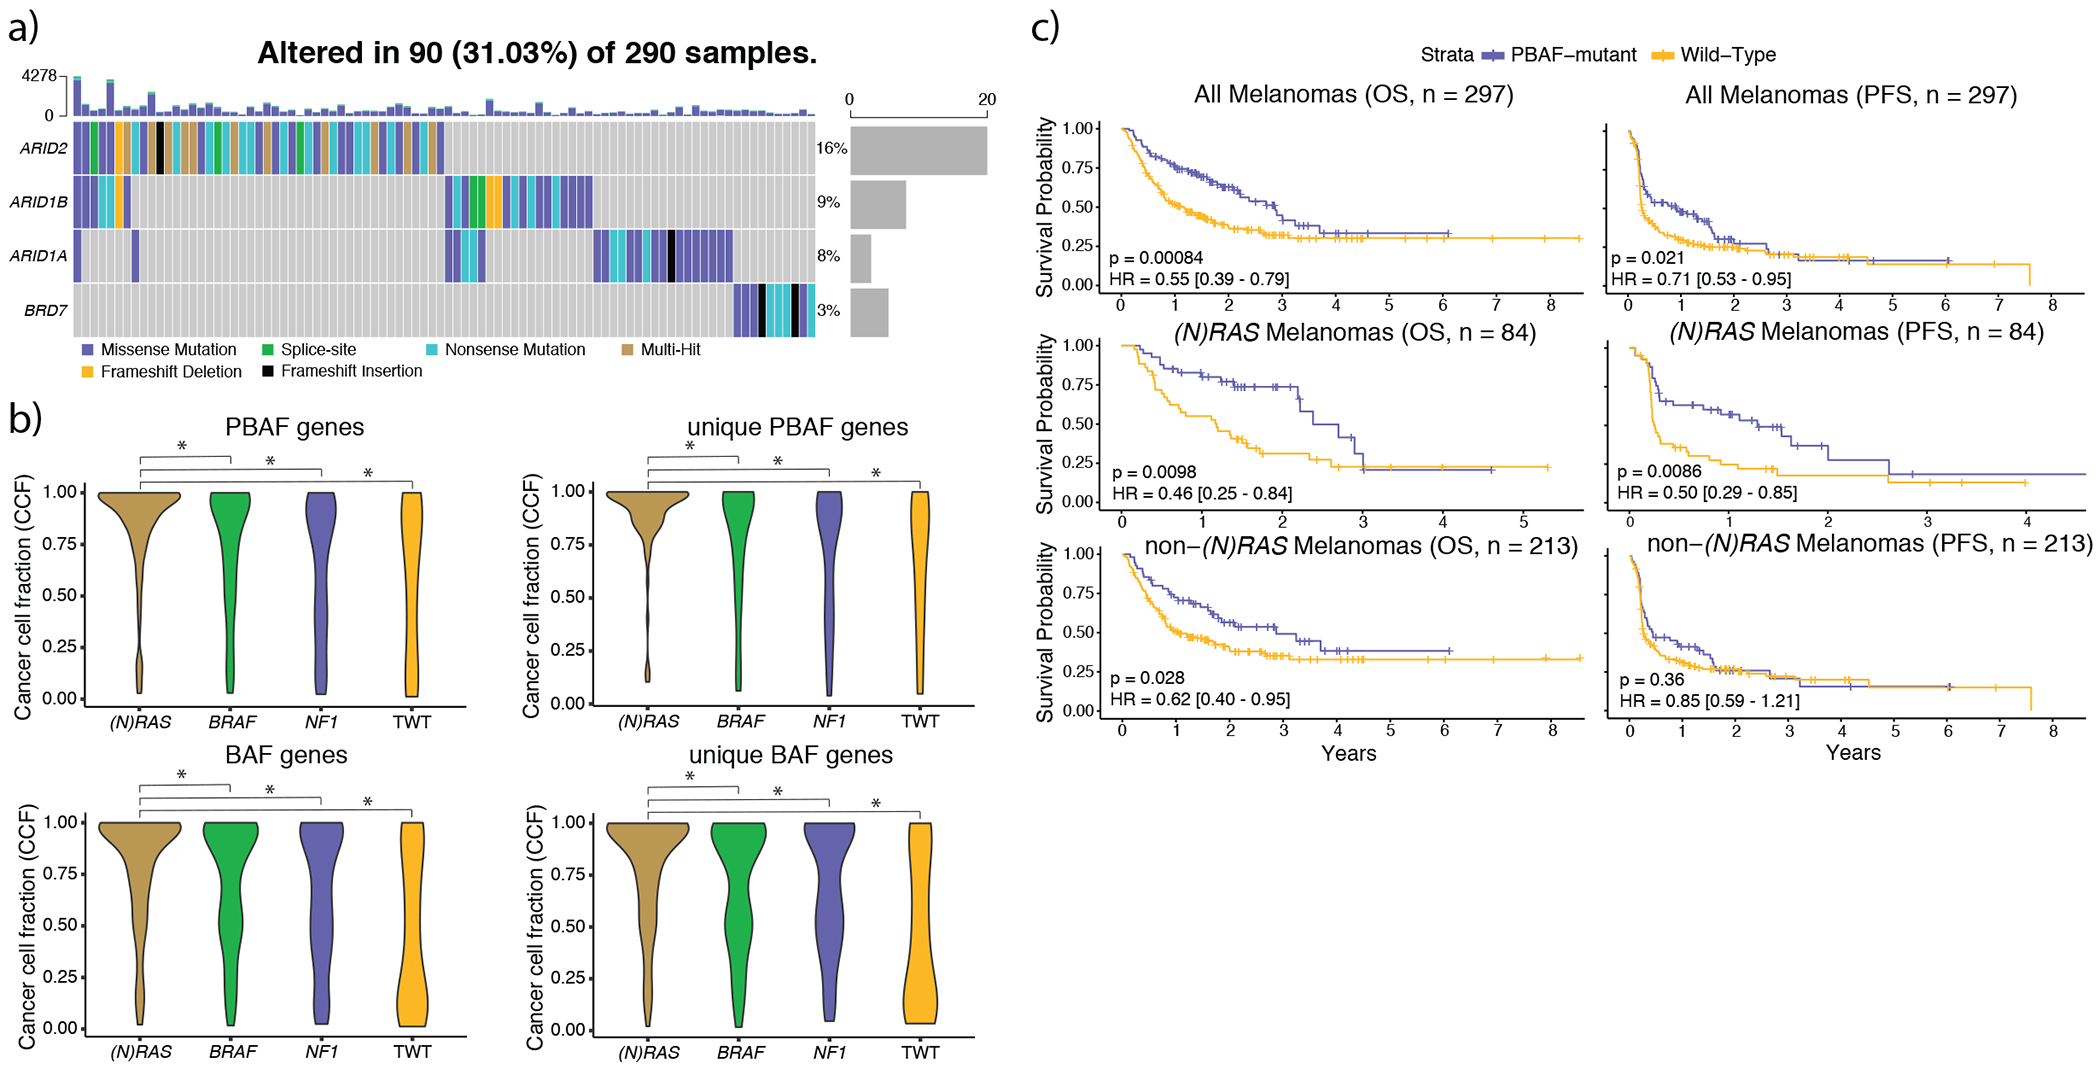
a) The co-mutation plot of BAF/PBAF complex SMGs identified in (N)RAS melanomas. Putative loss-of-function mutations (nonsense, splice-site, indels) are almost entirely mutually exclusive with one another. Further, mutations in ARID2 and BRD7 (specific to the PBAF version of the SWI/SNF complex) were never observed in the same tumor. b) The distributions of cancer cell fractions (Methods) for all PBAF and BAF complex genes among the genomic subtypes. Mutations in BAF/PBAF complex genes were enriched for being clonal (Methods) in (N)RAS melanomas compared to other genomic subtypes (χ2 pairwise adjusted for subtype proportions, p < 2.24 x 10⁻⁴, two-sided), and PBAF gene mutations were clonal more frequently than BAF gene mutations in (N)RAS melanomas (p = 0.003, Kolmogorov-Smirnov, two-sided). An asterisk denotes a Kolmogorov-Smirnov p-value < 0.05. c) Mutations in PBAF genes are associated with significantly improved OS and PFS to immunotherapy. Although PBAF-mutant (N)RAS and non-(N)RAS melanomas have significantly better OS compared to their PBAF wild-type counterparts, the improvement in OS is much more pronounced in (N)RAS melanomas. PBAF-mutant non-(N)RAS melanomas do not experience significantly better PFS compared to PBAF wild-type non-(N)RAS melanomas. However, PBAF-mutant (N)RAS melanomas have significantly improved PFS compared to PBAF wild-type (N)RAS melanomas, and the PFS signal from PBAF-mutant (N)RAS melanomas are driving the significant improvement in PFS at the entire cohort level.
Inactivation of the PBAF complex has been associated with improved response to immunotherapy in renal cell carcinoma patients35, and increased T cell cytotoxicity in melanoma models (Supplementary Table 10)24. Within the subset of our cohort that received immunotherapy, (N)RAS melanomas co-mutated with PBAF complex mutations were significantly associated with improved PFS (log-rank, p = 8.6 x 10⁻³, Figure 4c, Supplementary Table 6) and OS (log-rank, p = 9.8 x 10⁻³, Figure 4c), as well as concordant (but not statistically significant) associations with clinical benefit (56.4% vs. 35.7%, Fisher’s exact test, p = 0.076) and OS in a limited external validation cohort (Extended Data 3). Non-(N)RAS melanomas co-mutated with PBAF complex mutations were also associated to a lesser degree with improved OS (p = 0.028, Figure 4c), but not PFS. PBAF complex mutations in the overall cohort were still significantly associated with improved PFS and OS after correcting for mutational load, tumor purity, and treatment (logistic-regression, PFS: p = 0.027; OS: p = 0.007; Supplementary Table 6), though this was largely driven by co-mutation with (N)RAS melanomas (Supplementary Table 6).
NF1-mutant subtype
Consistent with prior studies, we observed that NF1 melanomas occurred in older patients (Supplementary Figure 16a) and harbored higher mutational load than the other genomic subtypes10–11. Through our approach, we identified 24 SMGs in NF1 melanomas (FDR q < 0.01, Supplementary Figures 16–18). Of the RASopathy genes previously implicated in NF1 melanomas 10,36, RASA2 and SPRED1 were the only ones classified as SMGs. However, NF1 melanomas were significantly associated with putative inactivating mutations in known RASopathy genes (logistic regression corrected for mutation rate and purity, p = 1.25 x 10⁻⁴, Supplementary Table 8). One additional RAS-associated gene not previously implicated in melanoma, RASSF2, was also identified as a SMG specifically in the NF1-mutant subtype11. RASSF2 is a tumor suppressor that regulates the MAP kinase pathway through interactions with KRAS, and hypermethylation of its promoter has been observed in several cancer types37–39.
Triple Wild-Type (TWT) Subtype
Unlike the other subtypes, genomic driver analyses in TWT melanomas have been limited due to insufficient cohort size for unbiased driver discovery. Here, we identified 19 SMGs (FDR q < 0.01, Figure 5a, Supplementary Figures 19–21). Consistent with prior reports, KIT was the most frequently mutated SMG2,17,40. Three additional SMGs, GNA11, GNAQ, and SF3B1, are known driver genes in uveal melanoma (not included in this study)41 and predominantly consisted of established hotspot mutations. Though SF3B1 has been identified as a driver in mucosal melanomas42, SF3B1, GNA11, and GNAQ were identified as SMGs when considering only cutaneous TWT melanomas (Supplementary Figure 19, Supplementary Data 2). Through this analysis we identified putative driver events in 91 of 162 (56.17%) tumors, leaving many tumors without a SMG. This large fraction of tumors without known driver mutations may be partially due to the low background mutation rate in this subtype limiting the power to identify more drivers19–21.
Figure 5: Identification of novel drivers and enrichment of mutational signature 3 in triple wild type (TWT) melanomas.
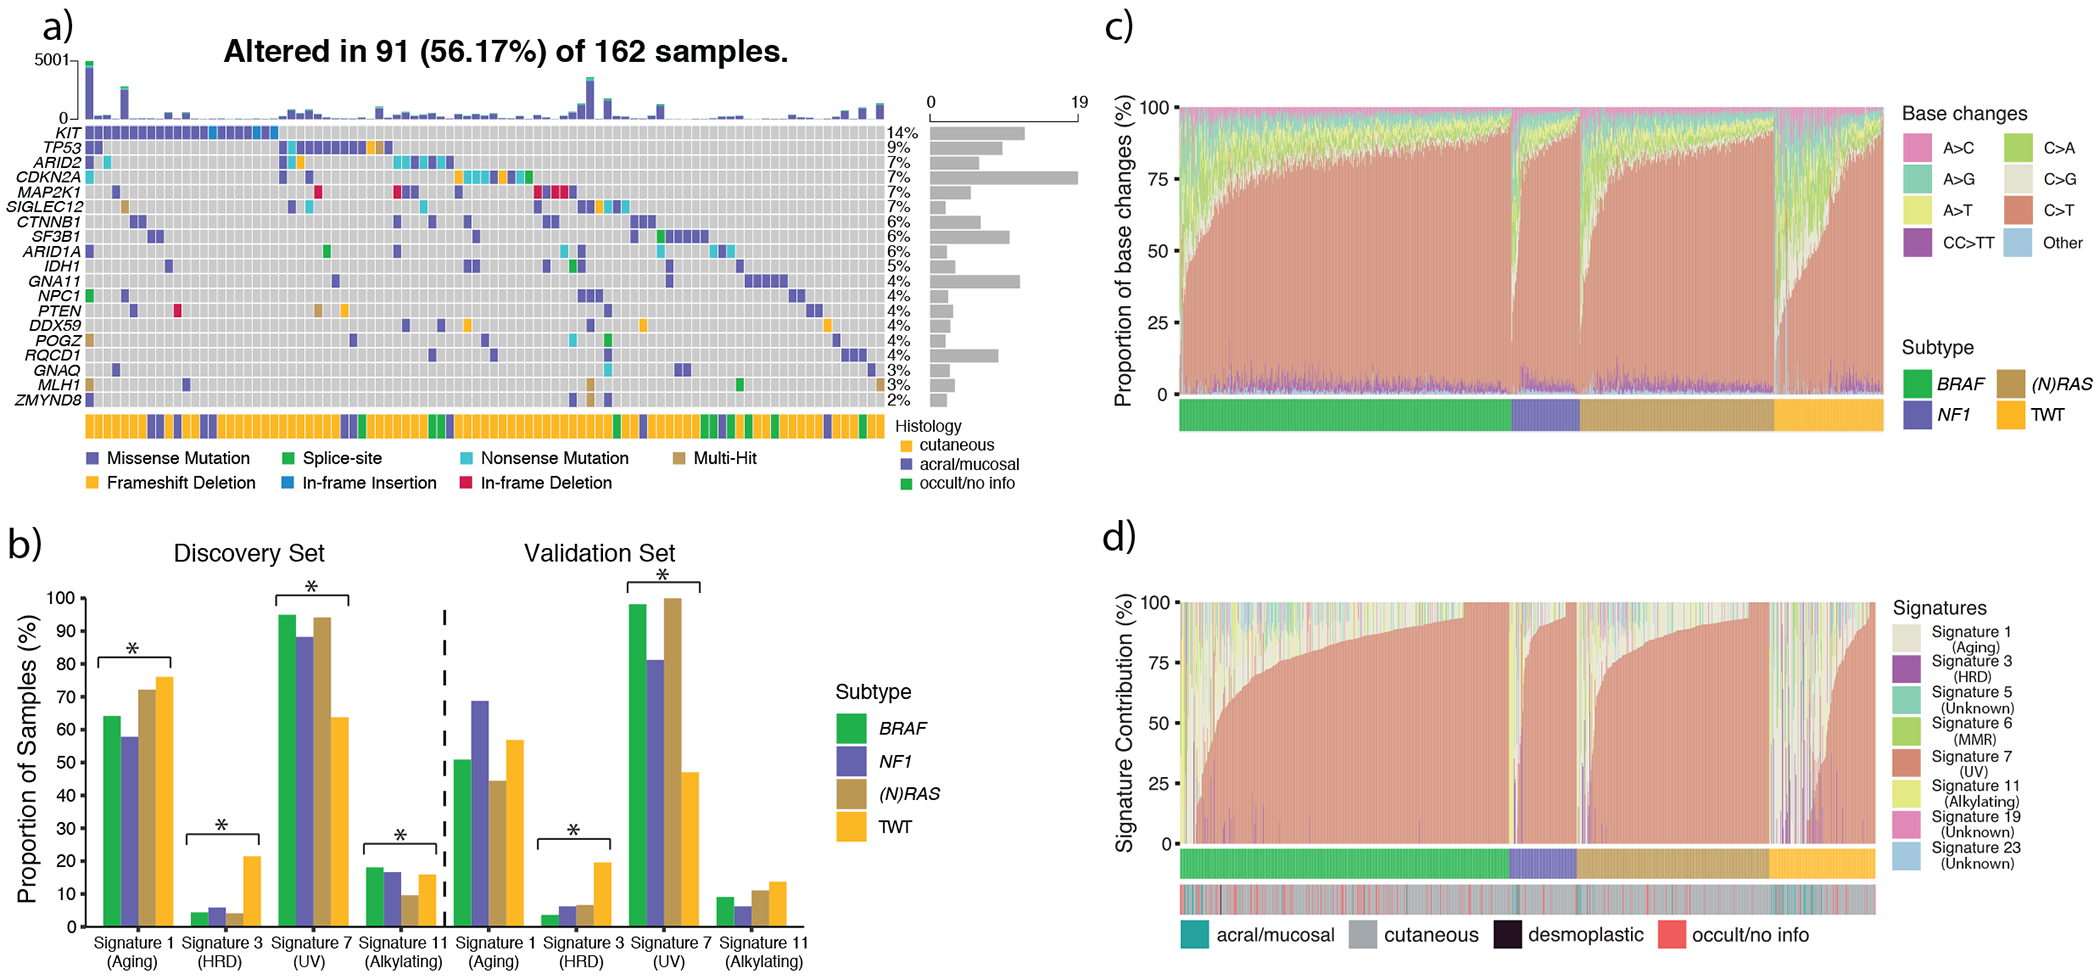
a) The co-mutation plot of TWT significantly mutated genes (SMGs), including the annotation of tumor histology. These SMGs include canonical melanoma cancer genes (e.g. CTNNB1, CDKN2A, TP53) and known uveal melanoma driver genes (e.g. GNA11, GNAQ, and SF3B1). However, these 19 SMGs only explain the presence of drivers in just over 50% of TWT melanomas. b) The proportion of samples in each genomic subtype exhibiting mutational signatures (Methods) in our discovery and validation (n = 159) cohorts. Signature 3 was present in 21.5% of TWT melanomas compared to 4.5% of non-TWT melanomas (p = 2.20 x 10⁻¹¹, Fisher’s exact test, two-sided), and was the third most active mutational signature in TWT melanomas. In our validation cohort (Methods), signature 3 was identified in 19.6% of TWT melanomas and 5.6% of non-TWT melanomas (p = 0.001, Fisher’s exact test, two-sided), and was again the third most active signature in TWT melanomas. In both the discovery and validation cohorts, the proportion of tumors with signatures 3 and 7 were significantly different across the genomic subtypes (p < 0.05, χ2, two-sided). An asterisk denotes a χ2 p-value < 0.05. c) The proportion of base changes ordered by genomic subtype and the proportion of C>T transitions (increasing, left-to-right). d) The relative contribution of each mutational signature ordered by genomic subtype and the relative signature 7 contribution (increasing, left-to-right).
Similarly, while we observed that TWT melanomas exclusively experienced enrichment of focal amplifications of the KIT/KDR locus, this subset only represented 18% (29/162) of TWT melanomas (Supplementary Figure 22–23, Supplementary Table 11, Supplementary Data 3, Methods)43. Half the tumors with KIT mutations also had an amplification of KIT, including all three tumors with in-frame insertions in KIT (Figure 5a). SMGs from other genomic subtypes also jointly experienced an enrichment of amplifications or deletions, such as CDK4 mutations and amplifications in BRAF melanomas (Supplementary Table 11, Supplementary Data 3). Global analysis of structural variants (SVs) showed that TWT melanomas were enriched in both copy number alterations (CNAs) (Kruskal-Wallis, p = 9.28 x 10⁻⁷, Supplementary Figure 24a)44 and fusion events (Kruskal-Wallis, p = 0.006, Supplementary Figure 24b)45 compared to other subtypes. BRAF was the most common fusion partner in TWT melanomas (n = 3 samples; Supplementary Table 7), although there were no recurrent fusion pairs. In aggregate, TWT melanomas demonstrate increased genomic instability relative to the other genomic subtypes, although specific driver events were not highly recurrent in gene-level somatic analysis.
Mutational signatures and DNA repair defects in melanoma
To augment SMG analysis and identify additional TWT melanoma drivers, we next characterized the active mutational processes in this cohort (Methods)46–47. Consistent with prior studies, the three most active signatures were signature 1 (aging), signature 7 (UV) and signature 11 (alkylating agents)48–49. As expected, performing mutational signature analysis within the BRAF, (N)RAS and NF1 subtypes independently showed these same 3 signatures (Figure 5b–c). However, in TWT melanomas, signature 11 was replaced by signature 3, previously associated with homologous recombination (HR) deficiency when observed with BRCA1/2 mutations in other tumor types, as the third most active signature (Figure 5b, Supplementary Data 4). Signature 3 was identified in 35 of 162 (21.6%, Methods) TWT tumors and 40 of 886 (4.5%) non-TWT tumors (Fisher’s exact test, p = 5.7 x 10⁻¹²). Additionally, the average relative contribution of signature 3, when present, was significantly higher in TWT tumors than non-TWT tumors (24.6% vs. 16.7%, t-test, p = 0.015).
Given the flat and ambiguous nature of signature 349, we next examined potential confounders to this observation in TWT melanomas. The difference in signature 3 prevalence between TWT and non-TWT tumors was not confounded by histopathological subtype (Fisher’s exact test, cutaneous: 19.7% vs. 4.5%, p = 8.72 x 10⁻⁸; acral/mucosal: 45.8% vs. 11.1%, p = 0.011), age (logistic regression, 1.72 x 10⁻¹⁰), or mutational load (logistic regression, p = 2.6 x 10⁻³). We also replicated our findings using an orthogonal NMF-based method, including enrichment of signature 3 in TWT melanomas (Supplementary Figure 25, Extended Data 4)47. We further confirmed this finding with NMF through downsampling analysis; removing 35 signature 3 tumors vs. 35 non-signature 3 tumors resulted in signature 3 being called in 0% and 92.7% of 1,000 simulations, respectively (Extended Data 5).
To further evaluate this TWT DNA repair signature finding, we examined its association with copy number loss of heterozygosity (LoH) events50–51, telomeric allelic imbalance (TAI)52, and large-scale transitions (LST)53, which were previously associated with double strand break (DSB) repair and HR deficiency in breast and ovarian cancer54. Tumors with signature 3 had significantly greater numbers of LoH regions (Kolmogorov-Smirnov, p = 0.005; univariate logistic regression, p = 5.34 x 10⁻⁵, Supplementary Figure 26, Methods), TAI (Mann-Whitney U, p = 4.4 x 10⁻⁵, Supplementary Figure 27, Methods), and LST (Mann-Whitney U, p = 0.007, Supplementary Figure 28, Methods) compared to non-signature 3 tumors (Figure 6a). Further, the unweighted sum of these HR deficiency associated CNA events was significantly enriched in tumors with signature 3 (Mann-Whitney U, p = 6.21 x 10⁻⁵, Extended Data 6, Methods)54. To confirm that the association between signature 3 and these DNA repair signatures were not spurious, we performed these same tests for all signatures, but no other signature was significantly associated with all of these associated events (Supplementary Figure 29).
Figure 6: Identification of novel drivers and enrichment of mutational signature 3 in triple wild type (TWT) melanomas.
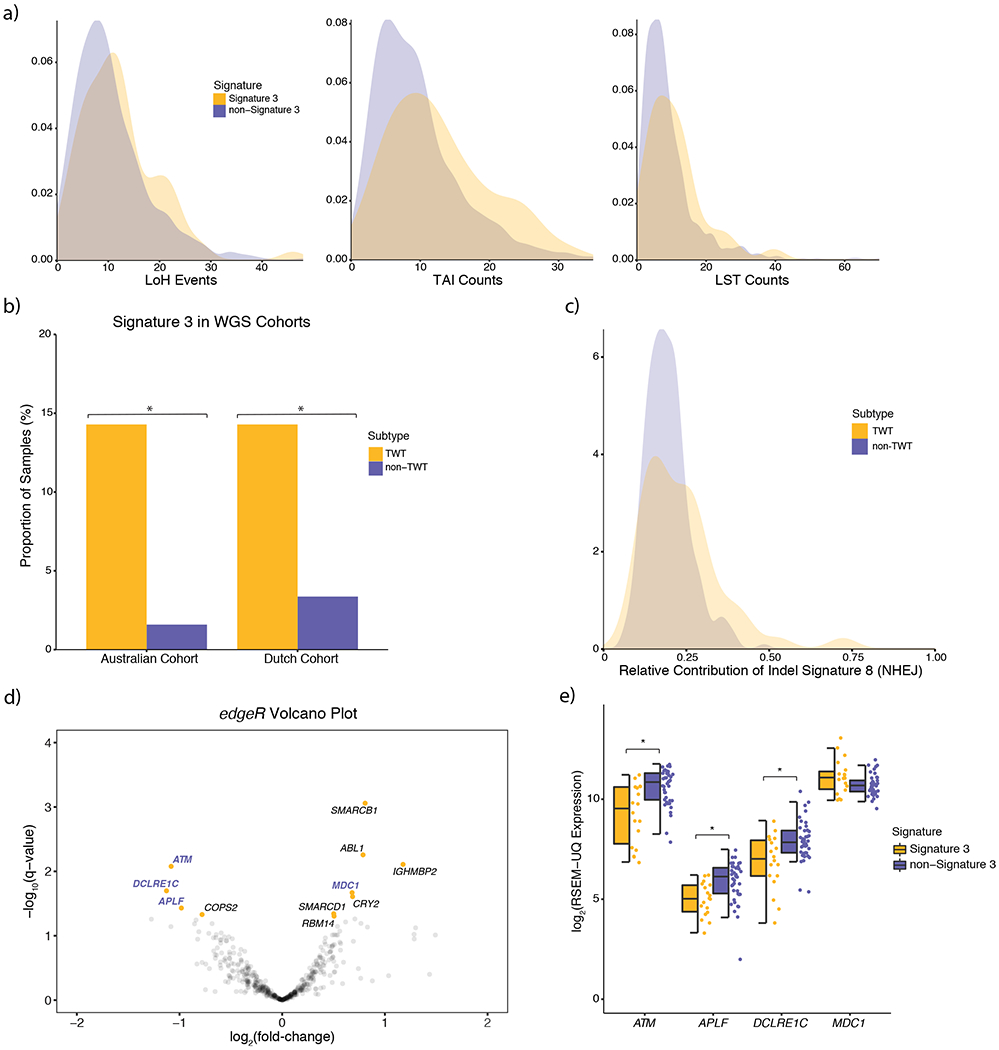
a) Signature 3 tumors had significantly elevated numbers of LoH (p = 0.005, Kolmogorov-Smirnov, two-sided; p = 5.34 x 10⁻⁵, univariate logistic regression, two-sided), TAI (p = 4.4 x 10⁻⁵, Mann-Whitney U, two-sided), and LST (p = 0.007, Mann-Whitney U, two-sided) events. b) Signature 3 was also enriched in TWT tumors of two independent melanoma WGS cohorts, suggesting that the assignment of signature 3 was not ambiguous or the result of noise from lower mutational load in WES data. Asterisks denotes a Mann-Whitney U p-value < 0.05. c) Although indel signature ID8 was found in the majority of melanoma WGS samples, the relative contribution of indel signature ID8 was significantly higher in TWT tumors (p = 3.3 x 10⁻³, Kolmogorov-Smirnov, two-sided). d) Significance vs. effect size (fold-change) of significantly differentially expressed (Benjamini-Hochberg, q-value cutoff < 0.05; signature 3 vs. non-signature 3) DNA repair genes via edgeR. Gene names highlighted in purple function in DSB repair pathways including HR. e) The distribution of expression between putatively DSB repair deficient and non-DSB repair deficient TWT tumors for DSB repair genes that were significantly differentially expressed (Mann-Whitney U; ordered by two-sided p-value, increasing, left-to-right, asterisks denote p < 7.6 x 10⁻³). The data is represented as a boxplot where the middle line is the median, the lower and upper edges of the box are the first and third quartiles, the whiskers represent the interquartile range (IQR) multiplied by 1.5, and beyond the whiskers are outlier points.
To externally evaluate these mutational signature patterns, we next performed signature analysis in a separate set of melanoma WES tumors that were not included in our original cohort (Methods). Consistent with our findings, signature 3 was observed in 19.6% of TWT tumors and 5.6% of non-TWT tumors (Mann-Whitney U, p = 9.79 x 10⁻³, Figure 5b). To further evaluate whether signature 3 was assigned as a result of ambiguity with lower total called mutations, we analyzed melanoma whole-genome sequenced (WGS) cohorts (n = 390, Hayward et al.17 and Priestley et al55; Methods). In the Hayward et al. cohort, signature 3 was identified in 2 of 14 (14.8%) cutaneous TWT melanomas and 2 of 126 (1.6%) cutaneous non-TWT melanomas (Fisher’s exact test, p = 0.0498, Figure 6b, Supplementary Data 4). In the Priestley et al. cohort, signature 3 was identified in 6 of 42 (14.3%) TWT melanomas compared to 7 of 208 (3.8%) non-TWT melanomas (Fisher’s exact test, p = 0.011, Figure 6b, Supplementary Data 4). Signature 3 was still enriched in TWT melanomas when combining the two WGS cohorts (Fisher’s exact test, p = 9.6 x 10⁻⁴).
Finally, NMF-based indel mutational signature analysis in all 390 WGS tumors showed that signature 3 was the sole mutational signature associated with indel signature 8 (ID8; Methods), whose proposed etiology is the non-homologous end joining activity component of DSB repair. BRAF, (N)RAS, and NF1 melanomas were associated with indel mutational signatures ID1, ID2, and ID13 (associated with UV), while TWT melanomas were associated with indel mutational signatures ID1, ID8, and ID13, even when removing the tumors with signature 3 (Extended Data 7). Although ID8 has been identified in the majority of melanoma tumors56, as was also the case in the WGS validation cohorts, ID8 was more pronounced in TWT tumors. Single-sample level decomposition (Methods) showed that although there was no difference in the proportion TWT tumors with ID8 compared to non-TWT tumors (Fisher’s exact test, p > 0.05), when present, indel signature ID8 contribution was significantly higher in TWT tumors (Kolmogorov-Smirnov, p = 3.3 x 10⁻³, Figure 6c, Supplementary Data 4). This may explain why ID8 was only identified in the NMF-based indel signatures for the TWT cohort. Thus, the increased genomic instability of TWT melanomas in general, as evidenced by elevated SV burden, may also manifest in elevated contribution of indel signature ID8 representing double strand DNA repair dysfunction.
Double-strand break repair deficiency in TWT Melanomas
To examine potential sources for this DNA repair dysfunction in TWT melanoma, we surveyed whether alterations in genes previously implicated in DSB repair (N=190, Supplementary Table 8, Methods) were enriched in the putative DSB repair defective melanomas, with emphasis on the TWT subtype. While rare deleterious somatic mutations (e.g. ATM, BRCA2), CNAs (e.g. CHEK1 and RNF8 deletions), or germline pathogenic mutations (e.g. WRN, XRCC2) were observed in DNA repair genes, there was no association with these events and signature 3 (Fisher’s exact test, q > 0.05, Supplementary Figure 30, Supplementary Table 12).
Given the lack of genomic features previously correlated with signature 3 in this setting, we then examined whether transcriptional states in DNA repair processes (N=496 genes, Supplementary Table 8, Methods), including HR and other DSB repair pathways, could inform the relationship between signature 3 contribution and TWT melanoma (Extended Data 8a). Signature 3 contribution was significantly correlated with 19 DNA repair genes (Pearson’s, p-value cutoff < 0.05; 9 positive, 10 negative), of which 9 function in DSB repair pathways (Extended Data 8b), suggesting a potential dosage relationship between the degree of signature 3 activity and the expression of these genes. However, none of these genes passed FDR correction when including the full set of genes. To determine if the effect size of expression differences in these genes were also significantly associated with the presence of signature 3, we performed differential expression analysis57–59. A total of 14 DNA repair genes were significantly differentially expressed by two methods (Benjamini-Hochberg, q-value cutoff < 0.05, Figure 6d, Extended Data 9, Supplementary Data 5, Methods), four of which are involved in DSB repair (ATM, APLF, DCLRE1C, MDC1, Figure 6e).
Promoter methylation of RAD51C has also been shown to cause HR deficiency in breast cancer60, although no DNA repair genes were in regions differentially methylated61–62 between signature 3 and non-signature 3 melanomas (Methods). Analysis of signature 3 contribution correlations with methylation β-values for DNA repair genes (Pearson’s, p-value cutoff < 0.05) and anti-correlations with expression identified 6 positions across 6 genes (Extended Data 10). INO80, which functions in the initial stages of HR63–64, was the only DSB repair associated gene implicated in this analysis and had significantly higher methylation in signature 3 tumors (Mann-Whitney U, p < 0.015, Extended Data 10a, Supplementary Table 13). Thus, non-genetic events of the DSB repair genes ATM, APLF and INO80, all of which function early in DSB repair65–66, were significantly associated with signature 3 contributions in melanoma.
DISCUSSION
Through harmonized and uniform genomic analyses on expanded melanoma WES, we identified a complex secondary genomic architecture of melanoma that includes multiple oncogenic drivers not previously implicated in this disease. Mutational significance analysis within the genomic subtypes identified novel, secondary drivers that are rarely shared between the subtypes. Further, several pathways and mechanisms potentially driving tumors in each of the subtypes have remained unappreciated. Over 35% of BRAF melanomas had mutations in the TGF-β pathway genes (BMP5, MECOM), and roughly 30% of (N)RAS melanomas had mutations in SMGs that are core components of the BAF/PBAF complex (ARID1A, ARID1B, ARID2, BRD7). Further, nonsynonymous mutations in BAF/PBAF genes were enriched for being clonal in (N)RAS melanomas compared to the other genomic subtypes, indicating that aberrant chromatin remodeling and histone modifications may differentially drive tumor progression in a subset of (N)RAS melanomas. Each of these observations were linked to associations with selective immune checkpoint blockade response that warrant biological evaluation. Critically, we do not claim prognostic or predictive biomarkers status for these findings, which require randomized prospective analyses.
Prior to this study, TWT melanomas lacked known SMGs, although several studies had proposed KIT may be driving a subset of these tumors. Here we’ve identified 19 SMGs, including KIT, in TWT melanomas, and fully characterized their distinct mutational landscape. TWT melanomas have significantly lower mutational load but increased genomic instability (SVs and CNVs). Perhaps most surprisingly, between 14-20% of TWT melanomas display mutational signature 3, which has ambiguous etiology, but in certain histologies has been associated with HR deficiency when co-occurring with BRCA1/2 mutations.
No single etiology of signature 3 was identified, however transcriptional data suggested a role for downregulation of ATM and NHEJ dysregulation. ATM functions in both the initial stages of HR and NHEJ repair67–68, where it is recruited to DSBs by the MRN complex and subsequently activated, resulting in the phosphorylation of several key HR proteins (e.g. BRCA1, H2AX and MDC1)69–71, as well as later stages of HR repair after RAD51 filament formation65. Further, since APLF is directly phosphorylated by ATM, and accumulates at H2AX foci66,72–73, this suggests the observed ATM down-regulation occurs during the early stages of DSB response. Prior studies in ATM deficient cell lines have shown that when BRCA1/2 remain intact, the HR repair pathway is not entirely deficient but rather repairs DSBs at a slower rate, which in turn promotes a more active NHEJ pathway that results in higher rates of DSBs68. This may be similar to the mechanism by which we observe signature 3 in TWT melanoma, and explain why there is an absence of some canonical features associated signature 3 (e.g. BRCA1/2 alterations)71, as well as why NHEJ indel signature ID8 is detected but not ID656. Future studies to evaluate the functional consequences of these candidates in melanoma cells, and clinical studies incorporating long read sequencing, may further inform the genetic etiologies underlying these events.
While clinical trials of melanoma patients treated with platinum-based chemotherapy were negative, a subset of patients approximating the frequency of signature 3 positive melanomas in this cohort had definitive clinical responses74–75. Prospective assessment of genomically stratified melanomas that consider mutational signatures may enable recovery of a rarely utilized therapeutic modality (platinum-based chemotherapy) and others not widely considered (e.g. ATR inhibitors68,76) for melanoma. Moreover, prospective generation of new melanoma models that captures the genomic and phenotypic diversity of the disease (e.g. pre-clinical TWT models with signature 3) will aid identification of novel therapies. Broadly, deep and harmonized exome and genome-wide molecular analysis of increasingly large and histologically uniform tumor types will continue to reveal new biology with immediate translational potential, especially as clinical sequencing programs can directly connect these genomic observations with robust phenotypic measures.
ONLINE METHODS
DNA-seq dataset description
We downloaded publicly available aligned whole-exome sequencing BAM files from 10 previously published studies1–2,6–7,13–18. Prior to filtering out samples that failed joint quality control metrics, this sample set consisted of 1,307 tumor with matched normal pairs. Information on pair counts per cohort and dpGaP/ICGC accession numbers are included in Supplementary Table 1.
The expression data used in this study are from the TCGA-SKCM cohort, which is publically available from the TCGA-SKCM workspace on FireCloud (TCGA_SKCM_ControlledAccess_V1-0_DATA). The normalized RNA expression data (RSEM-Upper quartile normalized) were used for all expression analysis, except differential expression analysis. The differential expression analysis R packages, edgeR and DESeq257–59 both require raw RNA counts since they apply their own normalization methods to the data.
The methylation data used in this study were also downloaded from the TCGA-SKCM workspace on FireCloud. The calculated beta values were used for all methylation analysis.
Genomic data processing
Aligned whole-exome sequencing BAM files were obtained for all samples in the studies mentioned (see Dataset description). BAM files aligned to GRCh37 were realigned to Hg19 using the Picard realignment pipeline. The pipeline, its specifications and parameters used during realignment are provided in the Supplementary Note.
Removal of duplicate samples
To remove duplicate samples from the same patient we calculated the pairwise relationship between all matched normal BAM files in our cohort using Somalier (https://github.com/brentp/somalier). The relatedness between all of the samples used in the analyses of this study can be seen in Supplementary Figure 31.
Joint quality control metrics
To pass quality control, we required samples to pass four separate criteria. GATK3.7 (https://hub.docker.com/r/broadinstitute/gatk3/tags) DepthOfCoverage was used to determine the mean target coverage for tumor and normal samples77. To pass this metric we required a mean target coverage of at least 50X in the tumor sample and at least 20X in the corresponding normal sample. ContEst (https://software.broadinstitute.org/cancer/cga/contest_download) was used to determine the extent of cross sample contamination78. All samples that had cross sample contamination less than 5% were considered. FACETS (https://github.com/mskcc/facets), an allelic copy number caller that also determines purity and ploidy of tumors, was used to obtain both allelic CNAs (see Copy Number Analysis) and purity estimates44. For tumor samples, we required a tumor purity of 20%. The average purity of the tumor samples that passed this filter was 65% (median: 69%). The last filter we applied was percentage of tumor-in-normal, which was determined by deTiN79. All tumor samples with corresponding normal samples that had less than 30% tumor-in-normal passed this filter.
Clinical data
All clinicopathological data was downloaded from the published studies from which we obtained whole-exome sequencing data. The only clinical features used in this study were age at diagnosis, the location of the primary tumor, whether the sample was primary or metastatic, and the histology of the tumor (e.g. cutaneous, acral, mucosal, desmoplastic, occult).
Somatic variant calling
Single-nucleotide variants (SNVs) and other substitutions were called with MuTect (v1.1.6)80 (https://github.com/broadinstitute/mutect). MuTect (v1.1.6) was used to call SNVs instead of MuTect2 because, at the time of analyses performed herein, the MuTect2 method has not been published and is still actively being developed and compared with other approaches. MuTect mutation calls were filtered for 8-OxoG artifacts81, and artifacts introduced through the formalin fixation process (FFPE) of tumor tissues77. 8-OxoG and FFPE sequencing artifacts were filtered out in a three step process. First, sequence metrics are obtained from running Picard’s (https://broadinstitute.github.io/picard/) CollectSequencingArtifactMetrics, which categorizes sequence context artifacts as occurring before hybrid selection (preadapter) or during hybrid selection (bait bias). For 8-OxoG artifacts, Picard’s CollectOxoGMetrics was run to obtain Phred-scaled scores for the 16 trinucleotide sequence contexts implicated in oxidation of 8-oxoguanine. Lastly, orientation bias filtering (C>T transition for FFPE, G>T transversion for 8-OxoG) was applied to these metrics using the GATK tool FilterByOrientationBias. Indels were called with Strelka (v1.0.11). MuTect calls and Strelka82 calls were further filtered through a panel of normal samples (PoN) to remove artifacts generated by rare error modes and miscalled germline alterations80. The cancer cell fraction (CCF) of mutations, defined as the fraction of tumor cells inferred to contain the mutation, were annotated using a modified version of the mafAnno.R script from https://github.com/tischfis/facets-suite, which calculates the CCF likelihoods using the method described in McGranahan et al. 201583 from FACETS outputs. Clonal mutations were defined as having a CCF of over 80% with a probability of greater than 50% (Prob(CCF > 0.8) > 0.5).
Mutational significance analysis
To identify significantly mutated genes (SMGs) in melanoma, we applied three different algorithms that emphasized mutational recurrence (MutSig2CV; https://github.com/getzlab/MutSig2CV)9,19, sequence context (MutPanning; https://www.genepattern.org/modules/docs/MutPanning)20, and accumulated functional impact (OncodriveFML; http://bbglab.irbbarcelona.org/oncodrivefml/home)21. Due to the large number of samples, high mutational burden, and wide range of mutational burden, we combined the results (p-values) from each algorithm using Brown’s method, and classified SMGs using a strict FDR corrected p-value cutoff (q < 0.01). An expression filter was applied to the list of SMGs, such that only genes that are expressed in melanocytes were considered. All genes that had a RSEM-UQ count of at least 10 passed this expression filter. Additionally, in the event that the mutations were gain of function, genes that failed the initial filter but had a median normalized expression (RSEM-UQ) of at least 10 in the mutated samples were also kept. This is slightly more strict than the expression filter applied in the TCGA-SKCM study, which remains the largest published study of melanoma exomes to date 2. To make certain that the gene expression in the bulk transcriptome data was in part due to malignant cells, we leveraged single cell data from Tirosh et al.84, and also required that SMGs had observable expression in malignant melanoma cells. Lastly, hotspot mutations in SMGs were manually run through the UCSC BLAT filter to remove genes that were classified as false positives from mismapped reads. We used UpSetR 1.4.0 to plot the intersection of SMGs between genomic subtypes85.
Copy number analysis
Allelic copy number alterations (CNAs) were determined using FACETS, which provides information on copy number loss of heterozygosity events44. These CNAs were used in all copy number analysis besides identifying regions significantly enriched in focal amplifications/deletions using GISTIC2.043, which requires that adjacent segments with the same overall copy number change have not been smoothed into one large segment (See Copy Number Significance). GATK 3.7 was used to generate segmentation files for all tumor and normal samples that passed quality control, and used as input for GISTIC2.0.
Copy number significance
Focal regions with significant enrichment of amplifications/deletions were identified from a merged segmentation file using GISTIC2.0 (https://github.com/broadinstitute/gistic2). To identify regions harboring germline CNAs to be excluded from the analysis, we ran GISTIC2.0 on the normal samples with amplification and deletion thresholds of 0.1. Any region with a q-value < 0.25 was excluded from the somatic analysis. To identify focal regions with significant enrichment of somatic amplifications/deletions, we ran GISTIC2.0 with amplification and deletion thresholds of 0.3. Any region with a q-value less than 0.1 was considered a peak. A complete list of parameters used to run GISTIC2.0 on the normal and tumor samples are provided in the Supplementary Note. Additionally, we examined copy number calls from FACETS for genes associated with DSB repair to determine if they were enriched in tumors with signature 3 via Fisher’s exact test.
Immunotherapy survival analysis
To determine if there are significant differences between the survival curves of 2 or more groups of samples we used the log-rank test from the survival R package. We performed this test for both overall survival (OS) and progression free survival (PFS). To evaluate whether tumor mutational burden was a confounding factor in the survival analysis, we also performed cox proportional hazards models adjusting for tumor mutational burden (Supplementary Table 6).
Immunotherapy RECIST response analysis
We defined clinical benefit as having complete response (CR), partial response (PR) or stable disease (SD) with overall survival of more than 1 year, per RECIST criteria. Patients classified as having SD with overall survival of 1 year or less were, or progressive disease (PD) were classified as non-responders. To determine if genomic characteristics were associated with clinical benefit to immunotherapy we performed Fisher’s exact test.
Whole-exome mutational signatures
Active mutational processes were determined using the deconstructSigs R package (https://github.com/raerose01/deconstructSigs), with a signature contribution cutoff of 6%. This cutoff was chosen because it was the minimum contribution value required to obtain a false-positive rate of 0.1% and false-negative rate of 1.4% via the authors in-silico analysis, and is the recommended cutoff46. To confirm the presence of signature 3 as the third most active signature in TWT melanomas, and that the identification of signature 3 was not simply due to the deconstructSigs model, we used the SomaticSignatures R package47 (https://www.bioconductor.org/packages/release/bioc/html/SomaticSignatures.html), which employs an NMF-based model, rather than the linear-based model used in deconstructSigs. To determine that signature 3 was enriched in TWT melanomas we used Fisher’s exact test.
Downsampling of TWT melanomas to determine the robustness of signature 3
To further confirm that signature 3 was indeed the third most dominant signature in TWT melanomas and not being called as a result of the low mutation rate, we first ran 1000 NMF-based simulations (via SomaticSignatures) without the 35 signature 3 TWT samples identified via deconstructSigs to confirm the absence of signature 3. We then ran 1000 NMF-based simulations removing 35 random non-signature 3 TWT samples each run to confirm the existence of signature 3 (Extended Data 5).
Validation of signature 3 and immunotherapy response in independent datasets
To validate the presence of signature 3 in both TWT and non-TWT melanomas, we obtained mutation calls from the supplement of three independent studies: (1) Riaz et al. 2017, which included 68 patients with melanoma that were either treated with ipilimumab or ipilimumab-naive86, (2) Roh et al. 2017, which studied 56 melanoma patients of which 53 had mutation calls from pretreatment whole-exome sequencing87, and (3) Hugo et al. 2016, which evaluated 38 pretreatment melanoma patients88. The mutation calls for each of these cohorts were obtained from the supplemental information of the original papers, and subsequently run through deconstructSigs41. To determine that signature 3 was enriched in TWT melanomas we used Fisher’s exact test. The 3 cohorts mentioned above, as well as the CheckMate 064 cohort from Rodig et al. 201889 were used to validate the association MECOM/BMP5 or PBAF complex mutations with OS and RECIST response.
Calculation of HR deficiency associated copy number events (scores)
To calculate the number of LoH events, TAI events and LST events we used the FACETS copy number calls as input to the scarHRD R package (https://github.com/sztup/scarHRD), which implements the methods used in 50, 52, and 53, respectively. To determine p-values for the association between loss of heterozygosity events and the presence of signature 3, we used a Kolmogorov-Smirnov test and univariate logistic regression. To determine p-values for the association between the presence of signature 3 with telomeric allelic imbalance (TAI), large scale transitions (LSTs), and the unweighted sum of these homologous recombination associated copy number scores we used a Mann-Whitney U test. We highlighted these specific statistical tests for each score because they were used to find the associations in the original papers, however, Kolmogorov-Smirnov, Mann-Whitney U, and univariate logistic regression were significant for each of the four scores (Supplementary Data 4).
Whole-Genome sequenced data analysis
To evaluate whether signature 3 was not being called in the WES data purely because of ambiguity challenges, we performed mutational signature analysis on two melanoma WGS cohorts: (1) the ICGC Hayward et al. cohort17 and (2) the Priestly et al. HMF cohort55. We received the mutation calls for these cohorts directly from the authors, however, a version of the mutation calls from the Hayward et al. cohort is available to download from ICGC. The VCF files from the Priestley et al. cohort were annotated using VEP (release 99) to determine the genomic subtype (BRAF, (N)RAS, NF1, TWT) of each sample. To conform with the characterization used in this study, BRAF and (N)RAS non-hotspot samples were categorized as BRAF-mutant or (N)RAS-mutant melanomas, respectively.
Indel Mutational Signatures
To call NMF-based indel mutational signatures in the WGS samples we used SigProfiler (v1.0.5)56 (https://github.com/AlexandrovLab/SigProfilerExtractor), and performed cosine similarity between the global NMF suggested solutions and the known COSMIC signatures. To confirm that the association between signature 3 and ID8 was not random or artefactual, we tested the association between ID8 and all SNV signatures. We did this by running SigProfilier on all tumors with mutational contribution of each signature independently (e.g. running SigProfiler on all tumors with signature 1, then on all tumors with signature 2, and so on). Besides signature 3, signature 6 was the only other signature to yield ID8. To prove that ID8 was only associated with signature 3 tumors, we reran SigProfiler on the subset of signature 6 tumors that lacked contribution of signature 3, and vice versa. To call single-sample indel signatures we used the deconstructSigs R package46 and limited the search space to known indel signatures in melanoma56. The reference file used for calling indel signatures via deconstructSigs was downloaded from the supplement of Alexandrov et al.56 (https://www.synapse.org/#!Synapse:syn11738318.4).
Germline variant discovery
Germline whole-exome sequencing data were used to perform germline variant calling of single nucleotide variants (SNVs) and small deletions/duplications (indels) across all samples. Genome Analysis Toolkit (GATK) HaplotypeCaller pipeline (version 3.7) was used to call germline variants according to the GATK best practices77. GATK Variant Quality Score Recalibration (VQSR) method was used to filter germline variants. The SNP VQSR model was trained using HapMap3.3 and 1KG Omni 2.5 SNP sites, and a 99.6% sensitivity threshold was applied to filter variants. In addition, Mills et. al. 1KG gold standard and Axiom Exome Plus sites were used for indel recalibration using a 99% sensitivity threshold90.
Germline variant pathogenicity evaluation
Pathogenicity of the germline variants that passed filtering were classified according to the American College of Medical Genetics and Genomics and the Association of Molecular Pathology clinical-oriented guidelines91. The germline variants were evaluated for pathogenicity using publicly-available databases such as ClinVar and gene-specific databases. Population minor allele frequencies of these variants were obtained from the publicly-available Exome Aggregation Consortium (ExAC) database and Genome Aggregation Database (gnomAD). Based on the evidence extracted from these resources, germline variants were classified into 5 categories: benign, likely benign, variants of unknown significance, likely pathogenic and pathogenic91. Truncating germline variants in genes that have not so far been associated with a clinical phenotype, but are expected to disrupt the protein function, were classified as likely disruptive. Only germline variants classified as pathogenic, likely pathogenic, or likely disruptive were considered in the analysis.
Differential expression analysis
Differential expression analysis was performed using the edgeR57 (https://bioconductor.org/packages/release/bioc/html/edgeR.html) and DESeq258–59 (https://bioconductor.org/packages/release/bioc/html/DESeq2.html) R packages between TWT samples with and without signature 3. Tumor purity was included as a covariate in the models. To classify a gene as significantly differentially expressed we applied a Benjamini-Hochberg corrected p-value threshold of 0.05 (Supplementary Data 5). As recommended by the DESeq2 documentation, the output of this method is compatible for input to the Independent Hypothesis Weighting (IHW) R package, and the IHW R package (https://bioconductor.org/packages/release/bioc/html/IHW.html) was used to perform FDR correction for DESeq2 results92. Although we ran differential expression analysis on all genes, our downstream analysis focused on DNA repair genes (n = 496, see Gene sets).
Immune Cell Composition
To determine the composition of immune cells in the tumor microenvironment of each tumor we used CIBERSORT93 (https://cibersort.stanford.edu/). The LM22 immune cell signature matrix was used for deconvolution on the raw TCGA SKCM RNA-seq data. CIBERSORT was run for 1000 permutations and quantile normalization was applied. To determine if there was a significant shift in the proportion of immune cell types between genomically stratified groups of melanomas we used a Mann-Whitney U test.
Expression correlation analysis
To identify genes whose expression was linearly associated with relative contribution of signature 3, we performed Pearson’s correlation between relative signature 3 contribution and normalized RNA expression data for all TCGA-SKCM samples that passed our joint quality control parameters. We performed this analysis on all DNA repair genes (n = 496, see Gene sets), which includes HR genes and other DSB repair pathway genes.
Gene sets
All gene sets and their corresponding genes used for analysis in this study can be found in Supplementary Table 8. DNA repair gene sets from the KEGG, GO and REACTOME databases were downloaded from the molecular signatures database (MSigDB v6.2)94–95 (https://www.gsea-msigdb.org/gsea/msigdb/index.jsp). Gene sets from GO, KEGG and REACTOME that specifically contained genes involved in mitotic recombination were considered HR genes (n = 54). HR genes and genes in the GO DSB repair gene set were considered DSB genes (n = 190). The BAF and PBAF gene sets were downloaded from genenames.org. The RASopathy gene set was derived from96.
Gene fusions
Fusions calls from 45 were leveraged to determine global differences in fusion events between the genomic subtypes and to identify recurrent fusion events. A Kruskal-Wallis test was used to determine if there was a significant difference in the number of fusions events per tumor between the genomic subtypes.
Methylation analysis
Differential methylation analysis was performed between TWT samples with and without signature 3 using bumphunter via the minfi R package61–62 (http://bioconductor.org/packages/release/bioc/html/minfi.html). We also identified potential sites of methylation associated with signature 3 by applying several joint heuristics and statistical tests. To identify candidate sites we required that there be (1) a significant (p-value cutoff < 0.05) positive Pearson correlation between signature 3 contribution and methylation β-values, (2) a significant median difference in β-values of at least 2% between signature 3 and non-signature 3 tumors, and (3) a significant anticorrelation between methylation β-values and gene expression. The joint heuristic and statistical analysis was restricted to DNA repair genes (n = 496, see Gene sets), while the differential methylation analysis extended to the entire exome.
Pathway over-representation analysis
We performed pathway over-representation analysis on the genomic subtype specific SMGs (including BRAF V600E/K) using ConsensusPathDB (v34)97 (http://cpdb.molgen.mpg.de/). We ran ConsensusPathDB (on March 15, 2020) with default parameters for pathway-based sets, and protein complex-based gene sets (Supplementary Table 7).
Statistics and Reproducibility
Statistical analyses were performed using the stats R package for R version 3.6.1. Reported q-values represent Benjamini-Hochberg corrected p-values, and reported p-values represent nominal p-values. All statistical tests performed (e.g. Mann-Whitney U, Kolmogorov-Smirnov, t-test, Fisher’s exact test, χ2) were two-sided.
Extended Data
Extended Data Fig. 1. Overlap between SMGs from the entire cohort and subtype analyses.
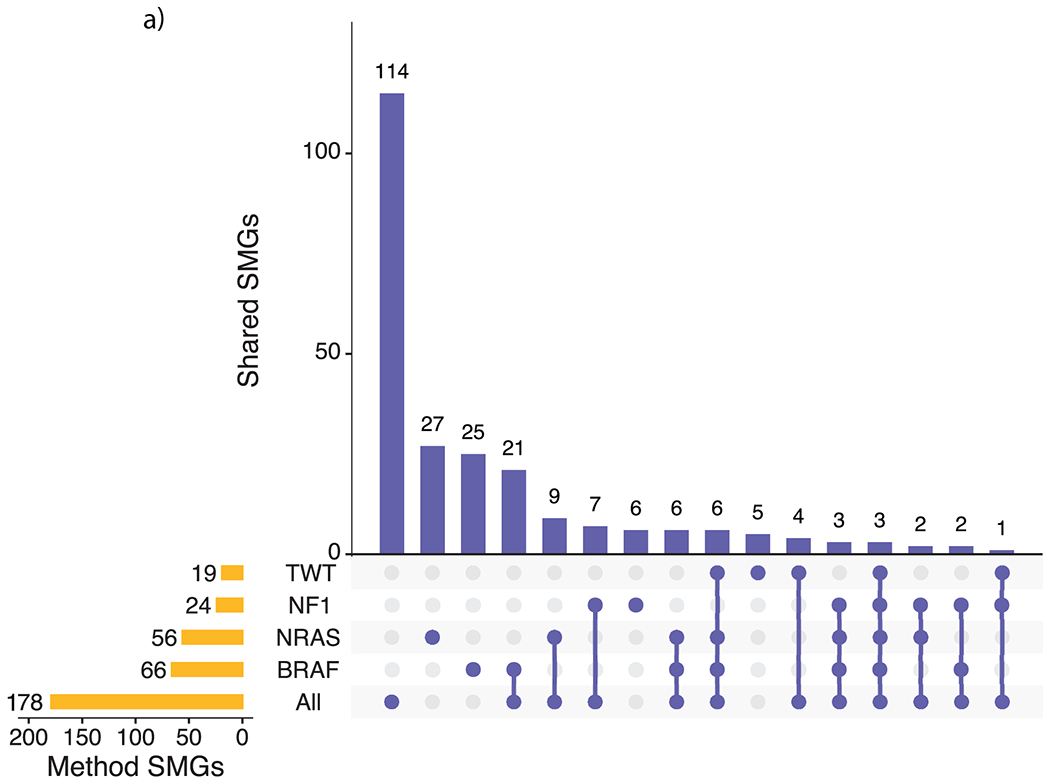
a, Overlap between the subtype-specific SMGs and the SMGs that were identified via the entire cohort (M1000). Most of the SMGs identified in the entire cohort analysis were not identified through the subtype specific analysis (115 of 178, 64.6%).
Extended Data Fig. 2. MECOM/BMP5 immunotherapy validation (overall survival and RECIST response).
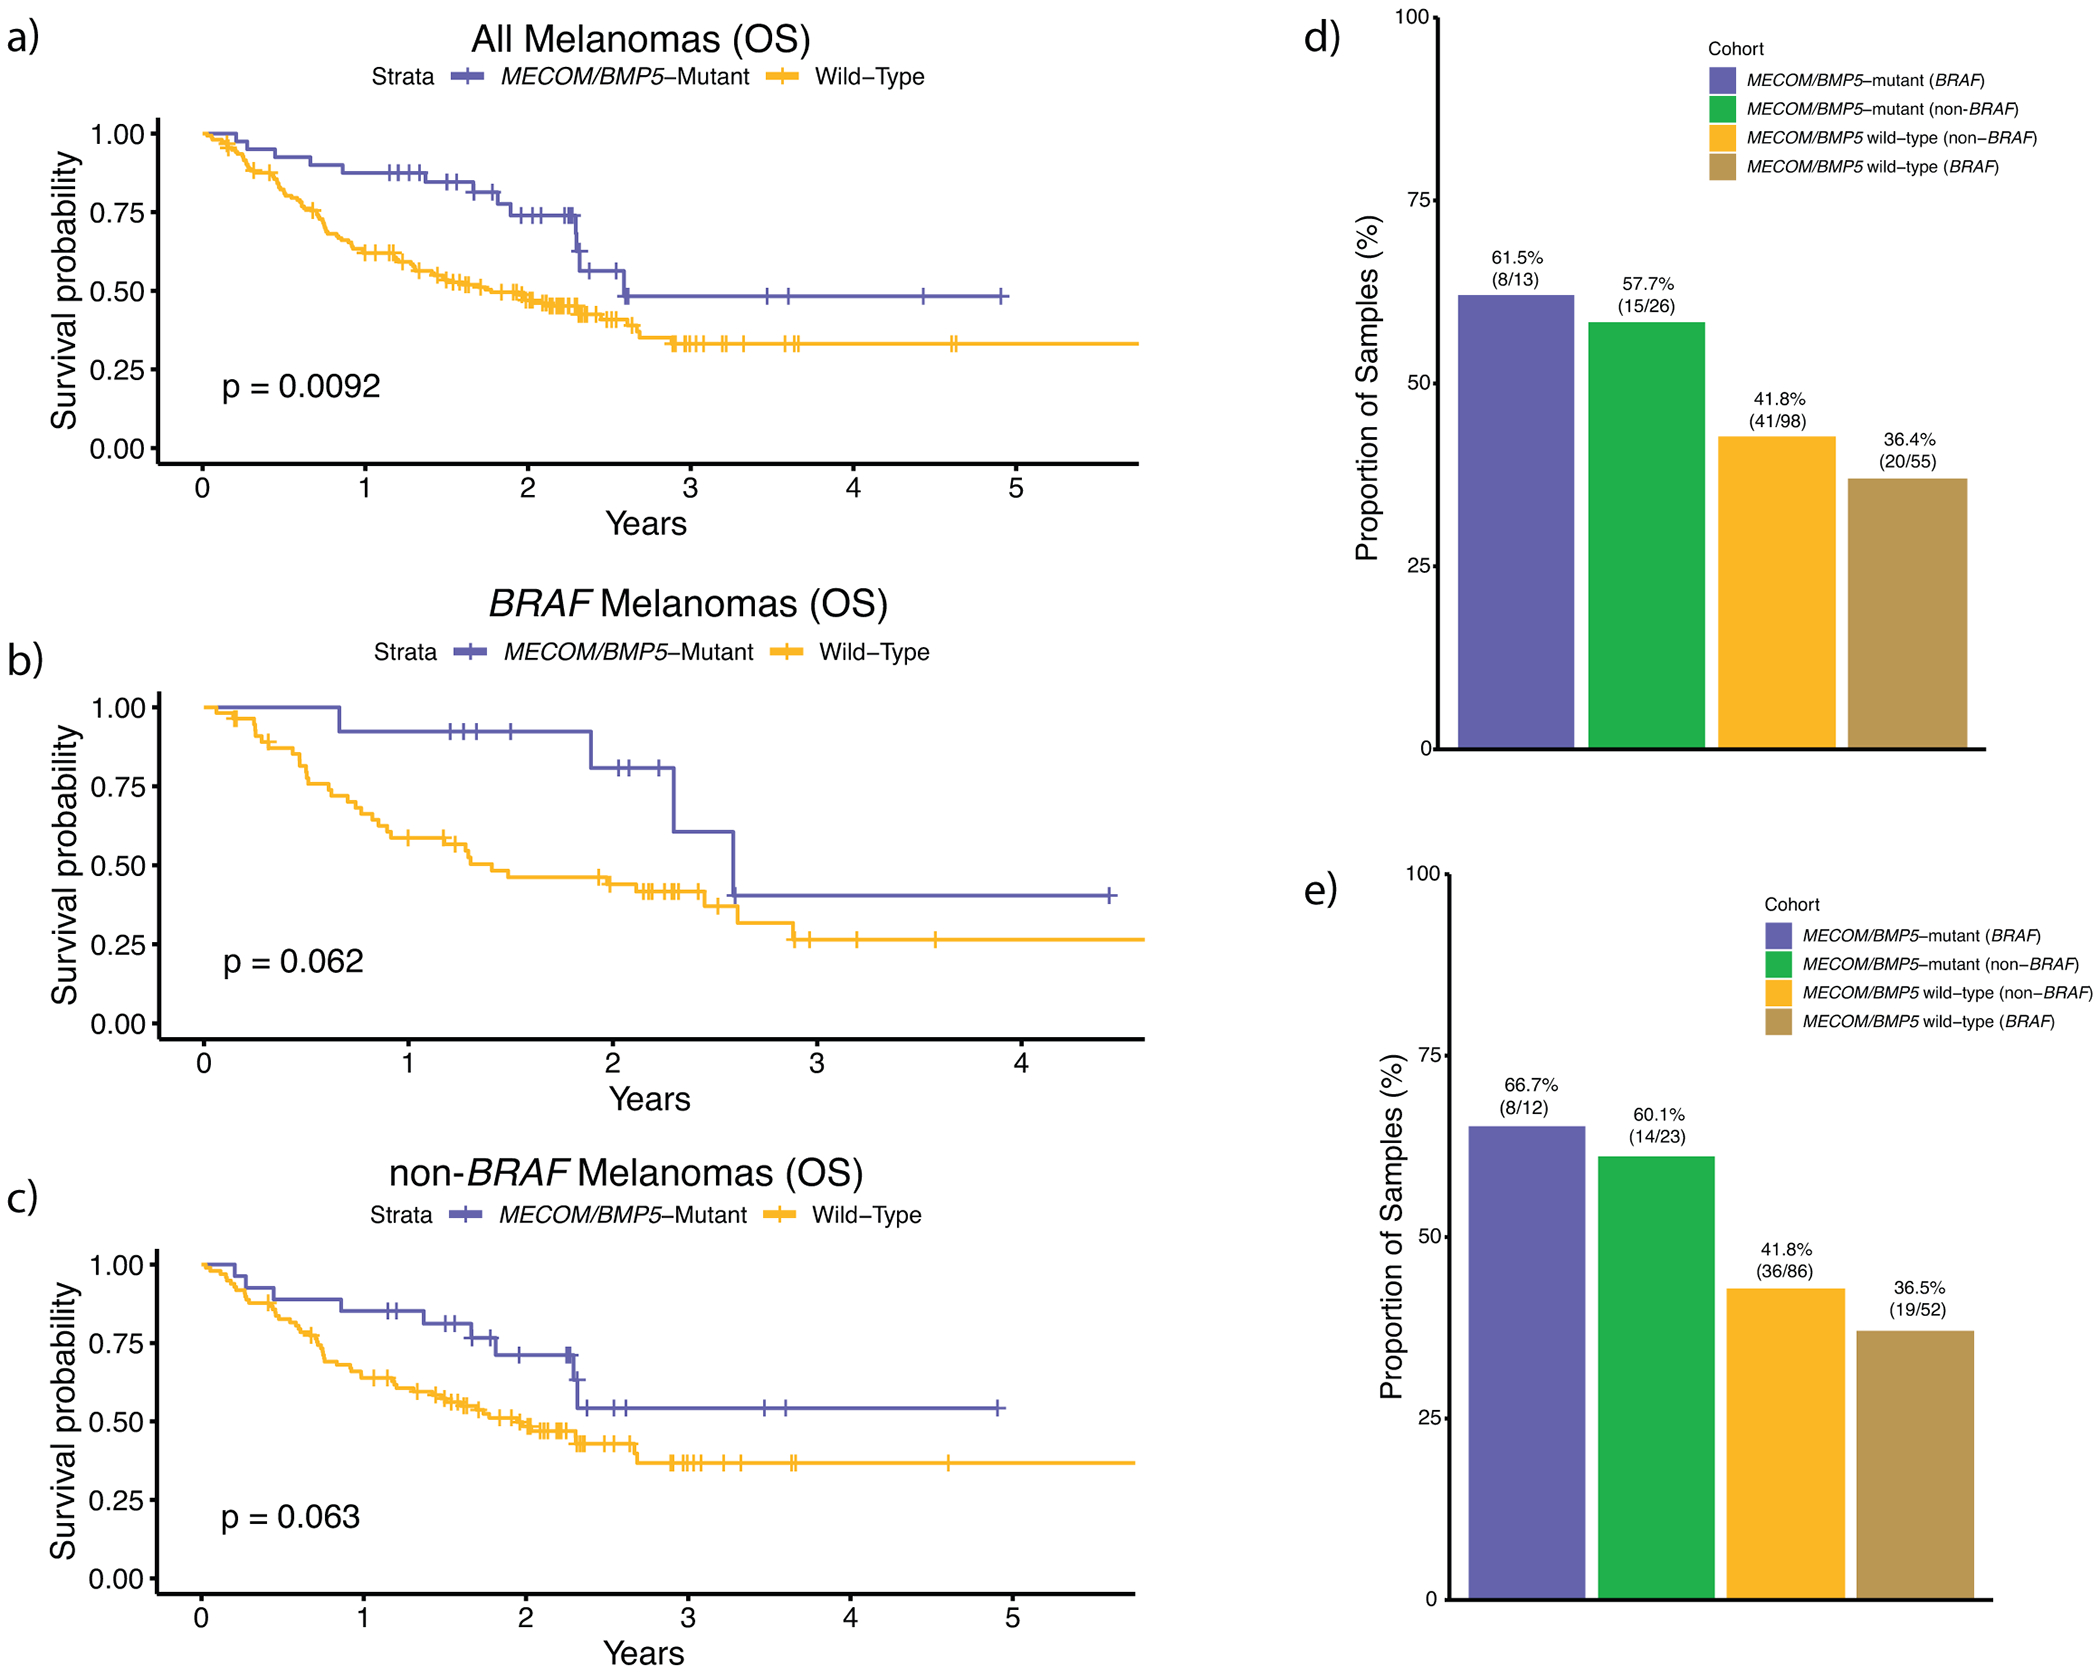
External validation analysis of overall survival for MECOM/BMP5 mutations using the Roh, Riaz, Hugo, and Rodig whole-exome cohorts (n = 194 total) for a, all melanomas, b, BRAF melanomas, and c, non-BRAF melanomas, excluding post treatment biopsies. These cohorts were chosen because they were immunotherapy treated, whole-exome sequenced, cohorts not included in our discovery cohort. Due to the diverse treatment regimens in each of these trials and cohorts, we were unable to correct for drug. Further, since we did not have access to raw sequencing data from all these studies, we could not calculate and correct for tumor purity and utilized published variant calls. The hazard rate ratios of MECOM/BMP5 mutations when correcting for only mutational load was (a) 0.59 (multivariate Cox proportional-hazards, p = 0.09) for all melanomas, (b) 0.46 (multivariate Cox proportional-hazards, p = 0.16) for BRAF melanomas, and (c) 0.68 (multivariate Cox proportional-hazards, p = 0.31) for non-BRAF melanomas. These results are similar to what was observed in the discovery cohort (Supplementary Table 8), although this validation cohort size was not powered to achieve statistical significance. d, The association between the BRAF subtype and MECOM/BMP5 mutations for clinical benefit to immunotherapy (via RECIST) in our limited validation cohort was similar to our discovery cohort findings, but not statistically significant. The p-values shown in a–c) are derived from the log-rank test.
Extended Data Fig. 3. PBAF complex immunotherapy validation (overall survival and RECIST response).
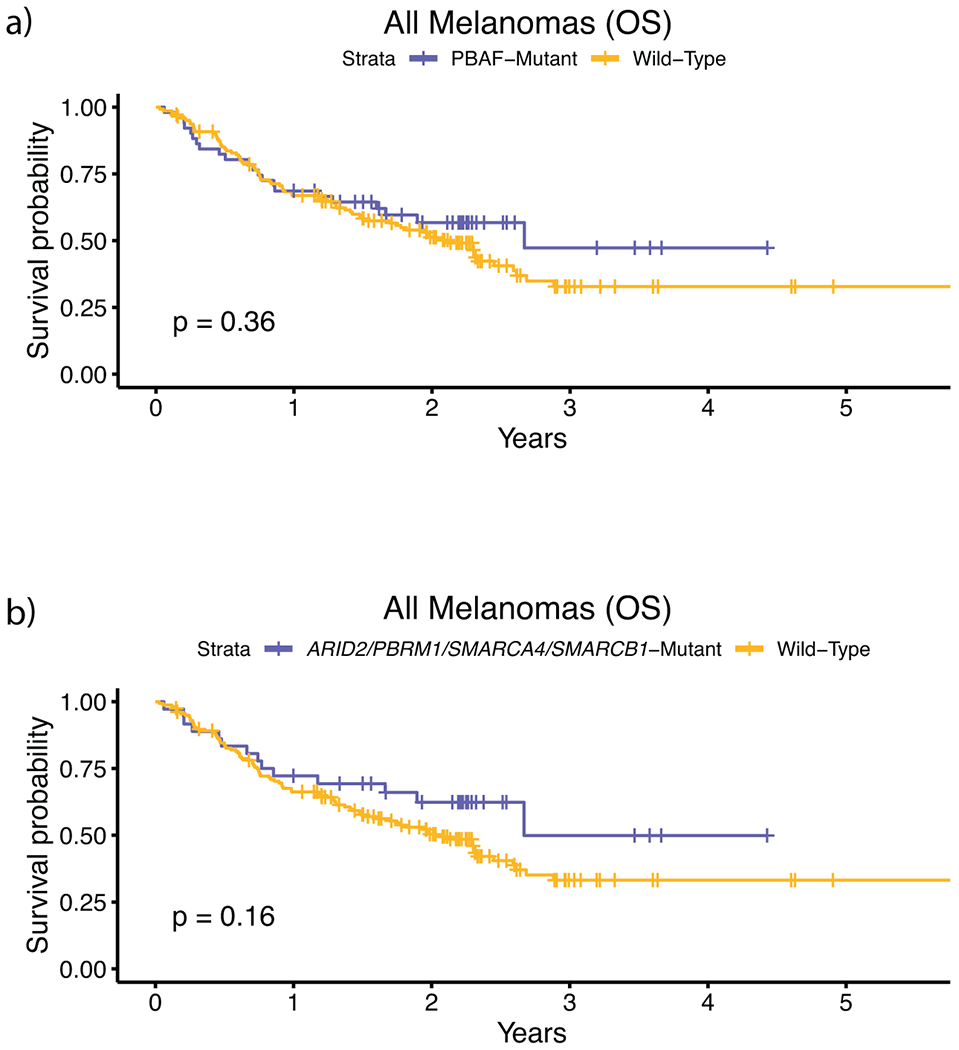
External validation analysis of overall survival for PBAF mutations using the Roh, Riaz, Hugo, and Rodig cohorts (n = 194), which are immunotherapy treated, whole-exome sequenced, cohorts not included in our discovery cohort. a, Survival curves between PBAF-mutants and non-PBAF mutants. b, Survival curves between PBAF-mutants and non-PBAF mutants where PBAF mutants are classified by having mutations in ARID2, PBRM1, SMARCA4, and SMARCB1, which are the 4 PBAF complex genes commonly used in clinical sequencing panels. This limited validation cohort lacked sufficient samples with co-mutation of (N)RAS and PBAF complex genes (n = 9), and thus validation analysis was only performed on all tumors. Due to the unique treatment regimens in each of these cohorts, we were unable to correct for drug. Further, because we did not have access to raw sequencing data from these studies, we could not calculate and correct for tumor purity. When correcting only for mutational load the hazard ratio of PBAF mutations in the whole-exome cohorts, (a) when considering all genes in the PBAF complex, was 1.07 (multivariate Cox proportional-hazards, p = 0.80). The differences in these findings relative to the primary larger cohort may indicate differences in patient population and study size relative to our discovery cohort. (b) When considering only mutations in ARID2, PBRM1, SMARCA4, and SMARCB1 as PBAF-mutant, the HRR was 0.86 (multivariate Cox proportional-hazards, p = 0.61). The p-values for a-b) are derived from the log-rank test.
Extended Data Fig. 4. NMF validation of deconstructSigs results on genomic subtypes via SomaticSignatures.
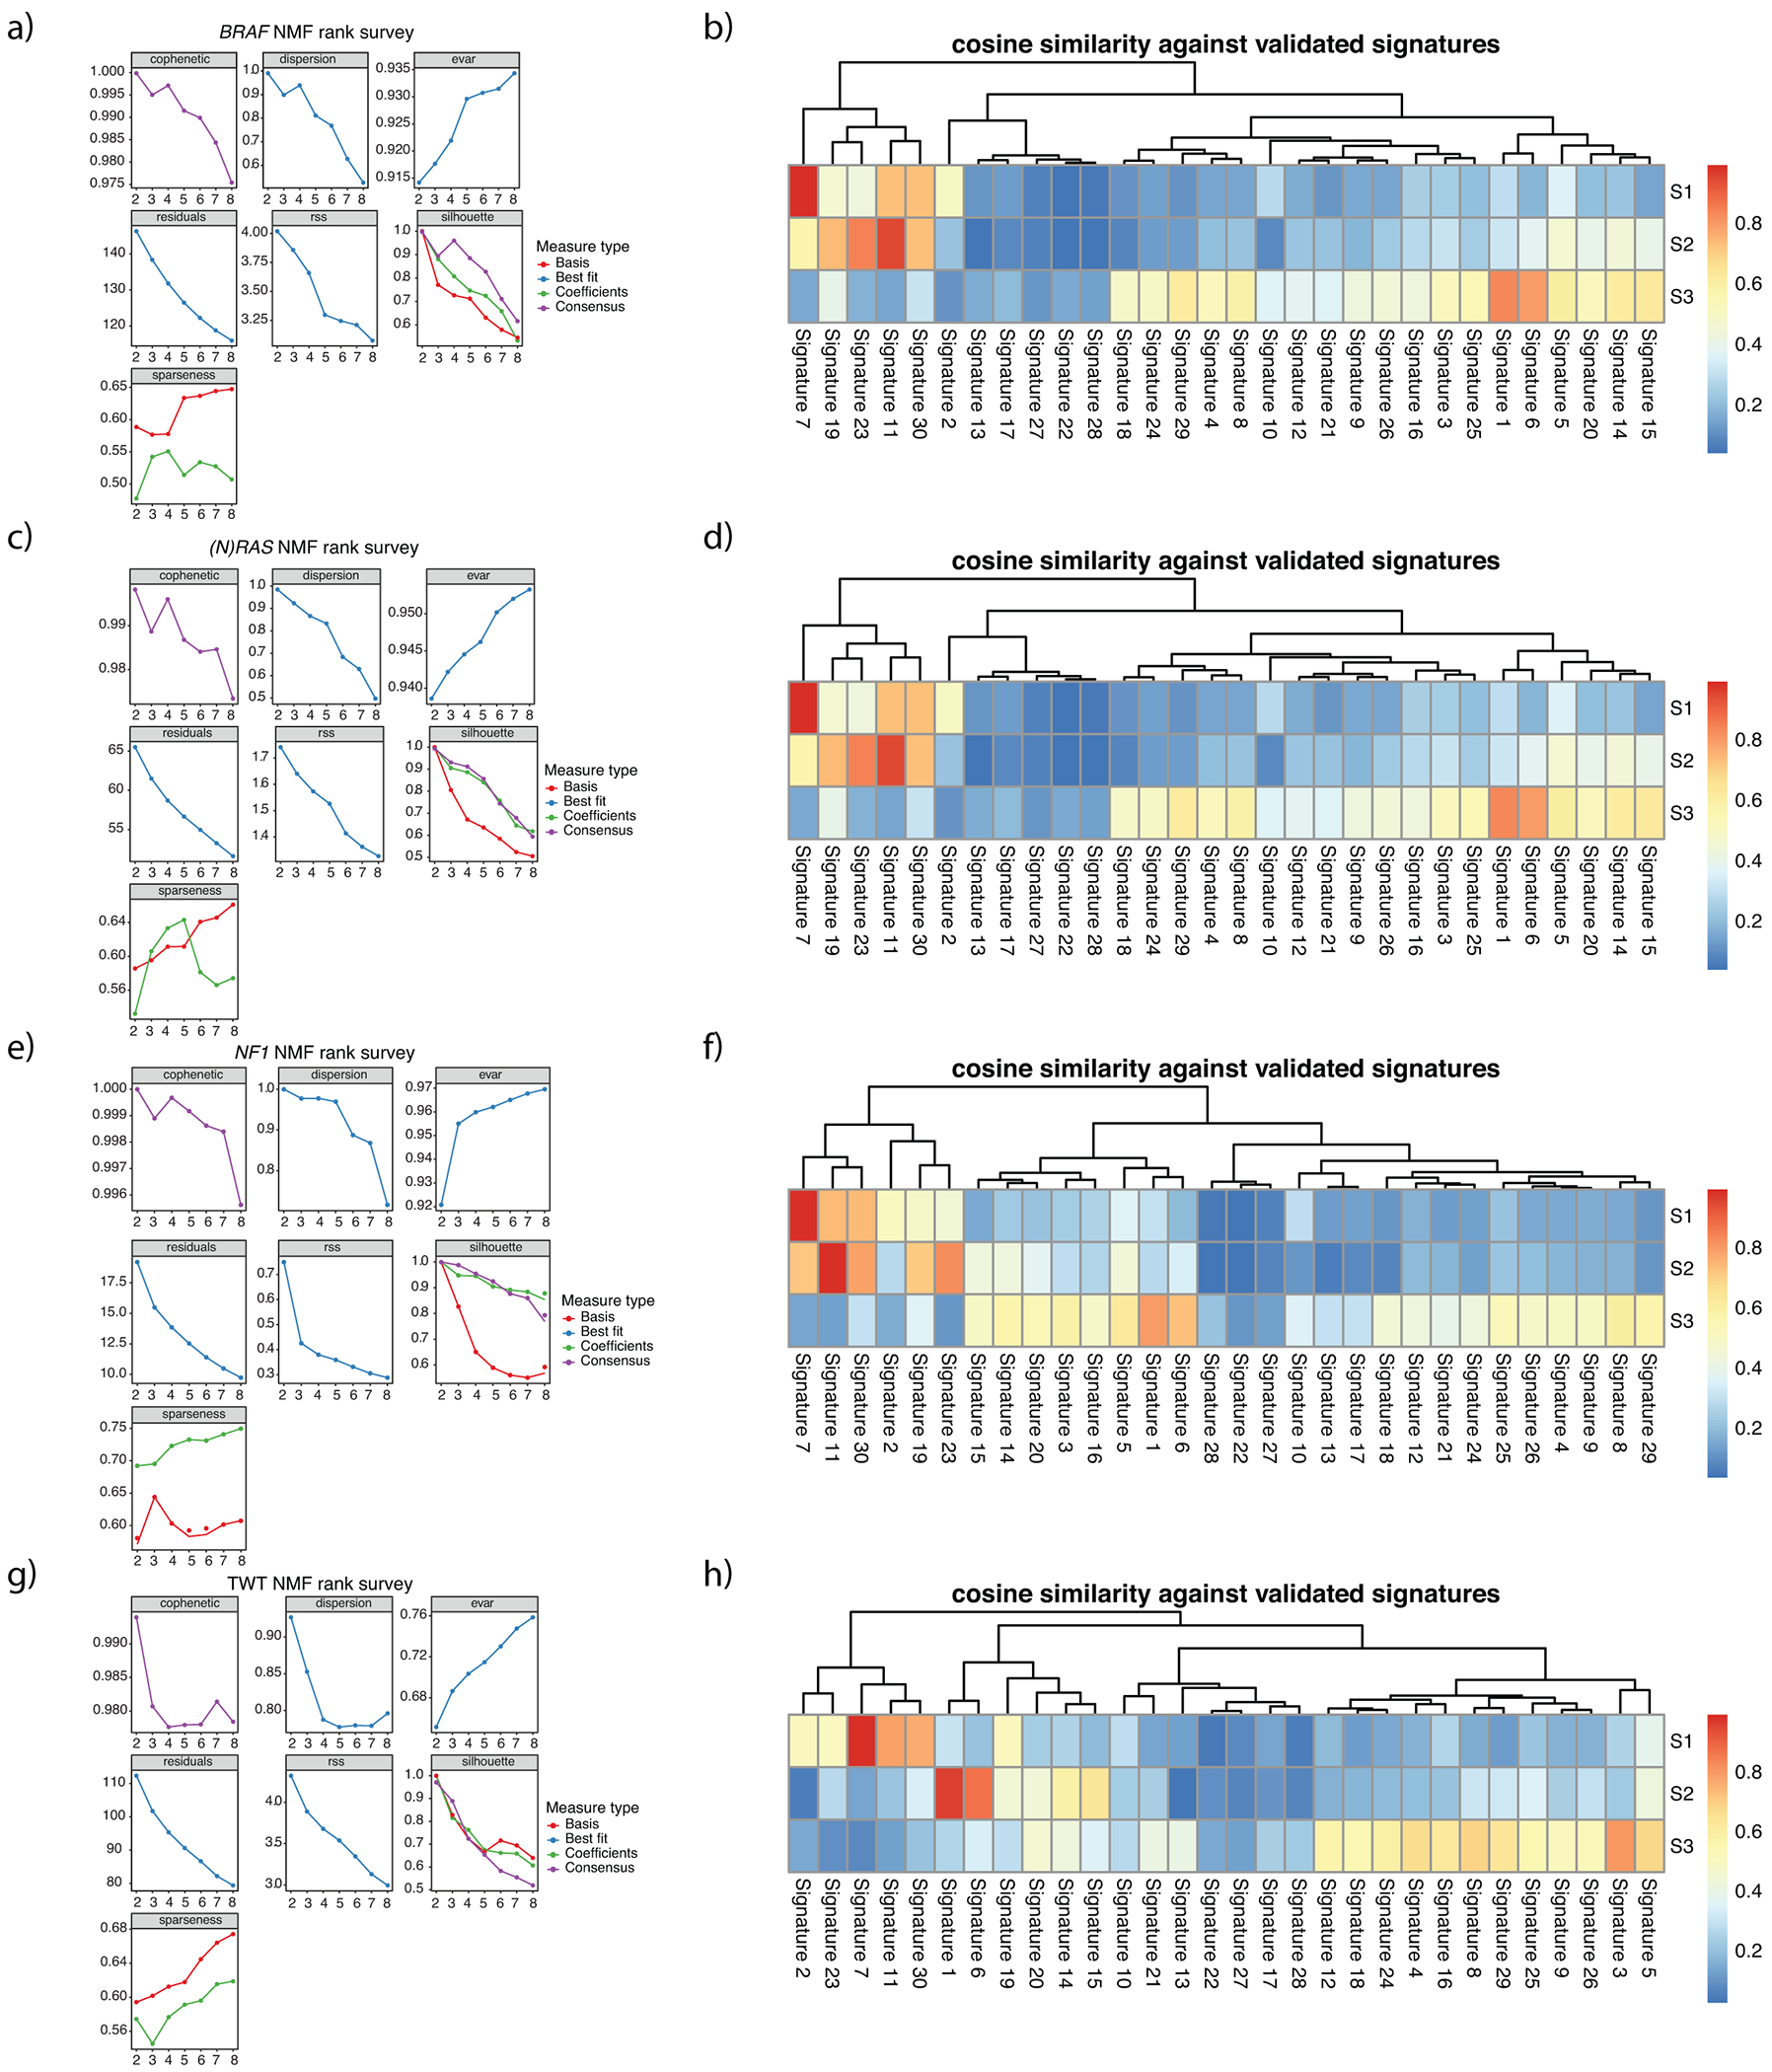
a, NMF statistics for BRAF melanomas. b, Cosine similarity between COSMIC signatures and signatures decomposed via NMF for BRAF melanomas. c, NMF statistics for ((N)RAS melanomas. d, Cosine similarity between COSMIC signatures and signatures decomposed via NMF for (N)RAS melanomas. e, NMF statistics for NF1 melanomas. f, Cosine similarity between COSMIC signatures and signatures decomposed via NMF for NF1 melanomas. g, NMF statistics for TWT melanomas. h, Cosine similarity between COSMIC signatures and signatures decomposed via NMF for TWT melanomas. The cophenetic correlation coefficient and residual sum of squares (RSS) suggests 3 is the optimal number of signatures for each genomic subtype.
Extended Data Fig. 5. NMF simulations via SomaticSignatures on TWT melanomas removing 35 random non-signature 3 samples each simulation.
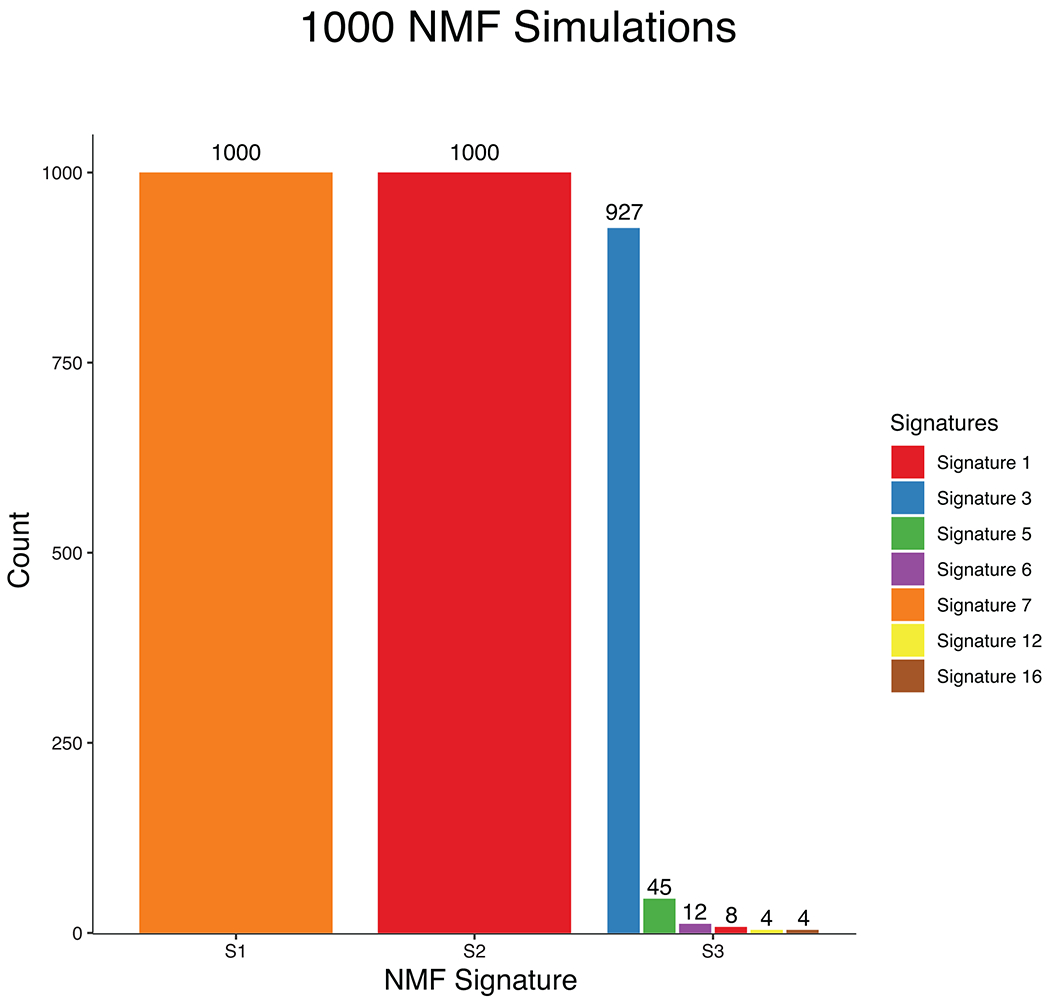
A total of 35 signature 3 samples were identified via deconstructSigs in our signature analysis. To ensure that our NMF validation in TWT melanomas (Supplementary Fig. 17) is actually identifying signature 3 because it is indeed present, and not because it’s a flat signature, we performed 1000 simulations removing 35 random non-signature 3 samples each time. Signature 3 was identified 927 times (92.7%), which corroborates the deconstructSigs results and suggests signature 3 is the third most dominant signature in TWT melanomas. Performing 1000 simulations when removing the 35 signature 3 samples each time never yielded the identification of signature 3 via NMF.
Extended Data Fig. 6. DSB repair deficiency - unweighted sum of HRD associated CNA events.
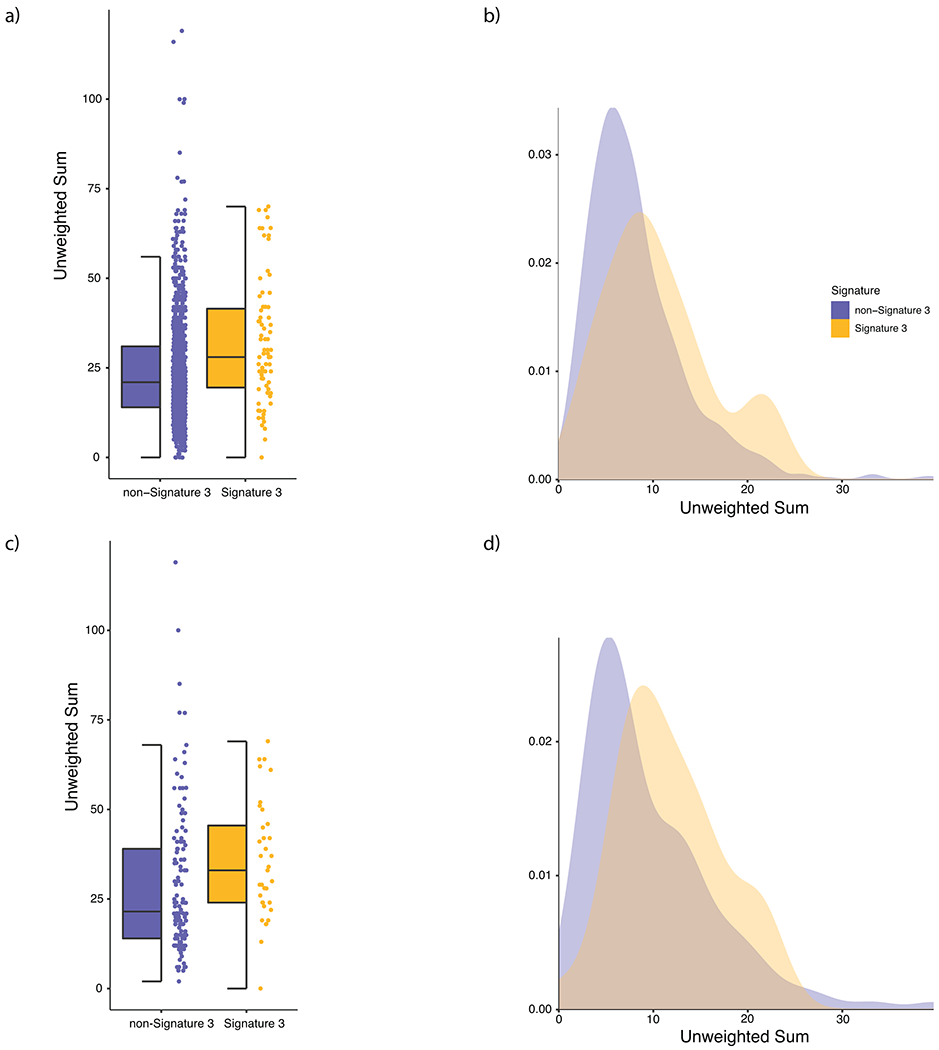
a, Distribution of the unweighted sum of HRD associated CNA events (loss of heterozygosity, telomeric allelic imbalance, large scale transitions) in signature 3 (yellow) and non-signature 3 (purple) melanomas in the entire cohort. Signature 3 tumors were significantly enriched in HRD associated copy number events via a Mann-Whitney U test (p = 6.21 × 10⁻⁵, two-sided). b, Density plot of HRD associated copy number events in the entire cohort. c, Distribution of HRD associated copy number events in signature 3 and non-signature 3 melanomas in TWT melanomas (Mann-Whitney U, p = 5.49 × 10⁻³, two-sided). d, Density plot of HRD associated copy number events in the TWT melanomas. In (a) and (c) the data is represented as a boxplot where the middle line is the median, the lower and upper edges of the box are the first and third quartiles, the whiskers represent the interquartile range (IQR) multiplied by 1.5, and beyond the whiskers are outlier points.
Extended Data Fig. 7. Indel mutational signatures on the 390 WGS tumors.
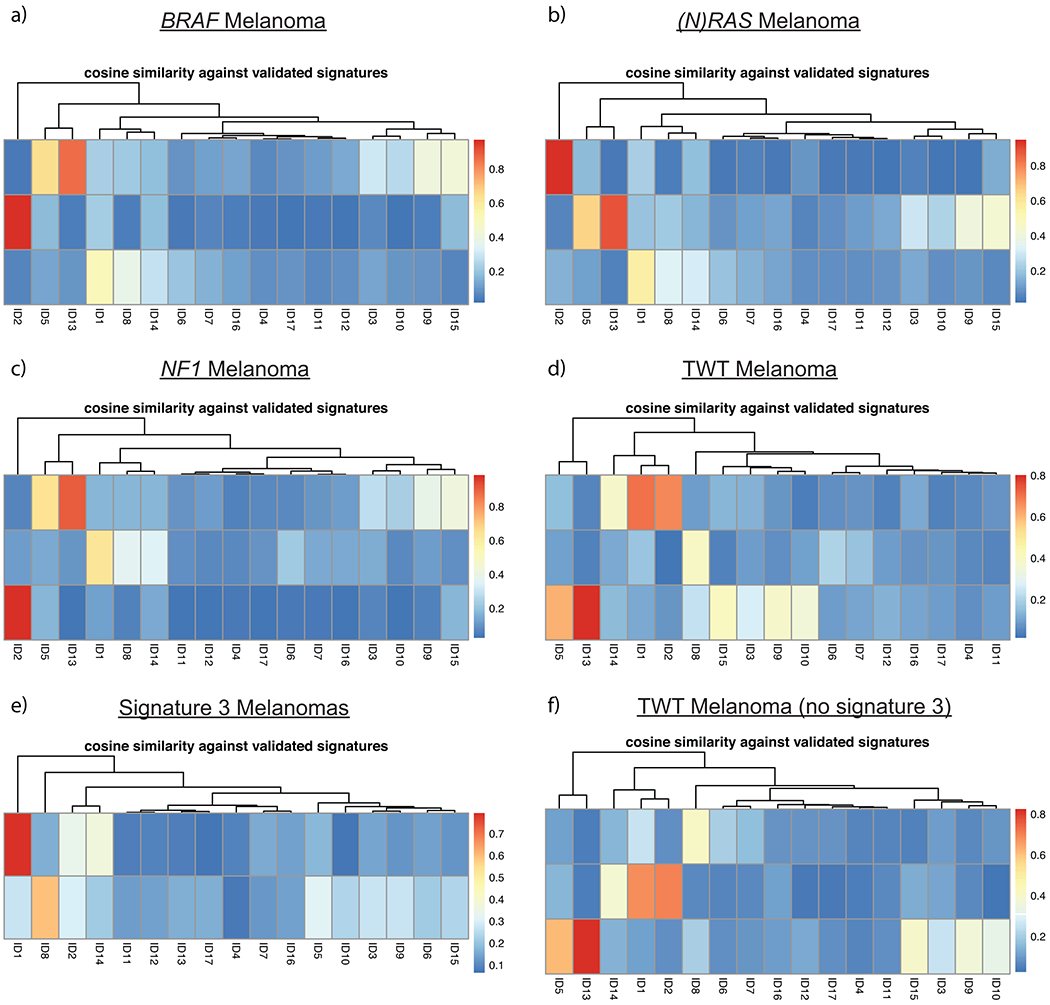
Cosine similarity between COSMIC indel mutational signatures and the suggested solution NMF results from SigProfileExtractor. Indel mutational signatures revealed that a, BRAF, b, (N)RAS, and c, NF1 melanomas were associated with indel signatures ID1, ID2 and ID13 (associated with UV), while d, TWT melanomas were associated with indel signatures ID1, ID8 (associated with NHEJ), and ID13. e, Mutational signature 3 was associated with indel signatures ID1 and ID8, and was the sole mutational signature associated with ID8. f, Interestingly, when removing signature 3 tumors from the TWT melanoma cohort, TWT melanomas were still associated with indel signature ID8. Thus, the increased genomic instability of TWT melanomas in general is enough to result in ID8.
Extended Data Fig. 8. Comparison of transcriptional profiles between DSB repair deficient and DSB repair intact TWT melanomas.
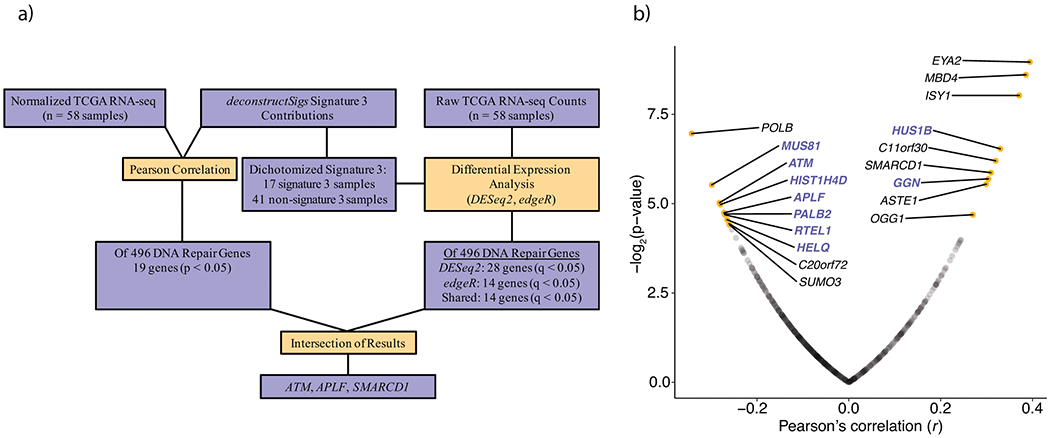
a, The workflow used to identify transcriptional differences between putative DSB repair deficient (presence of signature 3) and non-DSB repair deficient (no contribution of signature 3) TWT tumors. b, Pearson correlation between signature 3 contribution and normalized gene expression in TWT melanomas (Methods) identified 9 positive and 10 negative significant correlations for DNA-repair genes (Pearson’s, p-value cutoff < 0.05; Methods). Genes highlighted in purple function in DSB repair pathways, including HR. Opacity was used to show the density of non-significant points along both axes.
Extended Data Fig. 9. Differential expression analysis between signature 3 and non-signature 3 TWT melanomas.
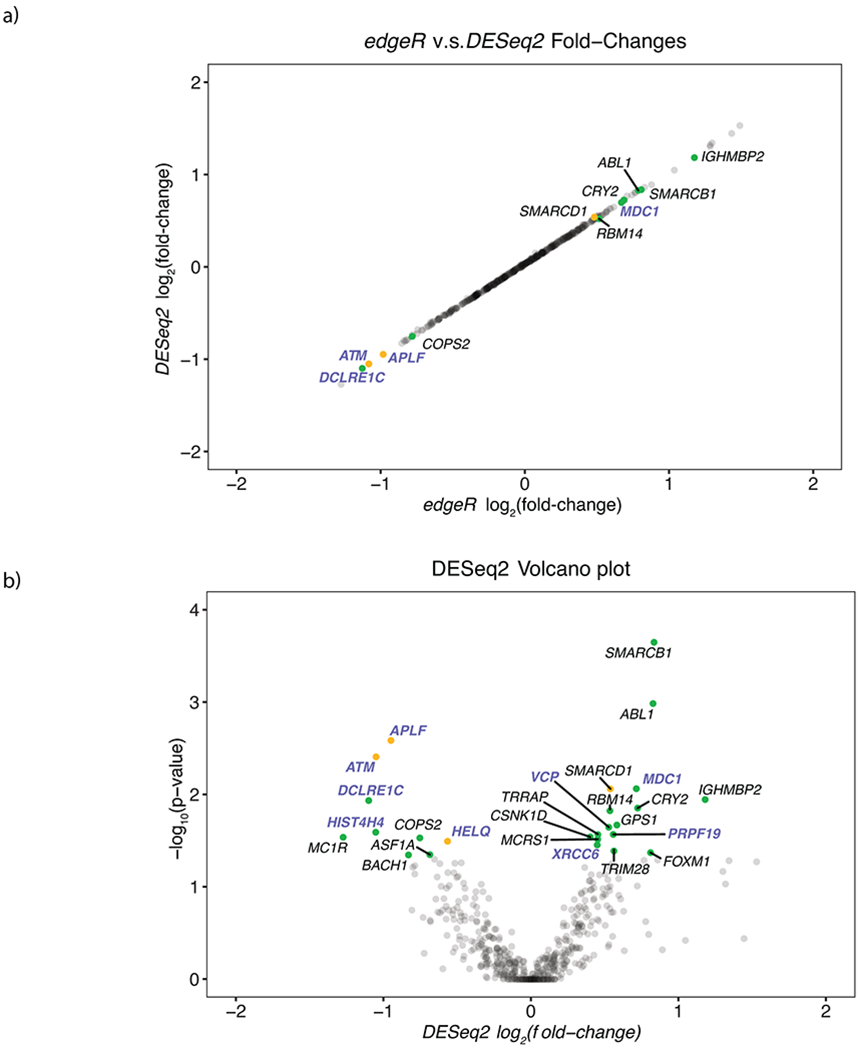
a, DESeq2 log2 fold-change vs edgeR log2 fold-change for cumulative set of DNA-repair genes. b, Significance vs log2 fold-change of significantly differentially expressed DNA repair genes as determined by DESeq2. Yellow points indicate genes whose expression was significantly correlated with signature 3 contribution and significantly differentially expressed. Green points indicate genes that were only significantly differentially expressed. Genes highlighted in purple function in DSB repair. Opacity was used to show the density of non-significant points along both axes.
Extended Data Fig. 10. Methylation and signature 3 contribution.
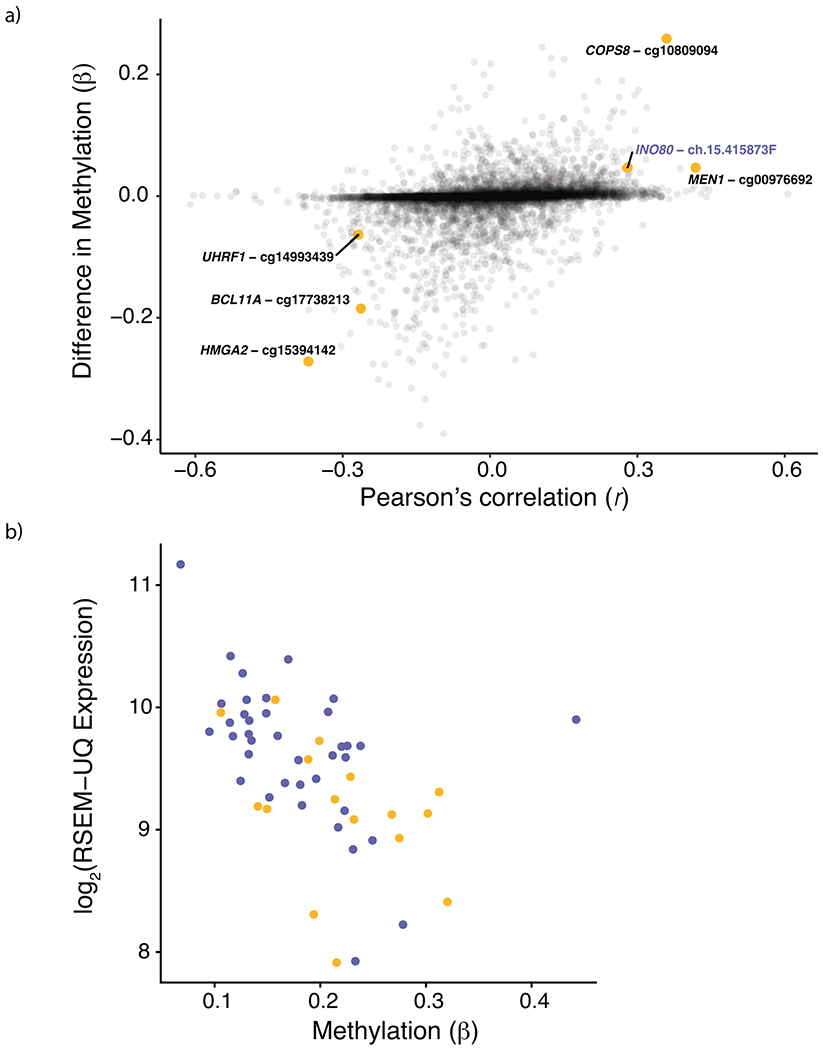
a, Pearson correlation between signature 3 contribution and methylation β-values plotted on the x-axis vs. difference in median methylation between signature 3 and non-signature 3 TWT samples on the y-axis. Six probe sites were significantly correlated with signature 3 contribution, had a significant difference in median β-values (via Mann-Whitney U), and had methylation β-values significantly associated with gene expression. Of the six probe sites, INO80 was the only gene involved in HR repair. Opacity was used to show the density of non-significant points along both axes. b, Expression of INO80 was significantly correlated with methylation β-values at INO80-ch.15.415873F (Pearson’s, r = −0.51, p = 8.516 × 10⁻⁵). Points in yellow are from signature 3 TWT samples and points in purple are from non-signature 3 TWT samples.
Supplementary Material
ACKNOWLEDGEMENTS
This work was supported by NCI F31CA239347 (J.R.C.), NIH 5T32HG002295-15 (J.R.C.), NIH R01CA227388-02 (E.M.V.A.), NIH R21CA242861 (E.M.V.A.) and the Damon Runyon Clinical Investigator Award (E.M.V.A.). F.D. was supported by the Claudia Adams Barr Program for Innovative Cancer Research and the AWS Cloud Credits for Research Program. The results presented in this study are in part based upon data generated by the TCGA Research Network: https://www.cancer.gov/tcga. This publication and the underlying research are partly facilitated by Hartwig Medical Foundation and the Center for Personalized Cancer Treatment (CPCT) which have generated, analyzed and made available data for this research. We thank Petra Ross-Macdonald for providing clinical outcomes data used for the immunotherapy response validation analyses.
Footnotes
COMPETING INTERESTS
E.M.V.A. is a consultant for Tango Therapeutics, Genome Medical, Invitae, Enara Bio, Monte Rosa Therapeutics, Manifold Bio, and Janssen. E.M.V.A. provides research support to Novartis and Bristol-Myers Squibb. E.M.V.A. has equity in Tango Therapeutics, Genome Medical, Syapse, Ervaxx, and Microsoft. E.M.V.A. receives travel reimbursement from Roche/Genentech. E.M.V.A. has institutional patents filed on methods for clinical interpretation.
DATA AVAILABILITY
All of the datasets used in this study are publicly available. The raw sequence data can be obtained through dbGaP (https://www.ncbi.nlm.nih.gov/gap) and the International Cancer Genome Consortium (ICGC) Data Access Compliance Office (https://icgc.org/daco), or as described in their original papers (Supplementary Table 1). The accession codes can also be found in Supplementary Table 1. Publicly available databases used in this study include MSigDB v6.2 (https://www.gsea-msigdb.org/gsea/msigdb/index.jsp), ClinVar (https://www.ncbi.nlm.nih.gov/clinvar/), ExAC (http://exac.broadinstitute.org/), gnomAD (https://gnomad.broadinstitute.org/), the Broad Institute Single Cell portal (https://singlecell.broadinstitute.org/single_cell), and ConsensusPathDB v34 (http://cpdb.molgen.mpg.de/).
CODE AVAILABILITY
All software and bioinformatic tools used in this study are publicly available.
REFERENCES
- 1.Hodis E et al. A landscape of driver mutations in melanoma. Cell 150, 251–263 (2012). [DOI] [PMC free article] [PubMed] [Google Scholar]
- 2.Cancer Genome Atlas Network. Genomic Classification of Cutaneous Melanoma. Cell 161, 1681–1696 (2015). [DOI] [PMC free article] [PubMed] [Google Scholar]
- 3.Flaherty KT et al. Inhibition of mutated, activated BRAF in metastatic melanoma. N. Engl. J. Med 363, 809–819 (2010). [DOI] [PMC free article] [PubMed] [Google Scholar]
- 4.Flaherty KT et al. Improved survival with MEK inhibition in BRAF-mutated melanoma. N. Engl. J. Med 367, 107–114 (2012). [DOI] [PubMed] [Google Scholar]
- 5.Zaretsky JM et al. Mutations Associated with Acquired Resistance to PD-1 Blockade in Melanoma. N. Engl. J. Med 375, 819–829 (2016). [DOI] [PMC free article] [PubMed] [Google Scholar]
- 6.Snyder A et al. Genetic basis for clinical response to CTLA-4 blockade in melanoma. N. Engl. J. Med 371, 2189–2199 (2014). [DOI] [PMC free article] [PubMed] [Google Scholar]
- 7.Van Allen EM et al. Genomic correlates of response to CTLA-4 blockade in metastatic melanoma. Science 350, 207–211 (2015). [DOI] [PMC free article] [PubMed] [Google Scholar]
- 8.Wolchok JD et al. Overall Survival with Combined Nivolumab and Ipilimumab in Advanced Melanoma. N. Engl. J. Med 377, 1345–1356 (2017). [DOI] [PMC free article] [PubMed] [Google Scholar]
- 9.Lawrence MS et al. Discovery and saturation analysis of cancer genes across 21 tumour types. Nature 505, 495–501 (2014). [DOI] [PMC free article] [PubMed] [Google Scholar]
- 10.Krauthammer M et al. Exome sequencing identifies recurrent somatic RAC1 mutations in melanoma. Nat. Genet 44, 1006–1014 (2012). [DOI] [PMC free article] [PubMed] [Google Scholar]
- 11.Cirenajwis H et al. NF1-mutated melanoma tumors harbor distinct clinical and biological characteristics. Mol. Oncol 11, 438–451 (2017). [DOI] [PMC free article] [PubMed] [Google Scholar]
- 12.Nsengimana J et al. β-Catenin–mediated immune evasion pathway frequently operates in primary cutaneous melanomas. Journal of Clinical Investigation 128, 2048–2063 (2018). [DOI] [PMC free article] [PubMed] [Google Scholar]
- 13.Krauthammer M et al. Exome sequencing identifies recurrent mutations in NF1 and RASopathy genes in sun-exposed melanomas. Nat. Genet 47, 996–1002 (2015). [DOI] [PMC free article] [PubMed] [Google Scholar]
- 14.Van Allen EM et al. The genetic landscape of clinical resistance to RAF inhibition in metastatic melanoma. Cancer Discov 4, 94–109 (2014). [DOI] [PMC free article] [PubMed] [Google Scholar]
- 15.Wagle N et al. MAP kinase pathway alterations in BRAF-mutant melanoma patients with acquired resistance to combined RAF/MEK inhibition. Cancer Discov 4, 61–68 (2014). [DOI] [PMC free article] [PubMed] [Google Scholar]
- 16.Miao D et al. Genomic correlates of response to immune checkpoint blockade in microsatellite-stable solid tumors. Nat. Genet 50, 1271–1281 (2018). [DOI] [PMC free article] [PubMed] [Google Scholar]
- 17.Hayward NK et al. Whole-genome landscapes of major melanoma subtypes. Nature 545, 175–180 (2017). [DOI] [PubMed] [Google Scholar]
- 18.Liu D et al. Integrative molecular modeling of clinical outcomes to PD1 blockade in patients with metastatic melanoma. Nat. Medicine 25, 1916–1927 (2019). [DOI] [PMC free article] [PubMed] [Google Scholar]
- 19.Lawrence MS et al. Mutational heterogeneity in cancer and the search for new cancer-associated genes. Nature 499, 214–218 (2013). [DOI] [PMC free article] [PubMed] [Google Scholar]
- 20.Dietlein F et al. Identification of cancer driver genes based on nucleotide context. Nat. Genetics 52, 208–218 (2020). [DOI] [PMC free article] [PubMed] [Google Scholar]
- 21.Mularoni L, Sabarinathan R, Deu-Pons J, Gonzalez-Perez A & López-Bigas N OncodriveFML: a general framework to identify coding and non-coding regions with cancer driver mutations. Genome Biol 17, 128 (2016). [DOI] [PMC free article] [PubMed] [Google Scholar]
- 22.Chakravarty D et al. OncoKB: A Precision Oncology Knowledge Base. JCO Precis Oncol 2017, (2017). [DOI] [PMC free article] [PubMed] [Google Scholar]
- 23.Johannessen CM et al. A melanocyte lineage program confers resistance to MAP kinase pathway inhibition. Nature 504, 138–142 (2013). [DOI] [PMC free article] [PubMed] [Google Scholar]
- 24.Pan D et al. A major chromatin regulator determines resistance of tumor cells to T cell–mediated killing. Science 359, 770–775 (2018). [DOI] [PMC free article] [PubMed] [Google Scholar]
- 25.Yu Q et al. Requirement for CDK4 kinase function in breast cancer. Cancer Cell 9, 23–32 (2006). [DOI] [PubMed] [Google Scholar]
- 26.Boland CR, Richard Boland C & Goel A Microsatellite Instability in Colorectal Cancer. Gastroenterology 138, 2073–2087.e3 (2010). [DOI] [PMC free article] [PubMed] [Google Scholar]
- 27.Bailey MH et al. Comprehensive Characterization of Cancer Driver Genes and Mutations. Cell 174, 1034–1035 (2018). [DOI] [PMC free article] [PubMed] [Google Scholar]
- 28.Alliston T et al. Repression of bone morphogenetic protein and activin-inducible transcription by Evi-1. J. Biol. Chem 280, 24227–24237 (2005). [DOI] [PubMed] [Google Scholar]
- 29.Buonamici S et al. EVI1 abrogates interferon-alpha response by selectively blocking PML induction. J. Biol. Chem 280, 428–436 (2005). [DOI] [PubMed] [Google Scholar]
- 30.Lee JJ et al. Targeted next-generation sequencing reveals high frequency of mutations in epigenetic regulators across treatment-naïve patient melanomas. Clin. Epigenetics 7, 59 (2015). [DOI] [PMC free article] [PubMed] [Google Scholar]
- 31.Menzies AM et al. Distinguishing clinicopathologic features of patients with V600E and V600K BRAF-mutant metastatic melanoma. Clin. Cancer Res 18, 3242–3249 (2012). [DOI] [PubMed] [Google Scholar]
- 32.Flaherty K et al. Genomic analysis and 3-y efficacy and safety update of COMBI-d: A phase 3 study of dabrafenib (D) + trametinib (T) vs D monotherapy in patients (pts) with unresectable or metastatic BRAF V600E/K-mutant cutaneous melanoma. J. Clin. Orthod 34, 9502–9502 (2016). [Google Scholar]
- 33.Long GV et al. Dabrafenib plus trametinib versus dabrafenib monotherapy in patients with metastatic BRAF V600E/K-mutant melanoma: long-term survival and safety analysis of a phase 3 study. Ann. Oncol 28, 1631–1639 (2017). [DOI] [PMC free article] [PubMed] [Google Scholar]
- 34.Kadoch C & Crabtree GR Mammalian SWI/SNF chromatin remodeling complexes and cancer: Mechanistic insights gained from human genomics. Sci Adv 1, e1500447 (2015). [DOI] [PMC free article] [PubMed] [Google Scholar]
- 35.Miao D et al. Genomic correlates of response to immune checkpoint therapies in clear cell renal cell carcinoma. Science 359, 801–806 (2018). [DOI] [PMC free article] [PubMed] [Google Scholar]
- 36.Arafeh R et al. Recurrent inactivating RASA2 mutations in melanoma. Nat. Genet 47, 1408–1410 (2015). [DOI] [PMC free article] [PubMed] [Google Scholar]
- 37.van der Weyden L & Adams DJ The Ras-association domain family (RASSF) members and their role in human tumourigenesis. Biochim. Biophys. Acta 1776, 58–85 (2007). [DOI] [PMC free article] [PubMed] [Google Scholar]
- 38.Akino K et al. The Ras effector RASSF2 is a novel tumor-suppressor gene in human colorectal cancer. Gastroenterology 129, 156–169 (2005). [DOI] [PubMed] [Google Scholar]
- 39.Endoh M et al. RASSF2, a potential tumour suppressor, is silenced by CpG island hypermethylation in gastric cancer. Br. J. Cancer 93, 1395–1399 (2005). [DOI] [PMC free article] [PubMed] [Google Scholar]
- 40.Curtin JA, Busam K, Pinkel D & Bastian BC Somatic activation of KIT in distinct subtypes of melanoma. J. Clin. Oncol 24, 4340–4346 (2006). [DOI] [PubMed] [Google Scholar]
- 41.Robertson AG et al. Integrative Analysis Identifies Four Molecular and Clinical Subsets in Uveal Melanoma. Cancer Cell 32, 204–220.e15 (2017). [DOI] [PMC free article] [PubMed] [Google Scholar]
- 42.Newell F et al. Whole-genome landscape of mucosal melanomas reveals diverse drivers and therapeutic targets. Nat. Commun 10, 3163 (2019). [DOI] [PMC free article] [PubMed] [Google Scholar]
- 43.Mermel CH et al. GISTIC2.0 facilitates sensitive and confident localization of the targets of focal somatic copy-number alteration in human cancers. Genome Biol 12, R41 (2011). [DOI] [PMC free article] [PubMed] [Google Scholar]
- 44.Shen R & Seshan VE FACETS: allele-specific copy number and clonal heterogeneity analysis tool for high-throughput DNA sequencing. Nucleic Acids Res. 44, e131 (2016). [DOI] [PMC free article] [PubMed] [Google Scholar]
- 45.Gao Q et al. Driver Fusions and Their Implications in the Development and Treatment of Human Cancers. Cell Rep. 23, 227–238.e3 (2018). [DOI] [PMC free article] [PubMed] [Google Scholar]
- 46.Rosenthal R, McGranahan N, Herrero J, Taylor BS & Swanton C DeconstructSigs: delineating mutational processes in single tumors distinguishes DNA repair deficiencies and patterns of carcinoma evolution. Genome Biol. 17, 31 (2016). [DOI] [PMC free article] [PubMed] [Google Scholar]
- 47.Gehring JS, Fischer B, Lawrence M & Huber W SomaticSignatures: inferring mutational signatures from single-nucleotide variants. Bioinformatics 31, 3673–3675 (2015). [DOI] [PMC free article] [PubMed] [Google Scholar]
- 48.Greenman C et al. Patterns of somatic mutation in human cancer genomes. Nature 446, 153–158 (2007). [DOI] [PMC free article] [PubMed] [Google Scholar]
- 49.Alexandrov LB et al. Signatures of mutational processes in human cancer. Nature 500, 415–421 (2013). [DOI] [PMC free article] [PubMed] [Google Scholar]
- 50.Abkevich V et al. Patterns of genomic loss of heterozygosity predict homologous recombination repair defects in epithelial ovarian cancer. Br. J. Cancer 107, 1776–1782 (2012). [DOI] [PMC free article] [PubMed] [Google Scholar]
- 51.Timms KM et al. Association of BRCA1/2 defects with genomic scores predictive of DNA damage repair deficiency among breast cancer subtypes. Breast Cancer Res. 16, 475 (2014). [DOI] [PMC free article] [PubMed] [Google Scholar]
- 52.Birkbak NJ et al. Telomeric allelic imbalance indicates defective DNA repair and sensitivity to DNA-damaging agents. Cancer Discov. 2, 366–375 (2012). [DOI] [PMC free article] [PubMed] [Google Scholar]
- 53.Popova T et al. Ploidy and large-scale genomic instability consistently identify basal-like breast carcinomas with BRCA1/2 inactivation. Cancer Res. 72, 5454–5462 (2012). [DOI] [PubMed] [Google Scholar]
- 54.Marquard AM et al. Pan-cancer analysis of genomic scar signatures associated with homologous recombination deficiency suggests novel indications for existing cancer drugs. Biomark Res 3, 9 (2015). [DOI] [PMC free article] [PubMed] [Google Scholar]
- 55.Priestley P et al. Pan-cancer whole-genome analyses of metastatic solid tumours. Nature 575, 210–216 (2019). [DOI] [PMC free article] [PubMed] [Google Scholar]
- 56.Alexandrov A et al. The repertoire of mutational signatures in human cancer. Nature 578, 94–101 (2020). [DOI] [PMC free article] [PubMed] [Google Scholar]
- 57.Robinson MD, McCarthy DJ & Smyth GK edgeR: a Bioconductor package for differential expression analysis of digital gene expression data. Bioinformatics 26, 139–140 (2010). [DOI] [PMC free article] [PubMed] [Google Scholar]
- 58.McCarthy DJ, Chen Y & Smyth GK Differential expression analysis of multifactor RNA-Seq experiments with respect to biological variation. Nucleic Acids Res. 40, 4288–4297 (2012). [DOI] [PMC free article] [PubMed] [Google Scholar]
- 59.Love MI, Huber W & Anders S Moderated estimation of fold change and dispersion for RNA-seq data with DESeq2. Genome Biol. 15, 550 (2014). [DOI] [PMC free article] [PubMed] [Google Scholar]
- 60.Polak P et al. A mutational signature reveals alterations underlying deficient homologous recombination repair in breast cancer. Nat. Genet 49, 1476–1486 (2017). [DOI] [PMC free article] [PubMed] [Google Scholar]
- 61.Jaffe AE et al. Bump hunting to identify differentially methylated regions in epigenetic epidemiology studies. Int. J. Epidemiol 41, 200–209 (2012). [DOI] [PMC free article] [PubMed] [Google Scholar]
- 62.Aryee MJ et al. Minfi: a flexible and comprehensive Bioconductor package for the analysis of Infinium DNA methylation microarrays. Bioinformatics 30, 1363–1369 (2014). [DOI] [PMC free article] [PubMed] [Google Scholar]
- 63.Tsukuda T et al. INO80-dependent chromatin remodeling regulates early and late stages of mitotic homologous recombination. DNA Repair 8, 360–369 (2009). [DOI] [PubMed] [Google Scholar]
- 64.Lademann CA, Renkawitz J, Pfander B & Jentsch S The INO80 Complex Removes H2A.Z to Promote Presynaptic Filament Formation during Homologous Recombination. Cell Rep. 19, 1294–1303 (2017). [DOI] [PubMed] [Google Scholar]
- 65.Bakr A et al. Involvement of ATM in homologous recombination after end resection and RAD51 nucleofilament formation. Nucleic Acids Res. 43, 3154–3166 (2015). [DOI] [PMC free article] [PubMed] [Google Scholar]
- 66.Fenton AL, Shirodkar P, Macrae CJ, Meng L & Koch CA The PARP3- and ATM-dependent phosphorylation of APLF facilitates DNA double-strand break repair. Nucleic Acids Res. 41, 4080–4092 (2013). [DOI] [PMC free article] [PubMed] [Google Scholar]
- 67.Ceccaldi R, Rondinelli B & D’Andrea AD Repair Pathway Choices and Consequences at the Double-Stranded Break. Trends Cell Biol. 26, 52–64 (2016). [DOI] [PMC free article] [PubMed] [Google Scholar]
- 68.Balmus G et al. ATM orchestrates the DNA-damage response to counter toxic non-homologous end-joining at broken replication forks. Nat. Commun 10, 87 (2019). [DOI] [PMC free article] [PubMed] [Google Scholar]
- 69.Zhang J, Ma Z, Treszezamsky A & Powell SN MDC1 interacts with Rad51 and facilitates homologous recombination. Nat. Struct. Mol. Biol 12, 902–909 (2005). [DOI] [PubMed] [Google Scholar]
- 70.Scully R & Xie A Double strand break repair functions of histone H2AX. Mutat. Res 750, 5–14 (2013). [DOI] [PMC free article] [PubMed] [Google Scholar]
- 71.Nik-Zainal S et al. Landscape of somatic mutations in 560 breast cancer whole-genome sequences. Nature 534, 47–54 (2016). [DOI] [PMC free article] [PubMed] [Google Scholar]
- 72.Iles N, Rulten S, El-Khamisy SF & Caldecott KW APLF (C2orf13) is a novel human protein involved in the cellular response to chromosomal DNA strand breaks. Mol. Cell. Biol 27, 3793–3803 (2007). [DOI] [PMC free article] [PubMed] [Google Scholar]
- 73.Macrae CJ, McCulloch RD, Ylanko J, Durocher D & Koch CA APLF (C2orf13) facilitates nonhomologous end-joining and undergoes ATM-dependent hyperphosphorylation following ionizing radiation. DNA Repair 7, 292–302 (2008). [DOI] [PubMed] [Google Scholar]
- 74.Flaherty KT et al. Phase III trial of carboplatin and paclitaxel with or without sorafenib in metastatic melanoma. J. Clin. Oncol 31, 373–379 (2013). [DOI] [PMC free article] [PubMed] [Google Scholar]
- 75.Wilson MA et al. Correlation of somatic mutations and clinical outcome in melanoma patients treated with Carboplatin, Paclitaxel, and sorafenib. Clin. Cancer Res 20, 3328–3337 (2014). [DOI] [PMC free article] [PubMed] [Google Scholar]
- 76.Rafiei S et al. ATM Loss Confers Greater Sensitivity to ATR Inhibition than PARP Inhibition in Prostate Cancer. Clin. Cancer Res (2020). [DOI] [PMC free article] [PubMed] [Google Scholar]
METHODS ONLY REFERENCES
- 77.Van der Auwera GA et al. From FastQ data to high confidence variant calls: the Genome Analysis Toolkit best practices pipeline. Curr. Protoc. Bioinformatics 43, 11.10.1–33 (2013). [DOI] [PMC free article] [PubMed] [Google Scholar]
- 78.Cibulskis K et al. ContEst: estimating cross-contamination of human samples in next-generation sequencing data. Bioinformatics 27, 2601–2602 (2011). [DOI] [PMC free article] [PubMed] [Google Scholar]
- 79.Taylor-Weiner A et al. DeTiN: overcoming tumor-in-normal contamination. Nat. Methods 15, 531–534 (2018). [DOI] [PMC free article] [PubMed] [Google Scholar]
- 80.Cibulskis K et al. Sensitive detection of somatic point mutations in impure and heterogeneous cancer samples. Nat. Biotechnol 31, 213–219 (2013). [DOI] [PMC free article] [PubMed] [Google Scholar]
- 81.Costello M et al. Discovery and characterization of artifactual mutations in deep coverage targeted capture sequencing data due to oxidative DNA damage during sample preparation. Nucleic Acids Res. 41, e67 (2013). [DOI] [PMC free article] [PubMed] [Google Scholar]
- 82.Saunders CT et al. Strelka: accurate somatic small-variant calling from sequenced tumor-normal sample pairs. Bioinformatics 28, 1811–1817 (2012). [DOI] [PubMed] [Google Scholar]
- 83.McGranahan N et al. Clonal status of actionable driver events and the timing of mutational processes in cancer evolution. Sci. Transl. Med 7, 283ra54 (2015). [DOI] [PMC free article] [PubMed] [Google Scholar]
- 84.Tirosh I et al. Dissecting the multicellular ecosystem of metastatic melanoma by single-cell RNA-seq. Science 352, 189–196 (2016). [DOI] [PMC free article] [PubMed] [Google Scholar]
- 85.Conway JR, Lex A & Gehlenborg N UpSetR: an R package for the visualization of intersecting sets and their properties. Bioinformatics 33, 2938–2940 (2017). [DOI] [PMC free article] [PubMed] [Google Scholar]
- 86.Riaz N et al. Tumor and Microenvironment Evolution during Immunotherapy with Nivolumab. Cell 171, 934–949.e16 (2017). [DOI] [PMC free article] [PubMed] [Google Scholar]
- 87.Roh W et al. Integrated molecular analysis of tumor biopsies on sequential CTLA-4 and PD-1 blockade reveals markers of response and resistance. Sci. Transl. Med 9, (2017). [DOI] [PMC free article] [PubMed] [Google Scholar]
- 88.Hugo W et al. Genomic and Transcriptomic Features of Response to Anti-PD-1 Therapy in Metastatic Melanoma. Cell 165, 35–44 (2016). [DOI] [PMC free article] [PubMed] [Google Scholar]
- 89.Rodig SJ et al. MHC proteins confer differential sensitivity to CTLA-4 and PD-1 blockade in untreated metastatic melanoma. Sci. Transl. Med 10, eaar3342 (2018). [DOI] [PubMed] [Google Scholar]
- 90.Mills RE et al. Natural genetic variation caused by small insertions and deletions in the human genome. Genome Res. 21, 830–839 (2011). [DOI] [PMC free article] [PubMed] [Google Scholar]
- 91.Richards S et al. Standards and guidelines for the interpretation of sequence variants: a joint consensus recommendation of the American College of Medical Genetics and Genomics and the Association for Molecular Pathology. Genet. Med 17, 405–424 (2015). [DOI] [PMC free article] [PubMed] [Google Scholar]
- 92.Ignatiadis N, Klaus B, Zaugg JB & Huber W Data-driven hypothesis weighting increases detection power in genome-scale multiple testing. Nat. Methods 13, 577–580 (2016). [DOI] [PMC free article] [PubMed] [Google Scholar]
- 93.Newman AM et al. Robust enumeration of cell subsets from tissue expression profiles. Nat. Methods 12, 453–457 (2015). [DOI] [PMC free article] [PubMed] [Google Scholar]
- 94.Subramanian A et al. Gene set enrichment analysis: a knowledge-based approach for interpreting genome-wide expression profiles. Proc. Natl. Acad. Sci. U. S. A 102, 15545–15550 (2005). [DOI] [PMC free article] [PubMed] [Google Scholar]
- 95.Liberzon A et al. Molecular signatures database (MSigDB) 3.0. Bioinformatics 27, 1739–1740 (2011). [DOI] [PMC free article] [PubMed] [Google Scholar]
- 96.Rauen KA The RASopathies. Annu. Rev. Genomics Hum. Genet 14, 355–369 (2013). [DOI] [PMC free article] [PubMed] [Google Scholar]
- 97.Kamburov A et al. ConsensusPathDB: toward a more complete picture of cell biology. Nucleic Acids Res. 39, 712–717 (2011). [DOI] [PMC free article] [PubMed] [Google Scholar]
Associated Data
This section collects any data citations, data availability statements, or supplementary materials included in this article.


