Abstract
Venetoclax with azacitidine (ven/aza) has emerged as a promising regimen for acute myeloid leukemia (AML), with a high percentage of clinical remissions in newly diagnosed patients. However, approximately 30% of newly diagnosed and the majority of relapsed patients do not achieve remission with ven/aza. We previously reported that ven/aza efficacy is based on eradication of AML stem cells through a mechanism involving inhibition of amino acid metabolism, a process which is required in primitive AML cells to drive oxidative phosphorylation. Herein we demonstrate that resistance to ven/aza occurs via up-regulation of fatty acid oxidation (FAO), which occurs due to RAS pathway mutations, or as a compensatory adaptation in relapsed disease. Utilization of FAO obviates the need for amino acid metabolism, thereby rendering ven/aza ineffective. Pharmacological inhibition of FAO restores sensitivity to ven/aza in drug resistant AML cells. We propose inhibition of FAO as a therapeutic strategy to address ven/aza resistance.
Introduction
Outcomes for patients with acute myeloid leukemia (AML) has historically been poor, and despite extensive efforts, the development of improved therapies has proven difficult. In particular, therapeutically relevant targeting of disease-initiating leukemia stem cells (LSCs)1 has been a significant challenge. Notably though, the BCL2 inhibitor venetoclax was recently approved with a low-intensity chemotherapy backbone for newly diagnosed older AML patients based on high response rates and durable remissions2. We showed that patients treated with venetoclax and the hypomethylating agent azacitidine had significant decreases in the LSC population through a perturbation of LSC energy metabolism3,4. Specifically, ven/aza kills LSCs by decreasing amino acid uptake in this cell population, resulting in decreased amino acid catabolism and a resultant decrease in oxidative phosphorylation (OXPHOS) in LSCs3. LSCs are uniquely dependent on OXPHOS5,6, and disruption of this process selectively targets the LSC population3,7–10.
Despite promising outcomes with ven/aza in newly diagnosed AML4,11,12, subsets of patients are refractory to ven/aza and others relapse after responding. Therefore, characterizing and targeting the mechanisms that drive ven/aza resistance is important for improvement of AML therapy. Several characteristics of ven/aza resistance in AML have been recently described including previous exposure to chemotherapy3,13, mutations in TP5314, changes in mitochondrial structure15, elevated expression of S100A8 and S100A916, differentiation status17,18, and nicotinamide metabolism19. However, a conserved mechanism of resistance that can be targeted in ven/aza resistant AML patients has yet to be identified.
The objective of our current study was to identify the underlying mechanism that mediates ven/aza resistance in LSCs, and to develop methods to therapeutically exploit such features. Specifically, using primary human LSCs we sought to determine: 1) what pathways are enriched in ven/aza resistant LSCs, 2) if these pathways could be used to identify AML patients likely to be resistant to ven/aza, and 3) if targeting these enriched pathways could re-sensitize resistant LSCs to ven/aza.
Results
Prior therapy and RAS mutations correlate with ven/aza resistance in AML patients
We retrospectively evaluated 136 consecutive AML patients treated at the University of Colorado with ven/aza between January 2015 and October 2019. Of the variables evaluated as potential predictors of response, the receipt of prior therapy (p=0.0036), the presence of the PTPN11 mutation (p=0.0348) and the presence of any RAS pathway gene mutation (PTPN11, KRAS, NRAS) (p=0.0205) were the only significant variables (extended data Table 1). These factors also predicted shorter progression free and overall survival (Figure 1A–B).
Figure 1: Patients with mutations in RAS pathway genes or prior therapy for AML are more resistant to ven/aza and exhibit altered energy metabolism in the LSC compartment.
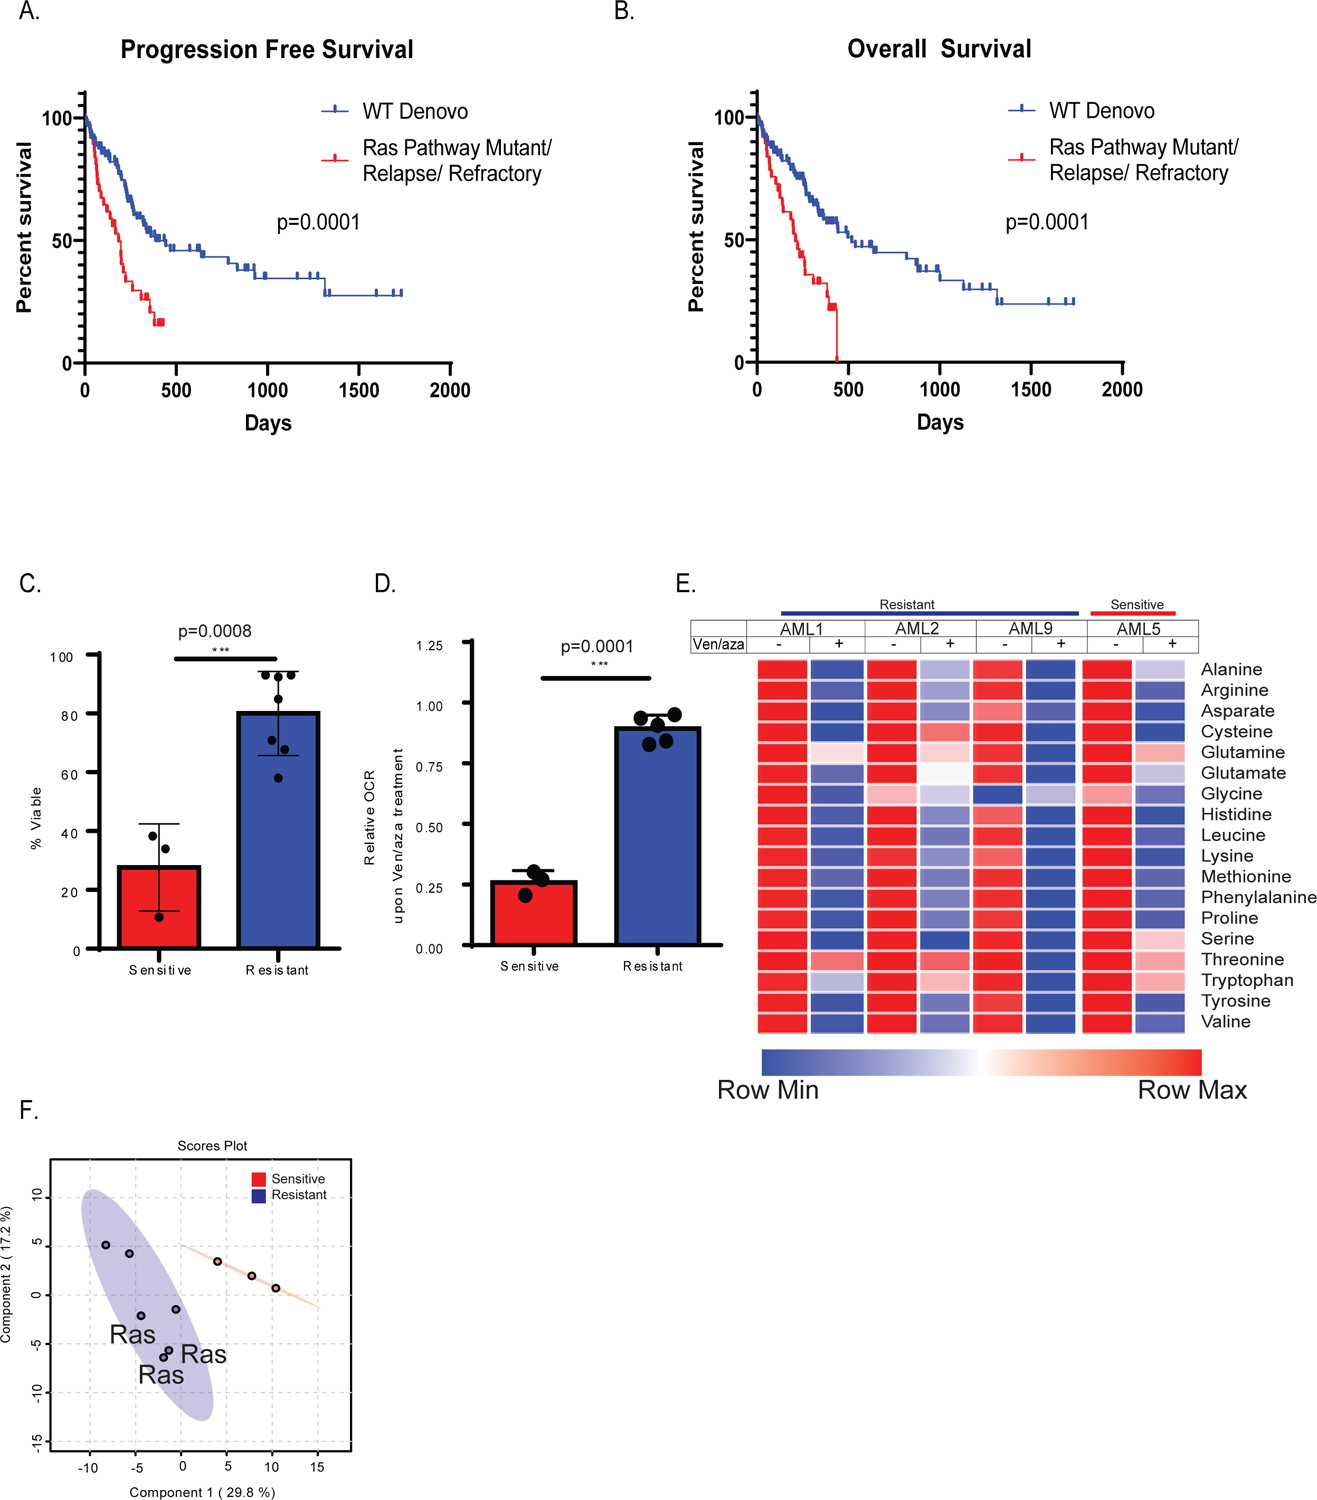
Progression free survival (A) and overall survival (B) of newly diagnosed AML patients who are wild type (WT) for RAS pathway mutations (blue line) in comparison to newly diagnosed AML patients bearing RAS pathway mutant patients (RAS/PTPN mutant) or are relapsed AML patietns (red line). RAS pathway mutations and refractory/relapse patients show significantly shorter survival than wild type de novo patients. N= 38 mutant or relapse and 98 WT patients. Log-rank (Mantel Cox) test p=0.0001 (A) and p=0.0002 (B). C. AML LSCs from RAS pathway mutant specimens or prior therapy patient specimens (combined and termed resistant) exhibit significantly less sensitivity to ven/aza (sensitive = 3 newly diagnosed AML specimens, and resistant = 7 RAS pathway or relapsed/refractory specimens. Data are presented as mean values +/− SD. Significance was measured by unpaired two-tailed Student’s t-test for N=3 sensitive versus N=3 RAS or N=4 relapsed (combined and termed resistant for N=7) biological replicates compared across the mean of three technical replicates of each independent sample. D. Resistant LSCs do not decrease oxygen consumption rate with addition of ven/aza in contrast to sensitive LSCs. Data are presented as mean values +/− SD. Significance was measured by unpaired two-tailed Student’s t-test for N=3 sensitive versus N=2 RAS or N=3 relapsed (combined and termed resistant for N=5) compared across the mean of five technical replicates of each independent specimen. E. Resistant and sensitive LSCs exhibit inhibition of amino acid uptake upon ven/aza treatment as measured by stable isotope labelled amino acids (please see Jones et al, Cancer Cell 2018 for additional examples of amino acid reduction upon ven/aza treatment). N=1 sensitive versus N=3 resistant independent patient specimens compared across the median of four technical replicates of each independent sample. F. Global LC/MS metabolite analysis reveals differences in resistant vs sensitive LSCs as shown in partial least squares (PLS) plot N= 3 sensitive specimens and 6 resistant specimens each with four technical replicates. Specimens bearing RAS pathway mutations are indicated).
Ven/aza resistant LSCs have higher levels of fatty acid metabolism
We next sought to determine if ven/aza resistance observed in AML patients could be modelled in vitro. In particular, we sought to evaluate characteristics of the most primitive AML cell populations. To enrich for functionally-defined LSCs, we employed labeling of specimens with CellROX™, a fluorescent dye that measure cellular reactive oxygen species (ROS). We have previously shown that relatively low ROS levels enrich LSCs in both de novo and R/R AML patient specimens5,20. Thus, for the purposes of this study, LSCs are defined as primary AML cells isolated by virtue of a ROS-low phenotype and lack of phenotypic characteristics found on normal lymphocytes.
Since ven/aza activity is based on inhibition of OXPHOS3,4, we hypothesized that resistant cells would not show OXPHOS inhibition upon drug treatment. As shown in Figure 1, comparison of LSCs from specimens showing differential ven/aza responsiveness demonstrates a direct correlation between viability (figure 1C) and OXPHOS inhibition (figure 1D). All of the resistant specimens were derived from newly diagnosed patients with RAS pathway mutations or were refractory or relapsed following exposure to conventional chemotherapy. As shown in extended data Figure 2B, the presence of a PTPN11 mutation led to resistance to ven and ven/aza in vitro, corroborating the results in figure 1C. To further investigate the influence of RAS pathway mutations on metabolism, we used lentiviral gene transfer to transduce a primary AML specimen with PTPN11 E76A, a common PTPN11 mutation found in multiple resistant patients from our cohort. Expression of PTPN11 E76A led to increased levels of basal respiration and glycolysis (extended data figure 2C). In addition, ven/aza treatment of PTPN11 mutant cells failed to suppress OCR (extended data figure 2D) in agreement with the results in figure 1D.
Figure 2: Fatty acid metabolism is upregulated in resistant LSCs.
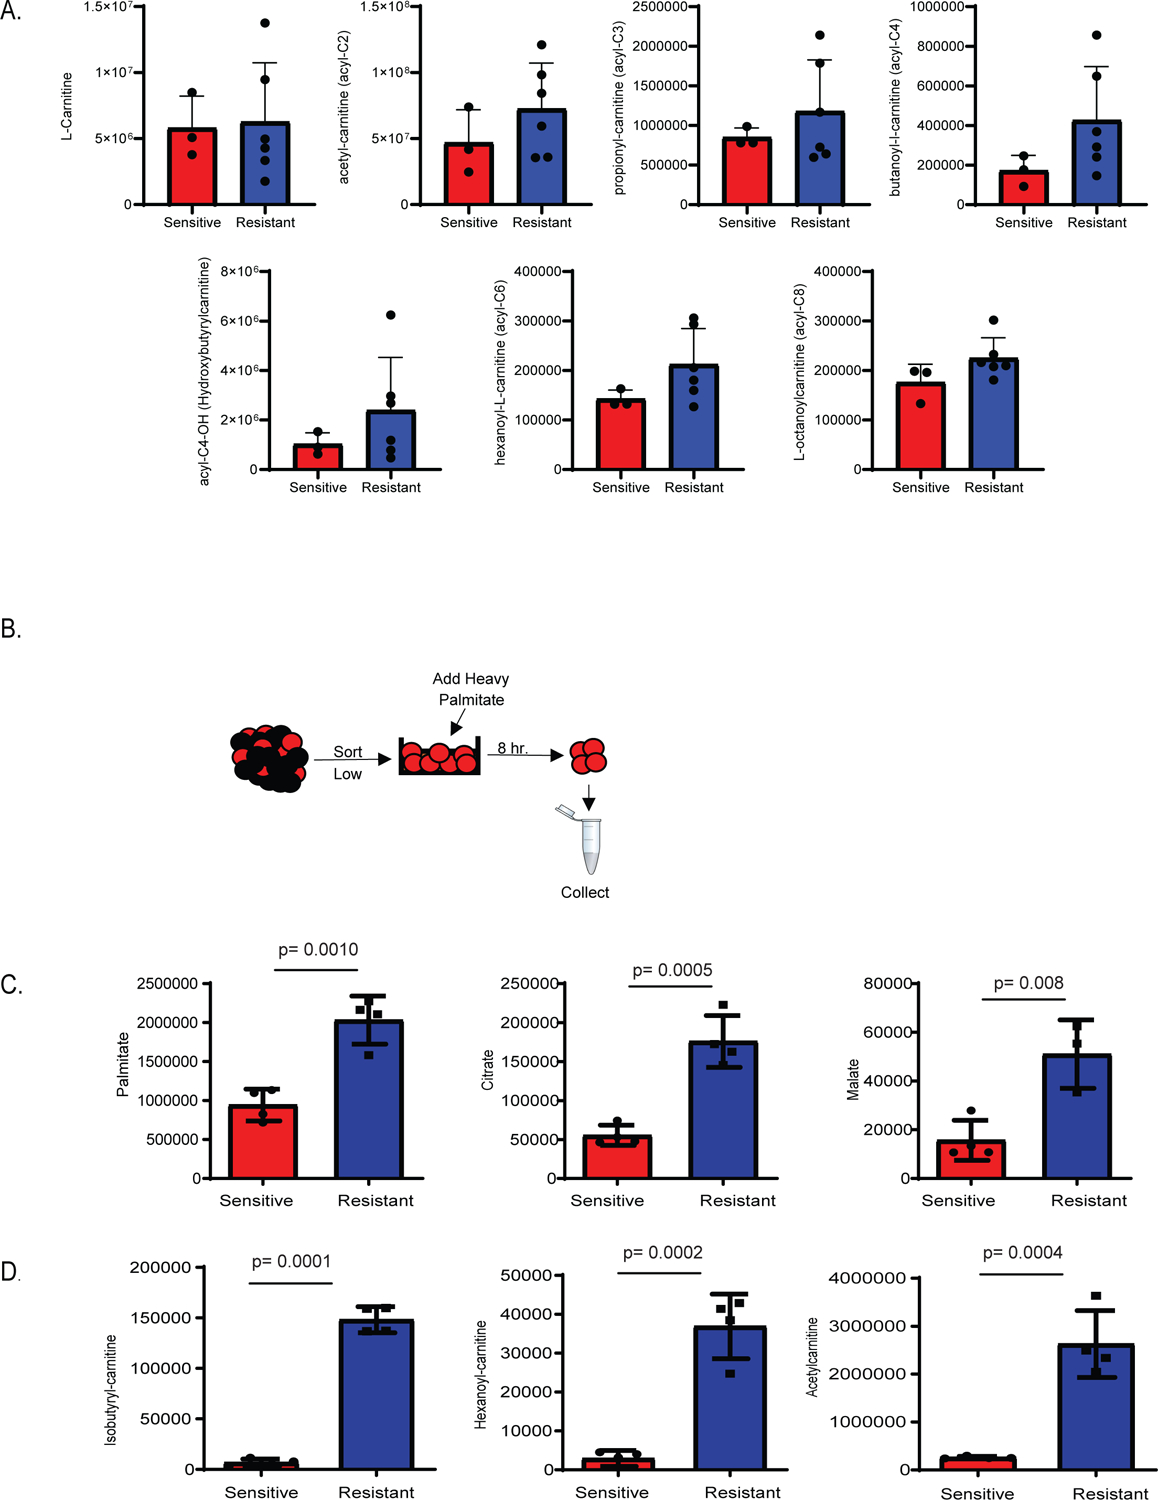
A. Steady state levels of metabolites involved in fatty acid transport are upregulated in resistant LSCs. N= 3 sensitive specimens and 6 resistant specimens with 3 of the resistant specimens being RAS pathway mutants and other 3 WT refractory. Data are presented as median values. B. Schematic representation of stable isotope labelled palmitate flux experiment performed on LSCs. C and D. Resistant LSCs exhibit increased palmitate contribution to TCA cycle intermediates and fatty acid transport metabolites (N= 4 sensitive specimens and 4resistant specimens). Data are presented as median values +/− SD of four patient replicates. Significance was measured by unpaired two-tailed Student’s t-test.
Ven/aza inhibits OXPHOS in LSCs by decreasing amino acid uptake3; therefore, we sought to determine whether the ability to block amino acid uptake was lost in drug resistant LSCs. To examine this issue, LSCs from a sensitive AML specimen and three resistant AML specimens were treated with ven/aza for four hours, incubated with stable isotope labeled (SIL) amino acid for one hour, and intracellular SIL amino acids were measured by mass spectroscopy. As shown in Figure 1E, SIL amino acids were comparably decreased in both the sensitive and resistant LSCs. These data demonstrate that ven/aza treatment retains the ability to inhibit amino acid uptake in resistant LSCs; however, unlike ven/aza sensitive LSCs, this activity is not sufficient to decrease OXPHOS or induce LSC death.
The lack of OXPHOS change in the presence of decreased amino acid uptake suggests that resistant LSCs employ alternative mechanisms to drive energy metabolism. Consistent with this hypothesis, LSCs from sensitive vs resistant specimens demonstrate significant differences in baseline metabolites as measured by LC/MS spectrophotometry (Figure 1F and extended data Figure 1A). We note that 3 of the 6 resistant specimens shown in Figure 1F have ras pathway mutations, which we acknowledge may confer unique biology in comparison to non-ras resistant specimens. Nonetheless, all resistant specimens share increased fatty acid metabolism, so for the purposes of the present study we considered them as one group. To identify conserved metabolic changes that may contribute to drug resistance, a pathway analysis was performed on ven/aza sensitive versus resistant LSCs. This analysis revealed that the most upregulated pathways includes carnitine synthesis, fatty acid metabolism, fatty acid elongation in mitochondria, and beta oxidation of long chain fatty acids (extended data Figure 1B). Importantly, these findings are observed both in LSCs that have RAS mutations and LSCs that have been exposed to prior therapy. To further interrogate fatty acid metabolism in ven/aza resistance, we performed an unbiased lipidomics analysis21. Overall, no changes in global fatty acid levels were observed in ven/aza resistant LSCs compared to ven/aza sensitive LSCs (Extended data Figure 2A). Furthermore, closer examination of individual fatty acids shows heterogeneity of levels between resistant and sensitive LSCs with increased expression of poly-unsaturated fatty acids in resistant LSCs (Extended data figure 1C). However, metabolites involved in fatty acid transport into the mitochondria were increased in ven/aza resistant compared to ven/aza sensitive LSCs, including L-carnitine and five of the six detected acyl-carnitines (Figure 2A). These data suggest that increased levels of fatty acid transport may allow LSCs to compensate for loss of amino acid uptake upon ven/aza treatment, resulting in ven/aza resistance. Indeed, this is consistent with our previous studies that demonstrated that relapsed LSCs increased fatty acid oxidation upon amino acid depletion3. However, fatty acid transport into the mitochondria has not been previously described in ven/aza resistance.
To determine if ven/aza resistant LSCs exhibited increased fatty acid oxidation, we performed SIL palmitate analysis in sensitive versus resistant LSCs (Figure 2B–D). SIL palmitate levels were significantly increased and incorporated at significantly higher levels in multiple TCA metabolites including citrate and malate (Figure 2C). Further, SIL palmitate contributed to significantly higher levels of carnitines, including acetyl–carnitine, iso-butylryl carnitine, and hexanoyl-carnitine in ven/aza resistant LSCs (Figure 2D). Altogether, these data suggest fatty acid transport plays a distinct role in LSC resistance to ven/aza, and therefore may be a potential target to re-sensitize resistant LSCs to ven/aza treatment.
Inhibition of fatty acid metabolism re-sensitizes LSCs to ven/aza
Fatty acid metabolism within the mitochondria can be perturbed through multiple mechanisms. Of particular interest in the context of AML studies, the BH3 protein MCL-1 has been shown to interact with very long-chain acyl-CoA dehydrogenase (ACADVL) and regulate fatty acid metabolism22. Further, modulation of MCL-1 leads to decreases in oxidative phosphorylation23,24. Most importantly, our recent studies have demonstrated that MCL-1 inhibition can re-sensitize AML specimens to venetoclax18,25. We also saw altered levels of ACADVL in resistant LSCs (Extended data figure 7D). Therefore, we hypothesized that fatty acid metabolism may be targeted by inhibiting ACADVL or MCL1 in ven/aza resistant LSCs. To test this hypothesis, we first performed siRNA-mediated knock down of ACADVL in primary ven/aza resistant AML specimens and measured viability, colony forming potential, and OXPHOS with or without exposure to ven/aza. Knockdown of ACADVL (Extended data Figure 3) alone did not affect the viability or colony forming potential of primary AML specimens (Figure 3A–B). Further, as expected, ven/aza treatment alone had minimal effects on viability or colony forming potential (Figure 3A–B). However, knockdown of ACADVL in combination with ven/aza restored ven/aza sensitivity with respect to viability and colony forming potential. (Figure 3A–B). Since ven/aza targets LSCs by decreasing OXPHOS, we next measured OXPHOS upon knockdown of ACADVL in combination with or without a 4-hour treatment with ven/aza. Neither ACADVL knockdown nor ven/aza treatment alone significantly decreased OXPHOS; however, the combination decreased OXPHOS (Figure 3C). These data suggest that ACADVL loss restores ven/aza sensitivity by decreasing OXPHOS.
Figure 3: Fatty acid beta oxidation contributes to ven/aza resistance and MCL-1 inhibition decreases fatty acid metabolism.
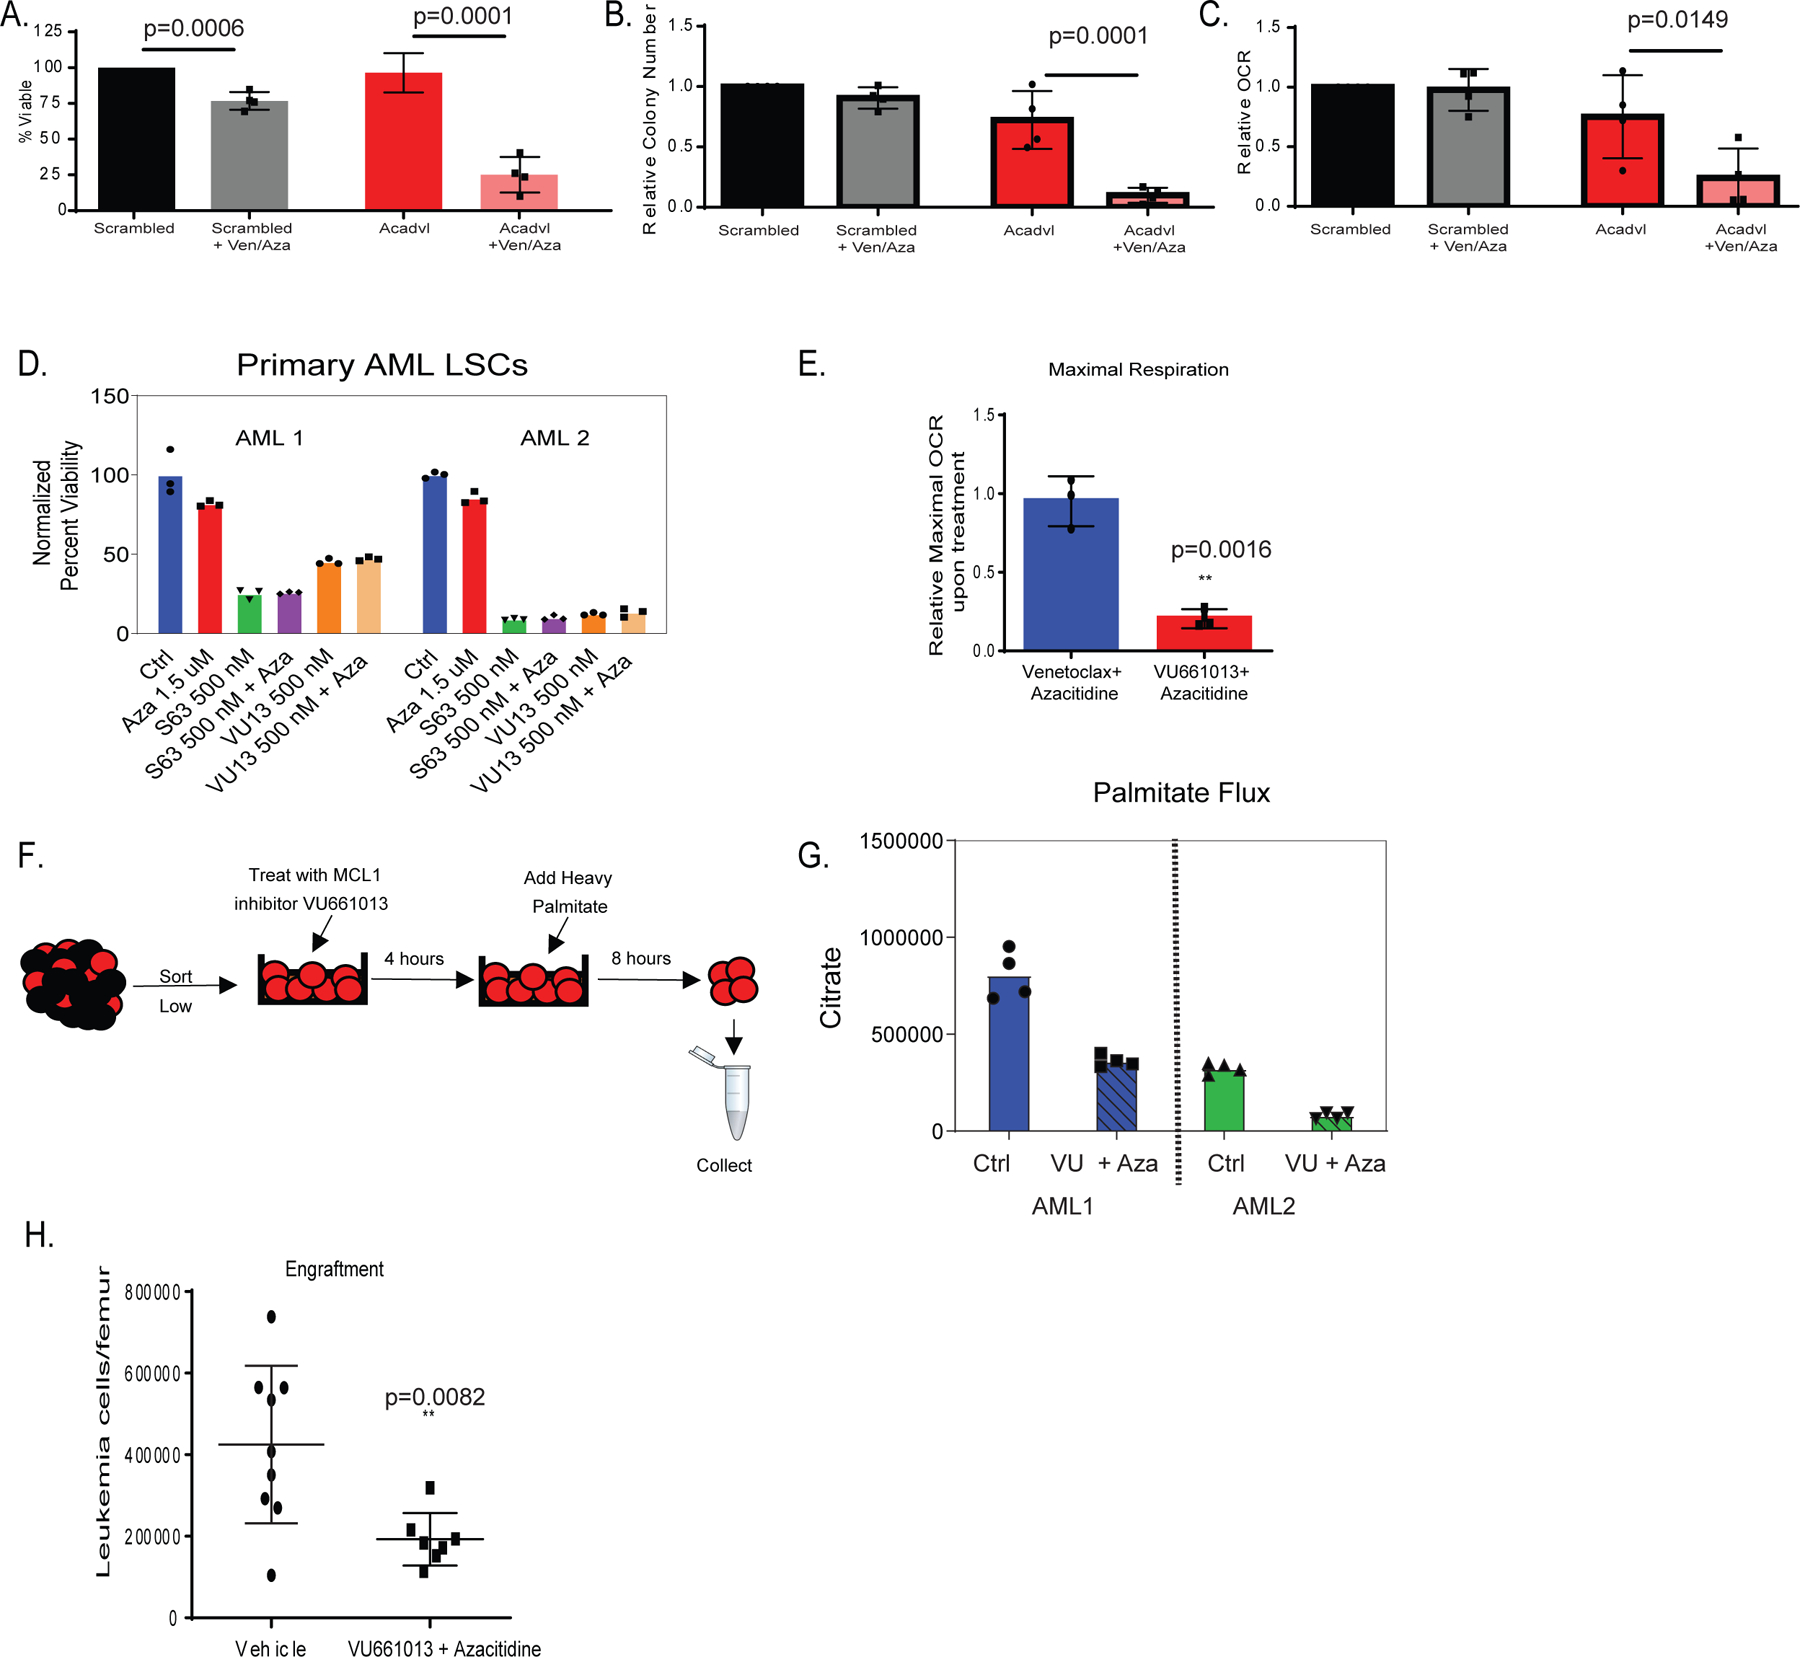
A-C. siRNA knock-down of very long-chain specific acyl-CoA dehydrogenase (ACADVL) in combination with ven/aza decreases viability of resistant LSCs (panel A), colony-forming ability (panel B), and oxygen consumption rate (OCR)(panel C). N= 4 resistant specimens with 3 RAS pathway mutants. Data are presented as mean values +/− SD. Significance was determined using 2-way Anova analysis. D. MCL-1 inhibitors, S63845 and VU661013, decrease viability of resistant LSCs alone and in combination with azacitidine. This experiment was performed in 2 AML specimens both of which were RAS pathway mutants. N=3 technical replicates are shown. Data are presented as mean values. E. MCL-1 inhibitor VU661013 and azacitidine but not ven/aza decreases OCR in resistant LSCs. N=3 individual patient specimens (all RAS pathway mutants) Data are presented as mean values +/− SD. Significance was measured by unpaired two-tailed Student’s t-test. F. Schematic representation of stable isotope labelled palmitate flux experiment performed on LSCs in presence of MCL-1 inhibitor VU661013 and azacitidine. G. Representative plot for palmitate flux into TCA cycle intermediates (citrate shown, others in extended data figure 3D) in resistant LSCs in the presence of MCL-1 inhibitor. Experiment repeated in 2 individual patient specimens, each with a RAS mutation, reproduced with four technical replicates. Data are presented as median values of four technical replicates. H. MCL-1 inhibitor VU660103 and azacitidine significantly decrease engraftment potential of resistant LSCs after transplantation into immune deficient mice. AML cells were incubated in presence of 500 nM VU660103 and 1.5 uM Azacitidine for 24 hours prior to transplant. Data are presented as mean values +/− SD. Significance was measured by unpaired two-tailed Student’s t-test N= 9 independent animals in vehicle and N= 8 independent animals in VU treated for 1 independent patient derived xenograft.
Based on the findings with ACADVL, we also investigated inhibition of MCL-1 as a strategy to decrease OXPHOS and abrogate fatty acid metabolism in ven/aza resistant LSCs. Inhibition of MCL-1 using small molecule VU66101325 or a second MCL-1 inhibitor S63845 26decreased viability and OXPHOS alone and in combination with azacitidine (Figure 3D–E) in ven/aza resistant LSCs. These data corroborate our previous findings18. We next determined if MCL-1 inhibition decreased OXPHOS by changing fatty acid metabolism. First, we measured steady-state metabolite levels upon treatment with VU661013 + azacitidine (VU/aza). Carnitines and amino acids were significantly decreased upon MCL-1 inhibition (Extended data Figure 3E). Additionally, levels of TCA cycle intermediates including citrate, malate, alpha-ketoglutarate, and 2-hydroxyglutarate were significantly decreased upon MCL-1 inhibition (Extended data figure 3D). These changes are specific to resistant LSCs. Measurement of metabolites in sensitive LSCs treated with VU661013 and Aza showed no decrease in these TCA metabolites or changes in carnitines (Extended data figure 3D). Furthermore, the addition of Ven to VU/aza only slighted decreased TCA cycle metabolites suggesting that ven is not required for the OXPHOS effects of VU/aza (Extended data figure 6B). Interestingly, the use of siRNA to knock down ACADVL in the presence of VU/aza did not significantly modify effects on viability or OCR observed with either siRNA or drug treatment alone (Extended data figure 3B–C).
To further interrogate fatty acid metabolism upon MCL-1 inhibition we measured flux of palmitate. SIL palmitate experiments demonstrated that MCL-1 inhibition resulted in decreased palmitate incorporation into TCA cycle intermediates (Figure 3F–G and Extended data figure 4C). The metabolites found to incorporate less palmitate post drug addition, matched the metabolites found to be upregulated in resistant LSCs (Figure 2). These data indicate that ACADVL and its role in fatty acid metabolism can be targeted through MCL-1 inhibition.
To investigate the biological consequences of FAO inhibition, the MCL-1 inhibitor VU66101325 was tested alone and in combination with azacitidine. Surprisingly, single agent treatment with VU661013 was able to decrease viability of ven/aza resistant LSCs (Figure 3D). These data are unexpected, as knockdown of ACADVL only killed LSCs in combination with ven/aza; therefore, we had anticipated that MCL-1 inhibition should only target LSCs in combination with venetoclax. Since ven/aza decreases amino acid levels, we determined if MCL-1 inhibition could also decrease amino acid levels in LSCs. As shown in extended data Figure 4A, treatment with VU661013 + Aza reduced global amino acid levels slightly. Further, amino acid flux into the TCA cycle was decreased upon MCL-1 inhibition (Extended data Figure 4D). Overall, these data suggest that MCL-1 inhibition targets LSCs by decreasing both fatty acid and amino acid metabolism. To functionally assess effects on the LSC population, we treated ven/aza resistant specimens with VU661013 and engrafted them into immune deficient mice. The data demonstrate MCL-1 inhibition significantly decreases engraftment of primary AML specimens (Figure 3H and Extended data Figure 4E), suggesting that MCL-1 mediates energy metabolism processes in ven/aza resistant LSCs.
We next sought to determine if inhibition of fatty acid transport into LSCs or into the mitochondria of LSCs could decrease OXPHOS, and therefore kill ven/aza resistant LSCs. Fatty acid transporter CD36, and fatty acid mitochondrial transporters CPT1A and CPT1C were knocked down in primary ven/aza resistant AML specimens using siRNAs. Knockdown of CD36, CPT1A and CPT1C (Extended data Figure 5D) alone did not affect the viability or colony forming potential of primary AML specimens (Figure 4A–B). Further, as expected, ven/aza treatment alone had minimal effects on viability or colony forming potential. However, knockdown of CD36, CPT1A, or CPT1C in combination with ven/aza restored ven/aza sensitivity (Figure 4A–B). Since ven/aza targets sensitive LSCs by decreasing OXPHOS we measured OXPHOS upon knockdown of CD36, CPT1A, or CPT1C in combination with or without a 4-hour treatment with ven/aza. Neither knockdown nor ven/aza treatment alone significantly decreased OXPHOS for any condition; however, the combination of knock-down with ven/aza decreased OXPHOS for all three pathways (Figure 4C). Interestingly, there was no significant compensation between the two isoforms of CPT1, and knockdown of CPT1A and CPT1C together did not increase killing of resistant LSCs in the presence of ven/aza (extended data figure 5D). These data indicate that fatty acid transporter loss restores ven/aza sensitivity by decreasing OXPHOS.
Figure 4: Fatty acid transport genes mediate ven/aza resistance of LSCs.
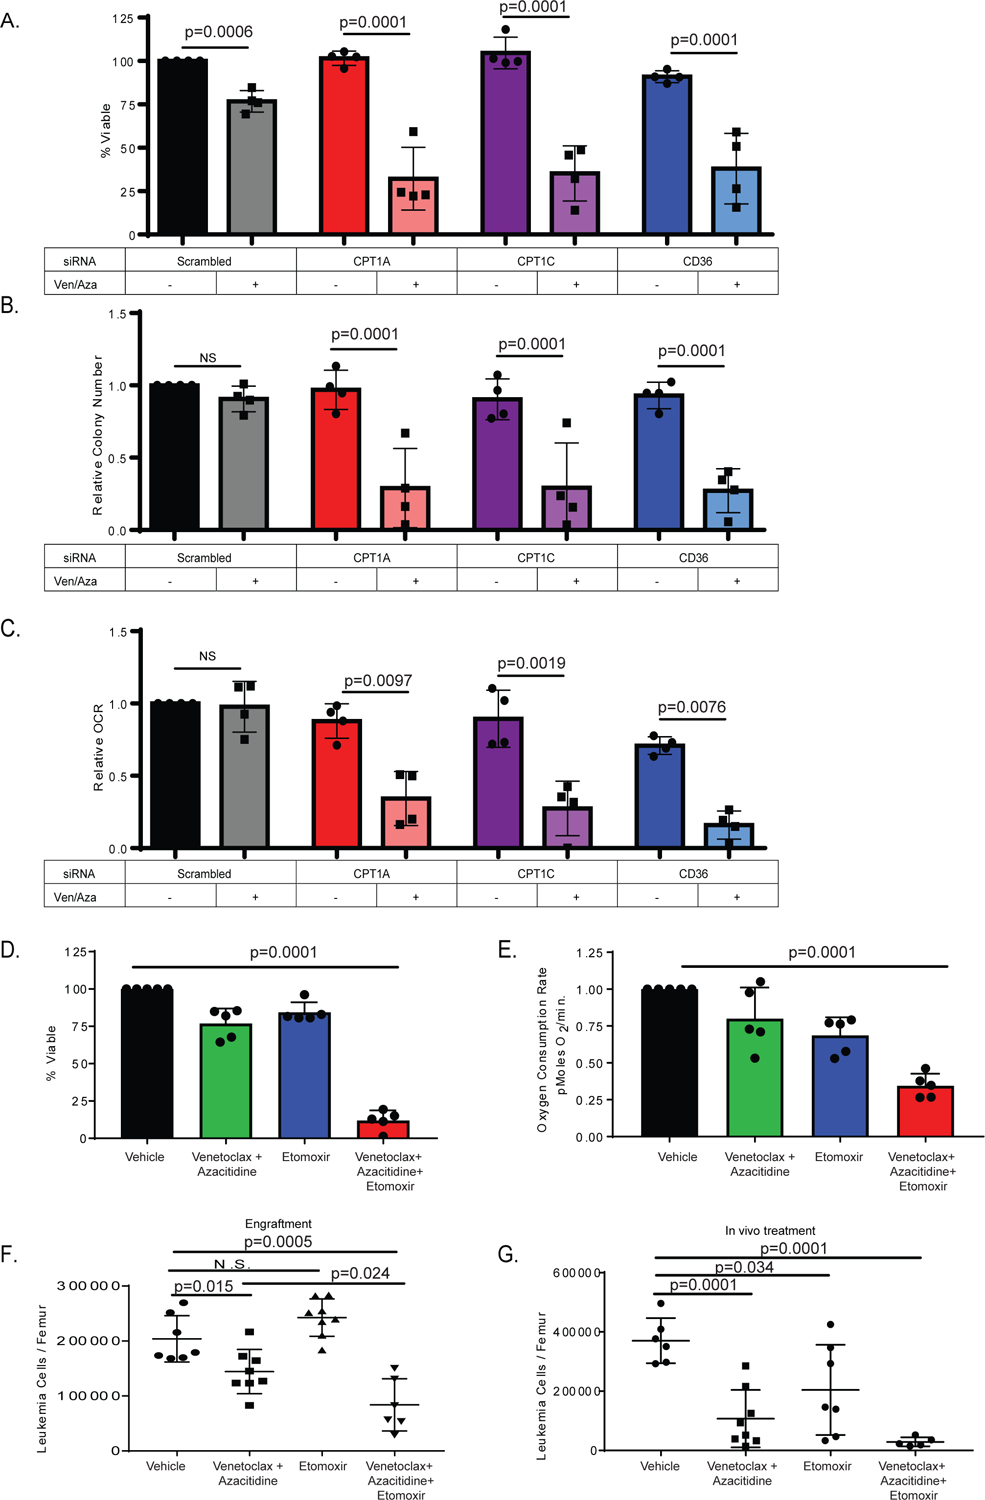
A. siRNA knock-down of Cpt1A, Cpt1C, and CD36 in combination with ven/aza decreases viability of resistant LSCs. N= 4 resistant primary AML specimens (2 RAS pathway mutants). Data are presented as mean values +/− SD. Significance was measured by unpaired two-tailed Student’s t-test. [B]. colony-formation assays and [C] oxygen consumption rates for the same specimens and conditions shown in panel. Data are presented as mean values +/− SD. Significance was determined using 2-way Anova analysis. D. Etomoxir in combination with ven/aza decreases viability of resistant LSCs. N= 5 resistant specimens (1 RAS pathway mutant). Data are presented as mean values +/− SD. Significance was measured by unpaired two-tailed Student’s t-. E. Etomoxir in combination with ven/aza decreases OCR of resistant LSCs. N= 5 resistant specimens (1 RAS pathway mutant). Data are presented as mean values +/− SD. Significance was measured by unpaired two-tailed Student’s t-test. F. A ven/aza resistant LSC specimen was treated ex vivo for 24 hours with the indicated conditions and transplanted into immune deficient NSG-S mice. Cells were dosed with 50 uM Etomoxir, 500 nM Venetoclax, and 2.5 uM Azacitidine in the combinations indicated. At 6 weeks post-transplant, the levels of human leukemia cells in the bone marrow was determined (N = 7 mice in vehicle group, N = 8 mice in the venetoclax with azacitidine group, N = 8 mice in the etomoxir group, and N = 6 in the venetoclax + azacitidine + etomoxir group. Data are presented as mean values +/− SD. Significance was measured by unpaired two-tailed Student’s t-test. G. In vivo treatment with etomoxir in combination with ven/aza significantly decreased tumor burden in patient derived xenograft. (N = 6 mice in vehicle group, N = 8 mice in the venetoclax with azacitidine group, N = 7 mice in the etomoxir group, and N = 5 in the venetoclax + azacitidine + etomoxir group. Data are presented as mean values +/− SD. Significance was measured by unpaired two-tailed Student’s t-test.
To assess the potential of pharmacologically inhibiting fatty acid transport, we treated ven/aza resistant primary AML specimens with CPT1 inhibitor etomoxir +/− ven/aza and determined viability and OXPHOS levels. The combination of etomoxir with ven/aza reduced LSC viability (Figure 4D) and OXPHOS (Figure 4E). Further, etomoxir treatment reduced LSC viability (Extended data Figure 5E) and OXPHOS (Extended data Figure 5F) in combination with amino acid depletion, suggesting that the key activity of ven/aza in this drug combination is decreasing amino acid levels. However, amino acid levels remain relatively unchanged with the combination of ven+aza and etomoxir over ven+aza alone (Extended data figure 6A). In line with OXPHOS decreases, measurement of TCA cycle metabolites in resistant LSCs showed significant decreases upon treatment with etomoxir + ven/aza compared to ven/aza alone (extended data figure 6B). Further, the decreased OXPHOS and viability could be accomplished with Ven + Etomoxir without the addition of azacytidine (Extended data figure 5 J–K). Notably, the effects of etomoxir with ven/aza could be reversed by co-treatment with octanoic acid, a medium chain fatty acid that does not require CPT1 for transport into the mitochondria suggesting that the effect of etomoxir is due to its inhibitory effects on CPT1. The addition of octanoic acid in the presence of ven/aza + etomoxir rescued the viability of resistant LSCs and rescued the decrease in OXPHOS (Extended data figure 5 G–H). In contrast, octanoic acid treatment alone did not have any effects of LSC viability post cytarabine treatment (Extended data Figure 5I), suggesting that the role of fatty acid oxidation is specifically related to ven/aza activity.
To measure the effects of etomoxir with ven/aza on functional LSCs, a primary ven/aza resistant AML specimen was treated ex vivo with etomoxir, ven/aza, or the combination for 24 hours and then transplanted into immune deficient mice. The combination treatment significantly reduced engraftment potential compared to ven/aza alone demonstrating that etomoxir restores the ability of ven/aza to targeting functionally-defined LSCs (Figure 4F). To model the therapeutic potential of etomoxir in combination with ven/aza, immune deficient mice were transplanted with a primary AML specimen. At 6–8 weeks after establishment of the graft, animals were treated for two weeks with etomoxir, ven/aza, or etomoxir + ven/aza. The combination therapy greatly decreased leukemic burden within the bone marrow, significantly better than either single therapy (Figure 4G). Furthermore, phenotypically defined LSCs (CD45+/CD34+/CD38-/CD123+) were significantly decreased in the triple drug combination group (Extended data figure 6E). To determine if etomoxir with ven/aza would affect normal HSPCs, mobilized peripheral blood specimens were treated with etomoxir, ven/aza or the combination and viability and colony forming potential was assessed. Neither the single agents nor the combination decreased viability or colony forming potential (Extended data Figure 6C–D) of normal HSPCs, suggesting a therapeutic window to target LSCs without harming normal HSPCs. Lastly, addition of these drugs in vivo had no significant effects on mouse weight or liver pathology (Extended data figure 6 F–G).
Prospective prediction of ven/aza resistance
Examination of the Beat AML data set, which evaluates bulk primary AML specimens, reveals a link between mutations in RAS pathway and fatty acid metabolism and oxidative phosphorylation gene sets (Figure 5A). Analysis of transcriptional profiles obtained from functionally-derived LSCs from relapse versus de novo patients, also shows enrichment in fatty acid metabolism gene sets27 (Figure 5B). Further, investigation of LSC samples from our previous studies 28 shows gene sets involved in fatty acid metabolism with increased expression at relapse (Extended data figure 7A–C). In addition, the expression of multiple genes including CD36 and CPT1a correlates with decreased survival of AML patients described in the TCGA data set (Figure 5C–D). Further, expression of CD36 and ACADVL at the transcript level is also higher in RAS mutant patients compared to wild-type (Extended data figure 7E). Increased CD36 at the protein level was also found in resistant LSCs (Extended data figure 7F). Together, these observations suggest that fatty acid metabolism plays a role in therapy resistance of LSCs and that such properties are evident prior to therapy.
Figure 5: Transcriptional analysis of fatty acid metabolism genes correlates with clinical resistance to ven/aza.
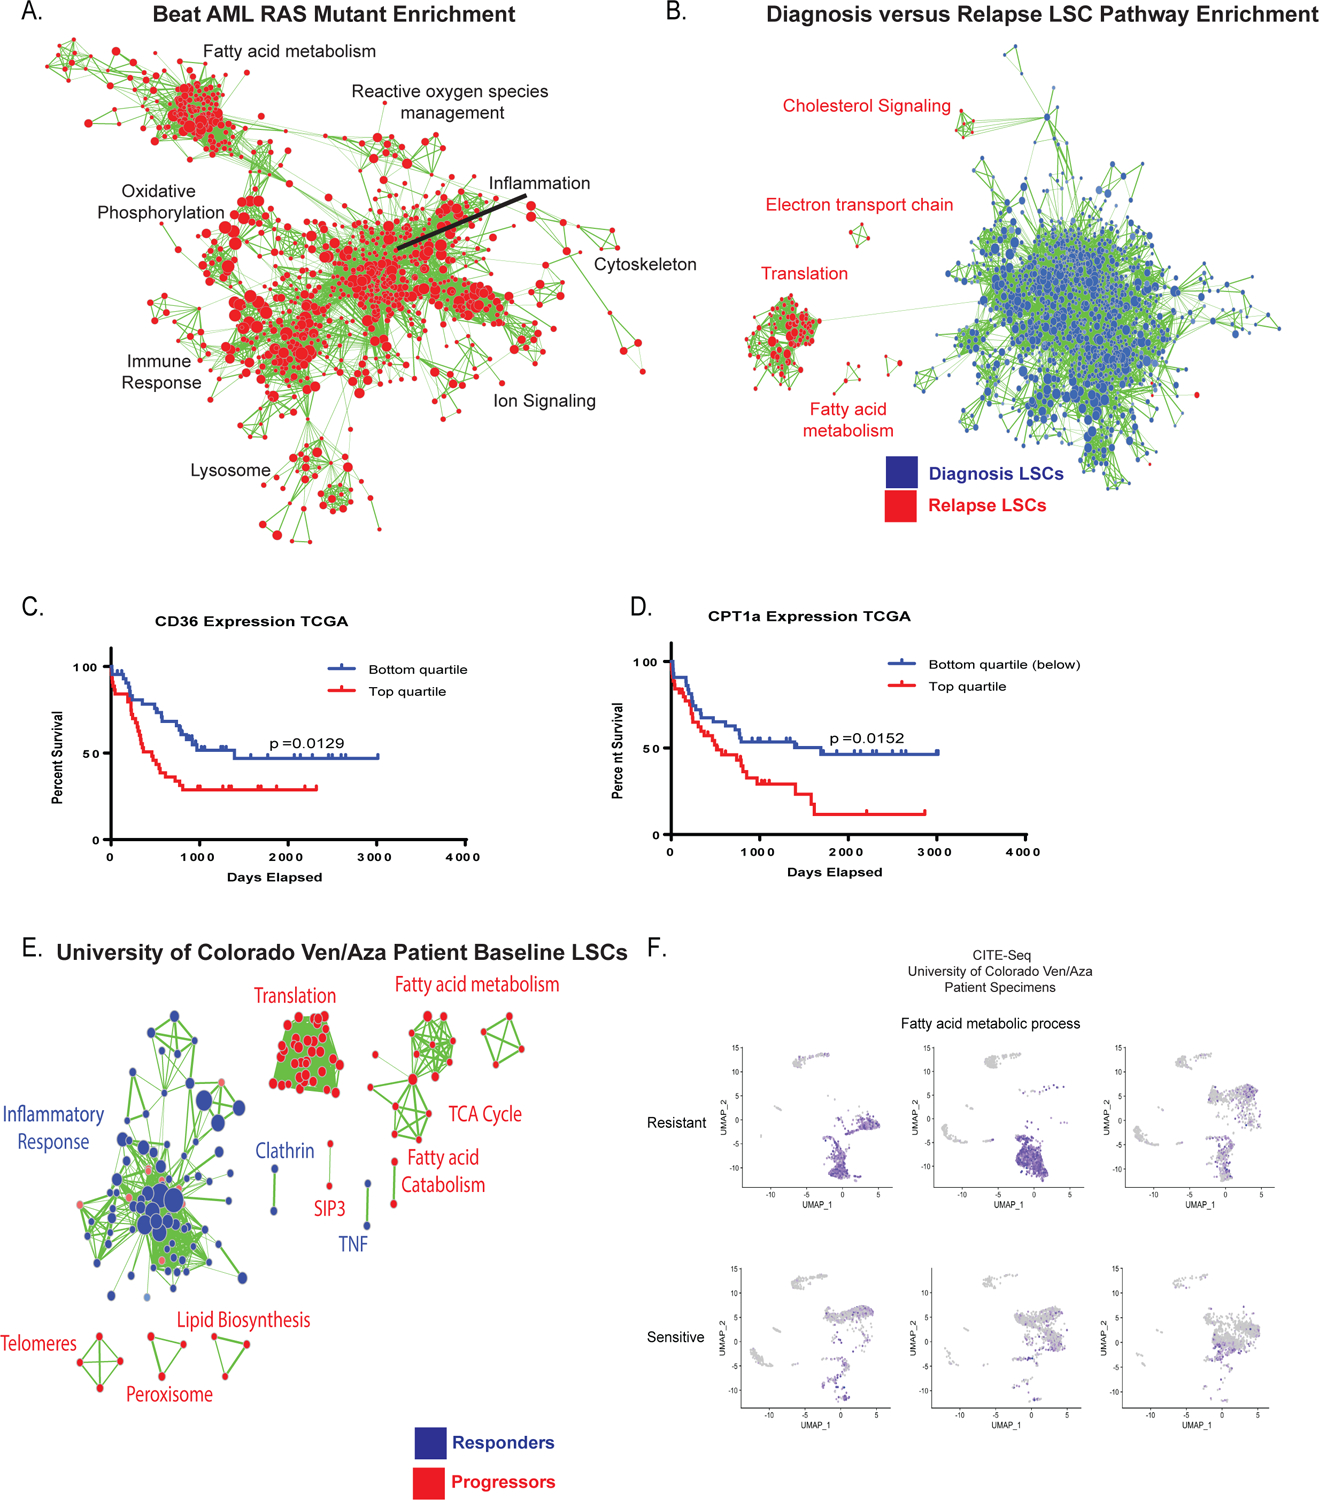
A. Transcriptional analysis of RAS pathway mutant specimens from Beat AML data shows enrichment of gene sets involved in fatty acid metabolism, oxidative phosphorylation, lysosome, and reactive oxygen species management (red colored nodes indicate genes/pathways upregulated in RAS pathway mutations). N= 451 total patients with 78 mutant patients and 373 WT patients. B. Transcriptional analysis of diagnosis and relapse paired specimen LSCs shows enrichment of gene sets involved in fatty acid metabolism and TCA cycle. N= 8 diagnosis LSC samples and N= 15 relapse samples C. Survival analysis of lowest and highest quartile expression of CD36 in the TCGA data set. Significance was measured with Log- Rank (Mantel-Cox) test. N= 45 patients in top and N=46 patients in bottom quartile. D. Survival analysis of lowest and highest quartile expression of CPT1a in TCGA data set. Significance was measured with Log- Rank (Mantel-Cox) test. N= 45 patients in top and N=46 patients in bottom quartile. E. Transcriptional analysis of baseline LSCs from patients undergoing ven/aza therapy shows enrichment of gene sets involved in fatty acid metabolism and TCA cycle in patients that progress on therapy versus long term responders N= 9 patients (6 responders/3 progressors). F. CITE-seq analysis of 3 ven/aza sensitive and 3 ven/aza resistant patients reveals significantly different transcriptional profiles with enrichment in fatty acid metabolism in non-responder patient cells.
Finally, to understand the role of fatty acid metabolism in response and progression of patients treated with ven/aza we performed transcriptomic analysis on LSCs isolated from pre-treatment baseline bone marrow specimens. Gene sets related to translation, TCA cycle, lipid biosynthesis, and fatty acid metabolism are increased in patients who progressed on ven/aza therapy (Figure 5E). Gene set enrichment further confirms this finding with increased enrichment scores for pathways involved in fatty acid metabolism (Extended data figure 7G). These data suggest that fatty acid metabolism can be transcriptionally profiled at initial diagnosis in order to predict an AML patient’s response to ven/aza.
To further investigate genes involved in fatty acid metabolism and ven/aza response at the single cell level, we performed Cellular Indexing of Transcriptomes and Epitopes by Sequencing (CITE-seq) on baseline samples of three patients who responded to ven/aza clinically and three patients who were refractory. The patients who were refractory showed enrichment for multiple genes involved in fatty acid metabolism including CD36 and gene sets involved in fatty acid metabolism (figure 5F and extended data figure 7H–I). Expression of CD36 at protein and transcript level is higher in ven/aza sensitive versus resistant patients and corresponds to the cells with the highest fatty acid metabolism gene set expression (figure 5F). These findings further suggest transcriptional and surface phenotype at diagnosis can predict response to ven/aza.
Discussion:
Venetoclax-based regimens have shown promising clinical outcomes for AML patients; however, therapy resistance is an emerging problem. Recent studies have suggested that AML can develop resistance to venetoclax through various characteristics3,14–17; however, identifying conserved biological principles that contribute to therapeutic resistance has yet to be described. In this study we report two distinct mechanisms of therapeutic resistance: 1) relapsed or refractory disease status and 2) RAS pathway mutations. Mutations in RAS have been previously reported to mediate fatty acid metabolism in lung cancer29,30. Importantly, regardless of the mechanism by which ven/aza resistance is achieved the ultimate consequence is increased fatty acid metabolism. Interestingly, TP53 mutations, which may result in sub-optimal responses to venetoclax, have also been shown to increase the levels of many fatty acids in AML cell lines14. These data suggest that instead of targeting each of the drivers of venetoclax resistance individually a more widely applicable strategy to combat venetoclax resistance is potentially to target fatty acid metabolism.
We propose two strategies to target fatty acid metabolism in ven/aza resistant LSCs. First, we demonstrate that inhibition of MCL-1 decreases fatty acid metabolism, likely through its relationship with ACADVL. Interestingly, MCL-1 inhibition alone or in combination with azacitidine decreases OXPHOS in LSCs, likely because MCL-1 inhibition also decreases amino acid metabolism. MCL-1 inhibition is already under clinical investigation in AML because of the role of MCL-1 in apoptosis25. Our study suggests that measuring the metabolic consequences of MCL-1 inhibition in AML cells isolated from patients treated with an MCL-1 inhibitor may also be a relevant biological endpoint to evaluate. The second strategy we propose is inhibition of fatty acid metabolism through targeting CPT1. While etomoxir is known to have multiple off-target effects, our genetic (Figure 4) and rescue data (Extended data Figure 5) suggests the effects are likely due to etomoxir’s role in inhibiting CPT1. Unlike MCL-1 inhibitors, etomoxir is only effective at targeting LSCs in the presence of ven/aza, indicating that inhibition of both amino acid and fatty acid metabolism is needed to target ven/aza resistant LSCs. Interestingly, inhibition of fatty acid synthesis has been shown to potentiate the effects of the BCL-2/BCL-XL dual inhibitor (ABT-737) in AML through regulation of Bak-dependent mitochondrial permeability transition31. Further, inhibition of fatty acid uptake, specifically abrogation of CD36 function sensitizes AML cells to conventional chemotherapy, including cytarabine32,33. These data suggest that increased fatty acid metabolism may be a more universal mechanism of promoting therapy resistance; therefore, identifying mechanisms to target fatty acid metabolism may relatively broad implications for the treatment of therapy-resistant AML patients.
Our study also demonstrates that fatty acid metabolism may allow identification of patients who are likely to become (or be) resistant to ven/aza. Specifically, increased expression of genes involved in fatty acid metabolism correlates with a poor response to ven/aza. Future studies designed to further evaluate the predictive potential of fatty acid gene expression are needed; however, if these findings are confirmed in a larger cohort of patients it may be possible to rationally determine which patients should receive ven/aza and which patients may benefit from other therapies. The other possibility is that a predictive tool may allow for rational trials designed to test whether adding an MCL-1 inhibitor or etomoxir in addition to ven/aza upfront may be beneficial for those patients predicted to have a poor response to ven/aza.
In summary, these findings identify conserved biological properties that contribute to ven/aza resistance in LSCs isolated from primary AML patients. We also describe two strategies to target ven/aza resistance and propose a predictive model to determine which patients may be resistant to ven/aza therapy.
Methods:
Human Specimens:
AML specimens were obtained from patients via apheresis product, peripheral blood or bone marrow; mobilized peripheral blood was obtained from healthy donors. All patients gave informed consent for sample procurement on the University of Colorado tissue procurement protocol. The University of Colorado Institutional Review Board approved the retrospective analysis. See Extended Data Table 2 for additional details on the human AML specimens.
Statistical Analysis:
Baseline variables of interest (age, sex, race, prior treatment for AML, prior treatment for MDS, prior treatment for AML or MDS, relapsed status, refractory status, SWOG cyto category, complex status, monosomal status, flt3 mutation status, npm1 mutation status, idh mutation status, asxl1 mutation status, ptpn11 mutation status, ras mutation status, ras pathway mutation status, tp53 mutation status, and ELN risk group) were summarized for all patients. We then explored four general categories of outcomes among the patients—with definitional variations extending the total number of outcomes explored to nine: 1) response status (2 definitions): CR/CRi/PR/MLFS vs. No Response and CR/CRi vs. PR/MLFS/No Response; 2) refractory outcome (4 definitions): Refractory by ELN, Refractory by ELN or by no evaluation because of disease, Refractory by no CR/CRi, and Refractory by CR/CRi or by no evaluation because of disease; 3) Relapse in responders (CR/CRi/PR/MLFS); and 4) survival (2 definitions): Progression-free survival and Overall survival. The relationship between baseline predictor variables and outcome variables were then investigated in two ways. For the binary outcome variables of response status, refractory outcome, and relapse in responders, univariate logistic regression models were used to assess evidence of association between predictors and outcomes. Odds ratios and their 95% confidence intervals as well as accompanying p-values were calculated for each variable. For survival outcomes, median PFS and OS were calculated using Kaplan Meier survival methods. To assess the effect of the various predictors on survival outcomes, univariate Cox regression models were performed and hazard ratios and their 95% confidence intervals and accompanying p-values were calculated. The threshold level of significance in univariate logistic regression and Cox regression models was set at 0.05 a priori. To explore the simultaneous effect of the predictors on the various outcomes of interest, follow-up multivariate models were run: multivariate logistic regression models in the case of response status, refractory outcome, and relapse in responders and multivariate Cox regression models for survival outcomes. For each multivariate model, any predictor that achieved a univariate regression p-value ≤ 0.10 was included in the initial multivariate model for the outcome. Any predictor then achieving a p-value ≥ 0.20 in this initial multivariate model was included in the final multivariate model for the outcome, where odds ratios and their 95% confidence intervals and p-values were calculated. Analyses were performed using SAS version 9.4 (SAS Institute).
Human Specimen Culturing:
When culturing was required, all samples were cultured in a base media of MEM without amino acids and 5.5mM glucose (My BioSource, MBS752807) supplemented with physiologic levels of amino acids (Carolina, 84-3700) and 10nM human cytokines SCF (PEPROTech, 300-07), IL3 (PEPROTech, 200-03), and FLT3 (PEPROTech, 300-19) as previously described 3. In addition, the media was supplemented with low density lipoprotein (Millipore, 437744), BIT (Stem cell technologies, 09500) β-ME (Gibco, 21985-023), penicillin/streptomycin.
Cell Sorting and Flow Cytometry:
Primary AML specimens were thawed, stained with CD45 (BD, 571875, Dilution 1:40) to identify the blast population, CD19 (BD, 555413,, Dilution 1:20) and CD3 (BD, 557749,, Dilution 1:40) to exclude the lymphocyte populations, DAPI (EMD Millipore, 278298, Dilution 500 nM), and CellROX deep red (Thermo Fisher, C10422, Dilution 5 uM), and sorted using a BD FACSARIA. ROS-low LSCs were identified as the cells with the 20% lowest ROS levels and the ROS-high blasts were identified as the cells with the highest 20% ROS levels, as previously described3–5,20. Flow cytometry was carried out on populations utilizing CD36 (BD, 555455, Dilution 1:20).
Global UHPLC-MS Metabolomics:
Approximately 100,000–500,000 ROS-Low LSCs were sorted and metabolomics analyses were performed via ultra-high pressure-liquid chromatography-mass spectrometry (UHPLC-MS – Vanquish and Q Exactive, Thermo Fisher) as previously reported 34. Briefly, cells were extracted in ice cold methanol:acetonitrile:water (5:3:2 v/v/v) at a concentration of 2 million cells/mL of buffer. After vortexing for 30 min at 4°C, samples were centrifuged at 12,000 g for 10 min at 4°C and supernatants processed for metabolomics analyses. Ten microliters of sample extracts were loaded onto a Kinetex XB-C18 column (150 × 2.1 mm i.d., 1.7 μm – Phenomenex). A 5 min gradient (5–95% B, phase A: water + 0.1% formic acid and phase B: acetonitrile with + 0.1% formic acid for positive ion mode; 0–100% B, phase A: 5% acetonitrile + 5mM ammonium acetate and phase B: 95% acetonitrile + 5mM ammonium acetate for negative ion mode) were used to elute metabolites. The mass spectrometer scanned in Full MS mode at 70,000 resolution in the 65–975 m/z range, 4 kV spray voltage, 45 sheath gas and 15 auxiliary gas, operated in negative and then positive ion mode (separate runs). Metabolite assignment was performed against an in-house standard library, as reported (Nemkov et al., 2015)35.
Lipidomics Analysis:
Approximately 100,000–500,000 ROS-Low LSCs were sorted and metabolomics analyses were performed via ultra-high pressure-liquid chromatography-mass spectrometry (UHPLC-MS – Vanquish and Q Exactive, Thermo Fisher) as previously reported 34. Cells were extracted in ice cold methanol at a concentration of 2 million cells/mL of buffer. After vortexing for 15 min at 4°C, samples were incubated without shaking for 15 minutes at −20°C. Samples were then centrifuged at 18,213 g for 10 min at 4°C, followed by a 1:1 dilution with 10mM ammonium acetate. Ten microliters of sample extracts were loaded onto an HSS T3 (150 × 2.1 mm i.d., 1.8 μm – Acquity). A 17 min gradient (25–99% B, phase A: 75:25 water:acetonitrile + 5mM ammonium acetate and phase B: 50:45:5 Isopropanol:acetonitrile:water + 5 mM ammonium acetate) were used to elute lipid metabolites. The mass spectrometer scanned in Full MS mode at 70,000 resolution in the 150–1500 m/z range, 4 kV spray voltage, 45 sheath gas and 15 auxiliary gas, operated in negative ion mode. Metabolite assignment was performed against an in-house standard library, as reported (Nemkov et al., 2015)35.
Metabolic Flux:
500,000 ROS-Low LSCs were sorted and incubated with stable isotope substrates including uniformly 100μM 13C, 15N-labeled amino acids (Cambridge Isotope Laboratories, MSK-A2-US-1.2), or 100μM [13C16]palmitic acid (Sigma-Aldrich, 705573) where indicated. Metabolomics analyses were performed via UHPLC-MS using the 5 min method as described above and previously 36.
Viability Assays:
Patient samples were sorted and cultured without amino acids or drugs for 24 hours. Viability was assessed by annexin V and 7AAD staining followed by flow cytometry.
Normal HSC Analysis:
Mobilized peripheral blood samples from were thawed, cultured in indicated conditions for 24 hours and CD34+ (BD, 572577) and CD45+ (BD, 571875), double positive percentages were quantified by flow cytometry (FACsCaliber, BD).
CFU Assays:
Primary AML samples or normal mobilized peripheral blood samples were cultured with indicated drugs for 24 hours before being plated in human methylcellulose (R&D systems HSC003). Colonies were counts 10–15 days after the initial plating.
Engraftment Assays:
Leukemia stem cell function was assessed by measuring engraftment of primary AML specimens post overnight culture with indicated therapies and transplant into NSGS mice. Engraftment was measured by flow cytometry for human CD45+ cells. All animal studies were done at the University of Colorado under IACUC approved protocol #308. University of Colorado is ALAC accredited, PHS animal assurance of compliance, and USDA licensed.
Patient Derived Xenograft Models:
To determine the effect of ven/aza, etomoxir, or the combination in vivo NSGS mice were transplanted with human AML leukemia cells via tail vein injection (2 million/mouse). Six weeks after transplantation, mice were treated five days on two days off with 100mg/kg venetoclax and 3 days of 3mg/kg azacitidine every-other day, 3 days per week every-other day 50mg/kg etomoxir, the combination of the two, or saline for two weeks, and then the composition of the residual leukemia cells within the bone marrow was examined by flow cytometry.
Seahorse Assays:
XF96 (Agilent Technologies, 102417–100) extracellular flux assay kits were used to measure oxygen consumption (OCR). ROS-low LSCs were sorted, drug treated for four hours and plated into XF96 well plates. OCR was measured according to the manufacture protocol and as previously described3,4.
Immunoblotting:
Protein lysates were loaded on a polyacrylamide gel. Proteins were transferred to a polyvinylidene difluoride membrane using the mini trans-blot transfer system (Bio-Rad). To detect specific antigens, blots were probed with primary antibodies CPT1A (Cell Signaling, 12252 Dilution 1:1000) GAPDH (Santa Cruz, sc-32233 Dilution 1:5000), and CPT1C (abcam ab123784 Dilution 1:500) on a shaker at 4 °C, overnight, followed by 1 h of room temperature incubation with HRP-conjugated secondary antibodies (Santa Cruz). Chemoluminescence was recorded using the automated Gel Doc XR system (Azure).
Transfection of siRNA in primary AML:
Primary AML specimens were transfected with siRNA constructs targeting ACADVL, CPT1A, CPT1C, CD36, or a non-targeting scrambled siRNA (Dharmacon) following established protocols37. Specifically, 2×10⁵ cells were electroporated using the Neon electroporator (Invitrogen) in Buffer T: R 1600, V 10 ms, 3 pulses.
CITE-Seq:
Cells were prepared and stained per manufacturer protocol utilizing 19 Total Seq A surface antibodies with oligo tags (Biolegend) stained for 30 minutes at 4 degrees Celsius. Cells were loaded and 3000 cells were captured via 10x Genomics 3’ v3 assay. Libraries were prepared per Biolegend and 10x Genomics protocol and sequenced on NovoSeq 6000 (Illumina). Single-cell RNA sequencing data was initially processed by the Cell Ranger pipeline (v3.1.0) from 10X Genomics. The generated count matrices were then analyzed using the Seurat package (v3.1.0) in R. Read counts were normalized to library size, scaled by 10,000, log-transformed, and filtered based on the following criteria: cells with less than 200 genes detected, more than 7,500 genes detected (to remove putative doublets), or with a proportion of unique molecular identifiers mapped to mitochondrial genes over 0.25 were excluded from analysis; genes detected in less than 5 cells were also excluded. Cell-to-cell variation in gene expression driven by the number of detected molecules and mitochondrial gene expression was regressed out using linear regression. Dimensionality reduction was performed with principal component analysis followed by Harmony alignment (https://www.biorxiv.org/content/10.1101/461954v2) to remove batch effects. UMAP projection and graph-based clustering were performed using the first 20 harmony components. Data are available in GEO.
RNA-seq:
The TruSeq RNA Sample Preparation Kit V2 (Illumina) was used for next generation sequencing library construction per the manufacturer’s protocols. Amplicons were ∼200– 500 base pairs in size. The amplified libraries were hybridized to the Illumina single end flow cell and amplified using the cBot (Illumina). Single end reads of 100 nucleotides were generated for each sample and aligned to the organism-specific reference genome. Raw reads generated from the Illumina HiSeq2500 sequencer were demultiplexed using configurebcl2fastq.pl version 1.8.4. Quality filtering and adapter removal were performed using Trimmomatic version 0.32 with the following parameters: ‘SLIDINGWINDOW:4:20 TRAILING:13 LEADING:13 ILLUMINACLIP:adapters.fasta:2:30:10 MINLEN:15’. Processed/cleaned reads were then mapped to the UCSC hg19 genome build with SHRiMP version 2.2.3 with the following setting: –qv-offset 33 -all-contigs. Data are available in GEO.
Statistics and Reproducibility:
Statistical analyses were performed utilizing denoted tests in Graphpad Prism v 6.0 and v 7.0. The graphs and data are visualized as noted per figure legends. Detailed methods regarding survival graphs are included above in statistics method. Animal experiments were carried out based on previous power analysis and past publications regarding AML xenograft models from group utilizing Lenth Power Calculator and sample sizes of 8 or greater animals based on expected standard deviation for a two sample t-test. echnical replicates from seahorse experiments were excluded when outliers (pmol/min readings for OCR) were identified through an outlier analysis using Grubb’s test/ECD method and technical issues with data collection including cell loss. Seahorse experiments done in technical replicates of 5 and multiple patient specimens to account for technical issues with plates and collection of values. Values removed in figures 4C and 5C and extended data figure 3C and 5B. Randomization did not apply to metabolism experiments or trial patients as it was a non randomized study. In animal experiments animals were randomized to injection and treatment groups. Investigators were not blinded to allocation during experiments and outcome assessment.
Further information on research design is available in the Nature Research Reporting Summary linked to this article.
Extended Data
Extended Data Figure 1:
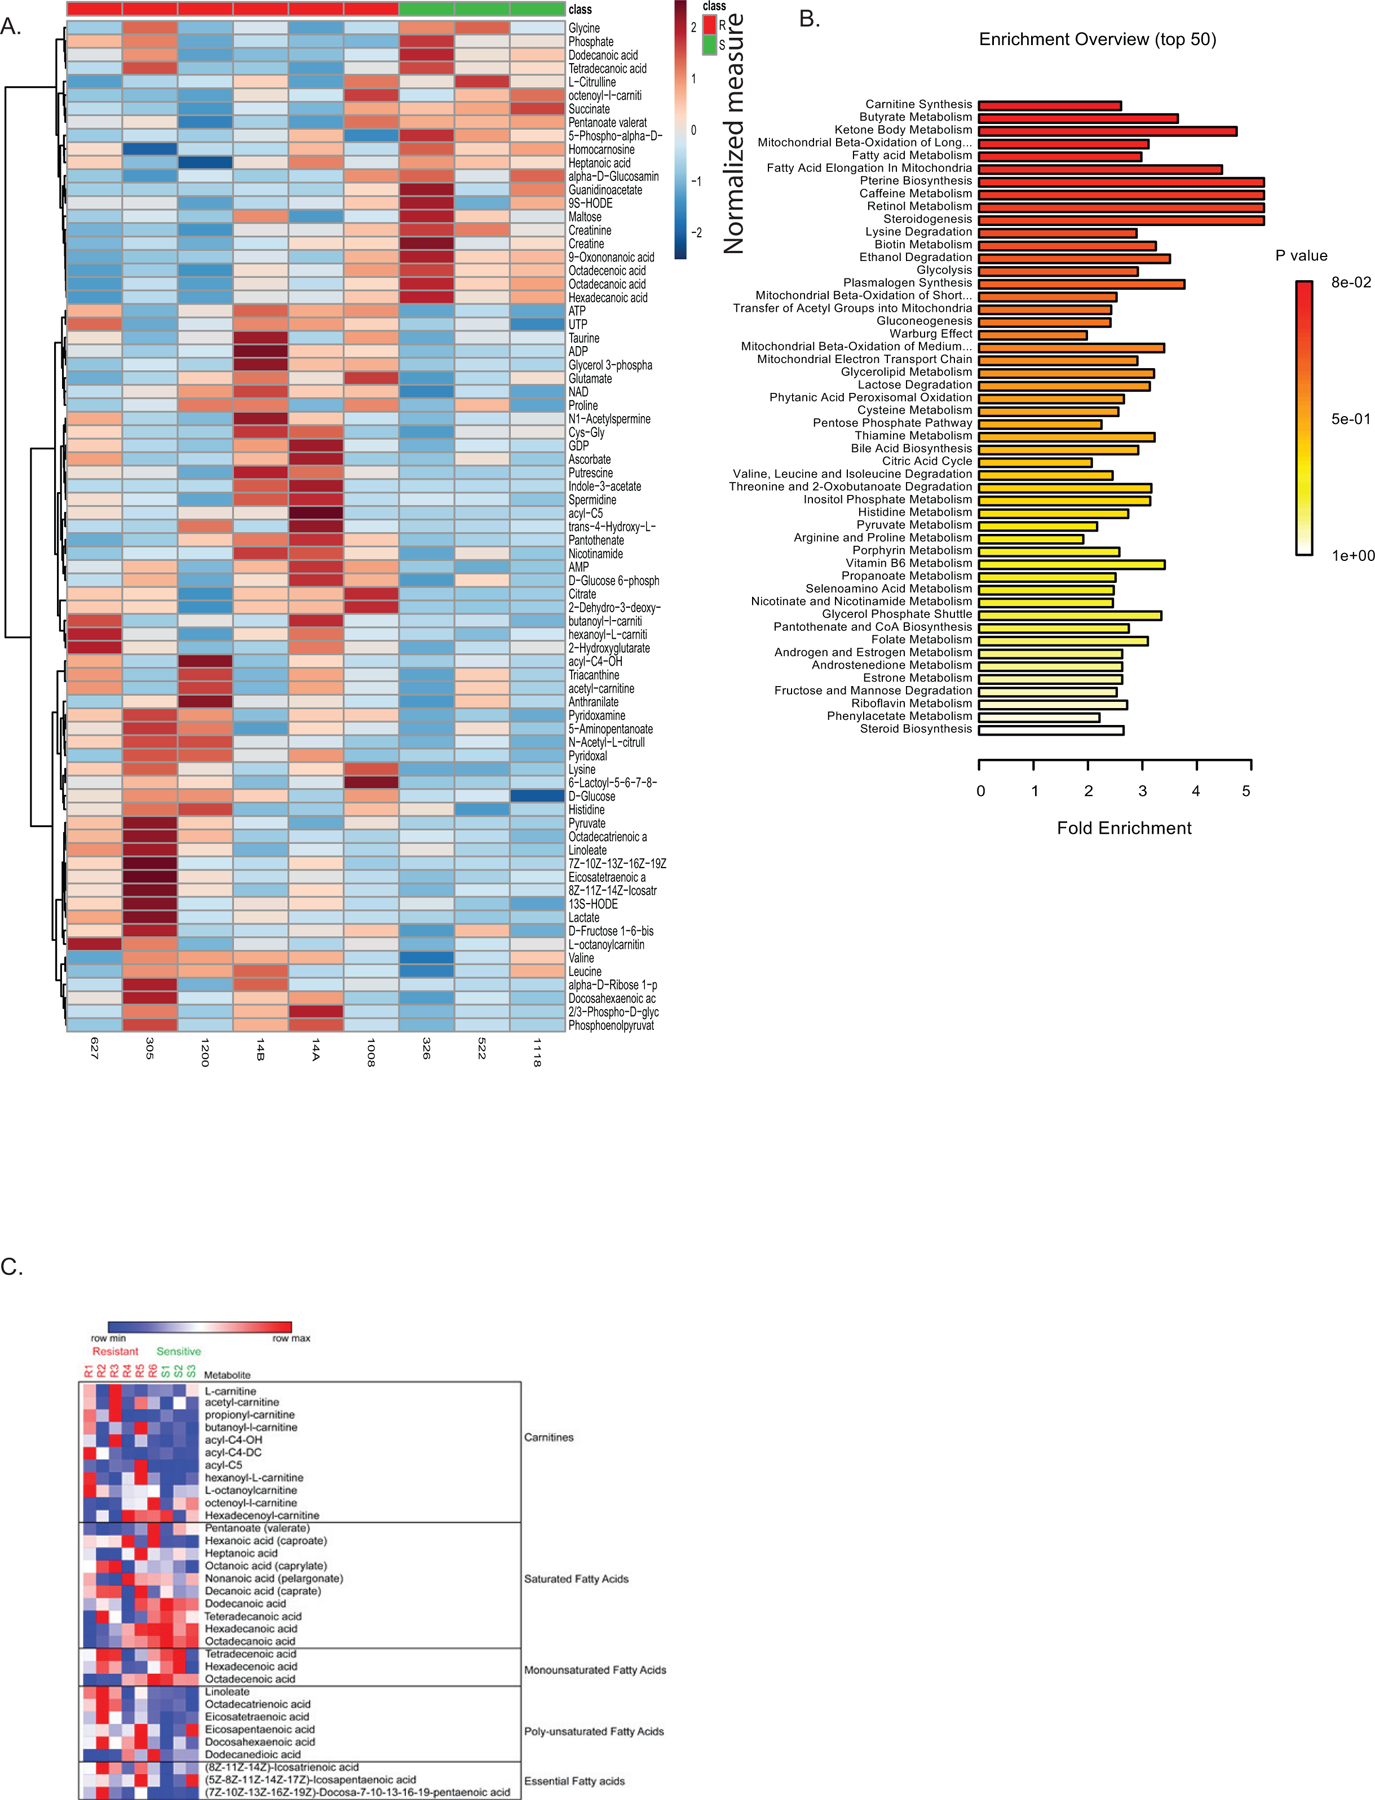
Metabolite analysis of sensitive versus resistant LSCs. A. Global LC/MS metabolite screen of sensitive and resistant LSCs from figure 2. Values are normalized by metabolite to median expression of row. Each data point represents the median calculated from four technical replicates. B. Metabolite pathway analysis shows increased fatty acid metabolism pathways in resistant LSCs as determined by Metaboanalyst software analysis of global metabolite levels in LSCs. P value represents adjusted P value after multiple comparison Holm test. C. Heatmap of carnitine and fatty acid levels as determined by LC/MS. The samples in panels A-C are from the same sensitive (N = 3 patient specimens) and resistant (N=7 patient specimens) AML patient samples.
Extended Data Figure 2:
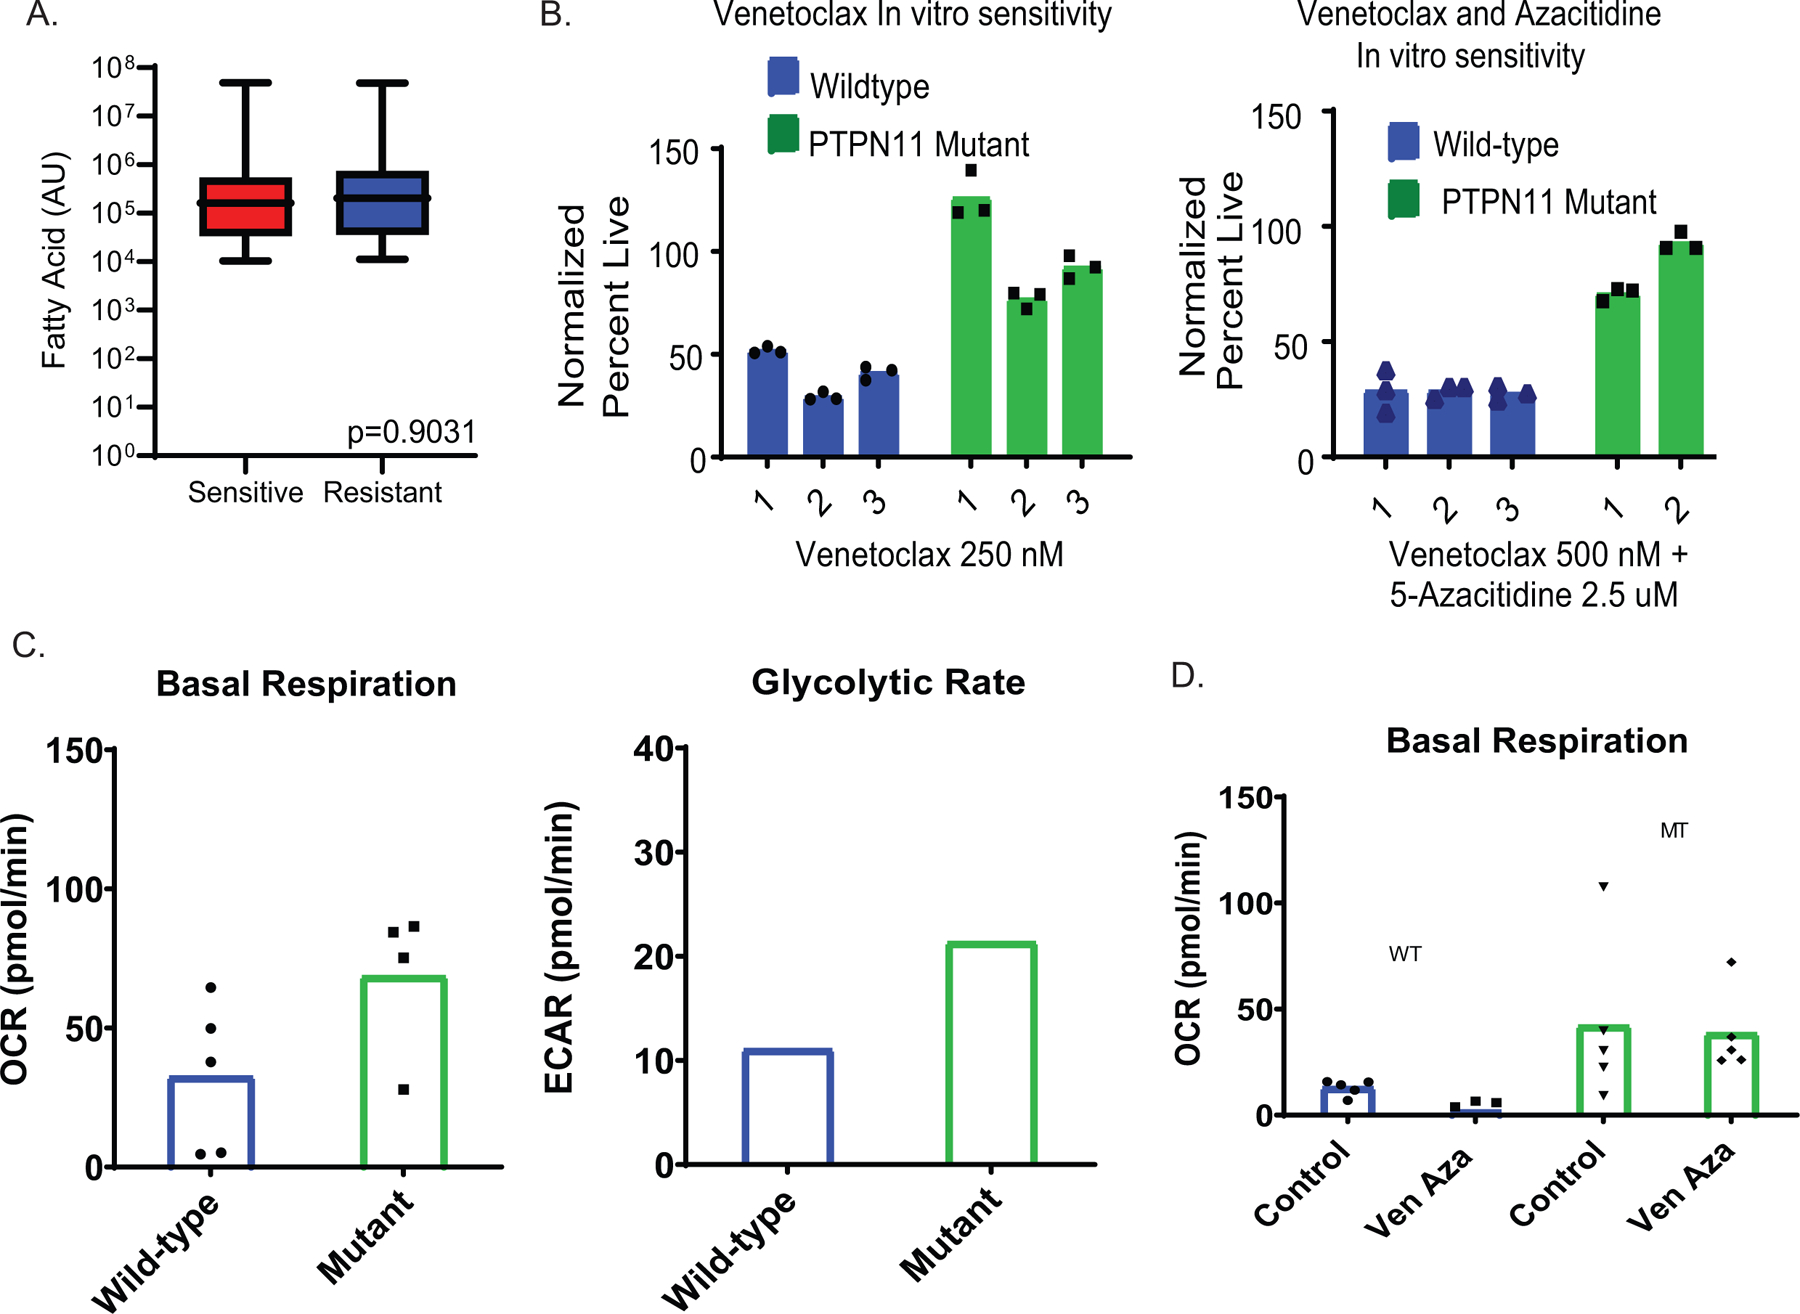
Effects of PTPN11 mutation on metabolism and venetoclax sensitivity. A. Measurement of fatty acids in ven/aza sensitive and resistant LSCs from lipodomics analysis shown as box and whiskers plot with min and max represented. N= 3 sensitive patient specimens versus N=3 resistant patient specimens measured across 4 technical replicates per patient sample. Significance was measured by paired two-tailed Student’s t-test. B. Venetoclax and ven/aza viability of primary AML cells of patients with or without a PTPN11 mutation. N= 3 independent patient wild-type specimens versus N=2 (venetoclax + aza) or 3 (venetoclax alone). PTPN11 resistant patient specimens measured across 3 technical replicates per patient sample. Data are presented as mean values. C-D. Basal respiration and glycolytic rate of primary AML cells transduced with lentiviral PTPN11 E76A mutation. N= 1 independent patient wild-type specimens versus N=1 PTPN11 mutant patient specimens measured across 4–5 technical replicates per sample. Individual values in glycolytic rate consolidated in instrument software and mean value shown. Data are presented as mean values. Patient sample run as single experiment with single transduction.
Extended Data 3:
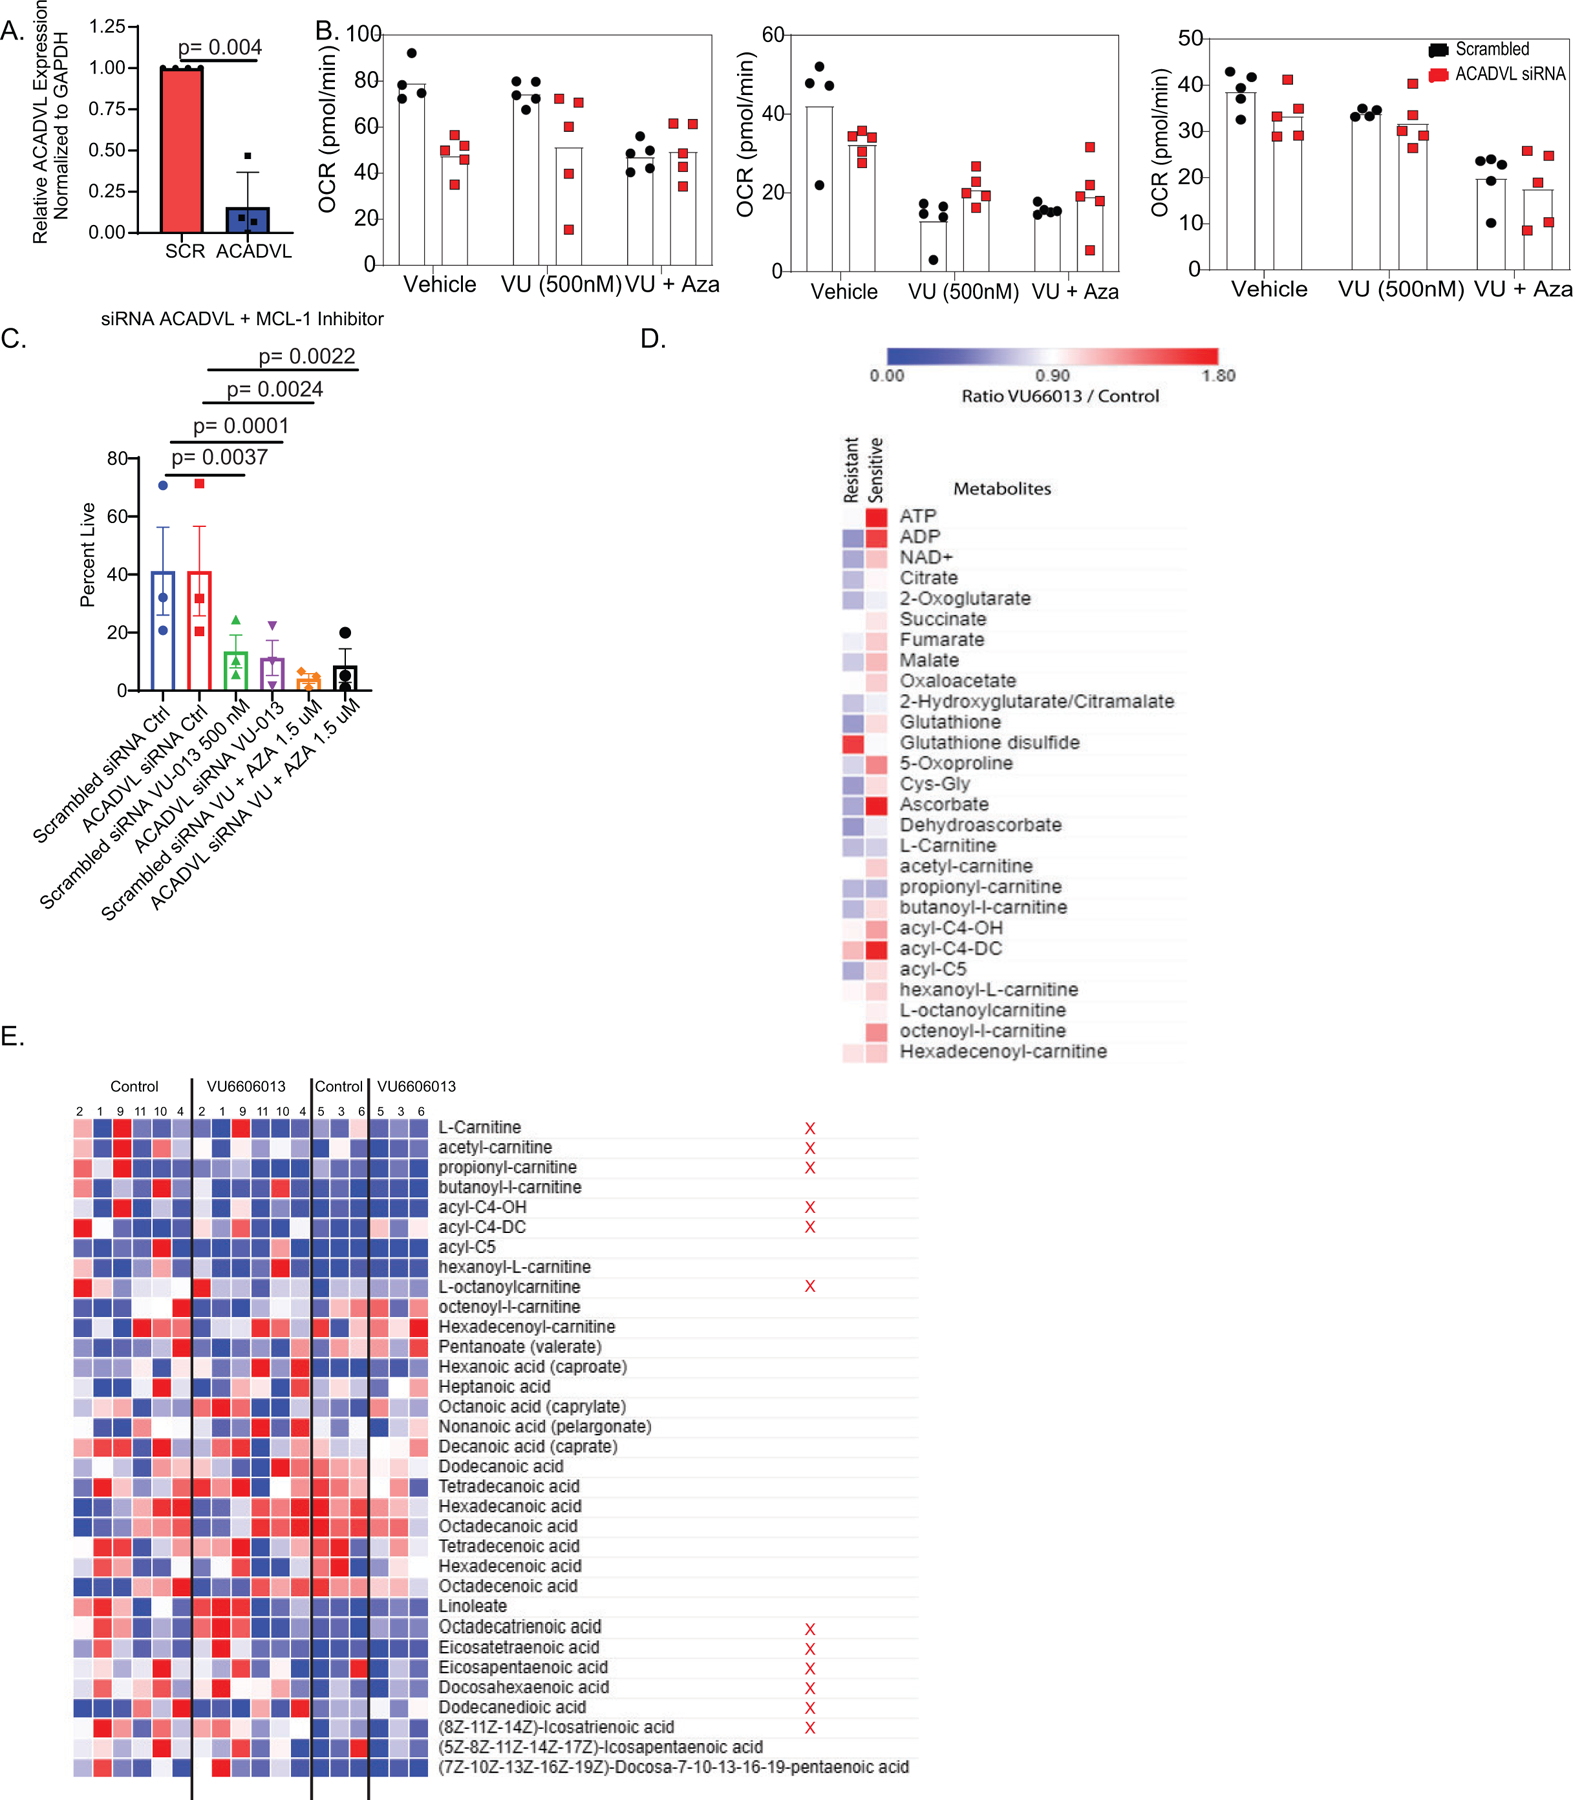
MCL-1 inhibition decreases fatty acid metabolism in ven/aza resistant LSCs. A. Relative expression of ACADVL in siRNA knockdown samples N= 4 independent patient samples. Data are presented as mean values +/− SD. Significance was measured by paired two-tailed Student’s t-test. B. Basal respiration in ACADVL siRNA knockdown cells with or without VU and VU+ Aza. N=3 patient specimens with N=5 technical replicates for each experiment. Data are presented as mean values. Patient samples run as single experiment with 3 unique patients. C. SiRNA knockdown of ACADVL and viability with or without VU and VU+ Aza. N=3 independent patient samples for each experiment. Data are presented as mean values +/− SD. Significance was measured by unpaired two-tailed Student’s t-test. D. Global metabolite measurement in sensitive and resistant LSCs after VU+ Aza treatment relative to control. N= 6 independent patient specimens versus N=3 sensitive patient specimens measured across 4 technical replicates per patient sample. Heat map shows the ratio of VU660103 treated to untreated control. E. Global carnitine and fatty acid levels after 4 hours of VU + Aza in ven/aza resistant (R) and sensitive (S) specimens. Metabolites that show selective decrease upon drug treatment in ven/aza resistant specimens are indicated by a red X. N= 6 independent patient specimens versus N=3 sensitive patient specimens measured in across 4 technical replicates per patient sample.
Extended Data Figure 4:
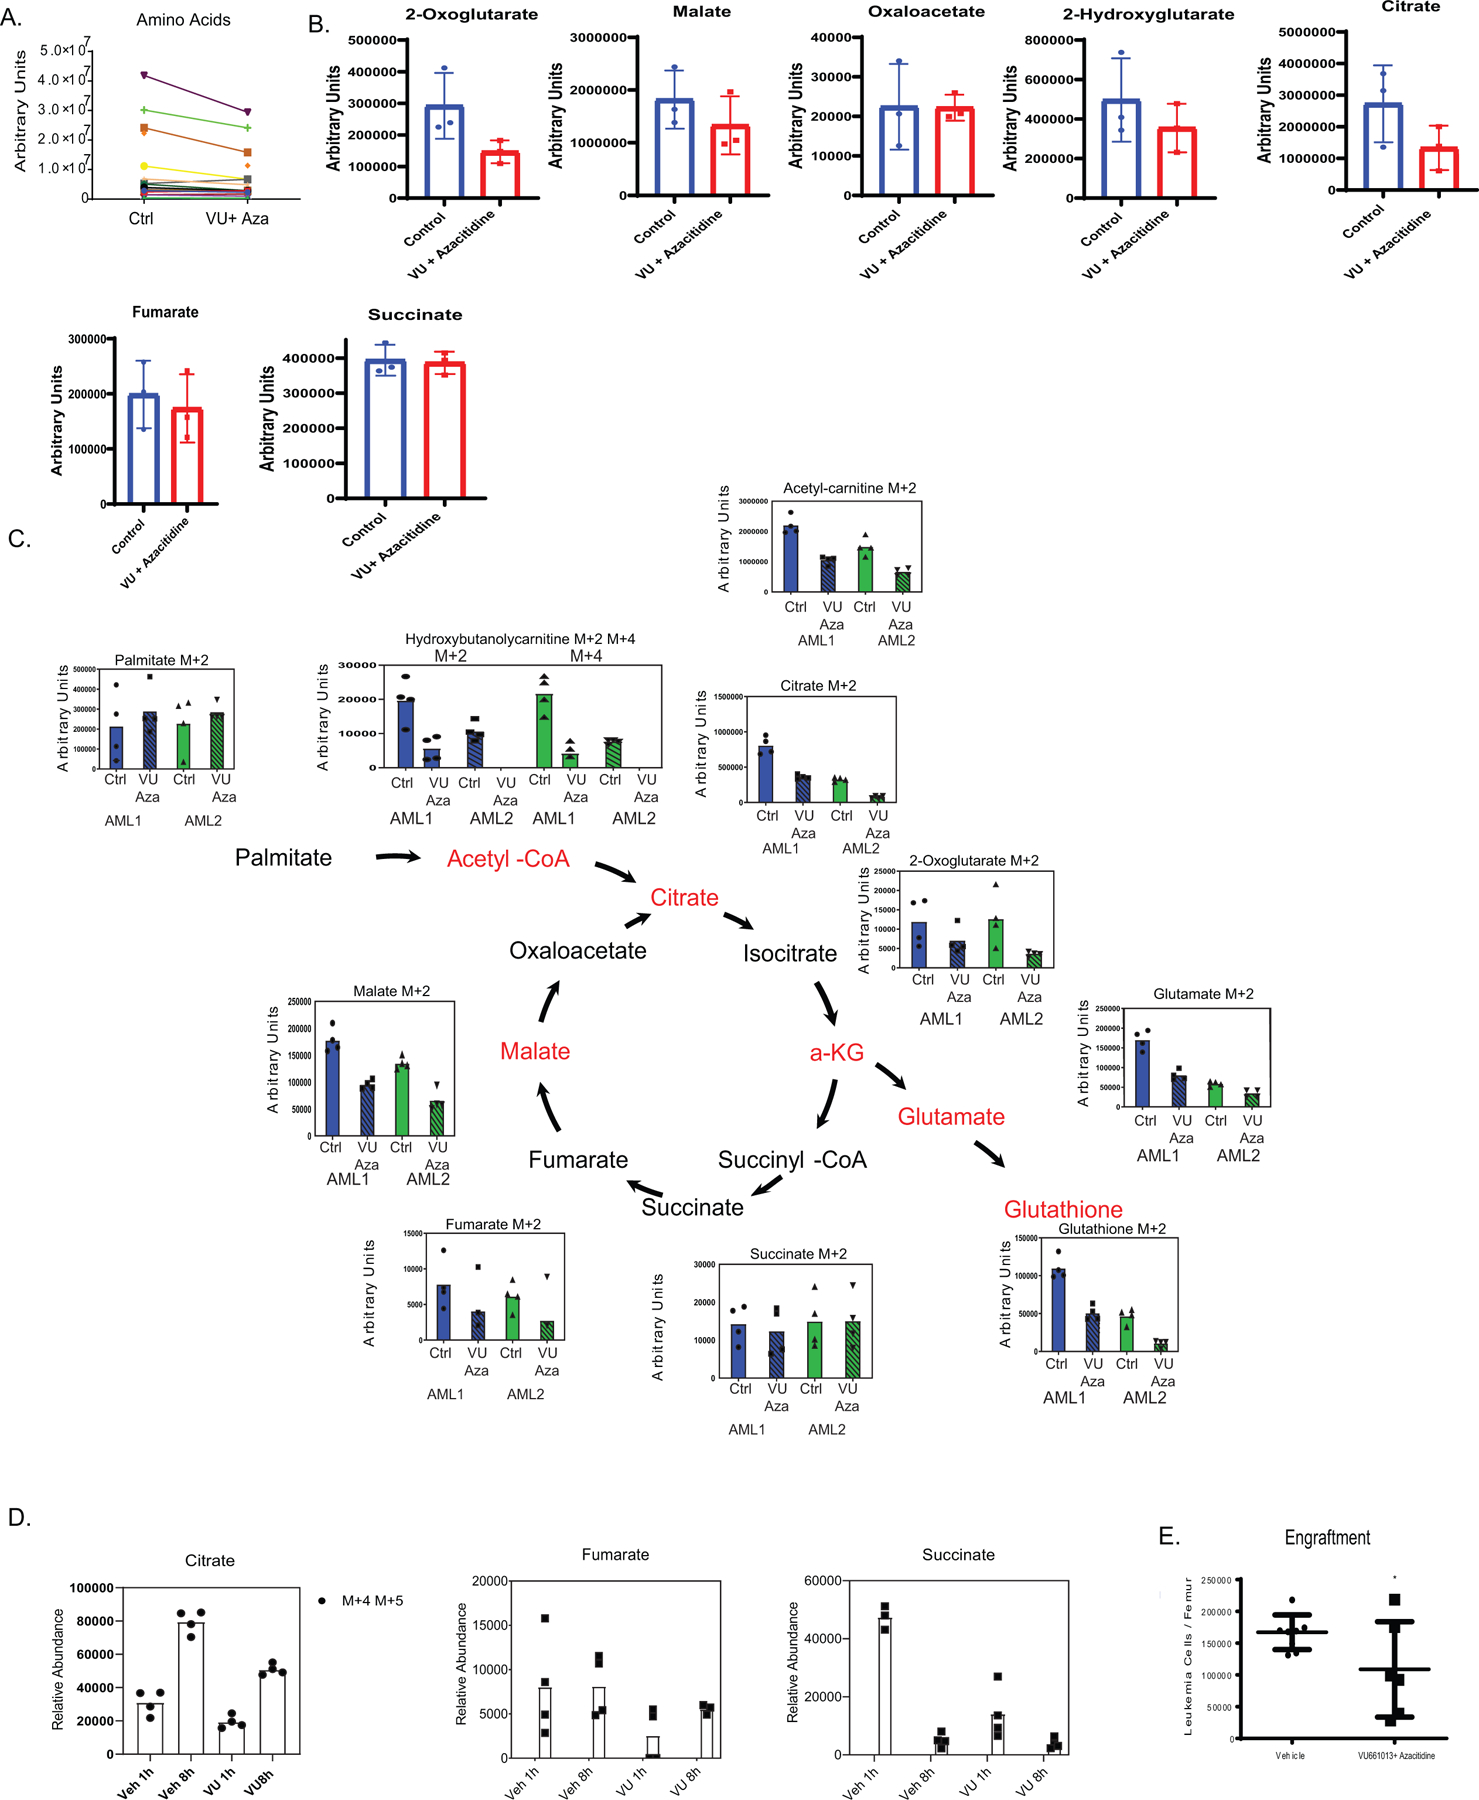
A. Global amino acid metabolite levels after 4 hours of VU + Azacitidine. N= 3 independent patient specimens measured across 4 technical replicates per patient sample. B. Global TCA cycle metabolite levels after 4 hours of VU + Azacitidine. N= 3 independent patient specimens versus N=3 sensitive patient specimens measured across 4 technical replicates per patient sample. Data are presented as median values +/− SD. Significance was measured by unpaired two-tailed Student’s t-test. C. Resistant LSCs exhibit increased palmitate contribution to fatty acid transport metabolites and TCA cycle intermediates as measured through stable isotope labelled palmitate flux. N= 2 resistant specimens measured across 4 technical replicates per specimen per condition. Data are presented as median. D. Palmitate abundance in TCA metabolites after 1 hour or 8 hours of VU660103 treatment. Stable isotope labeled amino acid flux into TCA cycle intermediates after 1 hour or 8 hours of treatment. N= 1 independent patient sample measured across 4 technical replicates. Patient sample run as single experiment. E. Engraftment of resistant LSCs is decreased after ex vivo treatment with VU/Aza as measured by human CD45 labelled cells per femur. N= 8 independent animals in vehicle and N= 6 independent animals in VU treated for 1 independent patient derived xenograft. Data are presented as mean values +/− SD. Significance was measured by unpaired two-tailed Student’s t-test.
Extended Data Figure 5:
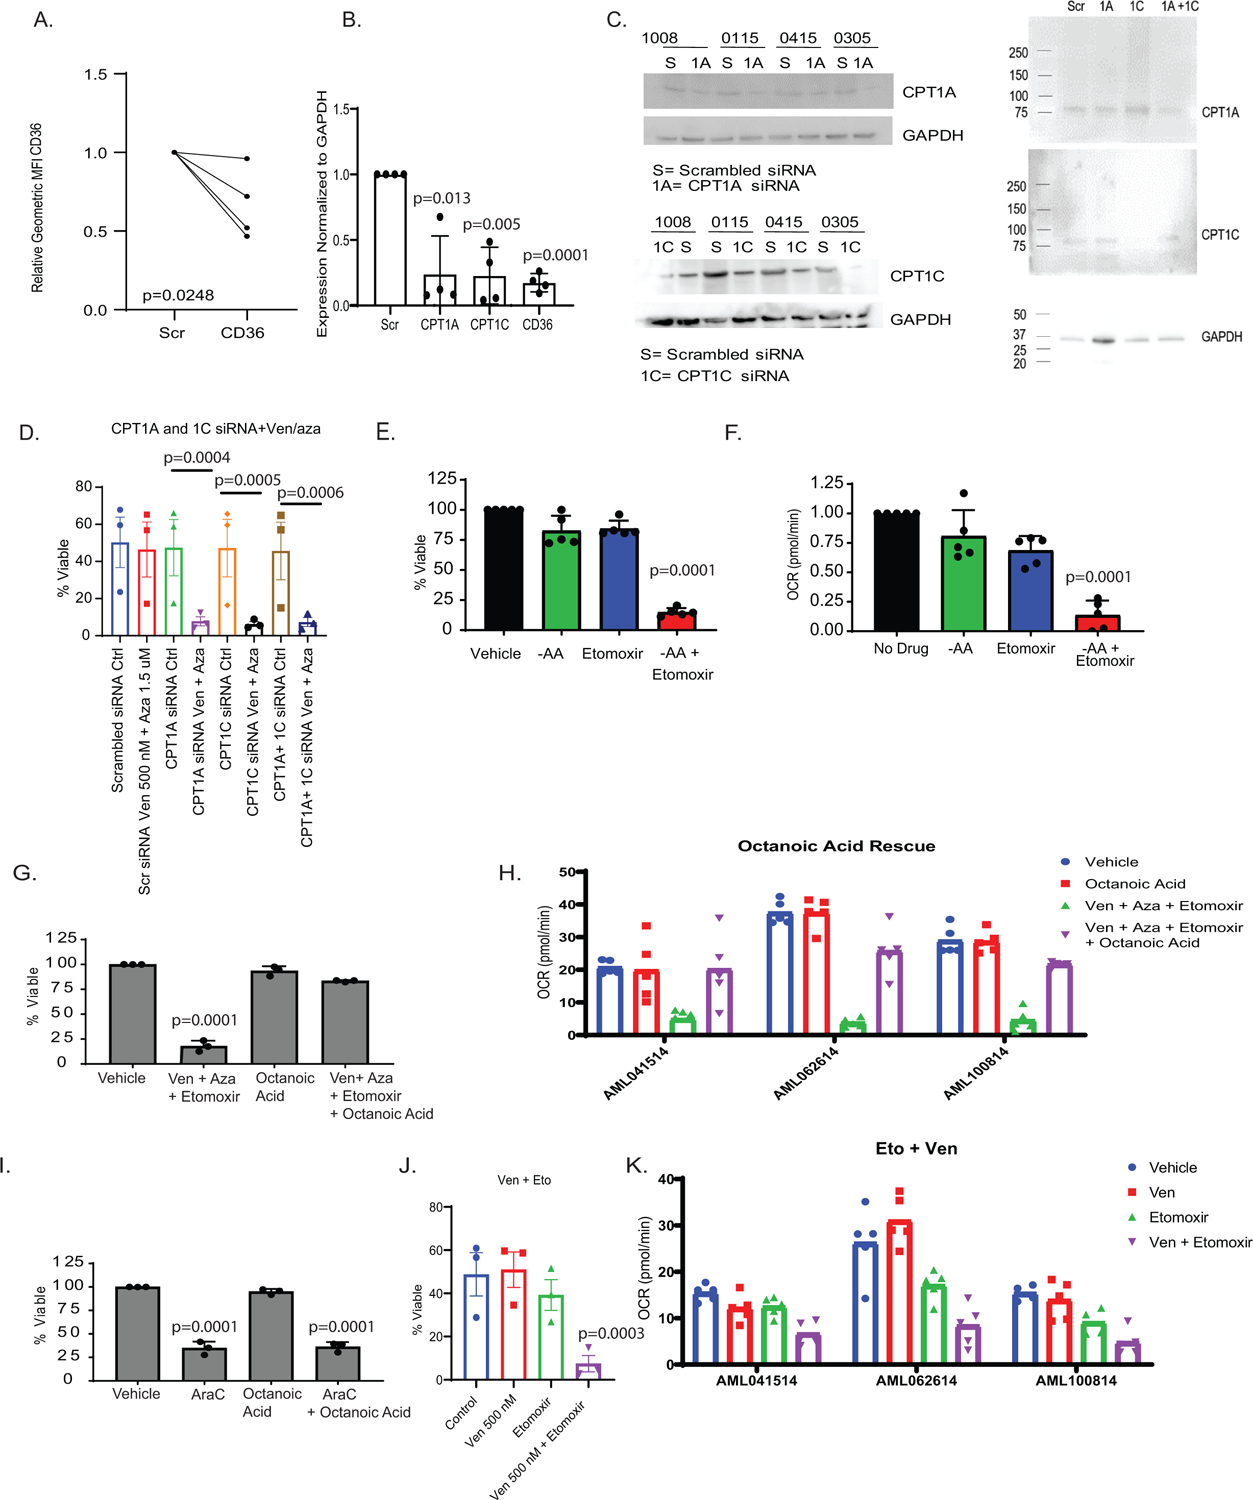
Quantification of CD36, CPT1A, CPT1C after siRNA. A. Relative MFI from flow cytometry of CD36 after siRNA. N= 4 independent patient samples B. RNA levels of CPT1A, CPT1C, and CD36 24 hours post transfection in primary AML specimens. N= 4 independent patient samples. Data are presented as mean values +/− SD. C. Western blot quantification of CPT1A, CPT1C or CPT1A and CPT1C after siRNA in 4 specimens. N=4 independent patient samples. Western blots representative of at least 2 experimental replicates per patient sample. D. SiRNA for CPT1A and CPT1C alone and in combination and the effects on viability after 24 hour treatment with ven+aza. N=3 independent patient samples. Data are presented as mean values +/− SD. Significance was measured by paired two-tailed Student’s t-test. E. Etomoxir addition in resistant LSCs. Viability measured after etomoxir treatment in the presence or absence of amino acids. N=5 independent patient samples. Data are presented as mean values +/− SD. Significance was measured by paired two-tailed Student’s t-test. F. Oxygen consumption rate measured after etomoxir treatment in the presence or absence of amino acids via Seahorse analysis. N=5 independent patient samples. Data are presented as mean values +/− SD. Significance was measured by paired two-tailed Student’s t-test.. G-H Viability and oxygen consumption rate of LSCs after ven/aza, etomoxir, and octanoic acid addition. N=3 independent patient samples. Data are presented as mean values +/− SD. Significance was measured by paired two-tailed Student’s t-test. I. Viability of LSCs after cytrabine, etomoxir, and octanoic acid addition. N=3 independent patient samples. Data are presented as mean values +/− SD. Significance was measured by paired two-tailed Student’s t-test. J-K Viability and oxygen consumption rate of LSCs after ven, etomoxir, or ven+ etomoxir. N=3 independent patient samples. Data are presented as mean values +/− SD. Significance was measured by paired two-tailed Student’s t-test.
Extended Data Figure 6.
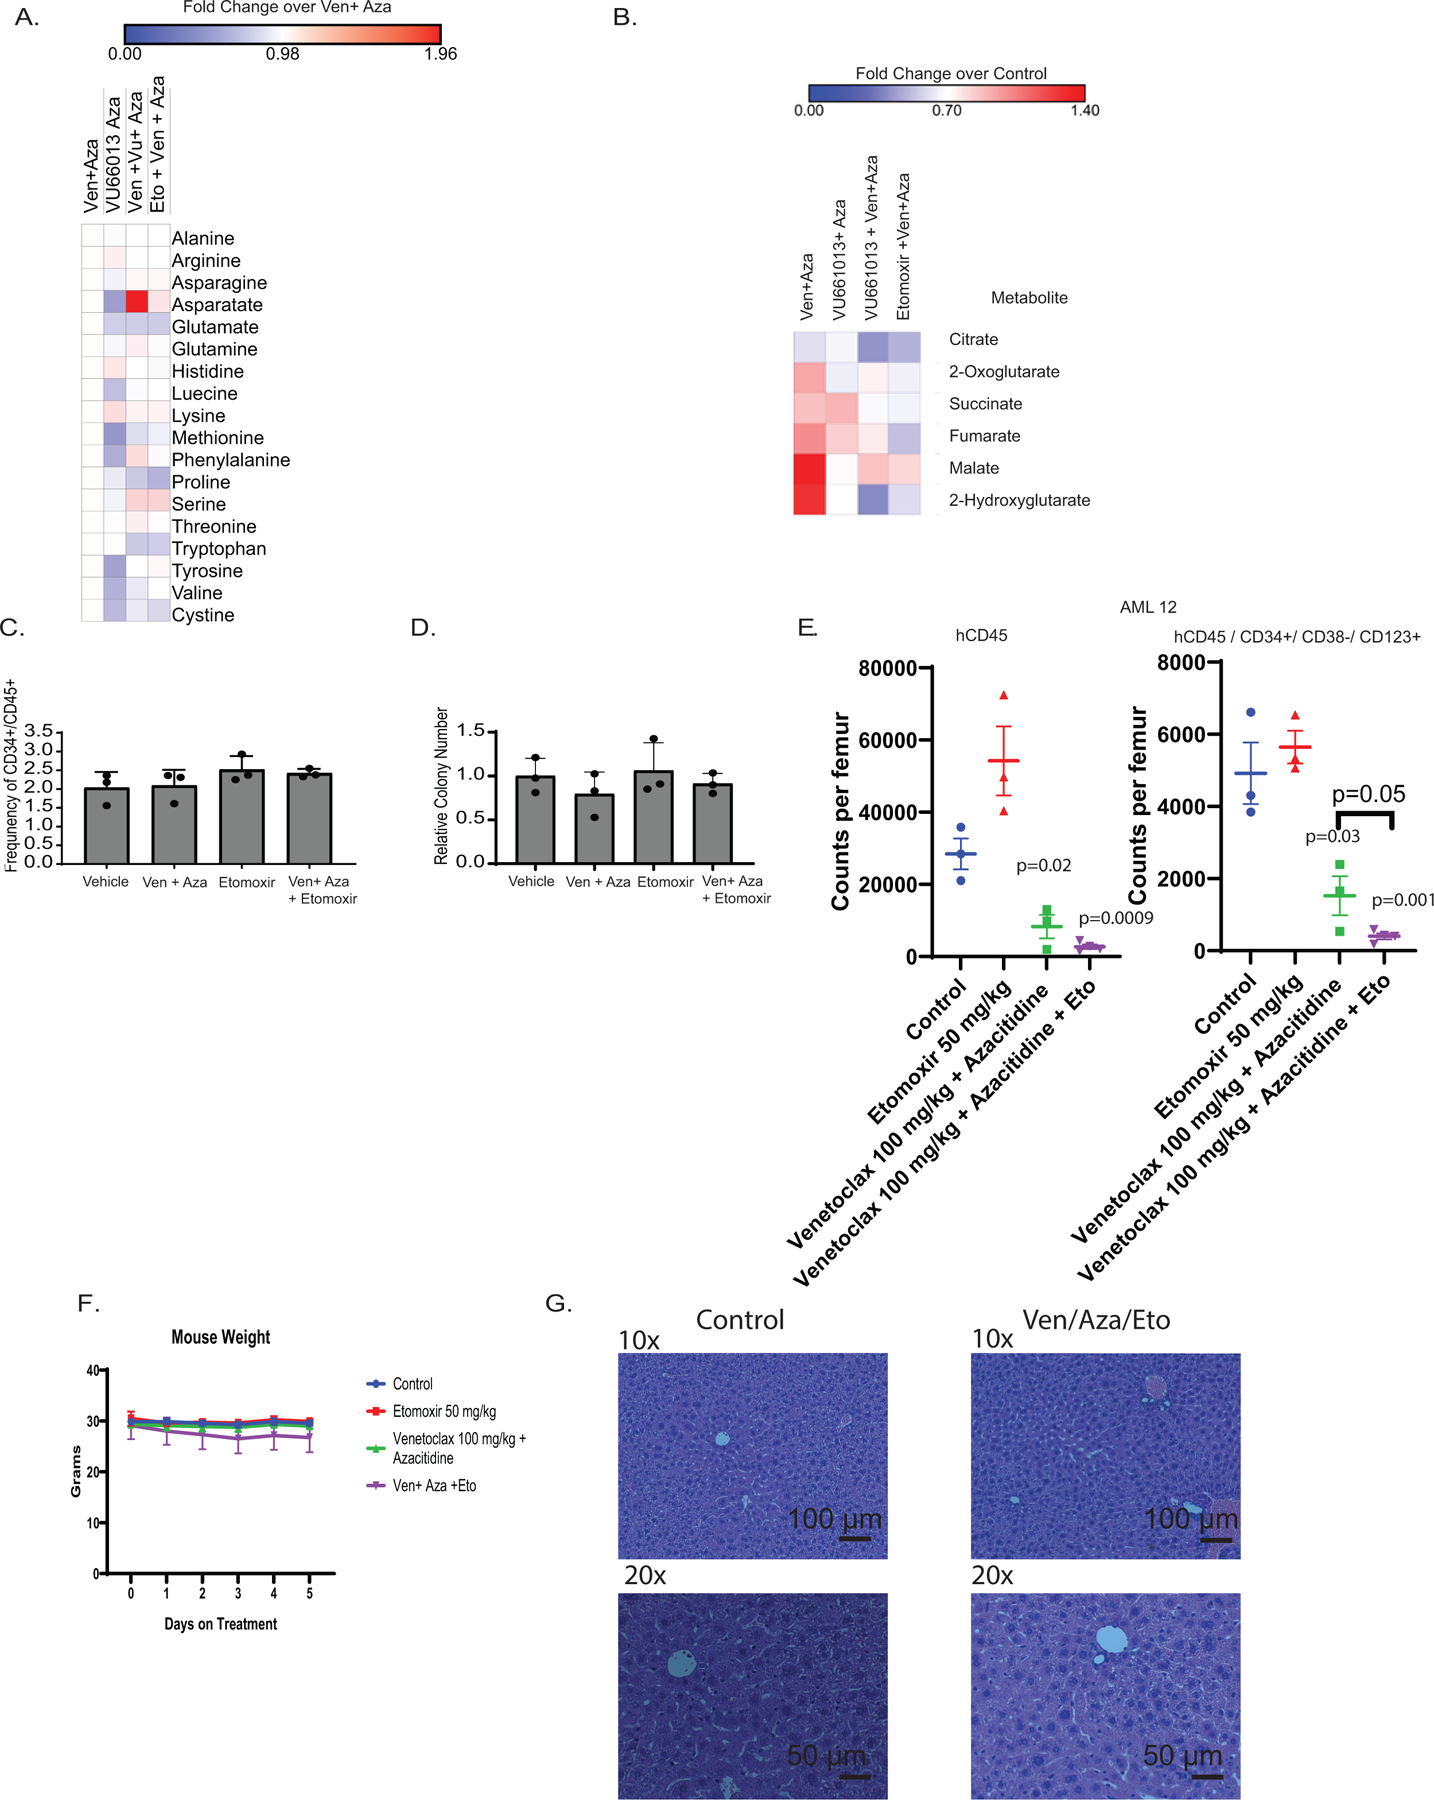
A. Fold change of amino acids after 4 hour treatment with ven+aza, VU + aza, VU + ven+ aza, or Eto+ ven+ aza. N= 3 independent patient specimens versus N=3 sensitive patient specimens measured across 4 technical replicates per patient sample. Data are presented as median values. B. Fold change over control of TCA metabolites after 4 hour treatment with ven+aza, VU + aza, VU + ven+ aza, or Eto+ ven+ aza. N= 3 independent patient specimens versus N=3 sensitive patient specimens measured across 4 technical replicates per patient sample. Data are presented as median values. C. Viability of normal human CD34+ cells 24 hours after ven/aza and etomoxir addition. N=3 independent patient samples. Data are presented as mean values +/− SD. Significance was measured by paired two-tailed Student’s t-test. D. Colony forming units of normal human CD34+ cells after ven/aza and etomoxir addition. N=3 independent patient samples. Data are presented as mean values +/− SD. Significance was measured by paired two-tailed Student’s t-test. E. Etomoxir and ven+aza treatment in patient derived xenograft. Counts per femur measured with human CD45+ and human CD45+/ CD34+/ CD38-/CD123 via flow cytometry. N =3 mice for the vehicle, venetoclax + azacitidine, and etomoxir groups and N = 4 for the venetoclax + azacitidine + etomoxir group for 1 independent patient sample derived xenograft. Data are presented as mean values +/− SD. Significance was measured by unpaired two-tailed Student’s t-test. F. Mouse weight average across in vivo ven/aza/eto combination therapy experiment. N= 12 control, N=11 eto, N=12 ven+aza, and N=12 ven+aza+eto mice per dose for 1 independent patient sample derived xenograft. Data are presented as mean values +/− SD. Significance was measured by unpaired two-tailed Student’s t-test. G. Hematoxylin and eosin staining of mouse liver sections from ven/aza/eto combination compared to vehicle control - 10x and 20x magnification. Images representative of 3 individual mice per treatment group.
Extended Data Figure 7:
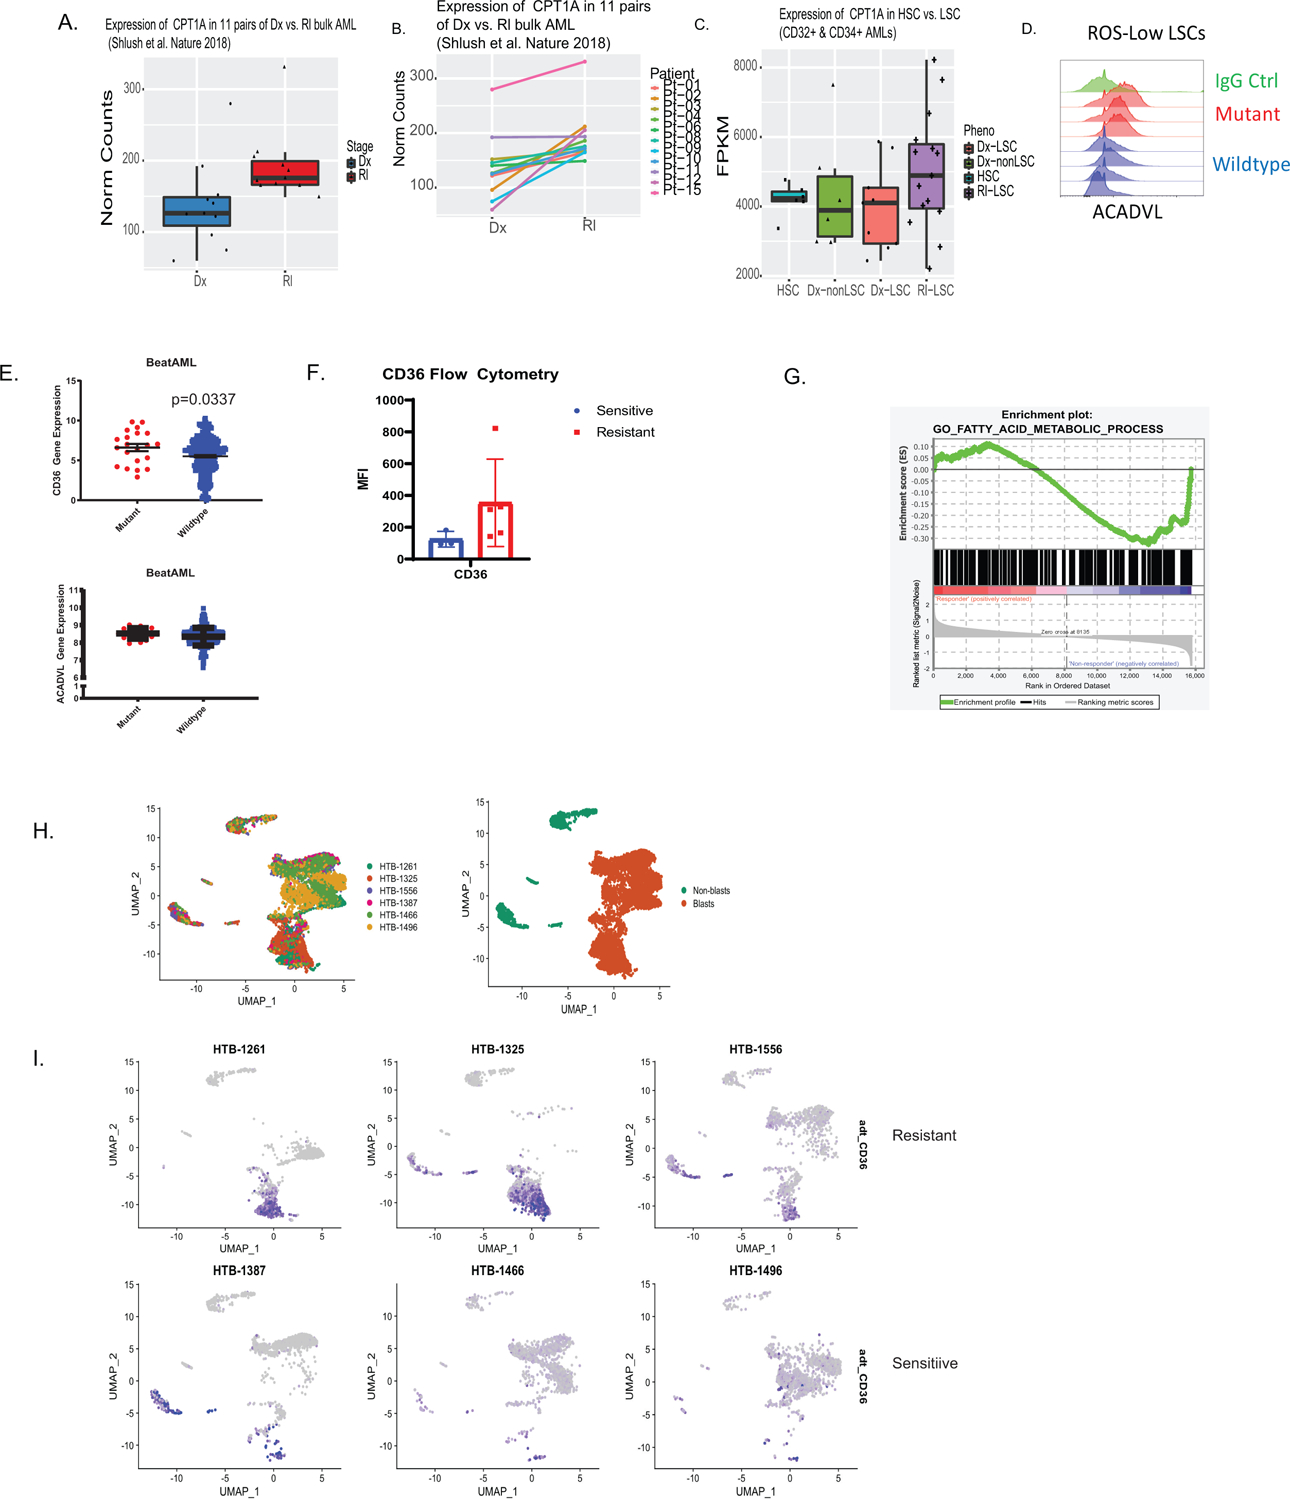
Transcriptional analysis of CPT1 and fatty acid metabolism in multiple data sets and patients that progress on ven/aza. A-B. Analysis of CPT1 in paired diagnosis versus relapse LSCs. N=11 paired patient specimens. A. Overall expression compared between diagnosis and relapse. B. Expression between paired specimens with lines linking same patient. Data are presented as mean values +/− SD. Data are presented as median with lower hinges and upper hinges at 25th and 75th percentile with upper whisker to largest value and lower whisker to smallest value. C. Analysis of diagnosis and relapse paired LSCs for CPT1a. N=35 sorted cell populations from 12 patients with following subpopulation numbers: N= 6 HSC cell populations, N=5 non-lsc cell populations, N= 9 DX LSC cell populations, and N=15 RI LSC cell populations. Data are presented as median with lower hinges and upper hinges at 25th and 75th percentile with upper whisker to largest value and lower whisker to smallest value D. Flow cytometric measurement of ACADVL in RAS mutant and RAS WT patient samples. N=4 mutant versus N=4 wildtype patient specimens. E. Transcript levels of CD36 and ACADVL from Beat AML database for RAS mutant and RAS WT patient samples. N=21 mutant patient specimens versus N=256 wildtype patient specimens. Data are presented as mean values +/− SEMF. Flow cytometry of ven/aza sensitive and resistant LSCs for CD36. N=3 sensitive versus N= 5 resistant patient specimens. Data are presented as mean values +/− SD. G. Enrichment plot of fatty acid metabolism from University of Colorado ven/aza patient. N= 9 patients (6 responders/3 progressors). LSCs shown to be enriched in patients that progress on therapy. H. UMAP projection of CITE Seq data of 6 patient specimens including n = 3 ven+aza clinical resistant and n = 3 ven+aza sensitive patients with blast cluster identification on UMAP projection. I. UMAP projection colored for CD36 antibody level of 6 patient specimens.
Extended Data Table 1:
Statistical analysis of 136 patients treated at the University of Colorado with venetoclax and azacitidine. Univariate analysis of variables listed with odds ratio and p value of variable.
| Predictor | Value | Odds Ratio with 95% Confidence Interval | P-value |
|---|---|---|---|
| Age (median) | 70.5 years | 0.974 (0.95, 1.00) | 0.0773 |
| Sex | Male=67 (49.3%) Female=69 (50.7%) |
1.521 (0.64, 3.61) | 0.3411 |
| Prior Therapy | 28 (20.6%) | 4.012 (1.58, 10.2) | 0.0036 |
| SWOG Cytogenetic Risk Group | Favorable=0 (0%) Intermediate=61 (45.2) Unfavorable=62 (45.9%) Unknown=12 (8.9%) |
Unfavorable vs intermediate=4.580 (1.58, 13.3) | 0.0804 |
| FLT3 ITD | 29 (21.3%) | 0.853 (0.29, 2.50) | 0.7722 |
| NPM1 | 32 (23.5%) | 0.364 (010, 1.31) | 0.1208 |
| IDH1/IDH2 | 33 (24.3%) | 0.212 (005, 0.95) | 0.0431 |
| ASXL1 | 33 (24.3) | 0.922 (0.34, 2.53) | 0.8752 |
| PTPN11 | 8 (5.9%) | 4.818 (1.12, 20.7) | 0.0348 |
| RAS Pathway Mutation | 21 (15.4%) | 3.316 (1.20, 9.14) | 0.0205 |
| TP53 | 18 (13.2%) | 1.247 (0.37, 4.16) | 0.7195 |
| ELN Risk Group | Adverse=95 (70.4%) Intermediate=20 (14.8%) Favorable=20 (14.8%) |
Adverse vs intermediate=1.708 (0.46, 6.37) | 0.0787 |
SWOG=Southwest Oncology Group; FLT3= Fms-like tyrosine kinase 3; NPM1=nucleophosmin; IDH=isocitrate dehydrogenase; ASXL1=additional sex combs like 1; PTPN11=tyrosine-protein phosphatase non-receptor type 11; RAS=retrovirus-associated DNA sequences; TP53=tumor protein 53; ELN=European Leukemia Network
Extended Data Table 2:
Patient specimen characteristics for in vitro and in vivo assays
| AML | Status | Age/Sex | Cytogenetics | Genetics |
|---|---|---|---|---|
| 1 | De novo AML | 70/F | 46,XX[20] Normal | FLT3 TKD, NPM1, PTPN11 |
| 2 | De novo AML | 60/F | 46,XX,t(9;11)(p21;q23)[13]/47,sl,+21[4]/47,sl,+8[3] | KRAS, PTPN11 |
| 3 | De novo AML | 49/F | Normal karyotype (46, XX) | FLT3 ITD+; WT for CEBPA, NPM1, IDH1, IDH2, JAK2 |
| 4 | Relapse/Refracotry | 49/F | 46,XX[21] | FLT3 ITD+ |
| 5 | De novo AML | 52/M | 45,XY,−7[3]/46,sl,+r(7)(p11q21)[11]/46,sdl1,der(5)t(1;5)(q31;p14)[5]/46,XY[1] | ASXL1, DNMT3a, NOTCH, NRAS |
| 6 | De novo AML | 51/M | 46,XY,add(1)(p11),del(5)(q15q33),del(7)(q22q36),der(11)t(1;11)(p31;p12–14)[20], Loss of 5q31 and 7q31 | FLT3 ITD, BCOR, NOTCH1 |
| 7 | Relapse/Refracotry | 79/M | 46,XY,t(6;9) (p21;q34) | FLT3 ITD, FLT3 TKD, IDH2,PTP N11 |
| 8 | Relapse/Refracotry | 69/F | 46,XX,add(14)(q22)[4] | FLT3, IDH1, NPM1 |
| 9 | De novo AML | 53/M | 46,XY[20] | FLT3 ITD, NPM1, NRAS, STAG2, ASXL1, PTPN11, CEBPA |
| 10 | Relapse | 21/M | inv(16) (p13.1q22) | NA |
| 11 | De novo AML | 73/F | 45,XX,add(3)(q27),−7,add(8)(q24),t(9;22)(q34;q11.2)[4]/54,sl,+3,-add(3)(q27),+7,+8,+10,+12,+13,+15,+20,+der(22)t(9;22)(q34;q11.2)[16] | |
| 12 | Relapse | 47/M | 46,XY,del(7)(q21)[8]/46,sl,del(5)(q31q35), add(12)(p13)[7]/46,sl,add(12)(p13),del(17)(q21)[3]/46,XY,del(9)(q22q32)[2] | IDH1, CKIT |
Acknowledgments:
The authors sincerely thank the University of Colorado Hematology Clinical Trials Unit (HCTU) and the University of Colorado Health Apheresis team for essential help in acquisition of patient samples. We also acknowledge the Molecular and Cellular Analytical Core within the Colorado Nutrition and Obesity Research Center for the use of the Seahorse Analyzer. This work was supported by the Evans MDS Foundation young investigator award (B.M.S.); the Leukemia and Lymphoma Society, American Cancer Society 25A5072 and the Cancer League of Colorado (C.L.J.); the University of Colorado Department of Medicine Outstanding Early Career Scholar Program and the Leukemia and Lymphoma Society Clinical Scholars award (D.A.P.); Webb-Waring Early Career Award by the Boettcher Foundation, RM1GM131968 by the National Institute of General and Medical Sciences, R01HL146442 and R01HL148151 by the National Heart, Lung and Blood Institutes (A.D); the St. Baldrick’s Fellow award (A.W.) the Ruth and Ralph Seligman Chair in Hematology (C.S.); National Institutes of Health (NIH) National Cancer Institute (NCI) grant R01 CA200707 (C.T.J) and R01 CA243452 (C.T.J.); and a Leukemia and Lymphoma Society Specialized Center of Research (SCOR) grant (principal investigator – CTJ). C.T.J. is supported by the Nancy Carroll Allen Endowed Chair.
D.A.P. receives research funding from Abbvie and has served as a consultant for Abbvie.
Footnotes
Declaration of Interests:
The authors declare the following competing interests:
Data availability statement
Patient-related clinical data not included in the paper were generated as part of a multicenter clinical trial (NCT02203773). A detailed description of the dose escalation portion of the study has been published (Dinardo et al)2. All DNA and RNA raw and analyzed sequencing data can be found at the GEO database and are available via accession number GSE156041 and GSE143363 (single-cell RNA-seq) and accession number GSE156008 and GSE155431 (bulk RNA-seq). BeatAML dataset can be downloaded from cBIOPortal (under OHSU, Nature 2018). Source data are available for this study. Other data supporting the findings of this study are available from the corresponding author on reasonable request.
References:
- 1.Pollyea DA & Jordan CT Therapeutic targeting of acute myeloid leukemia stem cells. Blood 129, 1627–1635, 10.1182/blood-2016-10-696039 (2017). [DOI] [PubMed] [Google Scholar]
- 2.DiNardo CD et al. Venetoclax combined with decitabine or azacitidine in treatment-naive, elderly patients with acute myeloid leukemia. Blood 133, 7–17, 10.1182/blood-2018-08-868752 (2019). [DOI] [PMC free article] [PubMed] [Google Scholar]
- 3.Jones CL et al. Inhibition of Amino Acid Metabolism Selectively Targets Human Leukemia Stem Cells. Cancer Cell 34, 724–740 e724, 10.1016/j.ccell.2018.10.005 (2018). [DOI] [PMC free article] [PubMed] [Google Scholar]
- 4.Pollyea DA et al. Venetoclax with azacitidine disrupts energy metabolism and targets leukemia stem cells in patients with acute myeloid leukemia. Nat Med 24, 1859–1866, 10.1038/s41591-018-0233-1 (2018). [DOI] [PMC free article] [PubMed] [Google Scholar]
- 5.Lagadinou ED et al. BCL-2 inhibition targets oxidative phosphorylation and selectively eradicates quiescent human leukemia stem cells. Cell stem cell 12, 329–341, 10.1016/j.stem.2012.12.013 (2013). [DOI] [PMC free article] [PubMed] [Google Scholar]
- 6.Sriskanthadevan S et al. AML cells have low spare reserve capacity in their respiratory chain that renders them susceptible to oxidative metabolic stress. Blood 125, 2120–2130, 10.1182/blood-2014-08-594408 (2015). [DOI] [PMC free article] [PubMed] [Google Scholar]
- 7.Skrtic M et al. Inhibition of mitochondrial translation as a therapeutic strategy for human acute myeloid leukemia. Cancer cell 20, 674–688, 10.1016/j.ccr.2011.10.015 (2011). [DOI] [PMC free article] [PubMed] [Google Scholar]
- 8.Cole A et al. Inhibition of the Mitochondrial Protease ClpP as a Therapeutic Strategy for Human Acute Myeloid Leukemia. Cancer cell 27, 864–876, 10.1016/j.ccell.2015.05.004 (2015). [DOI] [PMC free article] [PubMed] [Google Scholar]
- 9.Chan SM et al. Isocitrate dehydrogenase 1 and 2 mutations induce BCL-2 dependence in acute myeloid leukemia. Nat Med 21, 178–184, 10.1038/nm.3788 (2015). [DOI] [PMC free article] [PubMed] [Google Scholar]
- 10.Jones CL et al. Cysteine depletion targets leukemia stem cells through inhibition of electron transport complex II. Blood, 10.1182/blood.2019898114 (2019). [DOI] [PMC free article] [PubMed]
- 11.DiNardo CD et al. Safety and preliminary efficacy of venetoclax with decitabine or azacitidine in elderly patients with previously untreated acute myeloid leukaemia: a non-randomised, open-label, phase 1b study. The Lancet. Oncology 19, 216–228, 10.1016/s1470-2045(18)30010-x (2018). [DOI] [PubMed] [Google Scholar]
- 12.DiNardo CD et al. Azacitidine and Venetoclax in Previously Untreated Acute Myeloid Leukemia. New England Journal of Medicine 383, 617–629 (2020). [DOI] [PubMed] [Google Scholar]
- 13.DiNardo CD et al. Clinical experience with the BCL2-inhibitor venetoclax in combination therapy for relapsed and refractory acute myeloid leukemia and related myeloid malignancies. Am J Hematol 93, 401–407, 10.1002/ajh.25000 (2018). [DOI] [PubMed] [Google Scholar]
- 14.Nechiporuk T et al. The TP53 Apoptotic Network Is a Primary Mediator of Resistance to BCL2 Inhibition in AML Cells. Cancer discovery 9, 910–925, 10.1158/2159-8290.Cd-19-0125 (2019). [DOI] [PMC free article] [PubMed] [Google Scholar]
- 15.Chen X et al. Targeting Mitochondrial Structure Sensitizes Acute Myeloid Leukemia to Venetoclax Treatment. Cancer discovery 9, 890–909, 10.1158/2159-8290.Cd-19-0117 (2019). [DOI] [PMC free article] [PubMed] [Google Scholar]
- 16.Karjalainen R et al. Elevated expression of S100A8 and S100A9 correlates with resistance to the BCL-2 inhibitor venetoclax in AML. Leukemia 33, 2548–2553, 10.1038/s41375-019-0504-y (2019). [DOI] [PubMed] [Google Scholar]
- 17.Kuusanmaki H et al. Phenotype-based drug screening reveals association between venetoclax response and differentiation stage in acute myeloid leukemia. Haematologica, 10.3324/haematol.2018.214882 (2019). [DOI] [PMC free article] [PubMed]
- 18.Pei S et al. Monocytic Subclones Confer Resistance to Venetoclax-Based Therapy in Acute Myeloid Leukemia Patients. Cancer discovery, 10.1158/2159-8290.Cd-19-0710 (2020). [DOI] [PMC free article] [PubMed]
- 19.Jones CL et al. Nicotinamide Metabolism Mediates Resistance to Venetoclax in Relapsed Acute Myeloid Leukemia Stem Cells. Cell stem cell, 10.1016/j.stem.2020.07.021 (2020). [DOI] [PMC free article] [PubMed]
- 20.Pei S et al. AMPK/FIS1-Mediated Mitophagy Is Required for Self-Renewal of Human AML Stem Cells. Cell stem cell 23, 86–100.e106, 10.1016/j.stem.2018.05.021 (2018). [DOI] [PMC free article] [PubMed] [Google Scholar]
- 21.Reisz JA, Zheng C, D’Alessandro A & Nemkov T Untargeted and Semi-targeted Lipid Analysis of Biological Samples Using Mass Spectrometry-Based Metabolomics. Methods in molecular biology (Clifton, N.J.) 1978, 121–135, 10.1007/978-1-4939-9236-2_8 (2019). [DOI] [PubMed] [Google Scholar]
- 22.Escudero S et al. Dynamic Regulation of Long-Chain Fatty Acid Oxidation by a Noncanonical Interaction between the MCL-1 BH3 Helix and VLCAD. Molecular cell 69, 729–743.e727, 10.1016/j.molcel.2018.02.005 (2018). [DOI] [PMC free article] [PubMed] [Google Scholar]
- 23.Perciavalle RM et al. Anti-apoptotic MCL-1 localizes to the mitochondrial matrix and couples mitochondrial fusion to respiration. Nature cell biology 14, 575 (2012). [DOI] [PMC free article] [PubMed] [Google Scholar]
- 24.Lee K. m. et al. MYC and MCL1 cooperatively promote chemotherapy-resistant breast cancer stem cells via regulation of mitochondrial oxidative phosphorylation. Cell metabolism 26, 633–647. e637 (2017). [DOI] [PMC free article] [PubMed] [Google Scholar]
- 25.Ramsey HE et al. A Novel MCL1 Inhibitor Combined with Venetoclax Rescues Venetoclax-Resistant Acute Myelogenous Leukemia. Cancer discovery 8, 1566–1581, 10.1158/2159-8290.Cd-18-0140 (2018). [DOI] [PMC free article] [PubMed] [Google Scholar]
- 26.Kotschy A et al. The MCL1 inhibitor S63845 is tolerable and effective in diverse cancer models. Nature 538, 477–482, 10.1038/nature19830 (2016). [DOI] [PubMed] [Google Scholar]
- 27.Shlush LI et al. Tracing the origins of relapse in acute myeloid leukaemia to stem cells. Nature 547, 104–108, 10.1038/nature22993 (2017). [DOI] [PubMed] [Google Scholar]
- 28.Ho TC et al. Evolution of acute myelogenous leukemia stem cell properties after treatment and progression. Blood 128, 1671–1678, 10.1182/blood-2016-02-695312 (2016). [DOI] [PMC free article] [PubMed] [Google Scholar]
- 29.Padanad MS et al. Fatty Acid Oxidation Mediated by Acyl-CoA Synthetase Long Chain 3 Is Required for Mutant KRAS Lung Tumorigenesis. Cell Rep 16, 1614–1628, 10.1016/j.celrep.2016.07.009 (2016). [DOI] [PMC free article] [PubMed] [Google Scholar]
- 30.Gouw AM et al. Oncogene KRAS activates fatty acid synthase, resulting in specific ERK and lipid signatures associated with lung adenocarcinoma. Proc Natl Acad Sci U S A 114, 4300–4305, 10.1073/pnas.1617709114 (2017). [DOI] [PMC free article] [PubMed] [Google Scholar]
- 31.Samudio I et al. Pharmacologic inhibition of fatty acid oxidation sensitizes human leukemia cells to apoptosis induction. The Journal of Clinical Investigation 120, 142–156, 10.1172/JCI38942 (2010). [DOI] [PMC free article] [PubMed] [Google Scholar]
- 32.Farge T et al. Chemotherapy-Resistant Human Acute Myeloid Leukemia Cells Are Not Enriched for Leukemic Stem Cells but Require Oxidative Metabolism. Cancer discovery 7, 716–735, 10.1158/2159-8290.Cd-16-0441 (2017). [DOI] [PMC free article] [PubMed] [Google Scholar]
- 33.Tabe Y et al. Inhibition of FAO in AML co-cultured with BM adipocytes: mechanisms of survival and chemosensitization to cytarabine. Scientific Reports 8, 16837, 10.1038/s41598-018-35198-6 (2018). [DOI] [PMC free article] [PubMed] [Google Scholar]
- 34.Nemkov T, D’Alessandro A & Hansen KC Three-minute method for amino acid analysis by UHPLC and high-resolution quadrupole orbitrap mass spectrometry. Amino acids 47, 2345–2357, 10.1007/s00726-015-2019-9 (2015). [DOI] [PMC free article] [PubMed] [Google Scholar]
- 35.Nemkov T, Reisz JA, Gehrke S, Hansen KC & D’Alessandro A High-Throughput Metabolomics: Isocratic and Gradient Mass Spectrometry-Based Methods. Methods in molecular biology (Clifton, N.J.) 1978, 13–26, 10.1007/978-1-4939-9236-2_2 (2019). [DOI] [PubMed] [Google Scholar]
- 36.Gehrke S et al. Red Blood Cell Metabolic Responses to Torpor and Arousal in the Hibernator Arctic Ground Squirrel. J Proteome Res 18, 1827–1841, 10.1021/acs.jproteome.9b00018 (2019). [DOI] [PMC free article] [PubMed] [Google Scholar]
- 37.Brunetti L, Gundry MC, Kitano A, Nakada D & Goodell MA Highly Efficient Gene Disruption of Murine and Human Hematopoietic Progenitor Cells by CRISPR/Cas9. J Vis Exp, 10.3791/57278 (2018). [DOI] [PMC free article] [PubMed]
Associated Data
This section collects any data citations, data availability statements, or supplementary materials included in this article.
Data Availability Statement
Patient-related clinical data not included in the paper were generated as part of a multicenter clinical trial (NCT02203773). A detailed description of the dose escalation portion of the study has been published (Dinardo et al)2. All DNA and RNA raw and analyzed sequencing data can be found at the GEO database and are available via accession number GSE156041 and GSE143363 (single-cell RNA-seq) and accession number GSE156008 and GSE155431 (bulk RNA-seq). BeatAML dataset can be downloaded from cBIOPortal (under OHSU, Nature 2018). Source data are available for this study. Other data supporting the findings of this study are available from the corresponding author on reasonable request.


