

Abstract
We used a semantic feature-matching task combined with multivoxel pattern decoding to test contrasting accounts of the role of the default mode network (DMN) in cognitive flexibility. By one view, DMN and multiple-demand cortex have opposing roles in cognition, with DMN and multiple-demand regions within the dorsal attention network (DAN) supporting internal and external cognition, respectively. Consequently, while multiple-demand regions can decode current goal information, semantically relevant DMN regions might decode conceptual similarity regardless of task demands. Alternatively, DMN regions, like multiple-demand cortex, might show sensitivity to changing task demands, since both networks dynamically alter their patterns of connectivity depending on the context. Our task required human participants (any sex) to integrate conceptual knowledge with changing task goals, such that successive decisions were based on different features of the items (color, shape, and size). This allowed us to simultaneously decode semantic category and current goal information using whole-brain searchlight decoding. As expected, multiple-demand cortex, including DAN and frontoparietal control network, represented information about currently relevant conceptual features. Similar decoding results were found in DMN, including in angular gyrus and posterior cingulate cortex, indicating that DMN and multiple-demand regions can support the same function rather than being strictly competitive. Semantic category could be decoded in lateral occipital cortex independently of task demands, but not in most regions of DMN. Conceptual information related to the current goal dominates the multivariate response within DMN, which supports flexible retrieval by modulating its response to suit the task demands, alongside regions of multiple-demand cortex.
SIGNIFICANCE STATEMENT We tested contrasting accounts of default mode network (DMN) function using multivoxel pattern analysis. By one view, semantically relevant parts of DMN represent conceptual similarity, regardless of task context. By an alternative view, DMN tracks changing task demands. Our semantic feature-matching task required participants to integrate conceptual knowledge with task goals, such that successive decisions were based on different features of the items. We demonstrate that DMN regions can decode the current goal, as it is applied, alongside multiple-demand regions traditionally associated with cognitive control, speaking to how DMN supports flexible cognition.
Keywords: control, decoding, default mode network, feature representation, multiple demand, semantic, decoding
Introduction
Human cognition is flexible, enabling us to select appropriate information from memory, according to current goals. Multiple-demand (MD) cortex, which overlaps with frontal-parietal control network (FPCN) and dorsal attention network (DAN), has an established role in cognitive flexibility (Duncan, 2010), showing stronger responses in more demanding conditions across tasks (Fedorenko et al., 2013; Turnbull et al., 2019a,b) and activation patterns that can classify task-critical details in an adaptive fashion (Erez and Duncan, 2015; Cole et al., 2016; Bracci et al., 2017; Qiao et al., 2017). However, the role of other heteromodal brain regions, such as regions of default mode network (DMN), is more poorly understood.
In a ground-breaking study, Crittenden et al. (2015) found that regions within DMN represent task information (Soon et al., 2008; Kahnt et al., 2011; Reverberi et al., 2012; Giordano et al., 2013; Woolgar et al., 2016; Wen et al., 2020), alongside FPCN. However, their task rules covaried with the stimuli and were established when stimuli were presented; consequently, this study cannot determine whether the DMN response reflects the retrieval of task information from long-term memory or the maintenance and application of goals to tailor ongoing cognition, in a way that resembles “adaptive coding” within MD cortex.
DMN and DAN are proposed to subserve internally and externally directed cognition, respectively, and functionally couple with different subsystems of FPCN (Spreng et al., 2010, 2013; Dixon et al., 2018). DMN is highly heteromodal and is thought to support information integration (Simony et al., 2016; Lanzoni et al., 2020), which is relevant to both long-term episodic memory (Sestieri et al., 2011) and semantic cognition (Binder and Desai, 2011; Wirth et al., 2011; Krieger-Redwood et al., 2016). Semantically relevant DMN regions, including left angular gyrus (AG) and lateral temporal cortex, show less deactivation, relative to rest, when semantic and nonsemantic tasks are compared (Binder et al., 1999, 2009; Humphreys et al., 2015), even when task difficulty is taken into account (Binder et al., 2005; Seghier et al., 2010; Murphy et al., 2018). These observations suggest that DMN might support similarity structures in long-term memory, such as global conceptual similarity (Murphy et al., 2017; Wang et al., 2020), as well as goal information when this information is retrieved from memory.
However, DMN–DAN interactions vary significantly across different cognitive states and their functional connectivity fluctuates between periods of anticorrelation and positive correlation (Dixon et al., 2017). Therefore, DMN might be sensitive to changing external task demands, together with MD cortex. DMN is situated at the top of a cortical hierarchy, exhibiting the greatest distance (both physically and in connectivity space) from primary sensory/motor regions (Margulies et al., 2016). On this heteromodal-to-unimodal gradient, FPCN and DMN regions occupy adjacent locations and have similar representational content (González-García et al., 2018). Moreover, DMN supports detailed thoughts about demanding tasks as well as off-task states (Sormaz et al., 2018). Collectively, these observations suggest that DMN might maintain currently relevant information that can bias ongoing processing, rather than always reflecting conceptual similarity in long-term memory (Crittenden et al., 2015; Murphy et al., 2017; Smith et al., 2018).
In the present study, we contrasted these interpretations to establish the contribution of the DMN to controlled semantic cognition and its relationship with MD regions within FPCN and DAN. We examined whether patterns of response across DMN capture long-term semantic similarity or the short-term behavioral relevance of specific semantic features. Participants were asked to match items from three categories according to color, shape, or size, with the goal switching on each trial. We minimized memory retrieval demands of the task switch by telling participants explicitly what to do on each trial. In this way, our design disentangled the representation and application of goals for semantic retrieval from the structure of knowledge in long-term memory. To anticipate, goal information could be decoded in both MD regions and DMN, while semantic category decoding was restricted to lateral occipital and anterior temporal cortex.
Materials and Methods
Participants
The research was approved by the York Neuroimaging Center and Department of Psychology ethics committees. Thirty-one healthy adults were recruited from the University of York (26 females; age mean ± SD age, 20.60 ± 1.68 years; age range, 18–25 years). All participants were right handed, native English speakers, with normal or corrected-to-normal vision and no history of psychiatric or neurologic illness. All volunteers provided written informed consent. One participant with incomplete data (only one of two sessions) was removed. Two more participants were removed because of low accuracy (3 SDs below the mean). This study provides new analyses of a dataset first reported by Wang et al. (2020).
Another 240 native English speakers who did not take part in the main fMRI experiment rated the color and shape similarity (154 females; age range, 18–24 years).
Design and procedure
Participants completed the following two fMRI sessions. In the first session, they performed a semantic feature-matching task, in which we varied the goal (i.e., the feature to be matched) and the semantic category of the probe word. This allowed us to directly contrast the decoding of goal-relevant features and long-term semantic similarity. In the second session, participants completed easy and hard spatial working memory and arithmetic tasks (Fedorenko et al., 2011, 2013; Blank et al., 2014) designed to localize MD and DMN regions. The contrast of hard versus easy versions of these tasks robustly activates MD cortex (Fedorenko et al., 2013; Blank et al., 2014), while the easy versus hard contrast activates DMN (McKiernan et al., 2003; Leech et al., 2011; Fedorenko et al., 2013). In this way, we could establish the overlap between regions representing goal and category information in MD and DMN at the individual level.
Behavioral tasks
Semantic feature-matching task
Participants matched probe and target concepts (presented as words) according to a particular semantic feature (color, shape, or size), specified at the start of each trial in a rapid event-related design (Fig. 1). Two-third of trials were matching trials in which probe and target shared the target feature (i.e., color: strawberry and cherry are both red) and one-third were nonmatching trials in which probe and target did not share the target feature (i.e., color: lemon and raspberry have different colors, although they are semantically related). Participants pressed a button with their right index finger to indicate a matching trial and responded with their right middle finger to indicate a nonmatching trial. All the probe words belonged to one of the following three categories: animal, tool, and plant. This gave rise to nine combinations of goal feature and probe category, with 36 items for each condition. These trials were divided evenly into four runs. The order of runs and trials within each run was randomized across subjects. Each run lasted for 600 s. The target words were drawn from a wider range of categories than the probe words. Probe and target words were matched on word length (number of letters), word frequency (based on SUBTLEX-UK: subtitle-based word frequencies for British English; van Heuven et al., 2014) and word concreteness (Brysbaert et al., 2014) across conditions, respectively. Participants were provided with feedback during task training but not during the main experiment.
Figure 1.
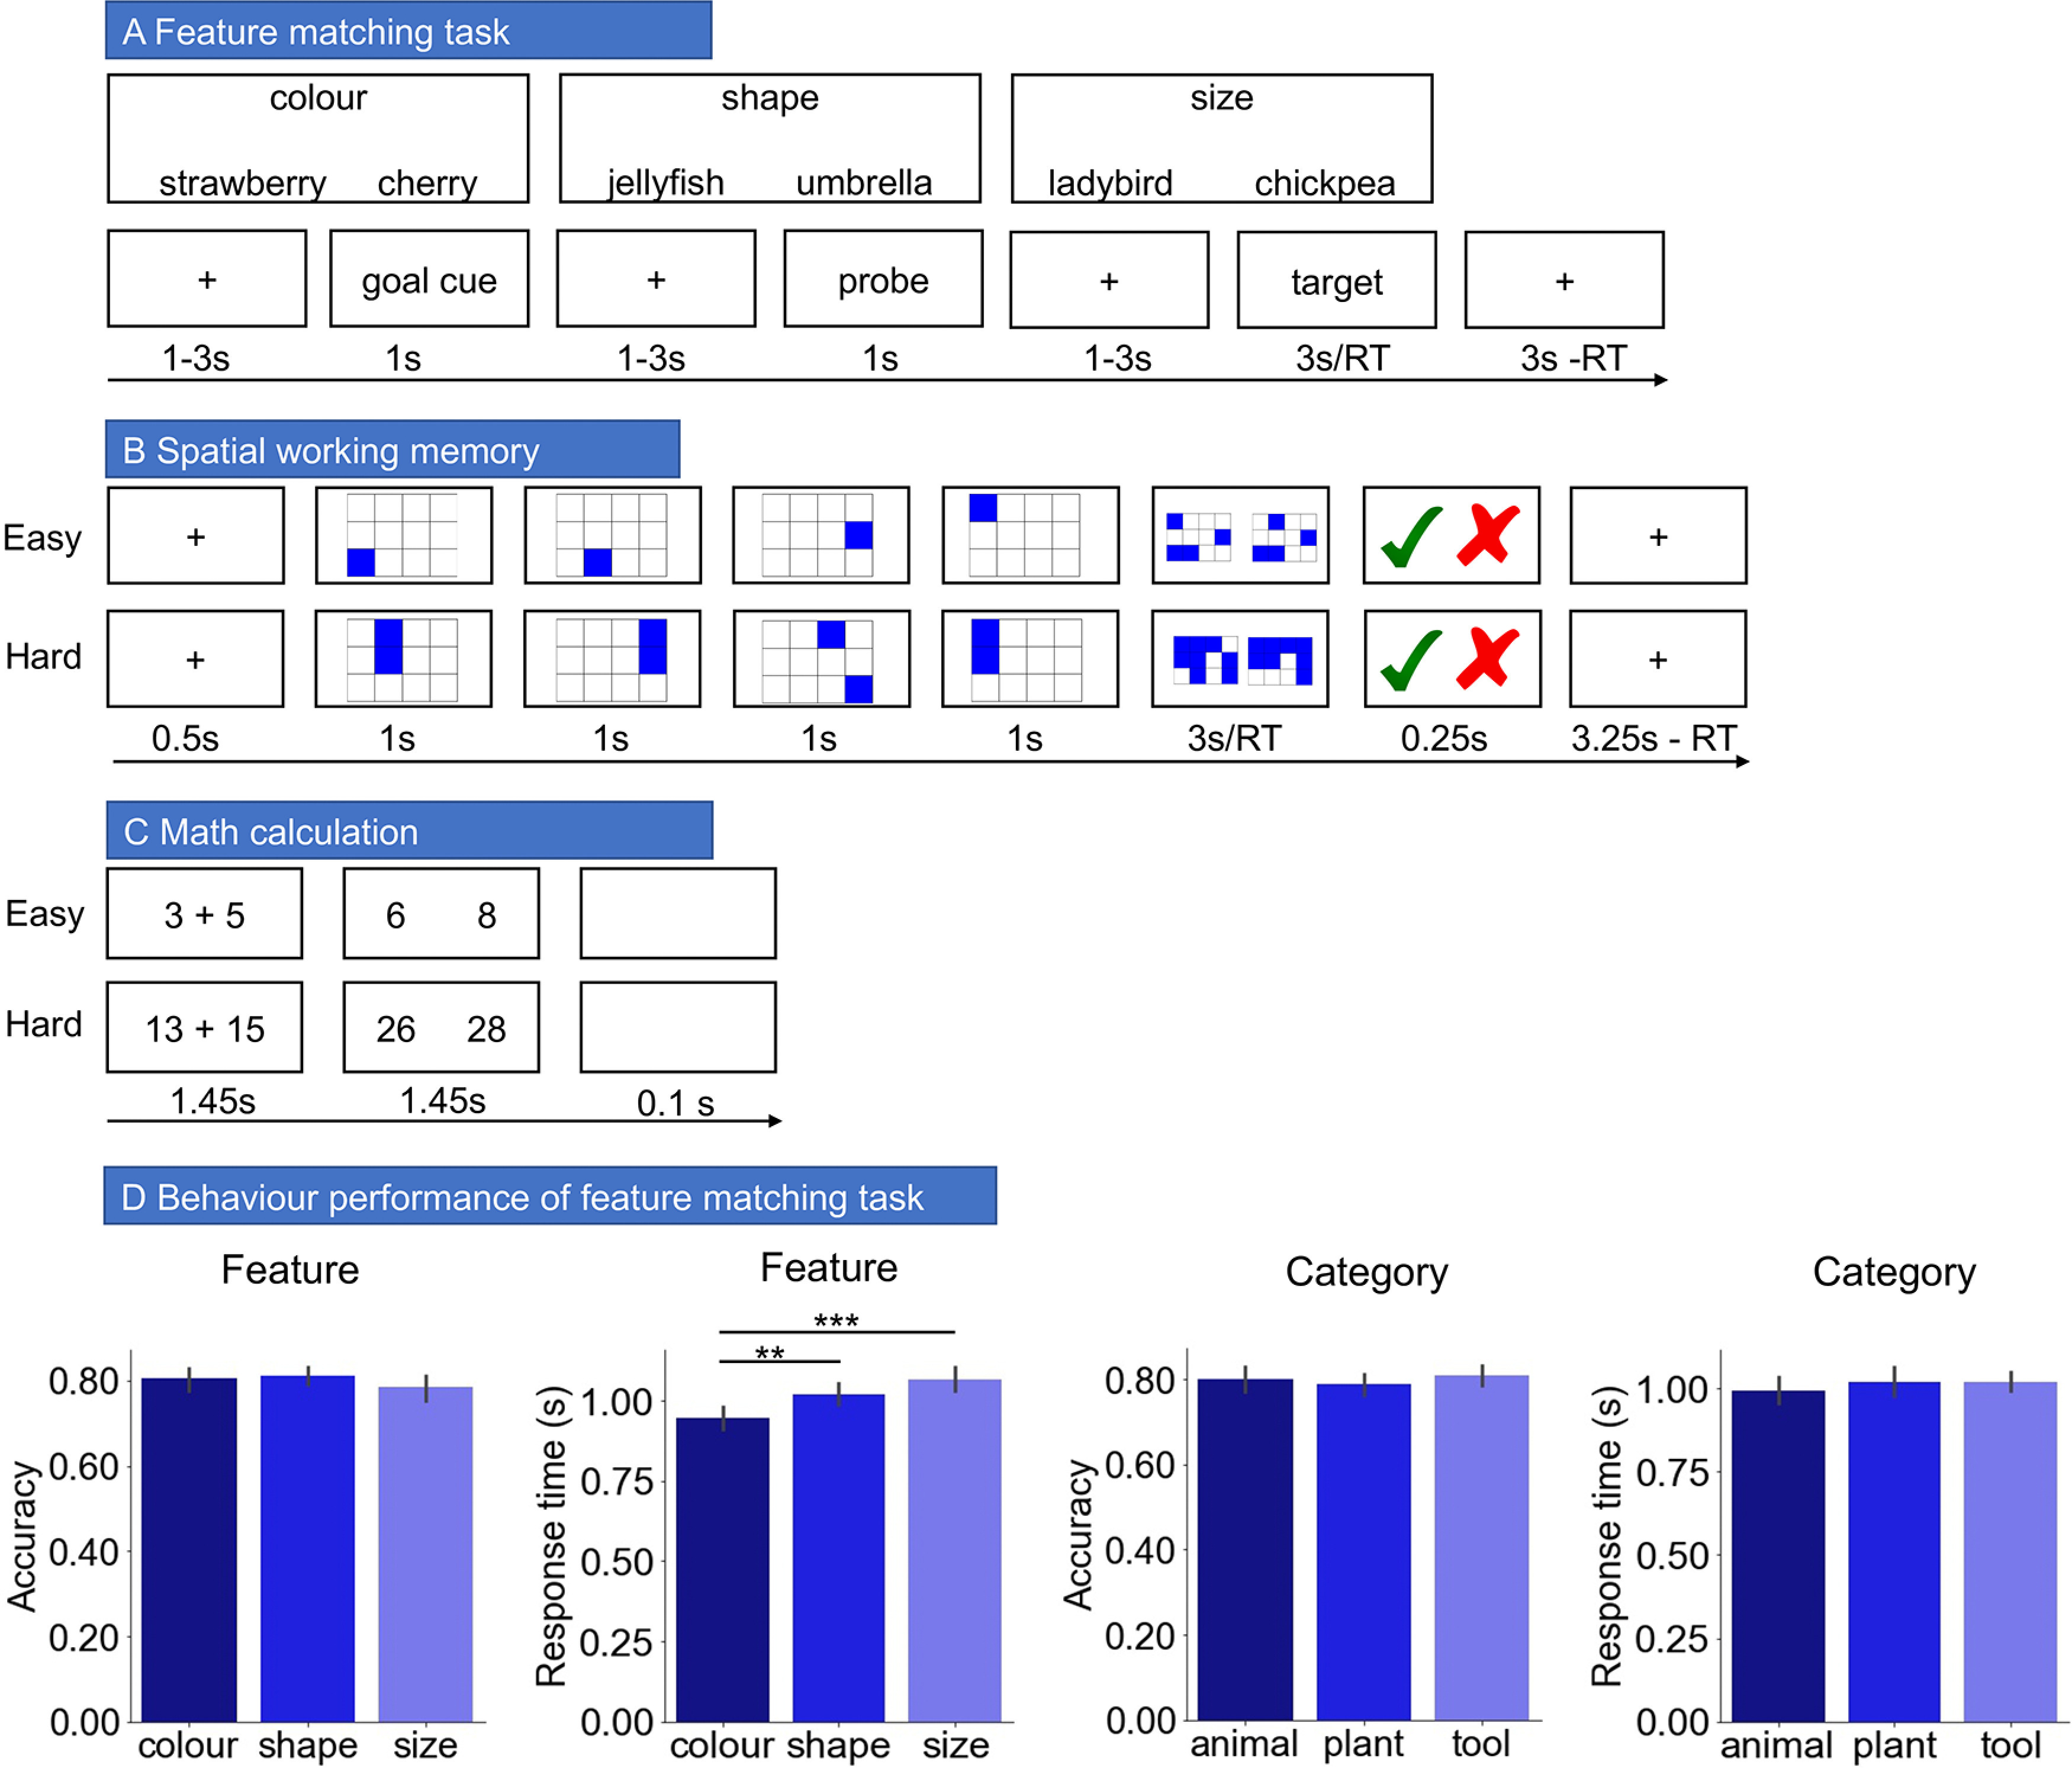
A–C, Illustration of semantic feature-matching task, spatial working memory task, and math task. D, The behavioral performance of semantic feature matching task. **p < 0.01; ***p < 0.001.
To maximize the statistical power of the rapid event-related fMRI data analysis, the stimuli were presented with a temporal jitter, randomized from trial to trial (Dale, 1999). The interstimulus intervals (between goal cue and probe word, and probe and target word) and the intertrial interval varied from 1 to 3 s. Each trial started with a fixation, followed by a goal cue slide specifying the feature to match (color, shape, or size), presented for 1 s. This was followed by the second fixation and then the probe word, presented for 1 s. Finally, there was the third fixation followed by the target word, triggering the onset of the decision-making period. The target remained visible until the participant responded, for a maximum of 3 s. After participants pressed the button, a fixation was presented for 3 s minus the response time (RT) of that trial. The goal cue, probe, and target words were presented centrally on the screen. Both response time and accuracy were recorded.
A trial consisted of three events, as follows: (1) a goal cue to indicate the relevant feature for the trial; (2) a probe word; and (3) a target word, which was followed by a response. Based on these events, we separated each trial into three different time periods, as follows: a “goal cue period,” a “probe word period,” and a “target word period.” Our main analysis concerned the probe word period since, for this time point, we were able to perform both goal and category decoding for the same items. We also performed secondary analyses using the goal cue period and the target word period.
Spatial working memory task
Participants had to keep track of four or eight sequentially presented locations in a 3 × 4 grid (Fedorenko et al., 2011), giving rise to easy and hard spatial working memory conditions. Stimuli were presented at the center of the screen across four steps. Each of these steps lasted for 1 s and highlighted one location on the grid in the easy condition and two locations in the hard condition. This was followed by a decision phase, which showed two grids side by side. One grid contained the locations shown on the previous four steps, while the other contained one or two locations in the wrong place. Participants indicated their recognition of these locations in a two-alternative, forced-choice paradigm via a button press, and feedback was immediately provided. Each run consisted of 12 experimental blocks (6 blocks/condition and four trials in a 32 s block) and four fixation blocks (each 16 s long), resulting in a total time of 448 s. This task included two runs containing the two conditions, in a standard block design. Condition order was counterbalanced across runs, and run order was counterbalanced across participants for each task.
Math task
In this task, participants performed addition with smaller or larger numbers, giving rise to easy and hard conditions. Participants saw an arithmetic expression on the screen for 1.45 s and were then given two numbers as potential answers, for 1.45 s. Each trial ended with a blank screen lasting for 0.1 s. Each run consisted of 12 experimental blocks (with four trials per block) and four fixation blocks, resulting in a total time of 316 s. This task included two runs containing the two conditions, presented in a standard block design. Condition order was counterbalanced across runs, and run order was counterbalanced across participants for each task. All the stimuli were presented using Psychopy (Peirce, 2007).
FMRI data acquisition
Structural and functional data were collected on a 3 T MRI scanner (Prisma, Siemens) at the York Neuroimaging Center. The scanning protocols included a T1-weighted MPRAGE sequence with whole-brain coverage. The following structural scan was used: acquisition matrix, 176 × 256 × 256; voxel size, 1 × 1 × 1 mm3; repetition time (TR) = 2300 ms; and echo time (TE) = 2.26 ms. Functional data were acquired using an EPI sequence with an 80° flip angle and using GRAPPA (generalized autocalibrating partial parallel acquisition) with an acceleration factor of 2 in 3 × 3 × 4 mm voxels in 64 axial slices. The functional scan used was as follows: 55 3-mm-thick slices acquired in an interleaved order (with 33% distance factor); TR = 3000 ms; TE = 15 ms; and FOV = 192 mm.
MRI data preprocessing
Functional and structural data preprocessing for classification was conducted using the FMRIB Software Library (FSL version 6; fsl.fmrib.ox.ac.uk/fsl/fslwiki/FEAT/). The T1-weighted structural brain images were extracted. Structural images were registered to the MNI-152 template using the FMRIB linear image registration tool (FLIRT). fMRI data preprocessing included motion correction, slice-timing correction, and high-pass filtering at 100 s. Motion-affected volumes were detected and then were fully removed from the fMRI data (using scrubbing; Power et al., 2012). No spatial smoothing was applied at this point to preserve fine-grained patterns of voxel activations (Haynes and Rees, 2006).
Experimental design and statistical analysis
Classification analysis examining categorical distinctions between goal states focused on the probe word period when both goal and semantic category were manipulated. First, a univariate analysis was used to identify the regions showing stronger activation when performing the task relative to rest. Univariate fMRI analyses used one-sample two-tailed t tests to compare responses against baseline. Second, we conducted a univariate analysis to establish the parameter estimates for each feature and each category. Next, whole-brain searchlight classification analysis revealed regions in which the multivariate response classified the goal and/or semantic category. We performed supplementary whole-brain searchlight classification analyses during the goal cue and target word periods. These analyses examined goal but not category decoding since the goal cues preceded the presentation of concepts, and category was not manipulated for the target word. We also conducted temporal generalization classification analysis (training a classifier in one time period (e.g., during the presentation of the probe word) and then testing it in a different time period (e.g., during the goal cue or target word) to reveal the representational content during the probe period.
A complementary analysis used whole-brain searchlight representational similarity analyses (RSA) during the probe period to examine the representation of goal-relevant semantic features; this analysis identified regions in which neural similarity was higher when the goal-relevant features were more similar. Both classification and RSAs used one-sample one-tailed t tests to test for greater-than-chance representation of each information type. For each analysis, multiple comparisons (across brain voxels) were accounted for by controlling the familywise error (FWE) at 0.05, unless noted otherwise.
Univariate analysis of the semantic feature-matching task
To estimate the effects of task demands during the semantic feature-matching task and to extract the β-value for each feature and/or probe word, general linear models (GLMs) were built. The epochs of each trial included the goal cue period, two interstimulus interval periods, the probe word period, and the target word period. Trials were modeled by convolving each epoch with a canonical hemodynamic response function (HRF). When each epoch of interest was modeled, all the remaining periods and incorrect trials were modeled as regressors of no interest to separate different trial periods. For example, when building the GLM to extract the β-value for each feature for probe word, trials were modeled as epochs lasting from probe onset to probe offset convolved with a canonical HRF. We modeled other time points as regressors of no interest, including the goal cue period from goal cue word onset to offset, the target word period from target word onset to response, the two interstimulus interval periods and the incorrect trials. We included the within-trial interstimulus intervals as regressors of no interest (removing them from the implicit baseline) since participants were maintaining feature and probe information during these two periods. Six head motion parameters were further included in the GLM as regressors of no interest to control for potential confounding effects of head motion. After model estimation, the whole-brain β-weight image for the period of interest, contrasting the relevant time point with the implicit baseline (i.e., the fixation period preceding the goal cue words), was used to capture the relevant pattern of activation.
Univariate analysis of the main task effect.
To estimate the effects of task demands during the semantic feature-matching task, spatial smoothing with a 5 mm FWHM Gaussian filter was applied. The main effect of task was modeled using epochs lasting from the target onset to response, thus controlling for lengthened BOLD responses on trials with longer response times. The four runs of each task were included in a fixed-effects model for each individual. Group-level analyses were conducted using a cluster-forming threshold of z > 3.1, with p < 0.05 (corrected for FWE rate using random field theory).
First-level univariate model of probe word period for classification analysis.
To extract the β-value for each feature (color, shape, and size), for each run, in each voxel of the brain for goal decoding, the preprocessed unsmoothed data were analyzed in subject native space. A GLM was built for each run for each participant. One regressor was created for each feature. Trials were modeled as epochs lasting from probe onset to probe offset. To increase the statistical power, we created more data points by randomly but evenly dividing all the correct trials of each feature in each run into three subdatasets and then averaging them within each subdataset (for similar implementations, see Connolly et al., 2012; Cole et al., 2016; Hebart et al., 2018). This resulted in three data points per feature per run per subject (e.g., nine observations), which were z-scored within each run at each voxel (Hanke et al., 2009; Connolly et al., 2012).
Univariate models were also used to extract the β-value for each category (animal, tool, and plant), for each run, in each voxel of the brain for category decoding. The procedure reproduced the methods above, except that three regressors were created for each category for each run. This resulted in three data points per feature per run per subject (e.g., nine observations), which were z-scored within each run for each voxel.
Obtaining whole-brain activation pattern of each probe word for RSA.
For each probe word, a GLM was estimated, which included one regressor containing the onset of a given probe word and another regressor containing the onsets of all other probe word trials. This approach has been shown to be more representative of the true activation magnitudes unique to each trial type than other model estimation methods for rapid event-related designs (Mumford et al., 2012). These activation maps were z-scored within each run for each voxel.
Decoding analysis of goal information during probe word period
We performed a whole-brain searchlight decoding analysis to investigate which regions represent categorical goal information (i.e., regions that classify the distinction between color, shape, and size trials). Classifiers were trained and tested on individual subject data transformed into MNI standard space using the z-scored β-values for each feature. Classification training and testing were performed using a leave-one-run-out cross-validation strategy. There were 27 total brain patterns (9 patterns/feature) to train the classifier and 9 total brain patterns (3 patterns/feature) to test the classifier each time. We tested the discriminability of patterns for the three goals using a whole-brain searchlight with a radius of 6 mm (number of voxels = 123; Kriegeskorte et al., 2006) with linear support vector machines (SVMs; Vapnik and Chapelle, 2000; LIBSVM, http://www.csie.ntu.edu.tw/∼cjlin/libsvm/) implemented within PyMVPA (Hanke et al., 2009). Classification accuracy for each sphere was assigned to the central voxel of the sphere to produce decoding accuracy maps. The resulting maps were smoothed with a Gaussian kernel (6 mm FWHM). We performed a group analysis based on pattern-information maps to determine whether accuracy maps were above chance levels (accuracy, >0.33; Kriegeskorte et al., 2006). We conducted a one-sample permutation t test using the Randomize tool in FSL (5000 permutations; https://fsl.fmrib.ox.ac.uk/fsl/fslwiki/Randomize/). Threshold-free cluster enhancement (TFCE; Smith and Nichols, 2009) was used to identify significant clusters. The final results were thresholded at a TFCE cluster-corrected p value < 0.05 after controlling for FWE rate.
Decoding analysis of category information during probe word period
We performed a whole-brain searchlight decoding analysis to investigate whether there are any regions that represent task-unrelated semantic category information. The procedures were as above, except we extracted the z-scored β-values for each category (animal, tool, plant) for training and testing.
Goal-decoding analysis of goal cue and target word periods
Our main analysis examined the probe word period, which allowed decoding of both goal and semantic category. To understand the nature of goal representation during the probe word period, we performed secondary analyses of the goal cue and target word periods, examining the decoding of goal information. The goal cue period was modeled using a fixed duration (1 s). For the target word period, as there were differences in response time across conditions, we included this variable as a parametric regressor in the GLM for all trials with a fixed duration (1 s; for similar implementations, see Todd et al., 2013; Waskom et al., 2014; Erez and Duncan, 2015). In addition, we used another method to control for the lengthened BOLD response as a result of longer response times: we modeled the event duration using a variable epoch approach, from target onset to response. We then computed the voxel-wise β-patterns and performed the whole-brain searchlight analysis as before. The results were largely unchanged.
To further investigate what drives goal representation during the probe period, we conducted whole-brain searchlight decoding analyses examining temporal generalization (Isik et al., 2014; King and Dehaene, 2014) of these activation patterns. The procedures followed the whole-brain searchlight analyses above, except that we trained a classifier during one task period, and tested the classifier during another period. For example, we trained the classifier using the voxel-wise β weight images corresponding to different goals during the goal cue period and tested the classifier in the probe period and vice versa. We also examined goal decoding across probe and target periods. Training and testing samples were always taken from different runs to ensure full separation of the signal across these time periods. We directly compared decoding accuracy maps capturing the generalization between probe and target periods with levels of generalization between goal cue and probe periods using paired t tests. The final results were thresholded at a TFCE cluster-corrected p value < 0.05.
Representational similarity analysis of the probe word period
To examine the extent to which neural patterns during the probe period reflected the similarity of goal-relevant but not goal-irrelevant semantic features across trials, we conducted RSA (Kriegeskorte et al., 2008) using a searchlight procedure (Kriegeskorte et al., 2006) in each individual participant. RSA allowed us to relate neural pattern similarity elicited by the probe word to (1) the patterns of feature similarity across probe words, for both task-relevant and task-irrelevant features; and (2) to overall semantic similarity, based on word usage. For example, the neural patterns elicited by probes such as “watermelon” and “cucumber” in the color-matching task were related to color feature similarity (high similarity for this pair as both items are green, and task relevant for this color-matching task), shape feature similarity (low similarity for this pair, and task irrelevant), and overall semantic similarity (high similarity for this pair as both items are “fruits and vegetables”).
Object feature representational dissimilarity matrices.
Participants rated the pairwise color and shape similarity of all the probe words in the color trials (N = 72) and shape trials (N = 72) on a 7 point scale (1, most dissimilar; 7, most similar). For each object feature, color, and shape, representational similarity matrices (RSMs) were obtained by averaging across individual similarity matrices. The group mean object color representational dissimilarity matrix (RDM) and shape RDM were identified by subtracting the color and shape group mean RSMs from the maximum similarity score on the rating scale. Ratings were not available for size similarity.
Semantic distance-based RDM.
The semantic distance-based RDM reflected the distance between word vectors in terms of their co-occurrence patterns over a large corpus of text. We used the published pretrained vectors trained on part of the Google News dataset, using the word2vec algorithm (https://code.google.com/archive/p/word2vec/). The model contains 300-dimensional vectors for 3 million words and phrases. The phrases were obtained using a simple data-driven approach described in the study by Mikolov et al. (2013). The word2vec algorithm computes continuous vector representations of words based on the skip-gram architecture (Mikolov et al., 2013). The semantic distance was measured as 1 – the cosine angle between feature vectors of each word pair. One probe word from the color trials and two probe words in the shape trials were not included in the word2vec corpus and therefore excluded from the semantic distance calculation.
Voxel-wise whole-brain searchlight RSA.
We examined the neural dissimilarities in probe activation during color and shape trials separately, and compared these neural dissimilarities to RDMs for task-relevant features (either color or shape), task-irrelevant features (either color or shape), and global semantic dissimilarity. To investigate semantic color representation, for each voxel within the gray matter mask, we extracted the multiword activation patterns within a sphere centered at that voxel (radius = 6 mm, corresponding to 123 voxels) and computed a 72 × 72 neural RDM, using 1 – Pearson correlations of all word pairs in the color trials over all voxels within the sphere. Then we calculated the Spearman's rank correlation between the neural RDM and the color RDM, as well as the partial Spearman's rank correlation, controlling for semantic distance-based RDM. We calculated the Spearman's rank correlation between the neural RDM and shape RDM. We also calculated the Spearman's rank correlation between the neural RDM and semantic distance-based RDM. The resulting correlation maps were Fisher transformed and spatially smoothed using a 6 mm FWHM Gaussian kernel. A one-sample permutation t test was conducted. The final results were thresholded at a TFCE cluster-corrected p value < 0.05. We present overlapping regions for the correlation and partial correlation group-level t tests where both were significantly greater than zero.
We performed a whole-brain searchlight RSA to investigate whether there are any regions that represent object shape knowledge of shape trials. The procedures were as above, except we extracted the z-scored β-values for each probe word in the shape trials and calculated the Spearman's rank correlation between the neural RDM and shape RDM and the partial Spearman's rank correlation, controlling for semantic distance-based RDM.
Regions of interest-based RSA.
Given that for shape trials, in a whole-brain analysis, we did not find a significant correlation between the neural RDM and shape RDM, to guard against type II errors, we examined whether object shape was represented in regions of interest (ROIs) that represent goal (see Fig. 4F; regarding the definition of these ROIs, see subsection ROI-based decoding analysis of goal information).
Figure 4.
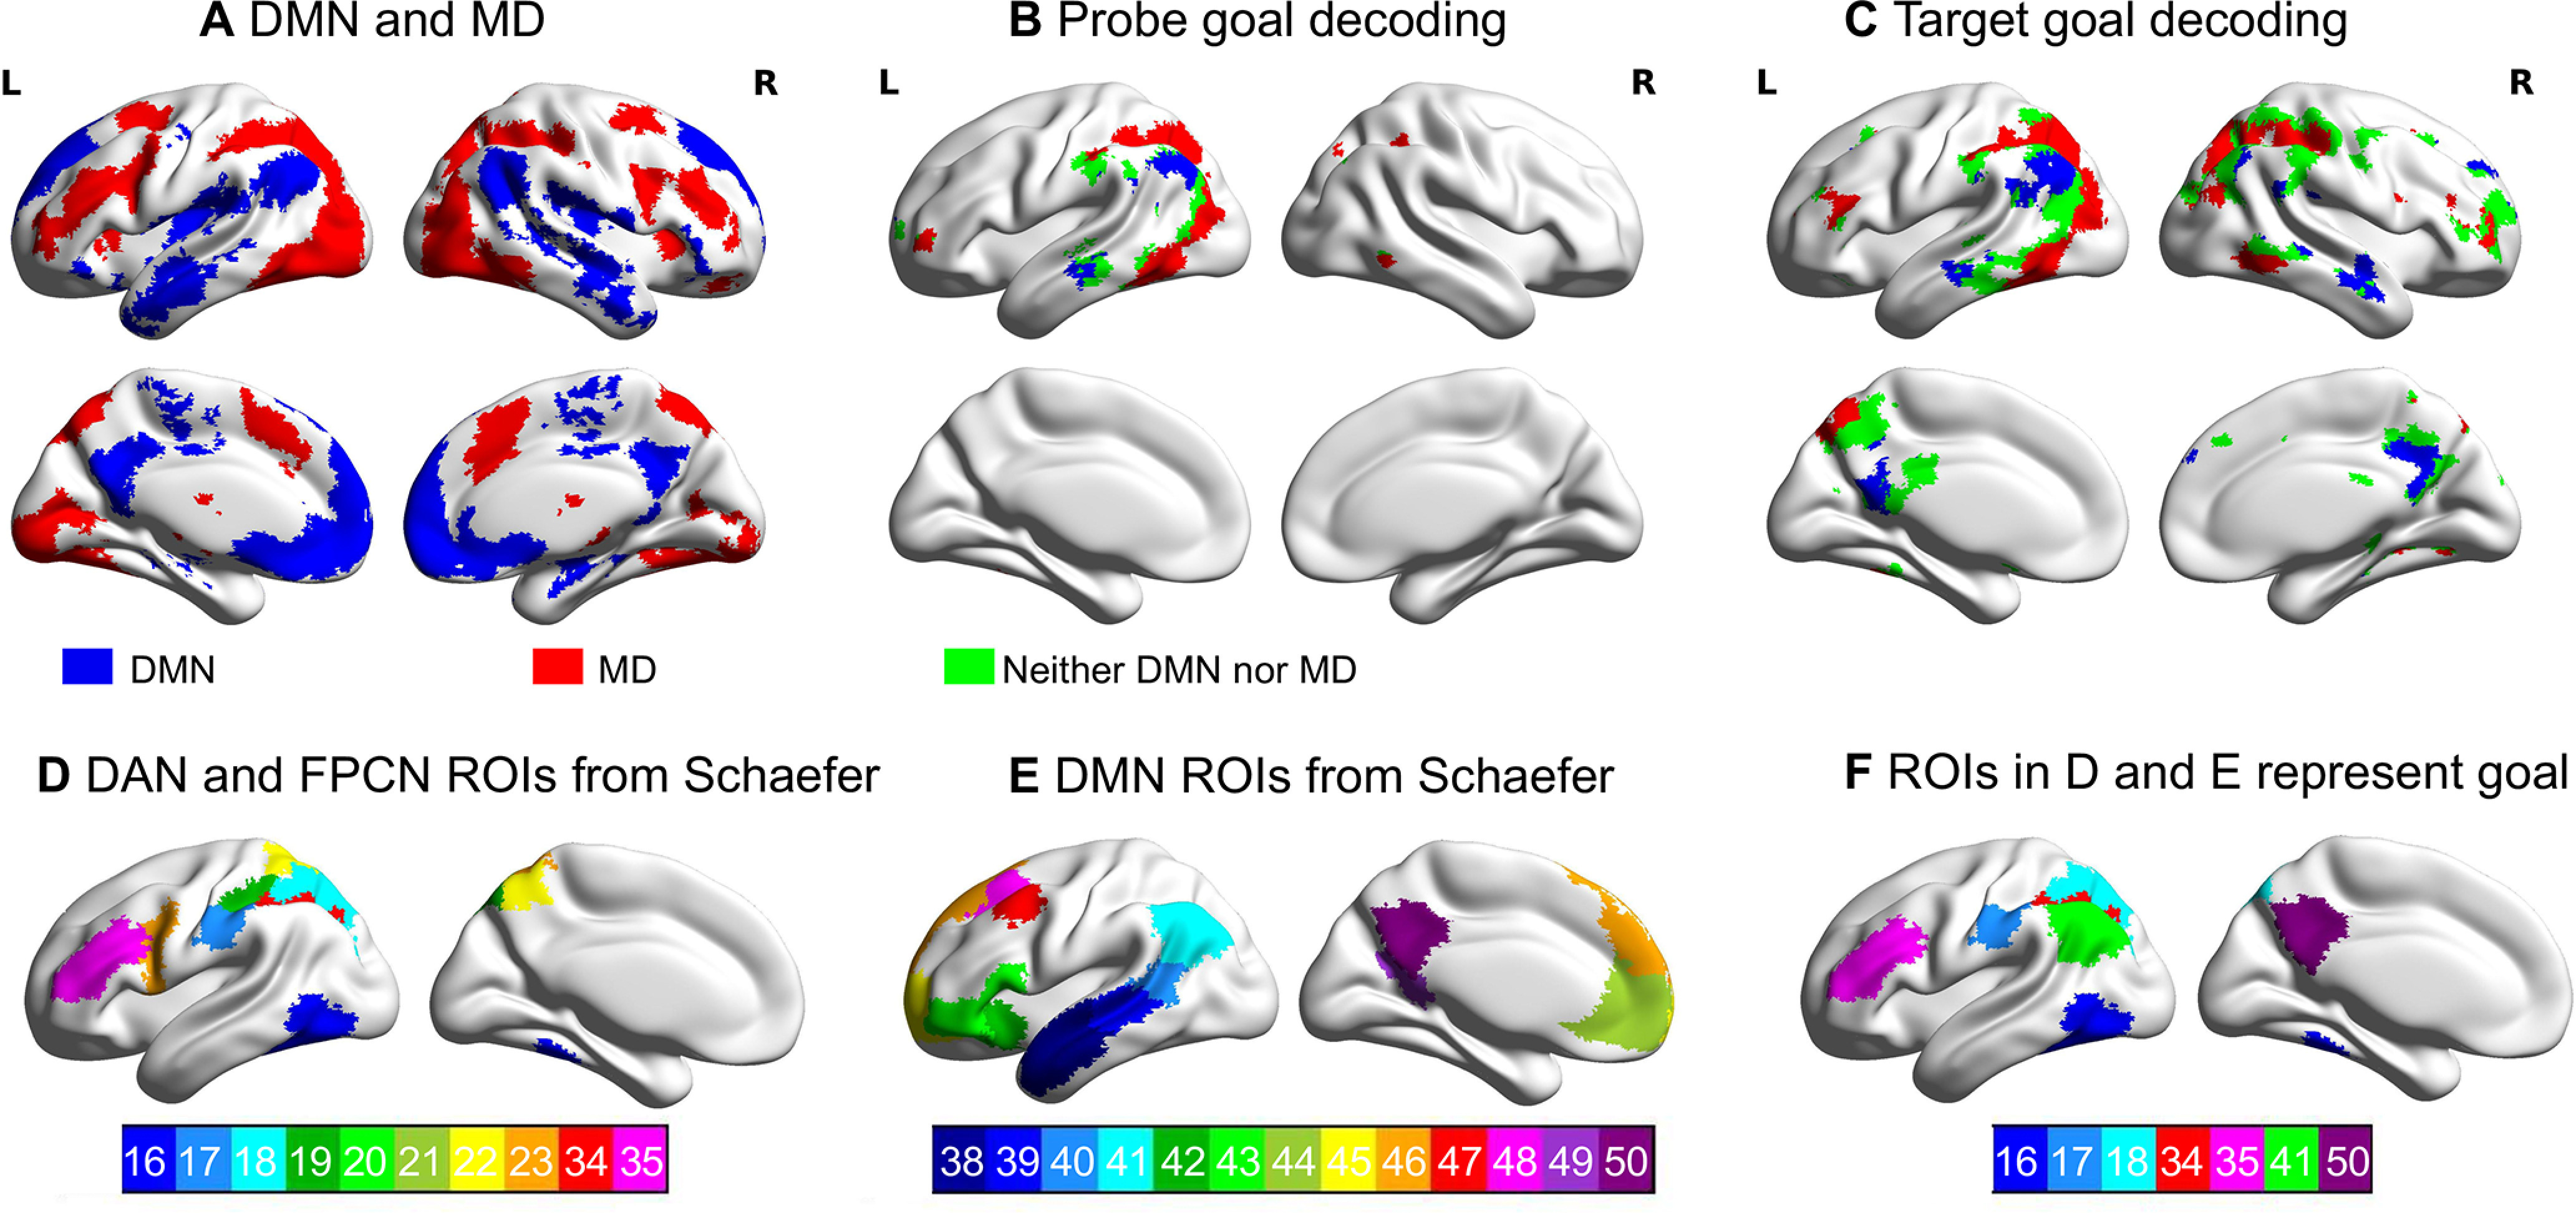
Top panels, Regions representing goal information overlap with DMN and MD cortex defined by the localizer tasks. A, DMN and MD cortex defined using the localizer tasks. B, C, The overlap between regions representing goal information and DMN (blue) and MD cortex (red) during the probe and the target period, respectively. Regions that overlap with neither DMN nor MD cortex are in green. Bottom panels, ROIs defined for the ROI-based goal-decoding analysis. D, E, ROIs within the DAN (16∼23) and FPCN (34∼35) and within the DMN (38∼50), as defined by Schaefer et al. (2018). F, ROIs that could decode goal information (FWE corrected, p < 0.05). The numbers refer to the ROI index provided by Schaefer et al. (2018).
In an ROI-based RSA, we computed the neural RDM of all word pairs within each ROI. We then calculated the Spearman's rank correlations between the neural RDM and the shape RDM and the Spearman's partial rank correlations after controlling for the semantic distance-based RDM for each participant for each ROI. The correlation values were z-transformed. To examine whether the correlations were different from zero, one-sample t tests were conducted for each ROI. Since multiple ROIs were included, the permutation-based maximum t statistic method was used for adjusting the p values of each ROI to control the FWE rate.
Localizer task analysis
In the spatial working memory task and math tasks, we examined the contrast of hard versus easy trials to define MD regions, and the contrast of easy versus hard trials to define DMN regions. The two runs of each task were included in a fixed-effects model for each individual. Group-level analyses were conducted using a cluster-forming threshold of z > 3.1, corrected at p < 0.05 (for FWE rate using random field theory). Results were visualized using BrainNet Viewer (Xia et al., 2013).
To investigate whether regions that represent goal information overlap with MD cortex or DMN, we compared the goal-decoding results with both our localizer contrasts and intrinsic connectivity networks defined by Yeo et al. (2011).
ROI-based decoding analysis of goal information
To more precisely locate the regions that represent goal information, we conducted ROI-based classification analysis within participant-specific functional ROIs within DAN, FPCN, and DMN. Within these networks, we selected the voxels that were most strongly activated for each participant by the functional localizer tasks. For DAN and FPCN, individual subject ROIs were defined using the hard > easy contrast in the spatial working memory and math localizer tasks (see Fig. 4A). For DMN, individual subject ROIs were defined using the easy > hard contrast (see Fig. 4B). We selected the top 50% of voxels with the highest t values, within network regions defined by Schaefer et al. (2018).
We conducted ROI-based classification for the probe and target word periods. We created a null model to assess the significance of decoding performance at the group level. We first randomly shuffled the class labels within run, with 5000 permutations for each participant. This established an empirical distribution of decoding accuracy scores under the null hypothesis where there is no association between BOLD activation and class labels (Ojala and Garriga, 2010). To control for multiple comparisons across regions and time periods, we constructed a distribution of the maximum accuracy across these tests on each resample (Nichols and Holmes, 2002). Then we took the mean of the null distribution for each test as an empirical measure of chance and subtracted this from the observed accuracy. We computed a one-sample permutation t test across the group for each test (for similar implementations, see Waskom et al., 2014).
Relationship between behavioral performance and classification results
Since activity in DMN and MD cortex is known to be modulated by task difficulty, we tested the possibility that goal discrimination in these networks is related to behavioral measures of task difficulty. We defined seven ROIs (see Fig. 4F) that could decode the goal in these networks (Schaefer et al., 2018). We then correlated the classification accuracy in each ROI with the absolute difference in response time between task features.
Data availability
All summary data, materials, and codes used in the analysis are accessible in the Open Science Framework at https://osf.io/vn7ws/.
Results
Behavioral results
There was no significant difference in accuracy across trials probing the three feature goals (F(2,213) = 1.027, p = 0.360). However, there were significant differences in response time (F(2,213) = 12.444, p < 0.0001). Color decisions were faster than both shape decisions (p < 0.006) and size decisions (p < 0.0005), which did not differ (p < 0.163). There were no significant differences in accuracy (F(2,213) = 0.688, p < 0.504) or response times across categories (F(2,213) = 0.742, p < 0.478; Fig. 1D).
Univariate activation in the semantic feature-matching task
There was activation in MD and visual regions when performing the semantic feature-matching task, including bilateral middle frontal gyrus, bilateral intraparietal sulcus, bilateral presupplementary motor area, bilateral medial occipital cortex, left premotor cortex, and left lateral occipital cortex (LOC; Fig. 2A). To examine whether the activation pattern was stable, we reran the analysis using a longer period to define the task, from the onset of the probe word, including the fixation between probe and target word, plus the target word period, as the task regressor. We captured the activation pattern by contrasting this long task period with the implicit baseline. We got a similar result, which is provided at https://osf.io/vn7ws/. The unthresholded map for the semantic feature-matching task correlated with the unthresholded MD localizer maps derived from the spatial working memory task (r = 0.38, p < 0.0001) and math task (r = 0.44, p < 0.0001), suggesting that semantic feature matching was relatively demanding.
Figure 2.
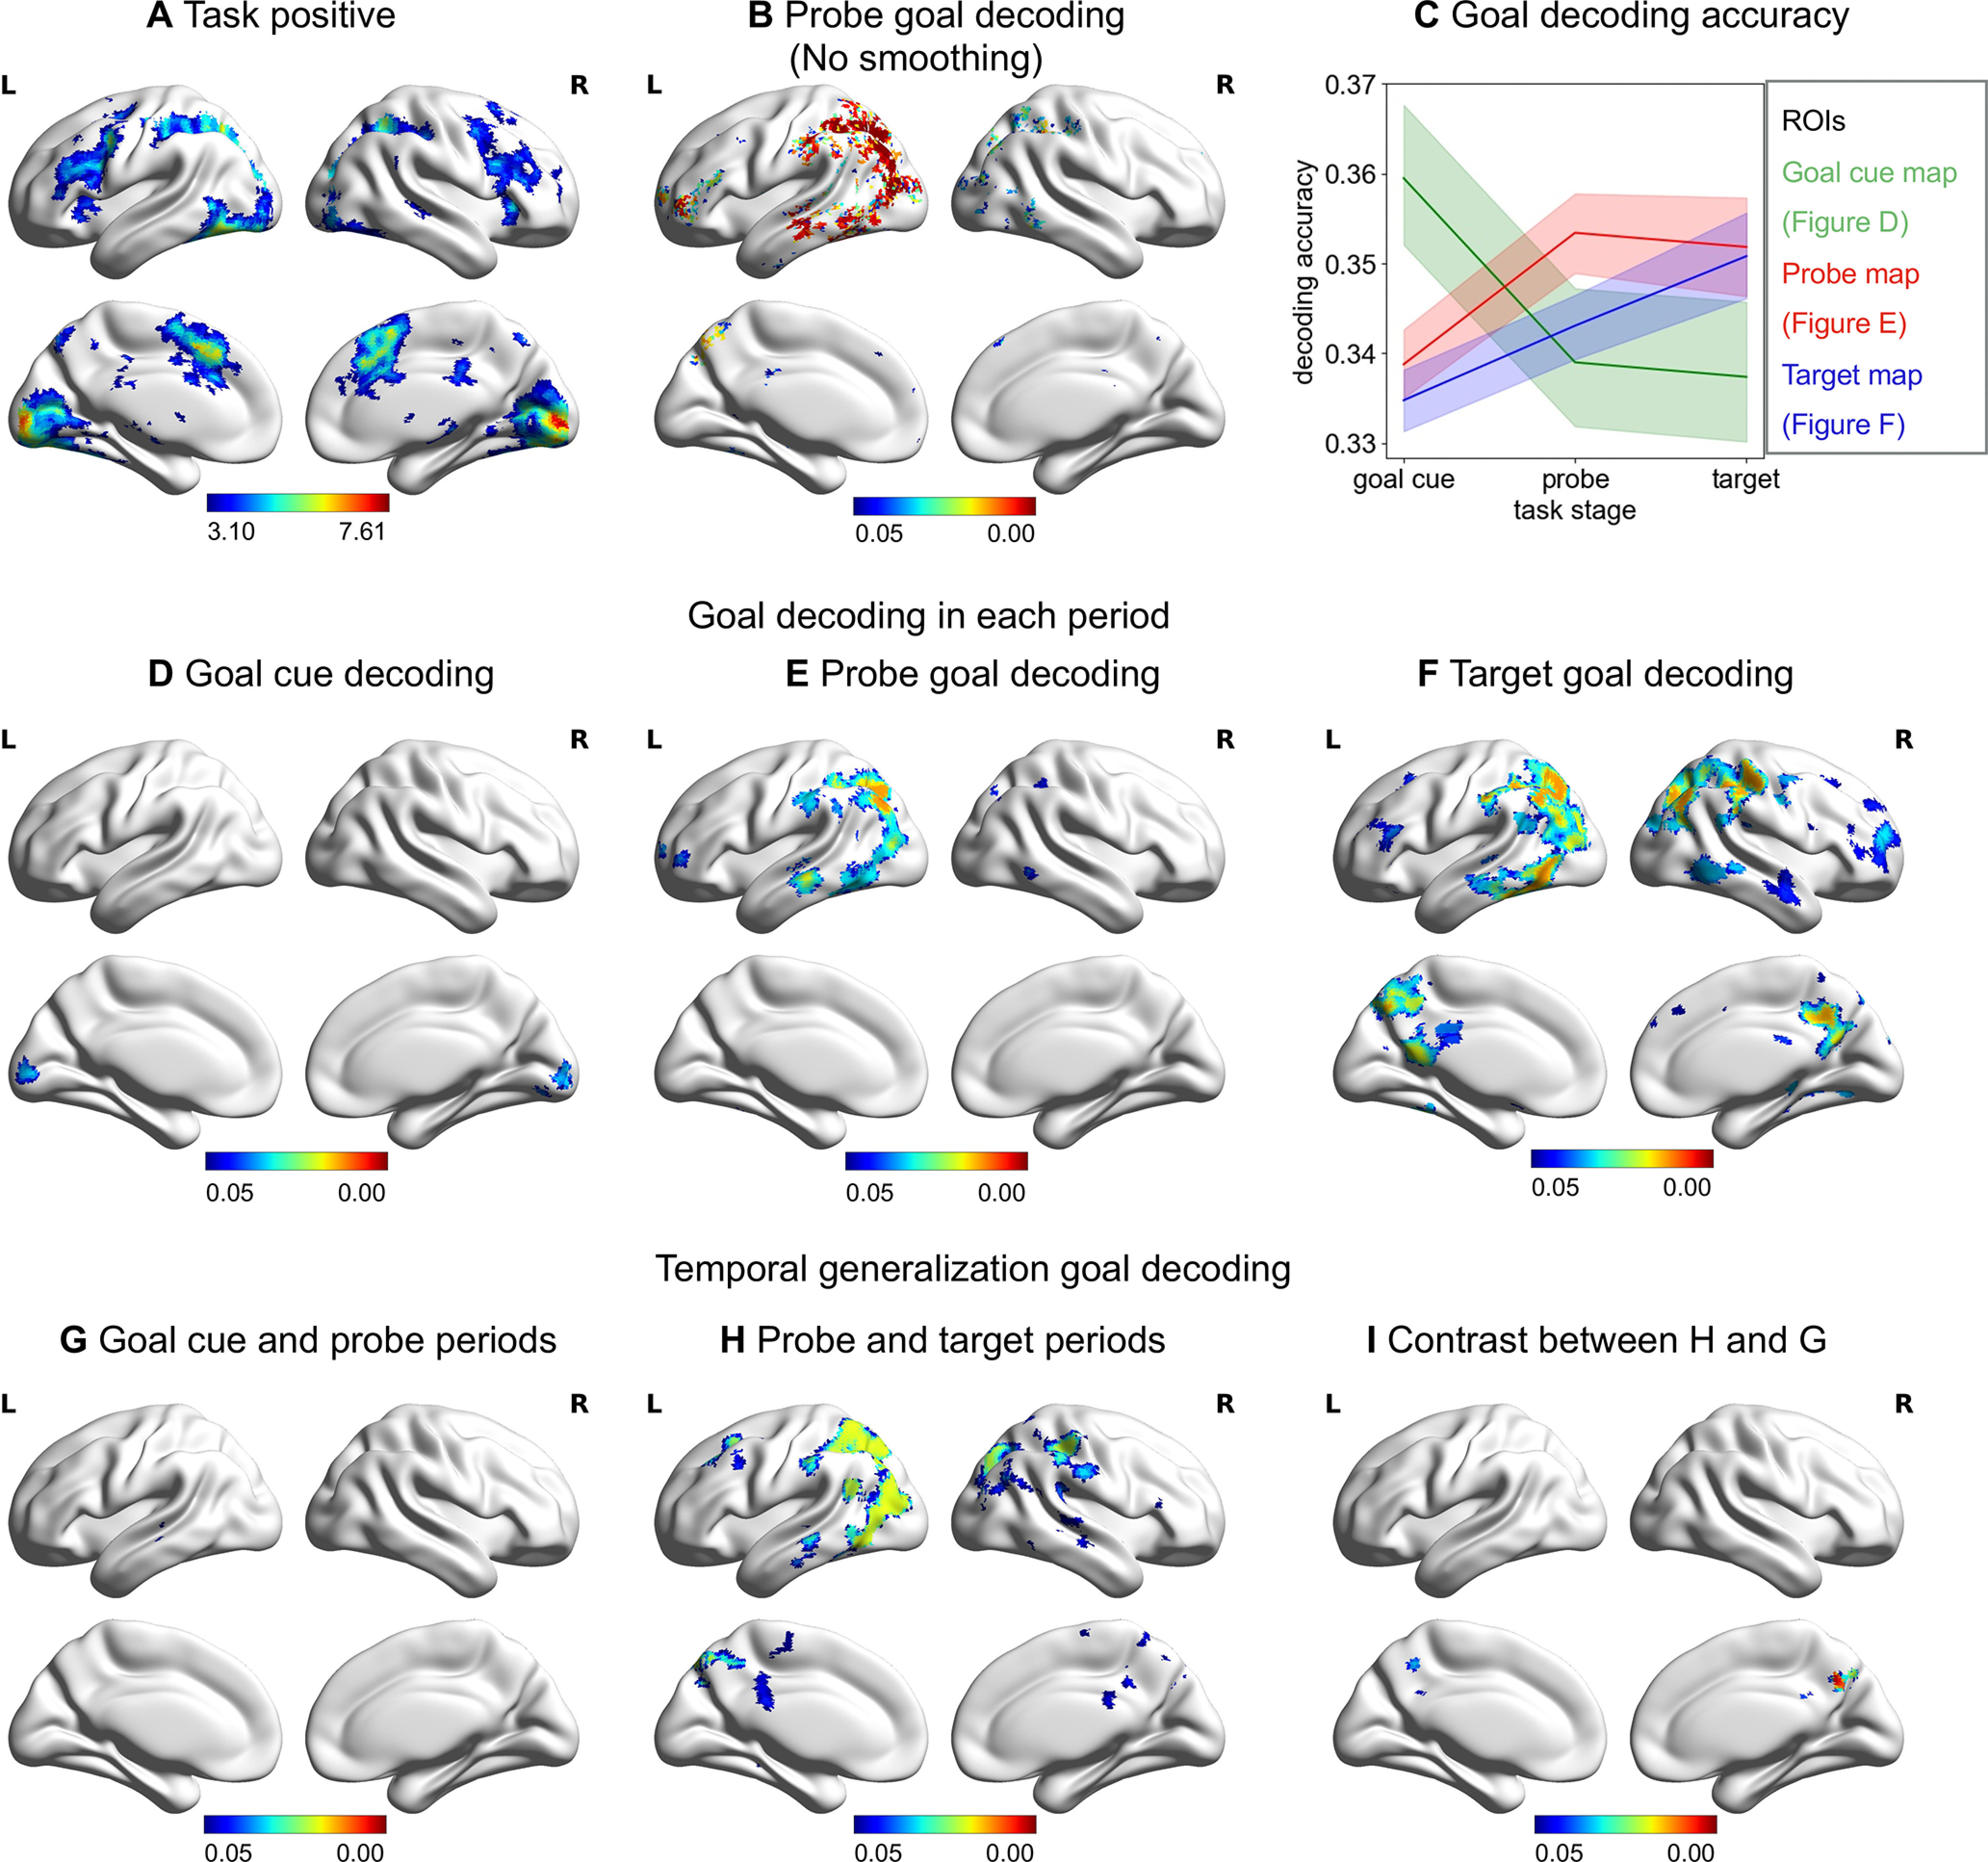
Regions involved in the semantic feature matching task that represent goal in each period and across periods. A, Univariate response to the semantic feature matching task. B, Regions that represent goal information for probe period (no smoothing). C, Schematic summarizing the decoding accuracy of each set of regions found to represent goal information during the goal cue period (green), probe (red), and target (blue) periods. D–F, Regions that represent goal information for each period (smoothed). G, H, Temporal generalization decoding between goal cue and probe periods and between probe and target periods. I, The regions where decoding accuracy between probe and target periods are significantly higher than decoding accuracy between goal cue and probe periods. All the maps are thresholded at FWE-corrected p < 0.05.
Decoding of goal information during goal cue, probe, and target word periods
We performed a decoding analysis to identify regions that could represent goal information. This analysis considered the effect of task similarity on neural similarity and should be sensitive to categorical representations of goal feature (i.e., the difference between color and shape trials, regardless of whether the colors of the probe concepts were similar between trials). We found that goal was decodable during the probe word period in left inferior frontal gyrus, left superior parietal lobule, left intraparietal sulcus, left AG, left LOC, and left posterior middle temporal gyrus (Fig. 2E). Given the spatial proximity of DMN and MD regions, we reran the decoding analysis without smoothing at the group level and found similar results (Fig. 2B).
Decoding of goal information during the probe word period might potentially reflect visual or language processes related to the goal cue word (since each goal was defined with a different word). If this was the case, we would expect to see similar goal classification results in the earlier goal cue period, as well as later during the presentation of the probe words, within visual and/or language regions. Alternatively, decoding of goal during the probe word period might reflect rule maintenance and implementation. If this were the case, we reasoned that the classification results would overlap between probe and target periods, when the goal was being maintained and implemented, but not between probe/target and goal cue periods (before the goal could be implemented as no concept had been presented at that stage of the task).
In the goal cue period, we found that goal information could be decoded in bilateral calcarine sulcus and lingual gyrus (Fig. 2D). This likely reflects the early visual representation of the orthographic goal cue words (i.e., the words “color,” “shape,” and “size”). This decoding map did not overlap with the searchlight analysis of the probe word period. In the target word period, goal information could be decoded in bilateral inferior frontal gyrus, bilateral superior parietal lobe, bilateral intraparietal sulcus, bilateral AG, precuneus cortex, posterior cingulate cortex (PCC), posterior inferior temporal gyrus, and posterior middle temporal gyrus (Fig. 2F). There was a 68% overlap in the voxels that could classify goal during the probe and target word periods. Decoding of the target word period yielded similar results when we controlled response time in a different way by modeling the event duration using a variable epoch approach (these results were highly correlated; r = 0.70, p < 0.0001; results are provided at https://osf.io/vn7ws/).
We used spatial correlations to assess the similarity of goal decoding during the goal cue, probe, and target word periods. There was a significant correlation between the decoding accuracy maps for the goal cue and probe word period (r = 0.42, p < 0.0001). There was also a correlation between decoding accuracy for probe and target word periods (r = 0.55, p < 0.0001), and this correlation was significantly stronger (z = 39.71, p = 0.0001). To illustrate this pattern, we defined the regions that represented goal information in each period as ROIs and then extracted the decoding accuracy of each ROI in each period (Fig. 2C).
To further investigate what drives goal representation during the probe period, we conducted whole-brain searchlight temporal generalization decoding. We reasoned that if the goal decoding during the probe period reflects visual or language processes related to the goal cue word, a classifier trained during the goal cue period should be able to decode goal in the probe period, at least within visual and/or language regions. Alternatively, if the decoding of goal during the probe period reflects rule maintenance and implementation, a classifier trained during the target period should be able to decode goal in the probe period within common brain regions.
When we examined the multivariate response across the goal cue and probe periods, there was one small cluster (216 voxels) in left middle temporal gyrus (FWE corrected, p < 0.05; Fig. 2G). There were extensive regions that could decode goal information between the probe and target periods, including left middle temporal gyrus, PCC, and LOC (FWE corrected, p < 0.05; Fig. 2H). The decoding accuracy between the probe and target periods was significantly higher than between the goal cue and probe periods in bilateral PCC (FWE corrected, p < 0.05; Fig. 2I). This provides confirmatory evidence that DMN shows a multivariate response relating to goal information, beyond visual or lexical responses to the goal cue word.
Regions representing goal information overlap with DMN and MD cortex
To investigate whether regions that represent goal information fall within DMN and MD cortex (i.e., DAN and FPCN), we compared the decoding results to seven networks derived from a resting-state parcellation of 1000 brains (Yeo et al., 2011). Regions representing goal information during the probe and target periods overlapped primarily with DAN, FPCN, DMN, and visual networks (Fig. 3).
Figure 3.
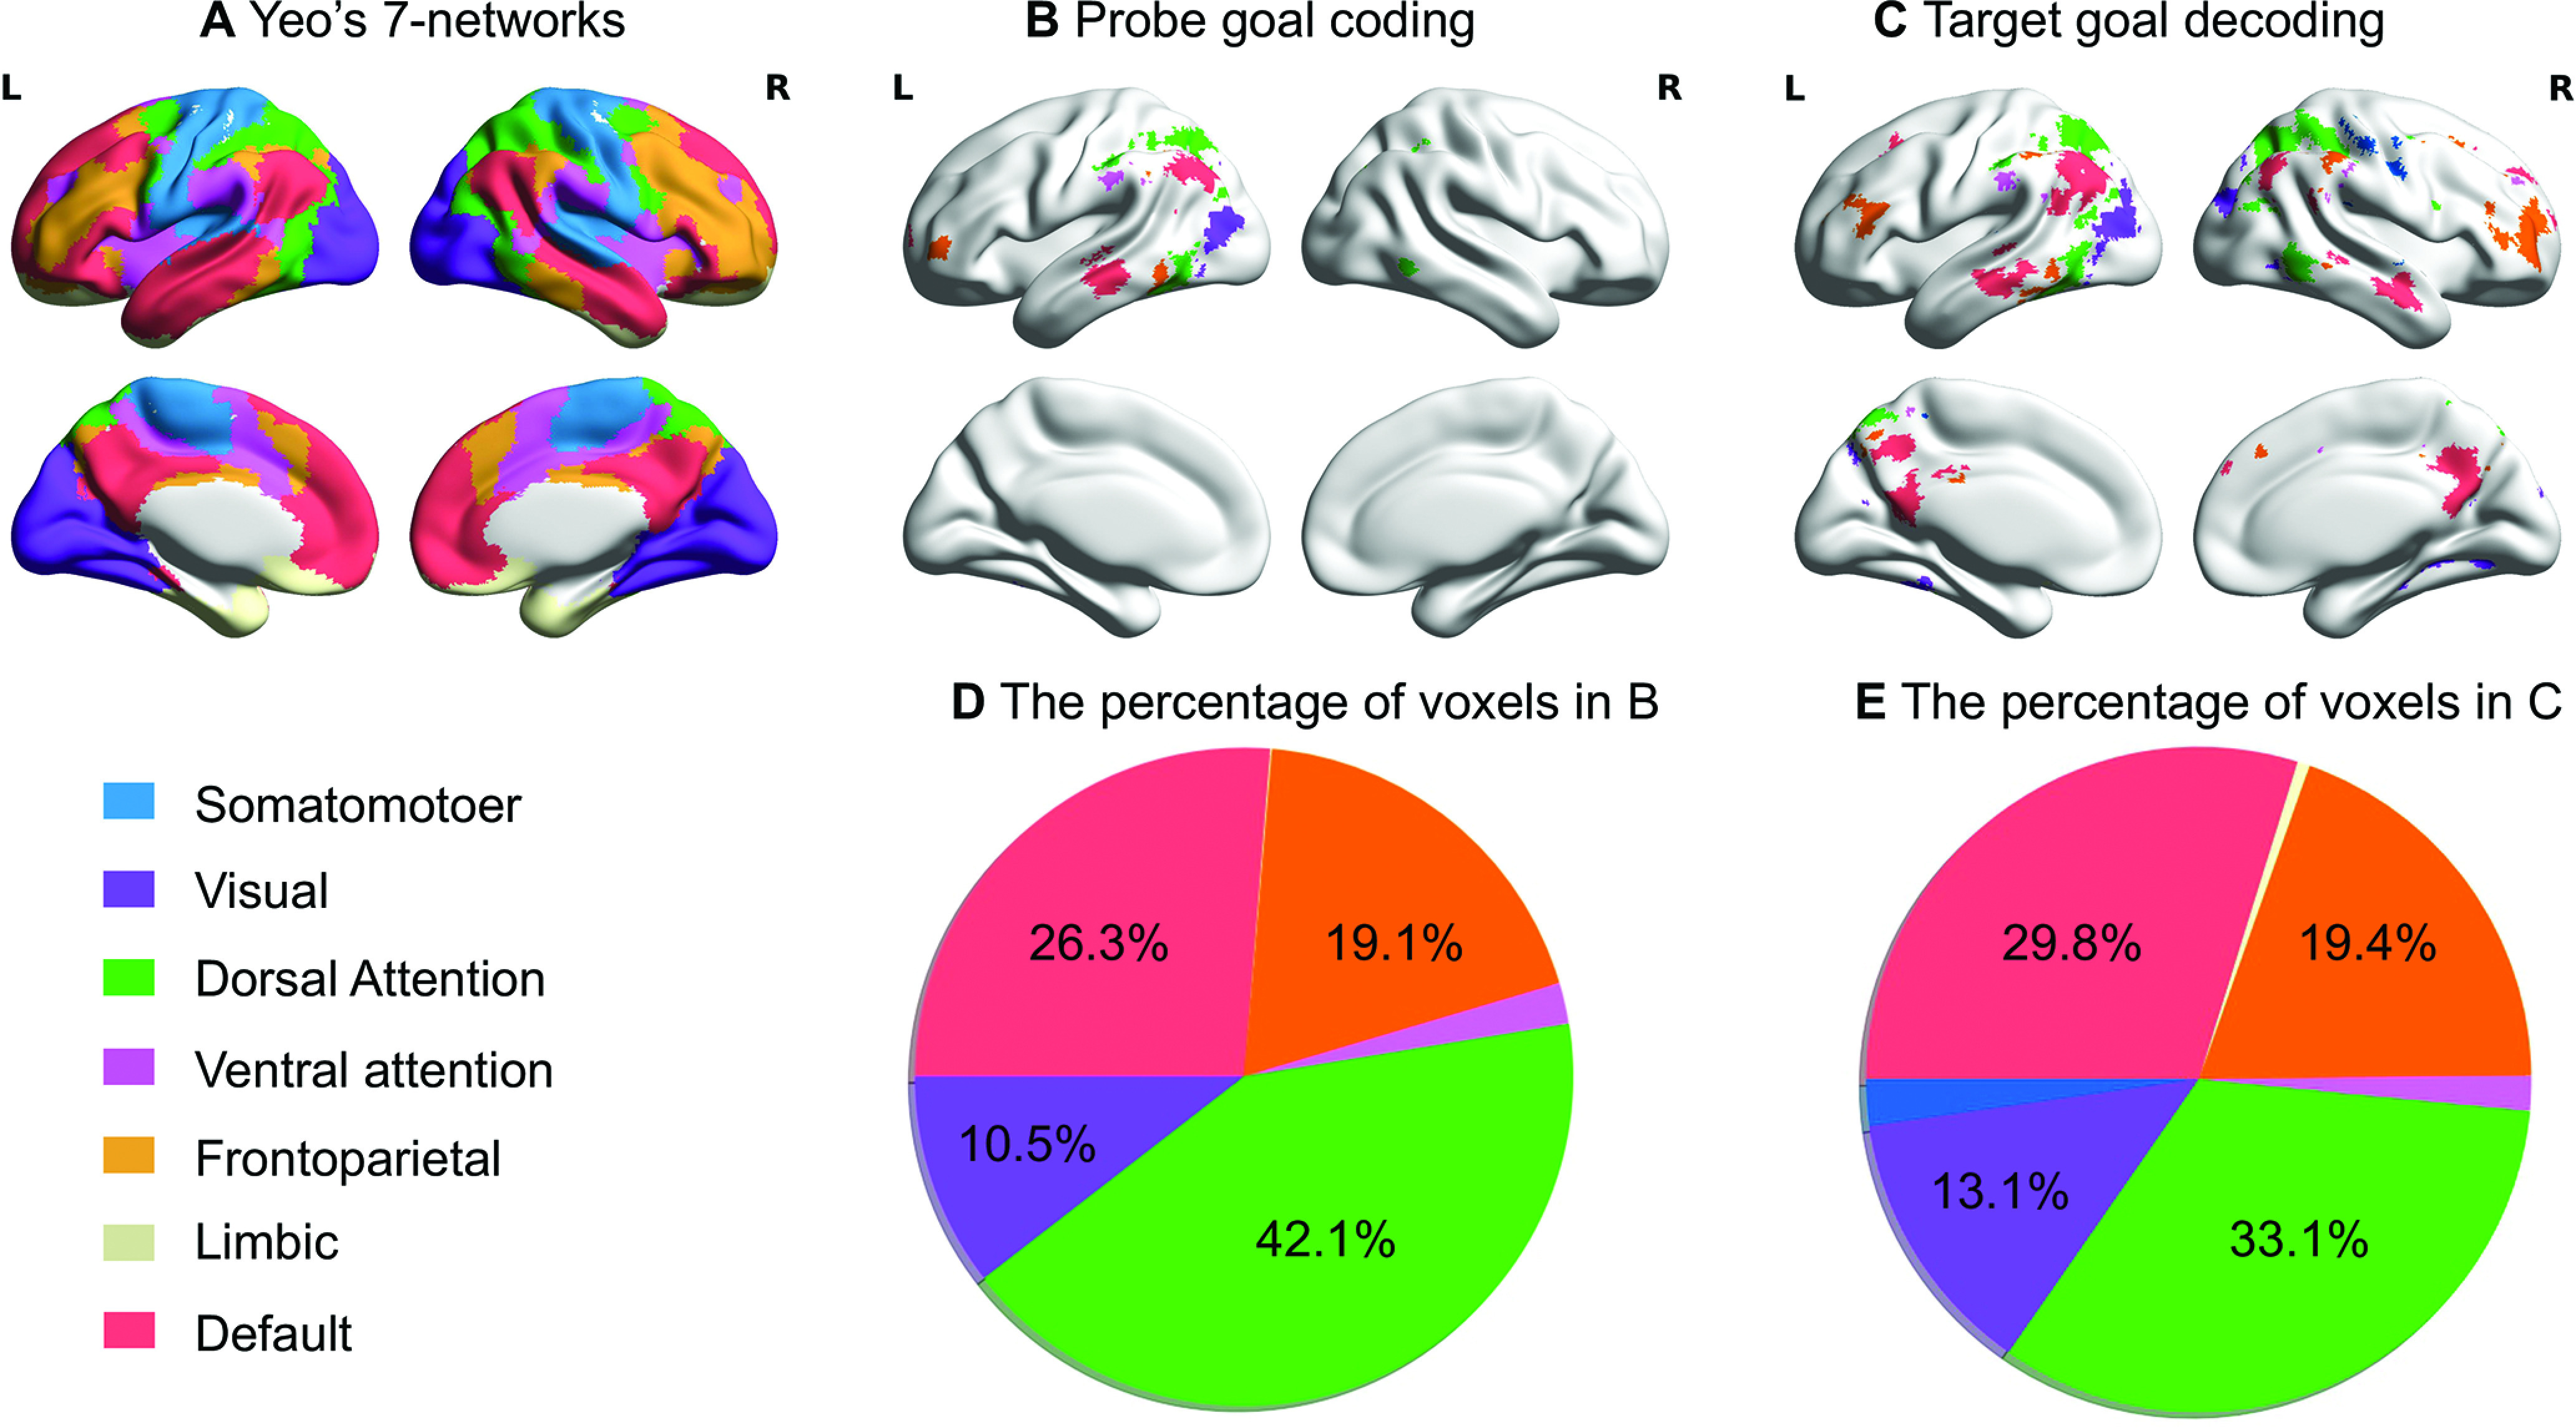
Regions representing goal information overlap with DMN and networks contributing to MD cortex (DAN and FPCN) defined by Yeo et al. (2011). A, The seven networks identified by Yeo et al. (2011). B, C, Overlap between regions representing goal information and large-scale networks during the probe and target word periods, respectively. D, E, Pie chart shows the percentage of voxels within each decoding map falling within each network defined by Yeo et al. (2011) during the probe and the target word periods, respectively. Values <3% are not shown.
To confirm this overlap of the goal-decoding results with both DMN and MD cortex, the decoding results were compared with the localizer task data. Consistent with previous findings, DMN regions (showing a stronger response to easy vs hard trials) included AG, PCC, medial prefrontal cortex, and lateral anterior temporal lobes (ATLs) bilaterally. In contrast, MD regions (responding to hard vs easy trials) included inferior frontal sulcus, premotor cortex, intraparietal sulcus, and LOC (FWE corrected, z = 3.1, p < 0.05; Fig. 4A). Regions that represented goal information overlapped with both group-level MD cortex and DMN maps during the probe (Fig. 4B) and target period (Fig. 4C).
Individual ROI-based goal decoding
To more precisely locate the regions that represented goal information, we conducted ROI-based classification analysis within participant-specific functional ROIs, defined using the localizer tasks, selecting the most responsive voxels within DAN, FPCN, and DMN ROIs defined by Schaefer et al. (2018; Fig. 4D,E). All p values were FWE corrected and ROIs that survive correction are shown in Figure 4F. Goal information could be decoded in three ROIs within DAN: LOC (no. 16: mean decoding accuracy = 0.380, SD = 0.082, t(27) = 3.032, p = 0.029); postcentral gyrus (no. 17: mean decoding accuracy = 0.383, SD = 0.070, t(27) = 3.791, p = 0.005); and superior parietal lobe (no. 18: mean decoding accuracy = 0.376, SD = 0.083, t(27) = 2.807, p = 0.051); two ROIs within FPCN: intraparietal sulcus (no. 34: mean decoding accuracy = 0.387, SD = 0.062, t(27) = 4.570, p = 0.0001); and middle and inferior frontal gyrus (no. 35: mean decoding accuracy = 0.366, SD = 0.058, t(27) = 2.985, p = 0.012); plus two ROIs in DMN: AG (no. 41: mean decoding accuracy = 0.380, SD = 0.074, t(27) = 3.464, p = 0.020); and PCC (no. 50: mean decoding accuracy = 0.375, SD = 0.057, t(27) = 3.943, p = 0.004). There were no other significant regions (p > 0.05).
Goal classification is not related to task difficulty
Activity in DMN and MD cortex is highly sensitive to task difficulty. Therefore, we tested the possibility that the goal discrimination results were driven by differences in difficulty among the three goals. We selected ROIs within DAN, FPCN, and DMN that could decode goal information (Fig. 4F). We did not find any significant correlations between decoding accuracy and response time differences in these regions (r < 0.28, uncorrected p > 0.1), suggesting that decoding accuracy was unrelated to differences in difficulty between conditions.
Category information is represented in LOC
In addition to classification of the current goal (e.g., color, shape, size decisions), our experimental design allowed us to examine regions that could classify the semantic category of the probe word. In this way, we were able to contrast the representation of current goal and long-term semantic information. Probe category was decoded in left LOC (mean decoding accuracy = 0.362, SD = 0.027; Fig. 5A), in the categorical classification analysis. This cluster overlapped with the goal-decoding results for the probe period (Fig. 5B), suggesting that processing in this brain region reflects both current task demands and semantic similarity. Since the probe and target words were not always drawn from the same category, semantic information about the target might add noise to the representation of probe category if the two periods are not fully separated. A supplementary analysis examined whole-brain searchlight decoding of category using only trials in which the probe and target belonged to the same category, a total of 137 of 216 trials (63%). Category could still be decoded in left LOC, with no additional clusters.
Figure 5.
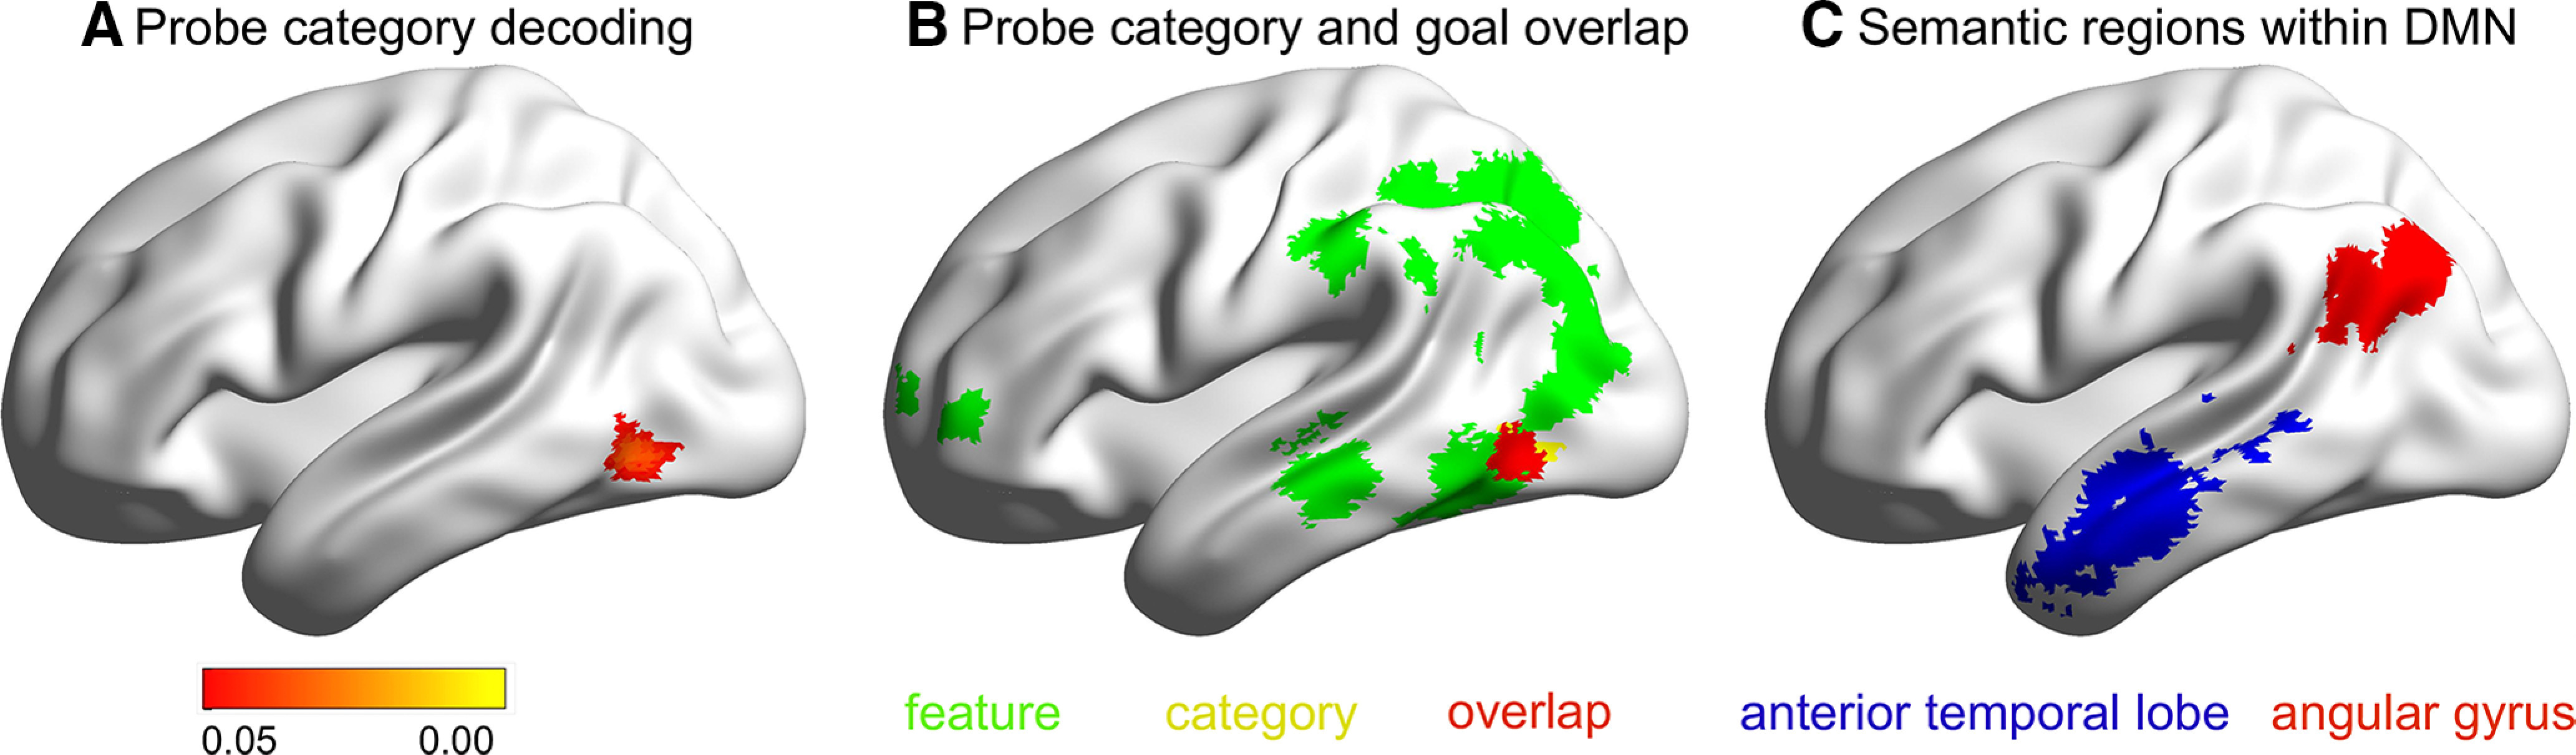
A, Region that represents category information of probe words (FWE corrected, p < 0.05). B, Overlap of category classifier with regions that represent goal information of probe words. C, The two ROIs defined for the ROI-based category classification analysis.
We reasoned that if the organization of conceptual processing in DMN reflects long-term semantic similarity, regions of this network might represent category information, even when this is not necessary for the task. The whole-brain analysis above did not identify regions of DMN that could decode semantic category. However, to guard against type II errors, we examined whether category information could be decoded in key semantic sites within DMN by performing ROI-based classification analysis. The semantic DMN sites were defined by overlapping the DMN network defined by the localizer tasks (Fig. 4A) with semantic regions defined using a meta-analytic mask for the term “semantic” from Neurosynth (Yarkoni et al., 2011). We identified two main regions for analysis in left AG and left ATL by overlapping these voxels with the Schaefer parcellation (Schaefer et al., 2018; Fig. 5C). We applied Bonferroni correction to account for the fact that we included two ROIs; consequently, the final threshold was p < 0.025. We found that category classification was not different from the chance level (i.e., 0.33) in left AG (mean decoding accuracy = 0.346, SD = 0.013; t(27) = 1.236, p = 0.227) and was trending above chance in left ATL (mean decoding accuracy = 0.353, SD = 0.010; t(27) = 2.274, p = 0.031).
Given that the Bonferroni correction might be too stringent, we repeated the ROI-based analysis running the permutation-based decoding analysis via a simple shuffling procedure for the labels. This established an empirical distribution of accuracy scores under the null hypothesis where there is no association between BOLD activations and class labels (Ojala and Garriga, 2010). We then adapted the permutation-based maximum t statistic method (i.e., maximum decoding accuracy) to adjust the p values of each ROI for multiple comparisons to control the FWE rate. No ROIs survived this correction (FWE corrected, p > 0.05).
Goal-related semantic feature representation in DAN, FPCN, and DMN
The classification analysis above examined the effects of task goal (i.e., differences among color, shape, and size trials) and semantic category (probe words from the animal, plant, and tool categories) on neural similarity. We found that DMN and MD cortex represented the current task goal but were largely insensitive to semantic category. To establish whether brain regions are also sensitive to goal-relevant feature similarity within a task, we examined the extent to which neural similarity could be explained by rated feature similarity for task-relevant and task-irrelevant features, controlling for global semantic similarity, using RSA. For example, within the color trials, regions that represent goals might have more similar neural patterns across trials involving matching probes with more similar colors (e.g., for the probes CHERRY and LIPSTICK). In contrast, neural similarity during color-matching trials might not be associated with shape similarity, since this feature is goal irrelevant (e.g., the neural pattern for CHERRY might not be more similar to items like MARBLE that have the same shape). In these analyses, we also controlled for the global semantic similarity of the probe words to exclude the possibility that neural similarity reflects the full meaning of the probe word, with the goal-relevant feature being part of this concept. We reasoned that if the neural RDM was correlated with the goal-related RDM, but not with the goal-unrelated feature similarity RDM or semantic distance-based RDM, these results would suggest that the semantic meaning of the goal cue was represented selectively. Alternatively, if there was a correlation between the neural RDM and the semantic distance-based RDM, it would suggest that the full meaning of the probe word was represented.
For color trials, we found that regions in FPCN, DAN, and DMN exhibited a significant correlation between the neural RDM and color RDM and a significant partial correlation after controlling for the semantic distance-based RDM (FWE corrected, p < 0.05; Fig. 6A). To investigate whether regions that represent goal information fall within DMN and MD cortex (i.e., DAN and FPCN), we compared these RSA results to seven networks derived from a resting-state parcellation of 1000 brains (Yeo et al., 2011). Regions representing goal information overlapped primarily with DMN, FPCN and somatomotor networks (Fig. 6B,C). DMN showed the greatest overlap with the color feature representation map, sugesting that this network is relevant to the representation of goal-relevant semantic features. These regions overlapped with regions representing categorical goal information during the probe and target periods (Fig. 6D,E). For these color trials, no regions showed significant correlations between the neural RDM and the task-irrelevant shape RDM or the semantic distance-based RDM. These results therefore suggest that goal representation in DMN, DAN, and FPCN during the probe period for color trials reflected goal-related semantic knowledge of the probe words.
Figure 6.
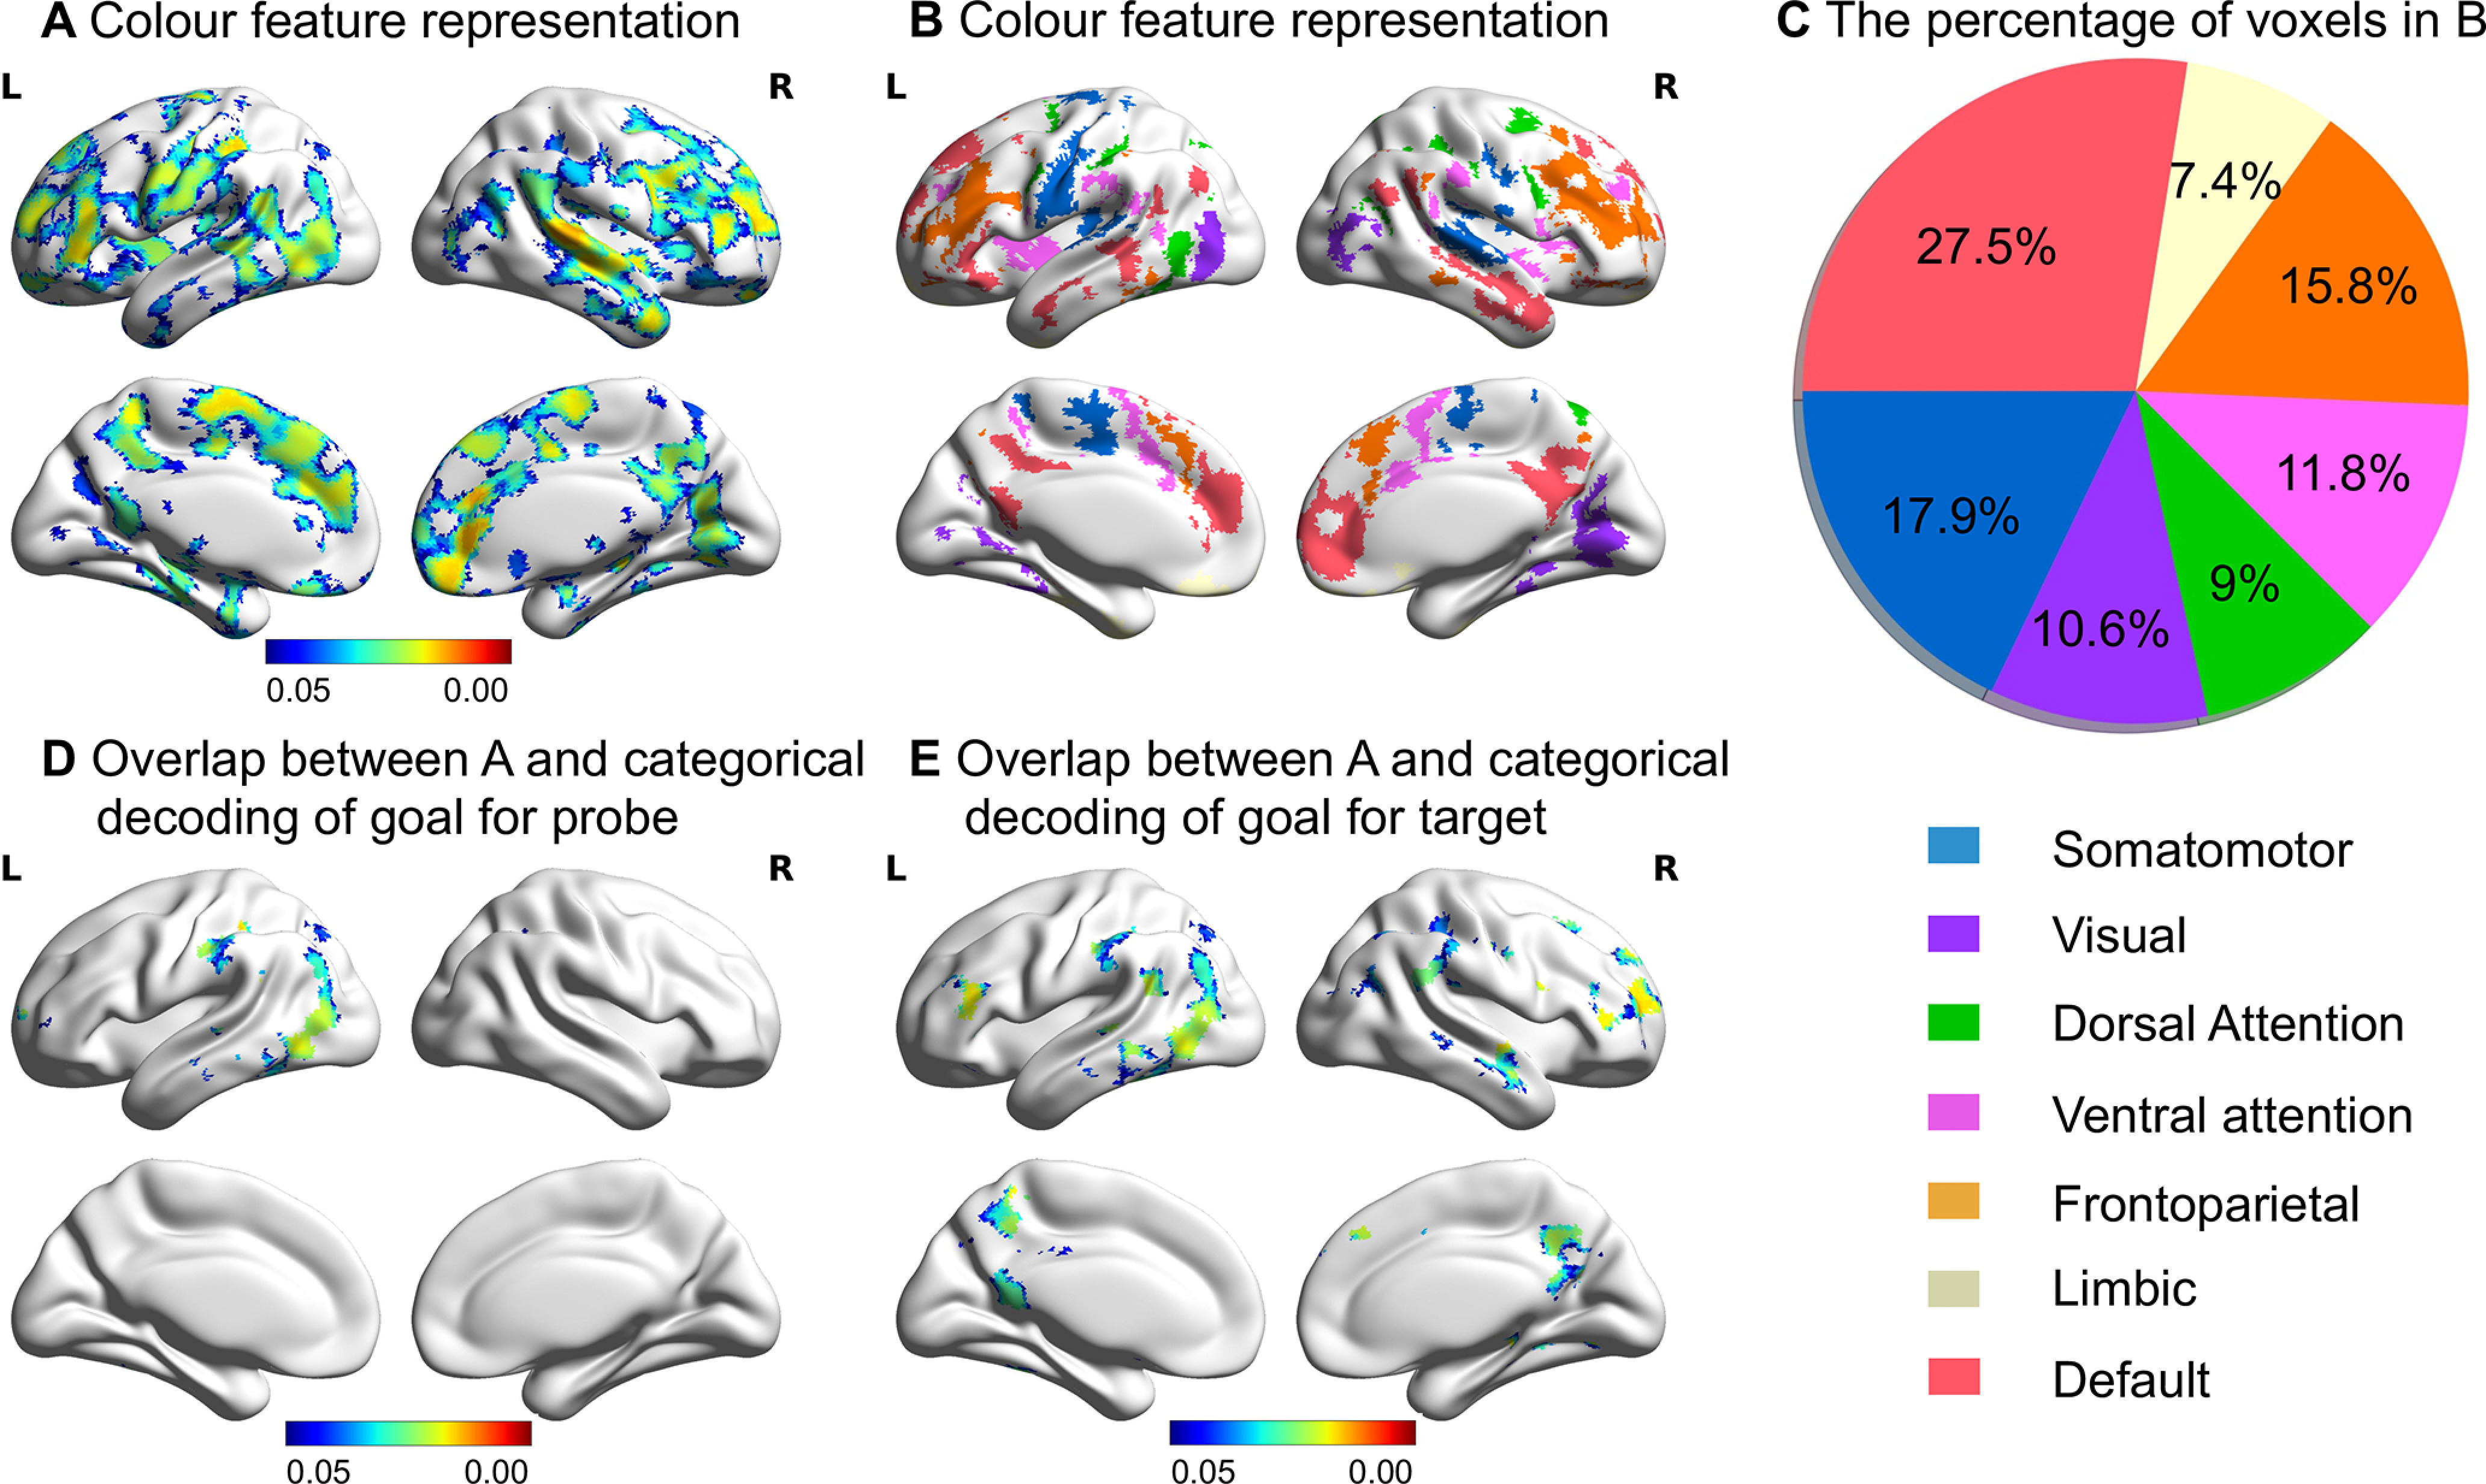
A, The regions in which there was a greater than zero (FWE corrected, p < 0.05) correlation between the neural RDM of color trials and the color RDM, plus significant partial correlations between these two RDMs after controlling for semantic distance. B, Overlap between regions representing color feature information and large-scale networks identified by Yeo et al. (2011). C, Pie chart shows the percentage of voxels in B falling within each network defined by Yeo et al. (2011). D, E, The regions in A overlapped with the regions that represented categorical goal information during the probe and target periods, respectively.
For shape trials, we did not find a significant correlation between the neural RDM and shape RDM, whether or not the semantic distance-based RDM was partialled out. However, to guard against type II errors, we examined whether object shape was represented in key ROIs that represent goal information (Fig. 4F) by conducting ROI-based RSA. Inferior frontal gyrus (no. 34) was the only ROI showing a significant correlation (t(27) = 3.883, p = 0.003, FWE corrected) between the neural RDM and shape RDM. This ROI also showed a partial correlation (t(27) = 3.421, p = 0.008, FWE corrected) after controlling for the semantic distance-based RDM. None of the ROIs showed a significant correlation between the neural RDM and the task-irrelevant shape RDM or the semantic distance-based RDM.
Discussion
This study contrasted two different accounts of DMN function. Semantic DMN sites might decode semantic similarity regardless of task demands, consistent with their putative role as a store of heteromodal concepts. Alternatively, DMN might show sensitivity to changing task demands, consistent with evidence that this network contains “echoes” of all other networks and dynamically alters connectivity patterns depending on the context (Braga et al., 2013; Spreng et al., 2013; Vatansever et al., 2015; Dixon et al., 2017, 2018).
We used a semantic feature-matching task, which required participants to integrate conceptual knowledge with changing task goals. Our design disentangled the representation of current goal from long-term semantic memory. We replicated previous findings that regions of DAN and FPCN represent current goals. We additionally demonstrated that goal information is reflected within regions of DMN, including AG and PCC. Semantic category information that was not relevant to the ongoing task could be decoded in LOC, but there was no evidence from this study that DMN regions could decode category in the same way (with the possible exception of ATL). These results show that goal-related conceptual information dominates the multivariate response within DMN.
By examining the generalization of goal decoding across different time periods of the task, we showed that goal decoding during semantic retrieval does not reflect visual or phonological processes relating to the goal cue word, since these effects would have been maximized during cue presentation—at this time point, we found no decoding of goal beyond visual cortex. Our results are consistent with a recent study that revealed separate representational formats between goal cue and object stimulus periods (Hebart et al., 2018). Future studies could use two different formats to indicate the same behavioral goal for semantic retrieval and then conduct cross-format generalization to further assess the abstract representation of goal.
The strong similarity between probe and target decoding results and successful decoding across these periods suggests that categorical goal representations are maintained and applied to semantic retrieval, and this process involves both MD and DMN regions. Waskom et al. (2014) similarly found that goal information could be decoded in inferior frontal sulcus within MD cortex when goals were applied to stimuli; however, our observation that this pattern extends to DMN is novel. While goal decoding in heteromodal cortex was constrained to periods involving semantic retrieval, and not task preparation, in other contexts, goal representations in DMN may be critical for task preparation; for example, when participants are maintaining the goal in working memory (Soon et al., 2008) or retrieving complex instructions from long-term memory (Crittenden et al., 2015; Smith et al., 2018).
The network showing the strongest categorical goal representation in the target period was DAN, consistent with evidence that goal-relevant stimulus features in DAN are amplified during memory retrieval (Favila et al., 2018; Long and Kuhl, 2018). The goal representation in both DMN and DAN indicates that these networks can support the same function rather than being strictly competitive.
Our goal classification results within regions of DMN cannot be easily explained by difficulty or spatial adjacency to MD cortex. There was no correlation between decoding accuracy and RT differences between goal features, and DMN and MD cortex were both able to decode goal information, even when RT (as a proxy for difficulty) was regressed out. Moreover, although DMN is often adjacent to regions of MD cortex, DMN regions that are relatively distant from MD areas, such as middle temporal gyrus, were able to decode goal information.
While our classification accuracies were relatively low, similar levels of performance have been reported when examining goal representation across MD cortex (Waskom et al., 2014; Erez and Duncan, 2015; Bhandari et al., 2018). The fMRI decoding accuracy of prefrontal cortex often hovers just above chance levels, even for task features that are known to be robustly represented by the activity of prefrontal neurons in nonhuman primates (Woolgar et al., 2011; Stokes et al., 2013; Bhandari et al., 2018). Whole-brain searchlight analyses typically yield even lower classification accuracies than ROI approaches (Waskom et al., 2014), explaining why previous studies applied a MD mask to identify regions for decoding (Waskom et al., 2014; Erez and Duncan, 2015; Cole et al., 2016; Bracci et al., 2017; Qiao et al., 2017). This bias toward executive cortex has limited our understanding of the role of DMN in cognitive flexibility.
The association between neural patterns and goal-relevant features, and the absence of a correlation with both goal-irrelevant features and global semantic similarity, suggests that MD and DMN represent goal-related semantic information but not global conceptual information. This observation extends previous findings that task-relevant but not irrelevant dimensions of stimuli are represented in MD cortex, especially on correct trials (Bracci et al., 2017; Henderson and Serences, 2019).
We found goal-related semantic information was represented in DMN and MD regions for color trials but not for shape trials except in the inferior frontal gyrus. This inconsistency might potentially relate to differences between these feature types, given that categorical representations of color have been found within the brain, including in prefrontal cortex (Bird et al., 2014), while we are not aware of evidence for similar categorical representations of shape, other than basic shapes such as circle, square, triangle, which do not correspond to the majority of the items used in our task.
The regions revealed by the RSA of color trials were also more extensive than those revealed by goal classification analysis, perhaps because the RSA examined finer-grained neural similarity between individual trials based on the similarity of the goal-relevant semantic feature (e.g., cherry and lipstick elicit more similar neural patterns in color-matching trials because both probes are red). In contrast, the classification analysis examined the effect of task type on neural similarity (i.e., the categorical difference between color and shape goals, regardless of whether the colors of the probe concepts were similar between trials).
Our results allow us to reject accounts of the neural basis of semantic cognition that anticipate strong functional dissimilarities between DMN and MD cortex in all circumstances. For example, the observation that deactivation of DMN during demanding tasks is positively associated with behavioral performance (Anticevic et al., 2012) has motivated proposals that DMN is not critical for controlled cognition (Shapira-Lichter et al., 2013; Axelrod et al., 2017) or not critical for externally oriented tasks (even when these tasks require conceptual processing; Humphreys et al., 2015; Chiou et al., 2020). Our findings are incompatible with these views. Our results extend previous findings that DMN supports relatively “automatic” semantic retrieval (Vatansever et al., 2017) by demonstrating that DMN also supports more demanding tasks, like MD cortex.
Other accounts of DMN have emphasized functional subsystems, identified through patterns of intrinsic connectivity and functional recruitment (Andrews-Hanna et al., 2010). Chiou et al. (2020) found that “core” DMN regions (e.g., AG and PCC) show more task-related deactivation and selective recruitment for “internal cognition,” compared with lateral temporal DMN regions implicated in semantic processing. By this view, the task-negative and controlled memory accounts of DMN can be reconciled by attributing these patterns of functional recruitment to different DMN subsystems. Our findings are not fully compatible with this account, since our goal-decoding results extended over both DMN subsystems: both core regions (e.g., PCC) and lateral temporal DMN regions could classify task goals during semantic retrieval. Our findings are more consistent with recent findings that DMN and MD cortex have functional similarities, despite their well documented activation differences. For example, they can have similar representational formats (González-García et al., 2018) and occupy adjacent positions on the principal gradient of connectivity (Margulies et al., 2016; Mckeown et al., 2020).
An adequate account of the role of DMN in semantic cognition needs to explain its stronger activation typically seen when the meanings of inputs are well aligned with recent experience or long-term memory, as well as the sensitivity of this network to changing task goals. One possibility is provided by views that envisage DMN regions as “integrative hubs” (Braga et al., 2013), drawing together inputs from highly diverse networks, including unimodal regions relevant to the varied features of concrete concepts (Margulies et al., 2016; Lanzoni et al., 2020). In this framework, each the feature-matching task requires a specific pattern of interactive processing between DMN hubs and specific unimodal regions relevant for the task. The distinct multivariate responses that we uncovered within DMN for each task goal might have corresponded to these different task states.
Although there is no evidence from this study that semantically relevant DMN regions can decode category information irrelevant to the task (with the possible exception of ATL), LOC could decode both category and goal. Consequently, our results support the view that LOC represents a mixture of task and object information (Harel et al., 2014; Hebart et al., 2018), as opposed to the view that visual responses in LOC are largely context and task invariant (Bracci et al., 2017; Bugatus et al., 2017; Xu, 2018a,b).
Footnotes
This study was supported by the European Research Council (Project ID: 771863, FLEXSEM; and Project ID: 646927, WANDERINGMINDS). We thank Evelina Fedorenko for providing us with the localizer tasks. We also thank Charlotte Murphy, Jiefeng Jiang, Deniz Vatansever, and Theodoros Karapanagiotidis for suggestions about data analysis. In addition, we thank Pradeepa Ruwan and Antonia De Freitas for data collection.
The authors declare no competing financial interests.
References
- Andrews-Hanna JR, Reidler JS, Sepulcre J, Poulin R, Buckner RL (2010) Functional-anatomic fractionation of the brain's default network. Neuron 65:550–562. 10.1016/j.neuron.2010.02.005 [DOI] [PMC free article] [PubMed] [Google Scholar]
- Anticevic A, Cole MW, Murray JD, Corlett PR, Wang XJ, Krystal JH (2012) The role of default network deactivation in cognition and disease. Trends Cogn Sci 16:584–592. 10.1016/j.tics.2012.10.008 [DOI] [PMC free article] [PubMed] [Google Scholar]
- Axelrod V, Rees G, Bar M (2017) The default network and the combination of cognitive processes that mediate self-generated thought. Nat Hum Behav 1:896–910. 10.1038/s41562-017-0244-9 [DOI] [PMC free article] [PubMed] [Google Scholar]
- Bhandari A, Gagne C, Badre D (2018) Just above chance: is it harder to decode information from prefrontal cortex hemodynamic activity patterns? J Cogn Neurosci 30:1473–1498. 10.1162/jocn_a_01291 [DOI] [PubMed] [Google Scholar]
- Binder JR, Desai RH (2011) The neurobiology of semantic memory. Trends Cogn Sci 15:527–536. 10.1016/j.tics.2011.10.001 [DOI] [PMC free article] [PubMed] [Google Scholar]
- Binder JR, Frost JA, Hammeke TA, Bellgowan PSF, Rao SM, Cox RW (1999) Conceptual processing during the conscious resting state: a functional MRI study. J Cogn Neurosci 11:80–95. 10.1162/089892999563265 [DOI] [PubMed] [Google Scholar]
- Binder JR, Westbury CF, McKiernan KA, Possing ET, Medler DA (2005) Distinct brain systems for processing concrete and abstract concepts. J Cogn Neurosci 17:905–917. 10.1162/0898929054021102 [DOI] [PubMed] [Google Scholar]
- Binder JR, Desai RH, Graves WW, Conant LL (2009) Where is the semantic system? A critical review and meta-analysis of 120 functional neuroimaging studies. Cereb Cortex 19:2767–2796. 10.1093/cercor/bhp055 [DOI] [PMC free article] [PubMed] [Google Scholar]
- Bird CM, Berens SC, Horner AJ, Franklin A (2014) Categorical encoding of color in the brain. Proc Natl Acad Sci U S A 111:4590–4595. 10.1073/pnas.1315275111 [DOI] [PMC free article] [PubMed] [Google Scholar]
- Blank I, Kanwisher N, Fedorenko E (2014) A functional dissociation between language and multiple-demand systems revealed in patterns of BOLD signal fluctuations. J Neurophysiol 112:1105–1118. 10.1152/jn.00884.2013 [DOI] [PMC free article] [PubMed] [Google Scholar]
- Bracci S, Daniels N, Op de Beeck H (2017) Task context overrules object- and category-related representational content in the human parietal cortex. Cereb Cortex 27:310–321. 10.1093/cercor/bhw419 [DOI] [PMC free article] [PubMed] [Google Scholar]
- Braga RM, Sharp DJ, Leeson C, Wise RJS, Leech R (2013) Echoes of the brain within default mode, association, and heteromodal cortices. J Neurosci 33:14031–14039. 10.1523/JNEUROSCI.0570-13.2013 [DOI] [PMC free article] [PubMed] [Google Scholar]
- Brysbaert M, Warriner AB, Kuperman V (2014) Concreteness ratings for 40 thousand generally known English word lemmas. Behav Res Methods 46:904–911. 10.3758/s13428-013-0403-5 [DOI] [PubMed] [Google Scholar]
- Bugatus L, Weiner KS, Grill-Spector K (2017) Task alters category representations in prefrontal but not high-level visual cortex. Neuroimage 155:437–449. 10.1016/j.neuroimage.2017.03.062 [DOI] [PMC free article] [PubMed] [Google Scholar]
- Chiou R, Humphreys GF, Lambon RM (2020) Bipartite functional fractionation within the default network supports disparate forms of internally oriented cognition. Cereb Cortex 30:5484–5501. 10.1093/cercor/bhaa130 [DOI] [PMC free article] [PubMed] [Google Scholar]
- Cole MW, Ito T, Braver TS (2016) The behavioral relevance of task information in human prefrontal cortex. Cereb Cortex 26:2497–2505. 10.1093/cercor/bhv072 [DOI] [PMC free article] [PubMed] [Google Scholar]
- Connolly AC, Guntupalli JS, Gors J, Hanke M, Halchenko YO, Wu Y-C, Abdi H, Haxby JV (2012) The representation of biological classes in the human brain. J Neurosci 32:2608–2618. 10.1523/JNEUROSCI.5547-11.2012 [DOI] [PMC free article] [PubMed] [Google Scholar]
- Crittenden BM, Mitchell DJ, Duncan J (2015) Recruitment of the default mode network during a demanding act of executive control. Elife 4:e06481. 10.7554/eLife.06481 [DOI] [PMC free article] [PubMed] [Google Scholar]
- Dale AM (1999) Optimal experimental design for event-related fMRI. Hum Brain Mapp 8:109–114. [DOI] [PMC free article] [PubMed] [Google Scholar]
- Dixon ML, Andrews-Hanna JR, Spreng RN, Irving ZC, Mills C, Girn M, Christoff K (2017) Interactions between the default network and dorsal attention network vary across default subsystems, time, and cognitive states. Neuroimage 147:632–649. 10.1016/j.neuroimage.2016.12.073 [DOI] [PubMed] [Google Scholar]
- Dixon ML, De La Vega A, Mills C, Andrews-Hanna J, Spreng RN, Cole MW, Christoff K (2018) Heterogeneity within the frontoparietal control network and its relationship to the default and dorsal attention networks. Proc Natl Acad Sci U S A 115:E1598–E1607. 10.1073/pnas.1715766115 [DOI] [PMC free article] [PubMed] [Google Scholar]
- Duncan J (2010) The multiple-demand (MD) system of the primate brain: mental programs for intelligent behaviour. Trends Cogn Sci 14:172–179. 10.1016/j.tics.2010.01.004 [DOI] [PubMed] [Google Scholar]
- Erez Y, Duncan J (2015) Discrimination of visual categories based on behavioral relevance in widespread regions of frontoparietal cortex. J Neurosci 35:12383–12393. 10.1523/JNEUROSCI.1134-15.2015 [DOI] [PMC free article] [PubMed] [Google Scholar]
- Favila SE, Samide R, Sweigart SC, Kuhl BA (2018) Parietal representations of stimulus features are amplified during memory retrieval and flexibly aligned with top-down goals. J Neurosci 38:7809–7821. [DOI] [PMC free article] [PubMed] [Google Scholar]
- Fedorenko E, Behr MK, Kanwisher N (2011) Functional specificity for high-level linguistic processing in the human brain. Proc Natl Acad Sci U S A 108:16428–16433. 10.1073/pnas.1112937108 [DOI] [PMC free article] [PubMed] [Google Scholar]
- Fedorenko E, Duncan J, Kanwisher N (2013) Broad domain generality in focal regions of frontal and parietal cortex. Proc Natl Acad Sci U S A 110:16616–16621. 10.1073/pnas.1315235110 [DOI] [PMC free article] [PubMed] [Google Scholar]
- Giordano BL, McAdams S, Zatorre RJ, Kriegeskorte N, Belin P (2013) Abstract encoding of auditory objects in cortical activity patterns. Cereb Cortex 23:2025–2037. 10.1093/cercor/bhs162 [DOI] [PubMed] [Google Scholar]
- González-García C, Flounders MW, Chang R, Baria AT, He BJ (2018) Content-specific activity in frontoparietal and default-mode networks during prior-guided visual perception. Elife 7:e36068. 10.7554/eLife.36068 [DOI] [PMC free article] [PubMed] [Google Scholar]
- Hanke M, Halchenko YO, Sederberg PB, Hanson SJ, Haxby JV, Pollmann S (2009) PyMVPA: a python toolbox for multivariate pattern analysis of fMRI data. Neuroinformatics 7:37–53. 10.1007/s12021-008-9041-y [DOI] [PMC free article] [PubMed] [Google Scholar]
- Harel A, Kravitz DJ, Baker CI (2014) Task context impacts visual object processing differentially across the cortex. Proc Natl Acad Sci U S A 111(10):E962–E971. [DOI] [PMC free article] [PubMed] [Google Scholar]
- Haynes JD, Rees G (2006) Decoding mental states from brain activity in humans. Nat Rev Neurosci 7:523–534. 10.1038/nrn1931 [DOI] [PubMed] [Google Scholar]
- Hebart MN, Bankson BB, Harel A, Baker CI, Cichy RM (2018) The representational dynamics of task and object processing in humans. Elife 7:e32816. 10.7554/eLife.32816 [DOI] [PMC free article] [PubMed] [Google Scholar]
- Henderson M, Serences JT (2019) Human frontoparietal cortex represents behaviorally relevant target status based on abstract object features. J Neurophysiol 121:1410–1427. 10.1152/jn.00015.2019 [DOI] [PMC free article] [PubMed] [Google Scholar]
- Humphreys GF, Hoffman P, Visser M, Binney RJ, Lambon Ralph MA (2015) Establishing task- and modality-dependent dissociations between the semantic and default mode networks. Proc Natl Acad Sci U S A 112:7857–7862. 10.1073/pnas.1422760112 [DOI] [PMC free article] [PubMed] [Google Scholar]
- Isik L, Meyers EM, Leibo JZ, Poggio T (2014) The dynamics of invariant object recognition in the human visual system. J Neurophysiol 111:91–102. 10.1152/jn.00394.2013 [DOI] [PMC free article] [PubMed] [Google Scholar]
- Kahnt T, Grueschow M, Speck O, Haynes JD (2011) Perceptual learning and decision-making in human medial frontal cortex. Neuron 70:549–559. 10.1016/j.neuron.2011.02.054 [DOI] [PubMed] [Google Scholar]
- King JR, Dehaene S (2014) Characterizing the dynamics of mental representations: the temporal generalization method. Trends Cogn Sci 18:203–210. 10.1016/j.tics.2014.01.002 [DOI] [PMC free article] [PubMed] [Google Scholar]
- Krieger-Redwood K, Jefferies E, Karapanagiotidis T, Seymour R, Nunes A, Ang JWA, Majernikova V, Mollo G, Smallwood J (2016) Down but not out in posterior cingulate cortex: deactivation yet functional coupling with prefrontal cortex during demanding semantic cognition. Neuroimage 141:366–377. 10.1016/j.neuroimage.2016.07.060 [DOI] [PMC free article] [PubMed] [Google Scholar]
- Kriegeskorte N, Goebel R, Bandettini P (2006) Information-based functional brain mapping. Proc Natl Acad Sci U S A 103:3863–3868. 10.1073/pnas.0600244103 [DOI] [PMC free article] [PubMed] [Google Scholar]
- Kriegeskorte N, Mur M, Bandettini P (2008) Representational similarity analysis - connecting the branches of systems neuroscience. Front Syst Neurosci 2:4. 10.3389/neuro.06.004.2008 [DOI] [PMC free article] [PubMed] [Google Scholar]
- Lanzoni L, Ravasio D, Thompson H, Vatansever D, Margulies D, Smallwood J, Jefferies E (2020) The role of default mode network in semantic cue integration. Neuroimage 219:117019. 10.1016/j.neuroimage.2020.117019 [DOI] [PMC free article] [PubMed] [Google Scholar]
- Leech R, Kamourieh S, Beckmann CF, Sharp DJ (2011) Fractionating the default mode network: distinct contributions of the ventral and dorsal posterior cingulate cortex to cognitive control. J Neurosci 31:3217–3224. 10.1523/JNEUROSCI.5626-10.2011 [DOI] [PMC free article] [PubMed] [Google Scholar]
- Long NM, Kuhl BA (2018) Bottom-Up and Top-Down Factors Differentially Influence Stimulus Representations Across Large-Scale Attentional Networks. J Neurosci 38:2495–2504. [DOI] [PMC free article] [PubMed] [Google Scholar]
- Margulies DS, Ghosh SS, Goulas A, Falkiewicz M, Huntenburg JM, Langs G, Bezgin G, Eickhoff SB, Castellanos FX, Petrides M, Jefferies E, Smallwood J (2016) Situating the default-mode network along a principal gradient of macroscale cortical organization. Proc Natl Acad Sci U S A 113:12574–12579. 10.1073/pnas.1608282113 [DOI] [PMC free article] [PubMed] [Google Scholar]
- Mckeown B, Strawson WH, Wang H-T, Karapanagiotidis T, Vos de Wael R, Benkarim O, Turnbull A, Margulies D, Jefferies E, McCall C, Bernhardt B, Smallwood J (2020) The relationship between individual variation in macroscale functional gradients and distinct aspects of ongoing thought. Neuroimage 220:117072. 10.1016/j.neuroimage.2020.117072 [DOI] [PMC free article] [PubMed] [Google Scholar]
- McKiernan KA, Kaufman JN, Kucera-thompson J, Binder JR (2003) A parametric manipulation of factors affecting task-induced deactivation in functional neuroimaging. J Cogn Neurosci 15:394–408. 10.1162/089892903321593117 [DOI] [PubMed] [Google Scholar]
- Mikolov T, Chen K, Corrado G, Dean J (2013) Efficient estimation of word representations in vector space. Paper presented at 1st International Conference on Learning Representations, ICLR 2013, Scottsdale, AZ, May. [Google Scholar]
- Mumford JA, Turner BO, Ashby FG, Poldrack RA (2012) Deconvolving BOLD activation in event-related designs for multivoxel pattern classification analyses. Neuroimage 59:2636–2643. 10.1016/j.neuroimage.2011.08.076 [DOI] [PMC free article] [PubMed] [Google Scholar]
- Murphy C, Rueschemeyer SA, Watson D, Karapanagiotidis T, Smallwood J, Jefferies E (2017) Fractionating the anterior temporal lobe: MVPA reveals differential responses to input and conceptual modality. Neuroimage 147:19–31. 10.1016/j.neuroimage.2016.11.067 [DOI] [PMC free article] [PubMed] [Google Scholar]
- Murphy C, Jefferies E, Rueschemeyer SA, Sormaz M, Wang H, ting Margulies DS, Smallwood J (2018) Distant from input: evidence of regions within the default mode network supporting perceptually-decoupled and conceptually-guided cognition. Neuroimage 171:393–401. 10.1016/j.neuroimage.2018.01.017 [DOI] [PMC free article] [PubMed] [Google Scholar]
- Nichols T, Holmes A (2002) Nonparametric permutation tests for functional neuroimaging. Hum Brain Mapp 15:1–25. 10.1002/hbm.1058 [DOI] [PMC free article] [PubMed] [Google Scholar]
- Ojala M, Garriga GC (2010) Permutation tests for studying classifier performance. J Mach Learn Res 11:1833–1863. [Google Scholar]
- Peirce JW (2007) PsychoPy—Psychophysics software in Python. J Neurosci Methods 162:8–13. 10.1016/j.jneumeth.2006.11.017 [DOI] [PMC free article] [PubMed] [Google Scholar]
- Power JD, Barnes KA, Snyder AZ, Schlaggar BL, Petersen SE (2012) Spurious but systematic correlations in functional connectivity MRI networks arise from subject motion. Neuroimage 59:2142–2154. 10.1016/j.neuroimage.2011.10.018 [DOI] [PMC free article] [PubMed] [Google Scholar]
- Qiao L, Zhang L, Chen A, Egner T (2017) Dynamic trial-by-trial recoding of task-set representations in the frontoparietal cortex mediates behavioral flexibility. J Neurosci 37:11037–11050. 10.1523/JNEUROSCI.0935-17.2017 [DOI] [PMC free article] [PubMed] [Google Scholar]
- Reverberi C, Görgen K, Haynes JD (2012) Distributed representations of rule identity and rule order in human frontal cortex and striatum. J Neurosci 32:17420–17430. 10.1523/JNEUROSCI.2344-12.2012 [DOI] [PMC free article] [PubMed] [Google Scholar]
- Schaefer A, Kong R, Gordon EM, Laumann TO, Zuo X-N, Holmes AJ, Eickhoff SB, Yeo BTT (2018) Local-global parcellation of the human cerebral cortex from intrinsic functional connectivity MRI. Cereb Cortex 28:3095–3114. 10.1093/cercor/bhx179 [DOI] [PMC free article] [PubMed] [Google Scholar]
- Seghier ML, Fagan E, Price CJ (2010) Functional subdivisions in the left angular gyrus where the semantic system meets and diverges from the default network. J Neurosci 30:16809–16817. 10.1523/JNEUROSCI.3377-10.2010 [DOI] [PMC free article] [PubMed] [Google Scholar]
- Sestieri C, Corbetta M, Romani GL, Shulman GL (2011) Episodic memory retrieval, parietal cortex, and the default mode network: functional and topographic analyses. J Neurosci 31:4407–4420. 10.1523/JNEUROSCI.3335-10.2011 [DOI] [PMC free article] [PubMed] [Google Scholar]
- Shapira-Lichter I, Oren N, Jacob Y, Gruberger M, Hendler T (2013) Portraying the unique contribution of the default mode network to internally driven mnemonic processes. Proc Natl Acad Sci U S A 110:4950–4955. 10.1073/pnas.1209888110 [DOI] [PMC free article] [PubMed] [Google Scholar]
- Simony E, Honey CJ, Chen J, Lositsky O, Yeshurun Y, Wiesel A, Hasson U (2016) Dynamic reconfiguration of the default mode network during narrative comprehension. Nat Commun 7:12141. 10.1038/ncomms12141 [DOI] [PMC free article] [PubMed] [Google Scholar]
- Smith SM, Nichols TE (2009) Threshold-free cluster enhancement: addressing problems of smoothing, threshold dependence and localisation in cluster inference. Neuroimage 44:83–98. 10.1016/j.neuroimage.2008.03.061 [DOI] [PubMed] [Google Scholar]
- Smith V, Mitchell DJ, Duncan J (2018) Role of the default mode network in cognitive transitions. Cereb Cortex 28:3685–3696. 10.1093/cercor/bhy167 [DOI] [PMC free article] [PubMed] [Google Scholar]
- Soon CS, Brass M, Heinze HJ, Haynes JD (2008) Unconscious determinants of free decisions in the human brain. Nat Neurosci 11:543–545. 10.1038/nn.2112 [DOI] [PubMed] [Google Scholar]
- Sormaz M, Murphy C, Wang H-T, Hymers M, Karapanagiotidis T, Poerio G, Margulies DS, Jefferies E, Smallwood J (2018) Default mode network can support the level of detail in experience during active task states. Proc Natl Acad Sci U S A 115:9318–9323. 10.1073/pnas.1721259115 [DOI] [PMC free article] [PubMed] [Google Scholar]
- Spreng RN, Stevens WD, Chamberlain JP, Gilmore AW, Schacter DL (2010) Default network activity, coupled with the frontoparietal control network, supports goal-directed cognition. Neuroimage 53:303–317. 10.1016/j.neuroimage.2010.06.016 [DOI] [PMC free article] [PubMed] [Google Scholar]
- Spreng RN, Sepulcre J, Turner GR, Stevens WD, Schacter DL (2013) Intrinsic architecture underlying the relations among the default, dorsal attention, and frontoparietal control networks of the human brain. J Cogn Neurosci 25:74–86. 10.1162/jocn_a_00281 [DOI] [PMC free article] [PubMed] [Google Scholar]
- Stokes MG, Kusunoki M, Sigala N, Nili H, Gaffan D, Duncan J (2013) Dynamic coding for cognitive control in prefrontal cortex. Neuron 78:364–375. 10.1016/j.neuron.2013.01.039 [DOI] [PMC free article] [PubMed] [Google Scholar]
- Todd MT, Nystrom LE, Cohen JD (2013) Confounds in multivariate pattern analysis: theory and rule representation case study. Neuroimage 77:157–165. 10.1016/j.neuroimage.2013.03.039 [DOI] [PubMed] [Google Scholar]
- Turnbull A, Wang H-T, Schooler JW, Jefferies E, Margulies DS, Smallwood J (2019a) The ebb and flow of attention: between-subject variation in intrinsic connectivity and cognition associated with the dynamics of ongoing experience. Neuroimage 185:286–299. 10.1016/j.neuroimage.2018.09.069 [DOI] [PubMed] [Google Scholar]
- Turnbull A, Wang HT, Murphy C, Ho NSP, Wang X, Sormaz M, Karapanagiotidis T, Leech RM, Bernhardt B, Margulies DS, Vatansever D, Jefferies E, Smallwood J (2019b) Left dorsolateral prefrontal cortex supports context-dependent prioritisation of off-task thought. Nat Commun 10:3816. 10.1038/s41467-019-11764-y [DOI] [PMC free article] [PubMed] [Google Scholar]
- van Heuven WJB, Mandera P, Keuleers E, Brysbaert M (2014) Subtlex-UK: a new and improved word frequency database for British English. Q J Exp Psychol (Hove) 67:1176–1190. 10.1080/17470218.2013.850521 [DOI] [PubMed] [Google Scholar]
- Vapnik V, Chapelle O (2000) Bounds on error expectation for support vector machines. Neural Comput 12:2013–2036. 10.1162/089976600300015042 [DOI] [PubMed] [Google Scholar]
- Vatansever D, Menon DK, Manktelow AE, Sahakian BJ, Stamatakis EA (2015) Behavioral/cognitive default mode dynamics for global functional integration. J Neurosci 35:15254–15262. 10.1523/JNEUROSCI.2135-15.2015 [DOI] [PMC free article] [PubMed] [Google Scholar]
- Vatansever D, Menon DK, Stamatakis EA (2017) Default mode contributions to automated information processing. Proc Natl Acad Sci U S A 114:12821–12826. 10.1073/pnas.1710521114 [DOI] [PMC free article] [PubMed] [Google Scholar]
- Wang X, Margulies DS, Smallwood J, Jefferies E (2020) A gradient from long-term memory to novel cognition: transitions through default mode and executive cortex. Neuroimage 220:117074. 10.1016/j.neuroimage.2020.117074 [DOI] [PMC free article] [PubMed] [Google Scholar]
- Waskom ML, Kumaran D, Gordon AM, Rissman J, Wagner AD (2014) Frontoparietal representations of task context support the flexible control of goal-directed cognition. J Neurosci 34:10743–10755. 10.1523/JNEUROSCI.5282-13.2014 [DOI] [PMC free article] [PubMed] [Google Scholar]
- Wen T, Duncan J, Mitchell DJ (2020) Hierarchical representation of multistep tasks in multiple-demand and default mode networks. J Neurosci 40:7724–7738. 10.1523/JNEUROSCI.0594-20.2020 [DOI] [PMC free article] [PubMed] [Google Scholar]
- Wirth M, Jann K, Dierks T, Federspiel A, Wiest R, Horn H (2011) Semantic memory involvement in the default mode network: a functional neuroimaging study using independent component analysis. Neuroimage 54:3057–3066. 10.1016/j.neuroimage.2010.10.039 [DOI] [PubMed] [Google Scholar]
- Woolgar A, Hampshire A, Thompson R, Duncan J (2011) Adaptive coding of task-relevant information in human frontoparietal cortex. J Neurosci 31:14592–14599. 10.1523/JNEUROSCI.2616-11.2011 [DOI] [PMC free article] [PubMed] [Google Scholar]
- Woolgar A, Jackson J, Duncan J (2016) Coding of visual, auditory, rule, and response information in the brain: 10 years of multivoxel pattern analysis. J Cogn Neurosci 28:1433–1454. 10.1162/jocn_a_00981 [DOI] [PubMed] [Google Scholar]
- Xia M, Wang J, He Y (2013) BrainNet Viewer: a network visualization tool for human brain connectomics. PLoS One 8:e68910. 10.1371/journal.pone.0068910 [DOI] [PMC free article] [PubMed] [Google Scholar]
- Xu Y (2018a) The posterior parietal cortex in adaptive visual processing. Trends Neurosci 41:806–822. 10.1016/j.tins.2018.07.012 [DOI] [PMC free article] [PubMed] [Google Scholar]
- Xu Y (2018b) A tale of two visual systems: invariant and adaptive visual information representations in the primate brain. Annu Rev Vis Sci 4:311–336. 10.1146/annurev-vision-091517-033954 [DOI] [PubMed] [Google Scholar]
- Yarkoni T, Poldrack RA, Nichols TE, Van Essen DC, Wager TD (2011) Large-scale automated synthesis of human functional neuroimaging data. Nat Methods 8:665–670. 10.1038/nmeth.1635 [DOI] [PMC free article] [PubMed] [Google Scholar]
- Yeo BT, Krienen FM, Sepulcre J, Sabuncu MR, Lashkari D, Hollinshead M, Roffman JL, Smoller JW, Zöllei L, Polimeni JR, Fischl B, Liu H, Buckner RL (2011) The organization of the human cerebral cortex estimated by intrinsic functional connectivity. J Neurophysiol 106:1125–1165. 10.1152/jn.00338.2011 [DOI] [PMC free article] [PubMed] [Google Scholar]
Associated Data
This section collects any data citations, data availability statements, or supplementary materials included in this article.
Data Availability Statement
All summary data, materials, and codes used in the analysis are accessible in the Open Science Framework at https://osf.io/vn7ws/.