

Abstract
Rationale:
The lung mesenchyme gives rise to multiple distinct lineages of cells in the mature respiratory system, including smooth muscle cells (SMCs) of the airway and vasculature. However, a thorough understanding of the specification and mesenchymal cell diversity in the human lung is lacking.
Methods:
We completed single cell RNA sequencing analysis of fetal human lung tissues. Canonical correlation analysis, clustering, cluster marker gene identification and tSNE representation was performed in Seurat. Cell populations were annotated using Toppfun. Immunohistochemistry and in situ hybridization were used to validate spatio-temporal gene expression patterns for key marker genes.
Results:
We identified molecularly distinct populations representing “committed” fetal human lung endothelial cells, pericytes, and smooth muscle cells (SMCs). Early endothelial lineages expressed “classic” endothelial cell markers (PECAM, CLND5) while pericytes expressed PDGFRβ, THY1 and basement membrane molecules (COL4, laminin, proteoglycans). We observed a large population of “nonspecific” human lung mesenchymal progenitor cells characterized by expression of COL1 and multiple elastin fiber genes (ELN, MFAP2, FBN1). We closely characterized diversity of mesenchymal lineages defined by ACTA2 expression. Two cell populations, with the highest levels of ACTA2 transcriptional activity, expressed unique sets of markers associated with airway- or vascular- SMCs. Spatio-temporal analysis of these marker genes confirmed early and persistent spatial specification of airway (HHIP, MYLK, IGF1) and vascular (NTRK3, MEF2C) SMCs in the developing human lung.
Conclusion:
Our data suggest that specification of distinct airway and vascular SMC phenotypes are established early in development and can be identified using the markers we provide.
Keywords: single cell RNAseq, Smooth muscle cells, lung development, mesenchymal cells
Introduction
The lung is a complex organ comprised of many cell types that differentiate to acquire a specific fate during the course of development. The interactions between these various cell types (e.g. epithelial, endothelial, etc.) are essential for the development of adequate respiratory function, including gas-exchange structures, conducting airways, and vasculature. Epithelial cell lineages in lung development and disease have been extensively studied in multiple mammalian species, but most of these data are from rodent models (1-6). Fewer studies have focused on non-epithelial lineages (7-9), such that a thorough understanding of the specification and inter-relationships amongst the diverse mesenchymally derived cells in the lung is lacking. This is particularly the case for the developing human lung. A recent study assessed the distinct mesenchymal lineages in mouse lung, and determined that there are numerous functional pathways, such as Fgf signaling, that signal to the epithelium to promote epithelial homeostasis (10). However, other studies including our own, have demonstrated that cellular and molecular processes during lung development differ between mouse and humans (11-13), including in the context of FGF signaling (14).
The lung mesenchyme includes multiple distinct cell lineages in the mature respiratory system, including smooth muscle cells of the airway and vasculature, endothelial cells, pericytes, lipofibroblasts and parenchymal fibroblasts. An array of cell-specific markers demarcates some of these cell lineages, such as CD31 for endothelial cells, PDGFRβ for pericytes and ACTA2 in pan-smooth muscle cells. However, markers to identify each cell type remains elusive and nonspecific for the majority, especially in the case of fibroblasts and vascular vs airway smooth muscle cells. To date, there are no definitive markers allowing us to distinguish pulmonary airway smooth muscle cells (ASMCs) from vascular smooth muscle cells in the lung (VSMCs). Several pathological lung conditions are associated with either or both cell types. For example, pulmonary arterial hypertension is characterized by hyper-proliferation and remodeling of VSMCs (15), reverting from a differentiated to a de-differentiated phenotype (16). Whereas, asthma is a disease in which patients have compromised breathing due to narrowing and remodeling of the airways, partially in result to hyper-proliferative and/or dysfunctional ASMCs (17). In this study, we aimed to characterize the different mesenchymal cell lineages in the human developing lung in general, and the ACTA2-expressing cells in particular.
Methods:
Human fetal tissue collection
De-identified human fetal lung samples were obtained under IRB approval from both USC and CHLA (USC-HS-13-0399 and CHLA-14-2211).
Single cell suspension preparation
Fetal human lung tissues were digested to single cell suspensions according to LungMAP protocol with minor adjustments, eliminating elastase and reducing the incubation time to 40 minutes (18). Isolated cells were resuspended in freezing media (90%FBS, 10%DMSO) at a concentration no more than 60x106cells/mL and frozen until use.
Single Cell Sequencing
Cell capture and library production was performed on the Chromium 10X Genomics system. Sequencing was performed on a HiSeq4000, with read alignment to GRCh38. All single cell sequencing data analysis was performed using Seurat v2.1. Filtered data were log transformed, scaled, integrated using canonical correlation analysis, clustered and represented by t-Distributed Stochastic Neighbor Embedding (t-SNE). Differential expression was defined using a parametric Wilcoxon rank sum test at a significance level of p<0.05. Pathway analysis and cell type association was performed using ToppGene Functional Annotation tool (ToppFun). For focused analysis of smooth muscle-like cells, we analyzed only those cells with evidence for ACTA2 expression (raw counts > 2; n=781 cells) and applied the aforementioned steps to identify subclusters, and their associated cell types.
In situ hybridization
Fluorescent in situ hybridization (FISH) was performed on formalin-fixed, paraffin embedded native human fetal lungs, that were sectioned at 5μm, using RNAscope technology following the manufacturer’s protocol, and as previously described (14).
Immunofluorescent staining
Immunohistochemistry was performed on formalin-fixed, paraffin embedded native human fetal lungs at different gestational stages. Specimens were processed as previously described (19). Briefly, embedded lungs were sectioned at 5μm, rehydrated and boiled in a sodium citrate antigen retrieval solution for 12 minutes. Sections were incubated with primary antibodies (Supplementary Table 1) overnight at 4°C, then stained with appropriate fluorochrome-conjugated secondary antibodies.
Results
Unsupervised Assessment of Cell Types in Human Embryonic Lung
To characterize cellular heterogeneity in the developing human fetal lung, we performed single cell RNA sequencing (scRNAseq) of protease-dissociated cells from 11.5 or 18.5 weeks of gestation lung samples (1 sample of each stage). We analyzed data on a total of 3237 cells (1364 cells at 11.5 wks, 1873 cells at 18.5 wks), with an average detection of 2000-3000 genes per cell (Supplementary Figure S1). Canonical correlation analysis (CCA), implemented in Seurat, was used for data integration across subjects. This data object was used for analysis and visualization by t-distributed stochastic neighbor embedding (t-SNE). We identified 10 clusters of cells, along with corresponding cluster marker genes (Fig. 1A). Functional enrichment analysis defined 9 of these clusters as identifiable lung cell populations, with one cluster remaining ambiguous (Figure 1A and Supplementary Table S2). A majority of the cells (>85%) appeared to be of mesenchymal origin including a large population of human lung mesenchymal progenitor (HLMP) cells, which were annotated as matrix fibroblasts (n=1678, cluster 0) based upon similarity with murine cells. Our data also identified more recognizable mesenchymal populations including endothelial cells (n=388, cluster 1) and pericytes (n=300, cluster 3). A small fraction of cells (<2%) were identified as epithelial (Cluster 8). We also identified a cluster of cells (n=302) with molecular attributes of both mesenchymal and epithelial origin, we have defined as myoepithelial (cluster 2). Interestingly, we observed multiple immune cell populations including mixed lymphocytes (n=122, cluster 5), myeloid cells (n=79, cluster 7) and T cells (n=53, cluster 9) in these tissues from early stages of lung development.
Figure 1: Single cell (sc) RNA-seq identifies cell populations in human fetal lung.

(A) Unsupervised graph-based clustering of scRNA-seq data from early stages of lung development, visualized using t-distributed stochastic neighbor embedding (tSNE). Each point represents a single cell, and individual clusters are colored and annotated based on cell type associations derived from Toppfun. (B) Gene expression patterns for individual canonical cell lineage markers in fetal lung cell clusters, overlaid on tSNE plots defining cell type clusters. Each point represents a single cell, with blue color indicating expression level of the specified marker gene (darker shade is higher expression). Expression of some lineage markers is highly restricted (e.g., SFTPC to epithelial cells, PECAM1 and CDH5 to endothelial cells, PTPRC and HLA-DRA to leukocytes), while other markers are more widely expressed (KRT8, ACTA2, COL1A1, ELN).
Assignment of cluster identities were further validated by examining the expression of marker genes associated with major cell types (Fig. 1B and Fig. 2). Many cluster markers included signature genes expectant of the suggested cell type. For example, for matrix fibroblasts (cluster 0), there was high relative expression of DECORIN (DCN) and COL1A1; whereas for pericytes (cluster 3), there was high relative expression of THY1 and PDGFRβ. Expression patterns and levels varied (Fig. 2) for some individual canonical cell lineage markers. Some markers were present in a number of different clusters, such as ELN, whereas others were highly restrictive such as PECAM1 (Fig. 1B and Fig. 2), which only appeared in the endothelial cell cluster.
Figure 2: Heat map indicating human fetal lung cell population markers.

Heatmap displays gene expression patterns for marker genes (n=10 each; total of 98 due to 2 markers in more than 1 cluster) for each cell population cluster, based on differential expression testing. Individual genes are represented in rows, and individual cells (n=3236) are represented in columns. Yellow indicates high relative gene expression, and purple indicates low or no expression. Each cluster is labeled by its presumed cell type based upon annotation with Toppfun.
Spatial Validation of Mesenchymal Cell Lineages
We chose to focus on mesenchymal cell clusters due to their high proportional representation in our data set, and the relative lack of characterization of these cells in general, particularly in the human lung. RNAscope fluorescent in situ hybridization (FISH) and immunofluorescent (IF) staining was used for validation and spatial assessment of cluster marker genes for each of the different mesenchymal cell clusters. We studied spatial expression patterns throughout different gestational stages of native human fetal lung (11, 14, 16 and 18 weeks; n=3 for each), spanning the pseudoglandular and canalicular stages of development. For matrix fibroblasts (cluster 0), IF staining of FIBRILLIN1 (FBN1), COL1A1, and DECORIN (DCN) displayed generally comparable localization patterns, all indicative of lung matrix (Fig. 4). FBN1 was primarily localized within the airway smooth muscle cells, as well as in the vascular smooth muscle cells (Fig. 3A-D). Co-staining of COL1A1 and DCN demonstrated that the two co-localized throughout development across multiple of the identified populations including, but not limited to, airway smooth muscle cells and vascular smooth muscle cells (Fig. 3 E-H). For endothelial cells (cluster 1), validation of characteristic cell markers (CD31 and CLDN5) were performed. CD31 IF staining showed well-established and organized vascular and endothelial networks (Fig. 4 A-D) as early as 11 weeks (Fig. 4A). CLDN5 mesenchymal staining specifically localized to endothelial cells, but CLDN5 was also detected in epithelial cells (Fig. 4E-H). Validation of pericyte markers (cluster 3) demonstrated these cells were specified early on in the developing human lung as evident by PDGFRβ staining as early as 11 weeks (Fig. 5A-D). Staining for MFAP2, a marker highly expressed in fibroblasts/stromal cells (cluster 4), demonstrated strong localization around airway and vascular structures (Fig. 5E-H).
Figure 4: Spatial validation of endothelial cells.

(A-D) IF staining of CD31 (Green) on 11 weeks (A), 14 weeks (B), 16 weeks (C), and 18 weeks (D) fetal human lung localized specifically in the endothelial cells. (E-H) IF staining of CLAUDIN5 (CLDN5, Red) on 11 weeks (E), 14 weeks (F), 16 weeks (G), and 18 weeks (H) human fetal lung is primarily localized in the endothelial cells with some expression in the epithelial cells. Scale bar is 50μm. (n=3 for each gestational stage)
Figure 3: Spatial validation for matrix fibroblasts.

(A-D) Immunofluorescent (IF) staining of FIBRILLIN1 (FBN1, Red) on 11 weeks (A), 14 weeks (B), 16 weeks (C) and 18 weeks (D) fetal human lung demonstrates localization within the airway and vascular smooth muscle cells. (E-H) IF co-staining of DECORIN (DCN, Red) and COL1A1 (Green) on 11 weeks (E), 14 weeks (F), 16 weeks (G) and 18 weeks (H) fetal lung demonstrates that the two colocalize throughout development in multiple cell populations. Scale bar is 50μm. (n=3 for each gestational stage)
Figure 5: Spatial validation of pericytes and stromal cells.
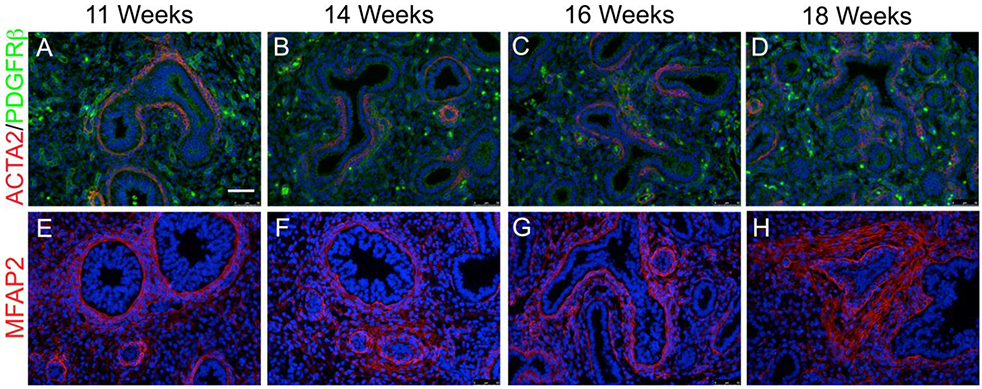
(A-D) IF co-staining of ACTA2 (Red) and PDGFR β (Green) on 11 weeks (A), 14 weeks (B), 16 weeks (C), and 18 weeks (D) native fetal human lung demonstrates the two are not co-expressed, and the presence of pericytes from an early developmental stage. (E-H) IF co-staining of MFAP2 (Red) on 11 weeks (E), 14 weeks (F), 16 weeks (G), and 18 weeks (H) native human fetal lung demonstrates strong localization around airway and vascular structures. (n=3 for each gestational stage)
Discrimination of Early Human Lung Smooth Muscle-Like Cell Phenotypes
We were particularly interested in further distinguishing the large number of cells appearing to be of mesenchymal origin. We focused our efforts on populations that were defined as smooth muscle-like based upon the detection of ACTA2 expression (n=781). We analyzed 3390 genes with highly variable expression in the 781 cells with evidence of ACTA2 expression. Among the 10 sub-clusters identified for ACTA2+ cells (Fig. 6A), a majority of them displayed low to moderate level of ACTA2 expression (Fig. 6B). A majority of the 10 sub-clusters were annotated as various classes of identifiable mesenchymal cells including fibroblasts (n=112), myofibroblasts (n=264), and pericytes (n=31). Some of the sub-clusters were annotated as identifiable smooth muscle-like cells including vascular smooth muscle, bronchial smooth muscle, stromal cells of trachea or fibroblast of aorta (Fig. 6D). Two sub-clusters clearly displayed the highest levels of ACTA2 expression (ACTA2hi). These two ACTA2hi sub-clusters had unique (as opposed to multiple) annotations for smooth muscle-like cells, with sub-cluster 0 markers annotated only as stromal cells of trachea, and sub-cluster 3 markers annotated only as vascular smooth muscle. Marker genes for these 2 sub-clusters are shown in Fig. 6C (and Supplemental Table S3) and demonstrate distinct transcriptional profiles for these two clusters.
Figure 6: Heterogeneity of Cells Expressing Smooth Muscle Actin (ACTA2) expression.

Shown is unsupervised graph-based sub-clustering of scRNA-seq data of cells expressing ACTA2 (raw count>2; n=781), visualized using t-distributed stochastic neighbor embedding (tSNE). Each point represents a single cell, identified as a separate population by unsupervised clustering (A), or colored based on the expression level of ACTA2 (B). Interestingly, cells with highest ACTA2 (ACTA2hi) expression reside in one of two clusters (0 and 3), whose marker genes identify them as myofibroblasts. (C) Shown is a heatmap displaying gene expression of cluster marker genes (n=25 each) for the two ACTA2hi cell populations (sub-clusters 0 and 3). Individual genes are represented in rows, and individual cells (n=264) are represented in columns. Yellow indicates high relative gene expression, and purple indicates low or no expression. (D) We performed in-depth cell type annotation analysis using marker genes for ACTA2 expressing populations. Shown are the frequencies for marker genes being annotated to specific lung (LungMAP) cell types. Multiple ACTA2 sub-clusters have several smooth muscle/mesenchymal stromal cell-related annotations (sub-clusters 1, 2 and 9). However, the two ACTA2hi sub-clusters have unique smooth muscle cell annotations, one associated with trachea (sub-cluster 0) and one associated with vasculature (sub-cluster 3).
Spatial Validation of Airway and Vascular Smooth Muscle Cell Markers
We examined the spatial expression patterns for ACTA2hi sub-cluster 0 and sub-cluster 3 marker genes, to test the hypothesis that they represent markers for airway and vascular smooth muscle, respectively. RNAscope FISH was performed on human fetal lung tissue at 11, 14, 16, and 18 weeks gestation for selected sub-cluster markers (n=3 for each time point). Sub-cluster 0 was characterized by high expression of FGF18, IGF1, MYLK and HHIP (Fig. 6C). FISH of HHIP, MYLK and ACTA2 clearly showed that at each gestational stage all three markers were co-expressed in the airway smooth muscle cells (Fig.7 A-A’”), with neither HHIP nor MYLK being expressed in the vascular smooth muscle cells. Similarly, IGF1 and FGF18 were co-expressed with ACTA2 in airway smooth muscle cells only but not in vascular smooth muscle cells (Fig. 7B-B’” and C-C’”). High magnification panels of these markers with airway smooth muscle ACTA2 seen in Fig. 7 A””, B””, C”” and Supplemental Fig. 4 highlight the extent of co-localization. Sub-cluster 3 was characterized by high expression of HEY2, NTRK3 and MEF2C (Fig. 6C). FISH of NTRK3/MEF2C and ACTA2 clearly demonstrates that these two markers are both predominantly co-expressed in the vascular smooth muscle cells with extremely low expression of MEF2C in the airway smooth muscle cells (Fig. 8A-A’”). Similarly, HEY2 is co-expressed with ACTA2 in vascular but not airway smooth muscle cells. HEY2 is also detected at low levels in some airway epithelial cells (Fig. 8C-C’”). The co-expression of these markers with vascular smooth muscle ACTA2 is also observed in the high magnification panels (Fig. 8 B- B’” and D-D’”).
Figure 7: Airway smooth muscle cell spatial validation.

(A-A’”) Fluorescent in situ hybridization (FISH) of hedgehog-interacting protein (HHIP) (red), myosin light-chain kinase (MYLK) (white), and ACTA2 (green) on fetal human lung sections at 11 weeks (A), 14 weeks (A), 16 weeks (A”) and 18 weeks (A’”) gestation demonstrated co-localization around the airway smooth muscles with no presence around the vascular smooth muscles. (B-B’”) FISH of insulin-like growth factor 1 (IGF-1) (Red) in conjunction with ACTA2 (green) on fetal human lung sections at different gestational stages demonstrates that IGF1 is solely localized in the airway smooth muscle cells throughout development. (C-C’”) FISH of FGF18 (Green) in conjunction with ACTA2 IF (Red) demonstrates that FGF18 is localized in the airway smooth muscled cells and lower expression in the distal epithelium between 11-18 weeks of lung development but is not expressed in the vascular smooth muscle cells. Scale bar is 50μm. High magnification panels of 16 week gestation confirm co-localization of markers within the airway smooth muscle cells (A””, B””, C””). High magnification panels for other gestations are provided in Supplemental Figure 4. Scale bar is 25μm. (n=3 for each gestational stage)
Figure 8: Vascular smooth muscle cell spatial validation.
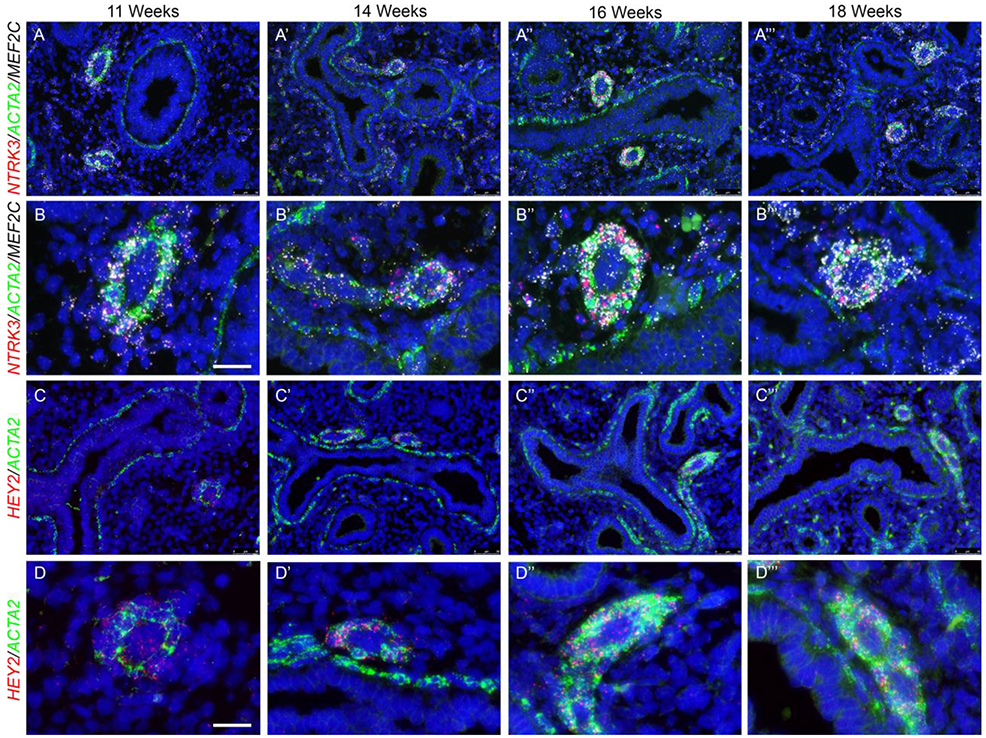
(A-A’”) FISH of neurotrophic tyrosine kinase, receptor, type 3 (NTRK3) (Red) and myocyte enhancer factor-2C (MEF2C) (White) in conjunction with ACTA2 (Green) on human fetal lung sections at different gestational stages demonstrates that NTRK3 is localized in the vascular smooth muscle cells with no expression in the airway smooth muscle cells, whereas MEF2C is predominantly expressed in the vascular smooth muscle cells with minimal expression in the airway smooth muscle cells throughout development. (B-B’”) High magnification panels to confirm co-localization of NTRK3 and MEF2C within the vascular smooth muscle cells. (C-C’”) FISH of Hairy/enhancer-of-split related with YRPW motif protein 2 (HEY2) (red) and ACTA2 (green) displayed that HEY2 is solely expressed in the vascular smooth muscle cells with some expression in the proximal epithelium, but not expression in the airway smooth muscle cells. (D-D’”) High magnification panels to confirm co-localization of HEY2 within the vascular smooth muscle cells. Scale bar is 50μm. Scale bar for high magnifications is 25μm. (n=3 for each gestational stage)
Discussion
We carried out the current study to expand our understanding of cellular phenotypes of the fetal human lung, and their molecular attributes. Prior studies by many investigators have described similar information from the adult human lung in disease states (e.g. IPF vs controls) (20, 21) and during development of animal models, most notable from the mouse (22-24). The LungMap consortium has begun to define various cell types in the developing mouse lung based on scRNAseq (25). As multiple recent studies have uncovered substantive differences in the expression of key molecules during mouse and human lung development, our studies aimed to provide a comprehensive data set with which to assess these similarities and differences on a global level. Additional analysis, and future work, will be necessary to further quantify the extent of the similarities. However, our data set already provides novel information that can be used to identify markers of discrete cell populations within the fetal human lung.
Our study has some limitations; mainly the fact that the single cell RNAseq data presented are derived from cells recovered from only 2 samples, one each at 11.5 and 18.5 weeks. It is important to note however, that statistical power for the analysis is provided by the fact that each population or cluster of cells was represented by dozens or hundreds of independent cell gene expression profiles. Moreover, the validation by ISH/IF was performed on 4 different stages of lung development and 3 independent sample per stage, that all show consistent results. Critically, each cluster contained cells from both samples (Supplemental Table S2). While the distribution of cells were not identical among samples, we were not able to determine whether these differences were biologically meaningful. Because of our interest in mesenchymal cells and in an attempt to enrich these cells and recover as many live mesenchymal cells as possible, we shortened the dissociation time which resulted on a reduction of the number of epithelial cells recovered. Therefore, our dissociation protocol is in fact somewhat selective for mesenchymal cells, as we recovered a very low percentage of epithelial cells (less than 2%). Importantly, consistent with our data, recent work suggest that standard single cell dissociation methods lead to recovery of lower than expected numbers of epithelial cells in pediatric human lung tissues (18). Notably, the frequency increases with age, and is maximal in adult tissues. However, this did not affect our ability to analyze the different mesenchymal populations in the human fetal lung.
From the data presented here, we can infer that specification of diverse populations of mesenchymal cells, including discrete fibroblast, pericyte and smooth muscle cell populations, initiates prior to 11 weeks of gestation in humans. Conversely, our data indicate that the fetal human lung contains a large number of “nonspecific” human lung mesenchymal progenitor (HLMP) cells. RNAseq analysis indicates that HLMP cells are characterized by the expression of interstitial collagens and multiple elastic fiber genes, including tropoelastin (ELN). ELN expression in the lung is thought to be highly restricted in expression at later stages (26), and in rodents (27). Whereas, in the human fetal lung, it is abundantly expressed across a large number of cell types. Interestingly, HLMP cells appear to be highly similar to so-called matrix fibroblasts observed in the developing mouse lung (25).
Our data also demonstrate that immune cells derived from the hematopoietic system, including lymphoid and myeloid cells, occupy the fetal human lung at very early stages. Macrophages are known to play a role during lung development in rodents (28). However, our data are the first to suggest that localization of varied immune cells occurs during normal human fetal lung development. The identity of these immune cells is still poorly defined at this time, but should be investigated in the future to better understand their function, and to determine their possible mechanistic role during lung development.
Myoepithelial cells are multipotent stem cells, present at the base of the submucosal glands, that have the potential to give rise to all cell types of the submucosal glands and surface epithelium in response to injury (29). These cells are characterized by the expression of both epithelial and mesenchymal cell markers (P63, KRT5 and ACTA2). In mouse lung single cell analyses, myoepithelial cells were not detected (25), likely because submucosal glands are present only in the upper part of the trachea in mouse. Whereas in human lung, submucosal glands extend from the trachea to the terminal bronchioles. To exclude low quality cells, we filtered out cells having fewer than 500 UMIs detected or with 12.5% or greater of genes being mitochondrial genes, were excluded for being likely doublets (Supplemental Figure S3). We have not completely confirmed that this approach successfully removed doublets in our data set and cannot completely exclude the possibility that the myoepithelial cell cluster contains some doublets. We did explore the relative QC metrics across individual clusters (Supplemental Figure S3), and clearly see that the myo-epithelial cell cluster (cluster #2) is near the mean for the number of genes detected per cell, the number of unique molecular identifiers per cell and the percentage of mitochondrial genes per cell. These data suggest that the cells in this cluster are not of different quality than those in other clusters which represent individual recognized cell types. Importantly, the following features also support the biological, rather than technical, nature of this cluster; a substantial proportion of cells from both samples were assigned to this cluster (90 and 212 cells, respectively; see Supplemental Table S2), the total number of genes detected in this population is similar to cells of other defined phenotype/annotation, and the number of cluster-specific marker genes is similar to cells of other defined phenotype/annotation. Therefore, the abundant presence of a population of myoepithelial cells in our analyses was interesting but not surprising. Their role and contribution to the development of the human lung is yet unknown and requires further investigation.
Mesenchymal cells types of the lung have been poorly defined relative to epithelial cell types. Airway and vascular smooth muscle cells share similar contractile functions, and both express ACTA2, but are located at distinct locations. A significant knowledge gap exists regarding the lack of specific and exclusive markers to differentiate them. Encouraged by the diversity of ACTA2+ cells revealed by sub-clustering of fetal human lung RNAseq data, we tested populations for attributes of frank smooth muscle cells. Our ontology analysis suggested that the two sub-clusters with the highest level of ACTA2 expression may represent airway smooth muscle cells (ASMC) and vascular smooth muscle cells (VSMC), respectively. FISH analysis confirmed that expression of at least a sub-set of markers differentially expressed in these two ACTA2hi populations were spatially segregated, and unique to either ASMC (e.g. MYLK and HHIP) or VSMC (MEF2c, NTRK3 and HEY2). Among the marker genes for these two ACTA2hi populations, which appear to be ASMC and VSMC respectively, there are a number of genes that encode cell surface proteins (Supplementary Table S3). Validation of these markers in future studies will be necessary to determine if these markers alone, or in combination with others, can be utilized to isolate/sort these cell populations.
Interestingly, mutations in some markers identified in vascular smooth muscle cells such as NTRK3, HEY2 and MEF2c are associated with congenital heart disease (30-33). Whereas, HHIP, identified in the ASMC have been associated in GWAS studies with COPD (34). Moreover, MYLK expression is increased in COPD samples, suggesting that this increase could be associated with ASMC hyperplasia (35). Additional studies will be required to determine the timing at which these populations become distinct in the human fetal/embryonic lung, whether marker expression continues in a unique pattern through late lung development and adulthood, and if these same markers define these spatially separate populations in other mammals.
Supplementary Material
Take Home Message.
Data presented here provide novel information on molecular markers for multiple cell types within the fetal human lung. In particular, we identify new, putative markers capable of spatially distinguishing airway and vascular smooth muscle cells.
Acknowledgements
We thank Melissa L. Wilson (Department of Preventive Medicine, University of Southern California) and Family Planning Associates for coordinating fetal tissue collection. We also thank Dr. Brendan H Grubbs and Matthew E Thornton (Department of Obstetrics and Gynecology, Maternal Fetal Medicine Division, Keck School of Medicine, University of Southern California) for tissue collection.
Funding Sources
This work is funded by NIH/NHLBI R01HL141856 (to DA), R01 DA037447 (to TJM) and the Hastings center for pulmonary research (to SD)
Footnotes
Publisher's Disclaimer: This manuscript has recently been accepted for publication in the European Respiratory Journal. It is published here in its accepted form prior to copyediting and typesetting by our production team. After these production processes are complete and the authors have approved the resulting proofs, the article will move to the latest issue of the ERJ online.
References
- 1.Chung MI, Hogan BLM. Ager-CreER(T2): A New Genetic Tool for Studying Lung Alveolar Development, Homeostasis, and Repair. Am J Respir Cell Mol Biol 2018. [DOI] [PMC free article] [PubMed] [Google Scholar]
- 2.Yang Y, Riccio P, Schotsaert M, Mori M, Lu J, Lee DK, Garcia-Sastre A, Xu J, Cardoso WV. Spatial-Temporal Lineage Restrictions of Embryonic p63(+) Progenitors Establish Distinct Stem Cell Pools in Adult Airways. Dev Cell 2018; 44: 752–761 e754. [DOI] [PMC free article] [PubMed] [Google Scholar]
- 3.Mori M, Mahoney JE, Stupnikov MR, Paez-Cortez JR, Szymaniak AD, Varelas X, Herrick DB, Schwob J, Zhang H, Cardoso WV. Notch3-Jagged signaling controls the pool of undifferentiated airway progenitors. Development 2015; 142: 258–267. [DOI] [PMC free article] [PubMed] [Google Scholar]
- 4.Jain R, Barkauskas CE, Takeda N, Bowie EJ, Aghajanian H, Wang Q, Padmanabhan A, Manderfield LJ, Gupta M, Li D, Li L, Trivedi CM, Hogan BL, Epstein JA. Plasticity of Hopx(+) type I alveolar cells to regenerate type II cells in the lung. Nat Commun 2015; 6: 6727. [DOI] [PMC free article] [PubMed] [Google Scholar]
- 5.Lange AW, Sridharan A, Xu Y, Stripp BR, Perl AK, Whitsett JA. Hippo/Yap signaling controls epithelial progenitor cell proliferation and differentiation in the embryonic and adult lung. J Mol Cell Biol 2015; 7: 35–47. [DOI] [PMC free article] [PubMed] [Google Scholar]
- 6.Volckaert T, Yuan T, Chao CM, Bell H, Sitaula A, Szimmtenings L, El Agha E, Chanda D, Majka S, Bellusci S, Thannickal VJ, Fassler R, De Langhe SP. Fgf10-Hippo Epithelial-Mesenchymal Crosstalk Maintains and Recruits Lung Basal Stem Cells. Dev Cell 2017; 43: 48–59 e45. [DOI] [PMC free article] [PubMed] [Google Scholar]
- 7.Kumar ME, Bogard PE, Espinoza FH, Menke DB, Kingsley DM, Krasnow MA. Mesenchymal cells. Defining a mesenchymal progenitor niche at single-cell resolution. Science 2014; 346: 1258810. [DOI] [PMC free article] [PubMed] [Google Scholar]
- 8.Endale M, Ahlfeld S, Bao E, Chen X, Green J, Bess Z, Weirauch MT, Xu Y, Perl AK. Temporal, spatial, and phenotypical changes of PDGFRalpha expressing fibroblasts during late lung development. Dev Biol 2017; 425: 161–175. [DOI] [PMC free article] [PubMed] [Google Scholar]
- 9.Li R, Bernau K, Sandbo N, Gu J, Preissl S, Sun X. Pdgfra marks a cellular lineage with distinct contributions to myofibroblasts in lung maturation and injury response. Elife 2018; 7. [DOI] [PMC free article] [PubMed] [Google Scholar]
- 10.Zepp JA, Zacharias WJ, Frank DB, Cavanaugh CA, Zhou S, Morley MP, Morrisey EE. Distinct Mesenchymal Lineages and Niches Promote Epithelial Self-Renewal and Myofibrogenesis in the Lung. Cell 2017; 170: 1134–1148 e1110. [DOI] [PMC free article] [PubMed] [Google Scholar]
- 11.Danopoulos S, Alonso I, Thornton ME, Grubbs BH, Bellusci S, Warburton D, Al Alam D. Human lung branching morphogenesis is orchestrated by the spatiotemporal distribution of ACTA2, SOX2, and SOX9. Am J Physiol Lung Cell Mol Physiol 2018; 314: L144–L149. [DOI] [PMC free article] [PubMed] [Google Scholar]
- 12.Miller AJ, Hill DR, Nagy MS, Aoki Y, Dye BR, Chin AM, Huang S, Zhu F, White ES, Lama V, Spence JR. In Vitro Induction and In Vivo Engraftment of Lung Bud Tip Progenitor Cells Derived from Human Pluripotent Stem Cells. Stem Cell Reports 2018; 10: 101–119. [DOI] [PMC free article] [PubMed] [Google Scholar]
- 13.Nikolic MZ, Caritg O, Jeng Q, Johnson JA, Sun D, Howell KJ, Brady JL, Laresgoiti U, Allen G, Butler R, Zilbauer M, Giangreco A, Rawlins EL. Human embryonic lung epithelial tips are multipotent progenitors that can be expanded in vitro as long-term self-renewing organoids. Elife 2017; 6. [DOI] [PMC free article] [PubMed] [Google Scholar]
- 14.Danopoulos S, Thornton ME, Grubbs BH, Frey MR, Warburton D, Bellusci S, Al Alam D. Discordant roles for FGF ligands in lung branching morphogenesis between human and mouse. J Pathol 2018. [DOI] [PMC free article] [PubMed] [Google Scholar]
- 15.Sakao S, Taraseviciene-Stewart L, Wood K, Cool CD, Voelkel NF. Apoptosis of pulmonary microvascular endothelial cells stimulates vascular smooth muscle cell growth. Am J Physiol Lung Cell Mol Physiol 2006; 291: L362–368. [DOI] [PubMed] [Google Scholar]
- 16.Yu W, Chen H, Yang H, Ding J, Xia P, Mei X, Wang L, Chen S, Zou C, Wang LX. Dissecting Molecular Mechanisms Underlying Pulmonary Vascular Smooth Muscle Cell Dedifferentiation in Pulmonary Hypertension: Role of Mutated Caveolin-1 (Cav1(F92A))-Bone Marrow Mesenchymal Stem Cells. Heart Lung Circ 2018. [DOI] [PubMed]
- 17.Johnson PR, Roth M, Tamm M, Hughes M, Ge Q, King G, Burgess JK, Black JL. Airway smooth muscle cell proliferation is increased in asthma. Am J Respir Crit Care Med 2001; 164: 474–477. [DOI] [PubMed] [Google Scholar]
- 18.Bandyopadhyay G, Huyck HL, Misra RS, Bhattacharya S, Wang Q, Mereness J, Lillis J, Myers JR, Ashton J, Bushnell T, Cochran M, Holden-Wiltse J, Katzman P, Deutsch G, Whitsett JA, Xu Y, Mariani TJ, Pryhuber GS. Dissociation, cellular isolation, and initial molecular characterization of neonatal and pediatric human lung tissues. Am J Physiol Lung Cell Mol Physiol 2018; 315: L576–L583. [DOI] [PMC free article] [PubMed] [Google Scholar]
- 19.Danopoulos S, Krainock M, Toubat O, Thornton M, Grubbs B, Al Alam D. Rac1 modulates mammalian lung branching morphogenesis in part through canonical Wnt signaling. Am J Physiol Lung Cell Mol Physiol 2016; 311: L1036–L1049. [DOI] [PMC free article] [PubMed] [Google Scholar]
- 20.Xu Y, Mizuno T, Sridharan A, Du Y, Guo M, Tang J, Wikenheiser-Brokamp KA, Perl AT, Funari VA, Gokey JJ, Stripp BR, Whitsett JA. Single-cell RNA sequencing identifies diverse roles of epithelial cells in idiopathic pulmonary fibrosis. JCI Insight 2016; 1: e90558. [DOI] [PMC free article] [PubMed] [Google Scholar]
- 21.McCauley KB, Alysandratos KD, Jacob A, Hawkins F, Caballero IS, Vedaie M, Yang W, Slovik KJ, Morley M, Carraro G, Kook S, Guttentag SH, Stripp BR, Morrisey EE, Kotton DN. Single-Cell Transcriptomic Profiling of Pluripotent Stem Cell-Derived SCGB3A2+ Airway Epithelium. Stem Cell Reports 2018; 10: 1579–1595. [DOI] [PMC free article] [PubMed] [Google Scholar]
- 22.Xie T, Wang Y, Deng N, Huang G, Taghavifar F, Geng Y, Liu N, Kulur V, Yao C, Chen P, Liu Z, Stripp B, Tang J, Liang J, Noble PW, Jiang D. Single-Cell Deconvolution of Fibroblast Heterogeneity in Mouse Pulmonary Fibrosis. Cell Rep 2018; 22: 3625–3640. [DOI] [PMC free article] [PubMed] [Google Scholar]
- 23.Montoro DT, Haber AL, Biton M, Vinarsky V, Lin B, Birket SE, Yuan F, Chen S, Leung HM, Villoria J, Rogel N, Burgin G, Tsankov AM, Waghray A, Slyper M, Waldman J, Nguyen L, Dionne D, Rozenblatt-Rosen O, Tata PR, Mou H, Shivaraju M, Bihler H, Mense M, Tearney GJ, Rowe SM, Engelhardt JF, Regev A, Rajagopal J. A revised airway epithelial hierarchy includes CFTR-expressing ionocytes. Nature 2018; 560: 319–324. [DOI] [PMC free article] [PubMed] [Google Scholar]
- 24.Wang Y, Tang Z, Huang H, Li J, Wang Z, Yu Y, Zhang C, Li J, Dai H, Wang F, Cai T, Tang N. Pulmonary alveolar type I cell population consists of two distinct subtypes that differ in cell fate. Proc Natl Acad Sci U S A 2018; 115: 2407–2412. [DOI] [PMC free article] [PubMed] [Google Scholar]
- 25.Du Y, Kitzmiller JA, Sridharan A, Perl AK, Bridges JP, Misra RS, Pryhuber GS, Mariani TJ, Bhattacharya S, Guo M, Potter SS, Dexheimer P, Aronow B, Jobe AH, Whitsett JA, Xu Y. Lung Gene Expression Analysis (LGEA): an integrative web portal for comprehensive gene expression data analysis in lung development. Thorax 2017; 72: 481–484. [DOI] [PMC free article] [PubMed] [Google Scholar]
- 26.Stenmark KR, Durmowicz AG, Roby JD, Mecham RP, Parks WC. Persistence of the fetal pattern of tropoelastin gene expression in severe neonatal bovine pulmonary hypertension. J Clin Invest 1994; 93: 1234–1242. [DOI] [PMC free article] [PubMed] [Google Scholar]
- 27.Mariani TJ, Reed JJ, Shapiro SD. Expression profiling of the developing mouse lung: insights into the establishment of the extracellular matrix. Am J Respir Cell Mol Biol 2002; 26: 541–548. [DOI] [PubMed] [Google Scholar]
- 28.Tan SY, Krasnow MA. Developmental origin of lung macrophage diversity. Development 2016; 143: 1318–1327. [DOI] [PMC free article] [PubMed] [Google Scholar]
- 29.Lynch TJ, Anderson PJ, Rotti PG, Tyler SR, Crooke AK, Choi SH, Montoro DT, Silverman CL, Shahin W, Zhao R, Jensen-Cody CW, Adamcakova-Dodd A, Evans TIA, Xie W, Zhang Y, Mou H, Herring BP, Thorne PS, Rajagopal J, Yeaman C, Parekh KR, Engelhardt JF. Submucosal Gland Myoepithelial Cells Are Reserve Stem Cells That Can Regenerate Mouse Tracheal Epithelium. Cell Stem Cell 2018; 22: 653–667 e655. [DOI] [PMC free article] [PubMed] [Google Scholar]
- 30.Werner P, Paluru P, Simpson AM, Latney B, Iyer R, Brodeur GM, Goldmuntz E. Mutations in NTRK3 suggest a novel signaling pathway in human congenital heart disease. Hum Mutat 2014; 35: 1459–1468. [DOI] [PMC free article] [PubMed] [Google Scholar]
- 31.Donovan J, Kordylewska A, Jan YN, Utset MF. Tetralogy of fallot and other congenital heart defects in Hey2 mutant mice. Curr Biol 2002; 12: 1605–1610. [DOI] [PubMed] [Google Scholar]
- 32.Fischer A, Klamt B, Schumacher N, Glaeser C, Hansmann I, Fenge H, Gessler M. Phenotypic variability in Hey2 −/− mice and absence of HEY2 mutations in patients with congenital heart defects or Alagille syndrome. Mamm Genome 2004; 15: 711–716. [DOI] [PubMed] [Google Scholar]
- 33.Qiao XH, Wang F, Zhang XL, Huang RT, Xue S, Wang J, Qiu XB, Liu XY, Yang YQ. MEF2C loss-of-function mutation contributes to congenital heart defects. Int J Med Sci 2017; 14: 1143–1153. [DOI] [PMC free article] [PubMed] [Google Scholar]
- 34.Hobbs BD, de Jong K, Lamontagne M, Bosse Y, Shrine N, Artigas MS, Wain LV, Hall IP, Jackson VE, Wyss AB, London SJ, North KE, Franceschini N, Strachan DP, Beaty TH, Hokanson JE, Crapo JD, Castaldi PJ, Chase RP, Bartz TM, Heckbert SR, Psaty BM, Gharib SA, Zanen P, Lammers JW, Oudkerk M, Groen HJ, Locantore N, Tal-Singer R, Rennard SI, Vestbo J, Timens W, Pare PD, Latourelle JC, Dupuis J, O'Connor GT, Wilk JB, Kim WJ, Lee MK, Oh YM, Vonk JM, de Koning HJ, Leng S, Belinsky SA, Tesfaigzi Y, Manichaikul A, Wang XQ, Rich SS, Barr RG, Sparrow D, Litonjua AA, Bakke P, Gulsvik A, Lahousse L, Brusselle GG, Stricker BH, Uitterlinden AG, Ampleford EJ, Bleecker ER, Woodruff PG, Meyers DA, Qiao D, Lomas DA, Yim JJ, Kim DK, Hawrylkiewicz I, Sliwinski P, Hardin M, Fingerlin TE, Schwartz DA, Postma DS, MacNee W, Tobin MD, Silverman EK, Boezen HM, Cho MH, Investigators CO, Investigators E, LifeLines I, Group SR, International CGNI, Investigators UKB, International CGC. Genetic loci associated with chronic obstructive pulmonary disease overlap with loci for lung function and pulmonary fibrosis. Nat Genet 2017; 49: 426–432. [DOI] [PMC free article] [PubMed] [Google Scholar]
- 35.Rouillard AD, Gundersen GW, Fernandez NF, Wang Z, Monteiro CD, McDermott MG, Ma'yan A. The harmonizome: a collection of processed datasets gathered to serve and mine knowledge about genes and proteins. Database (Oxford) 2016; 2016. [DOI] [PMC free article] [PubMed] [Google Scholar]
Associated Data
This section collects any data citations, data availability statements, or supplementary materials included in this article.