Abstract
Objective
To determine whether the nucleus basalis of Meynert (NBM) may be a key network structure of altered functional connectivity in temporal lobe epilepsy (TLE), we examined fMRI with network-based analyses.
Methods
We acquired resting-state fMRI in 40 adults with TLE and 40 matched healthy control participants. We calculated functional connectivity of NBM and used multiple complementary network-based analyses to explore the importance of NBM in TLE networks without biasing our results by our approach. We compared patients to controls and examined associations of network properties with disease metrics and neurocognitive testing.
Results
We observed marked decreases in connectivity between NBM and the rest of the brain in patients with TLE (0.91 ± 0.88, mean ± SD) vs controls (1.96 ± 1.13, p < 0.001, t test). Larger decreases in connectivity between NBM and fronto-parietal-insular regions were associated with higher frequency of consciousness-impairing seizures (r = −0.41, p = 0.008, Pearson). A core network of altered nodes in TLE included NBM ipsilateral to the epileptogenic side and bilateral limbic structures. Furthermore, normal community affiliation of ipsilateral NBM was lost in patients, and this structure displayed the most altered clustering coefficient of any node examined (3.46 ± 1.17 in controls vs 2.23 ± 0.93 in patients). Abnormal connectivity between NBM and subcortical arousal community was associated with modest neurocognitive deficits. Finally, a logistic regression model incorporating connectivity properties of ipsilateral NBM successfully distinguished patients from control datasets with moderately high accuracy (78%).
Conclusions
These results suggest that while NBM is rarely studied in epilepsy, it may be one of the most perturbed network nodes in TLE, contributing to widespread neural effects in this disabling disorder.
Temporal lobe epilepsy (TLE) is the most common epilepsy syndrome.1 While TLE is a focal epilepsy in that seizures originate in hippocampus or amygdala of the limbic system, it leads to widespread neural effects. Patients experience ictal loss of consciousness, even when seizures do not propagate beyond these limbic structures.2 Between seizures, patients demonstrate neurocognitive deficits in domains not typically related to mesial temporal function.3,4 These observations may suggest a common subcortical source of global network dysfunction in TLE.5
It has been demonstrated that disruption of subcortical arousal circuits may contribute to ictal loss of consciousness in TLE.6 We have hypothesized that recurrent seizures might incur long-term subcortical arousal network disruptions.5,7 In patients with TLE, we uncovered abnormal interictal fMRI connectivity of brainstem ascending reticular activating system (ARAS) and intralaminar thalamus.8,9 Currently, most TLE studies focus on limbic network, and while few studies examine arousal networks in TLE, they may be central in its interictal pathophysiologic sequelae.5 Other important subcortical arousal networks have not yet been explored in human TLE.
The nucleus basalis of Meynert (NBM) plays prominent roles in arousal, influences neurocognition, has dense anatomic projections to limbic structures, and may help regulate functional networks.10–14 In rodent TLE models, focal seizures lead to diminished activity in NBM, resulting in neocortical deactivation.15 Might recurrent seizures in TLE produce long-term NBM connectivity disruptions, leading to broader network dysfunction? Here we use complementary network analyses to determine whether NBM may be an underappreciated yet key network node of altered connectivity in TLE.
Methods
Participants
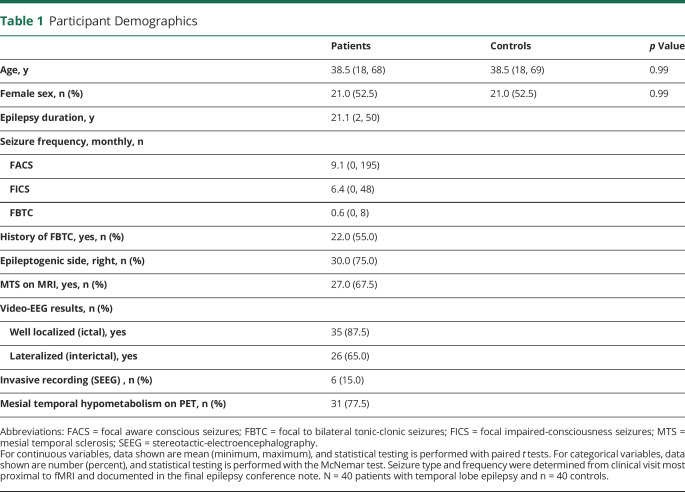
Participants included 40 consecutive adult patients with unilateral mesial TLE who underwent epilepsy surgery evaluation and agreed to participate in our study and undergo an additional research MRI at Vanderbilt University Medical Center. A multidisciplinary team established diagnosis of mesial TLE by assessing patient history, structural MRI, seizure semiology, ictal/interictal video-EEG, neuropsychological examination, and mesial temporal hypometabolism on PET. We also included 40 healthy control participants from a larger population of previously recruited controls. Before analyses, we individually matched controls to patients by age (typically ±3 years, maximum ±5 years) and sex (table 1).
Table 1.
Participant Demographics
Standard Protocol Approvals, Registrations, and Patient Consents
All procedures were approved by Vanderbilt University Institutional Review Board. All participants gave written informed consent for study.
Imaging
As in prior studies,8 we performed imaging with the Philips Achieva 3T MRI (Philips Healthcare, Best, the Netherlands) and 32-channel head coil. MRI sequences included (1) 3D T1-weighted whole-brain images for tissue segmentation and interparticipant normalization (1.0 × 1.0 × 1.0 mm3), (2) 2D T1-weighted axial images for functional-to-structural image coregistration (1.0 × 1.0 × 4.0 mm3), and (3) 2 resting-state eyes-closed 10-minute T2*-weighted blood oxygenation level–dependent (BOLD) fMRI (echo time 35.0 milliseconds, repetition time 2.0 seconds, 34 axial slices, slice thickness 3.5 mm with 0.5-mm gap, 3.0 × 3.0 × 4.0 mm3). All resting-state fMRI sessions included instructions to lie at rest with eyes closed for the scan. We performed physiologic monitoring of respiratory and cardiac rates at 500 Hz.
Regions of Interest
We defined 133 regions of interest (ROIs) for functional connectivity analyses. These included 108 ROIs from the Harvard-Oxford atlas,16 which we call whole brain. From a subset of Harvard-Oxford regions, we defined a collection of frontal, parietal, and insular regions (frontoparietal) that previously showed decreased connectivity with arousal structures in TLE.8,17 These regions included bilateral inferior frontal gyrus pars opercularis and pars triangularis, precentral gyrus, postcentral gyrus, superior parietal lobule, and insula. We included 8 participant-specific intralaminar thalamic nuclei, the implementation of which we previously described.9,18,19 We also incorporated 13 brainstem ARAS nuclei from the Harvard Ascending Arousal Network Atlas.20 Finally, we analyzed 2 bilateral ROIs consisting of cholinergic basal forebrain nuclei obtained by previous groups from postmortem stereotaxic probabilistic mapping of magnocellular cells.10,21 The first of these ROIs included the diagonal band of Broca and septal nuclei. The second included the NBM. We acquired Montreal Neurological Institute space masks for these ROIs from the SPM Anatomy toolbox with a probabilistic threshold >50%.22 Last, all nonmidline ROIs were designated as either ipsilateral or contralateral to the epileptogenic side of the brain per patient, and ROIs of matched controls were defined accordingly.
Functional Connectivity Analysis
We used CONN toolbox 17 to visualize seed-to-voxel NBM bivariate correlation functional connectivity differences between patients with TLE and controls.23 We aligned patients' imaging laterality according to epileptogenic side and realigned images of matched controls accordingly.
For detailed analysis of connectivity differences, we calculated functional connectivity matrices for each participant. We preprocessed fMRI with MATLAB 2017a (MathWorks, Natick, MA) and SPM12.24 Preprocessing included slice-timing correction, motion correction, retrospective correction of physiologic motion effects (RETROICOR),25 tissue segmentation (white matter, gray matter, and CSF), and spatial normalization to the Montreal Neurological Institute template. We temporally bandpass filtered fMRI between 0.0067 and 0.1 Hz. The average time series of each ROI was calculated with participant-specific CSF and white matter segmentations to exclude these signals. For each individual fMRI acquisition per participant, we calculated functional connectivity between ROIs by partial Pearson correlation between the mean BOLD time series of each region, with 6 motion time series (3 degrees of translation: x, y, and z dimensions; and 3 degrees of rotation: roll, pitch, and yaw) and mean white matter BOLD serving as confounds. We transformed these correlations using Fisher z transformation per participant. We averaged connectivity across both fMRI resting-state sessions. This yielded a symmetric 133 × 133 functional connectivity matrix with self-connections along diagonal set to zero. We calculated clustering coefficient of all ROIs with the Brain Connectivity Toolbox.26 Clustering coefficient assesses connectivity of a node with its neighbors; a high clustering coefficient indicates that neighbors of a node are more connected with each other. This connectivity matrix was also used for comparison of seed-based NBM connectivity, community detection, and network-based statistic described below.
Community Analyses and Network-Based Statistic
To complement seed-based NBM connectivity comparisons, we analyzed how the community structure of NBM may change in TLE with community detection. Community detection algorithms identify groups of brain nodes that are most strongly functionally connected to each other. First, we calculated community structure in healthy controls by optimization of modularity.27 To detect stable community modules, we performed community detection with a parameter sweep of resolution parameter γM = 1.30, 1.31, 1.32…2.50 using the Louvain algorithm with iterative adjustments.28–30 We selected community partitions in controls at γM exhibiting maximum normalized mutual information across partition pairs.
To compare community structure between patients and controls, we used control community structure to calculate a community-based property in all participants: node strength to module. Node strength to module is defined for each node as the sum of connectivity to all nodes within a module divided by the size of that module. For a particular node, node strength to module should be maximum to its home community as defined from the healthy control community structure. Maximal node strength to module outside of the control home community represents abnormal community structure. We focused our analyses on node strength to module of NBM with its home community.
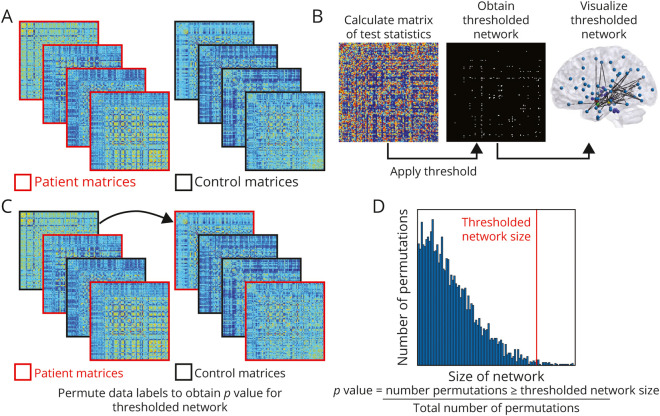
We also used the network-based statistic to identify core networks of connected nodes with connectivity decreases in patients compared to controls.31 The network-based statistic is a nonparametric method that controls the family-wise error rate when performing mass univariate testing on network connections. We used a range of primary t test thresholds (t statistic >4.2, 4.4, 4.6) for each link to define a set of suprathreshold component networks and their size (number of links). Next, we calculated a family-wise error correction for the component network by randomly permuting patient and control labels 10,000 times and repeating calculations per permutation. This generated a null distribution of component sizes and allowed identification of thresholded network components showing significant connectivity decreases in patients vs controls with family-wise error–corrected significance p < 0.01. We used the BrainNet viewer for decreased connectivity network visualization.32
Integrative Explanatory and Predictive Network Modeling
We next sought to integrate our findings by postulating several biologically motivated hypotheses for what may be driving our observed effects, operationalizing these hypotheses in 4 explanatory network models, and comparing these models. We wanted to determine whether NBM properties were driving observed differences or whether these differences resulted from other network properties. Each of the 4 network models isolated individual network differences between patient and control community structures. We used unbiased network-sampling methods33 to compare models to find the simplest model that explains central connectivity network difference between patients and controls.
The 4 network models were as follows:
Model 1: posits that main network differences observed can be explained by nonspecific, global changes in connectivity between control and patient populations. We operationalized this model by only constraining overall connectivity density of all nodes.
Model 2: posits a primary role for nonspecific disruptions within limbic system only. We operationalized this model by constraining average connectivity between nodes in limbic system module only.
Model 3: assumes an important role for connectivity of NBM ipsilateral to epileptogenic side of the brain, as well as the entire limbic system. We operationalized this model by constraining connectivity density within the limbic system module and constraining ipsilateral NBM strength.
Model 4: full model that preserves the average connectivity of all individual nodes and all individual modules. We considered this our full explanatory model of observed effects.
We compared individual models by generating 1,000 random networks for each individual participant that preserved specific constraints of each model but were otherwise maximally random.33,34 These networks were generated with simulated annealing, a popular optimization algorithm that nearly uniformly samples networks with specified constraints.33
The explanatory power of each model was assessed by considering extent to which the models explained all observed connectivity changes. Thus, for all networks generated in the 4 models, we calculated the main network metrics analyzed: NBM connectivity with the whole brain, NBM clustering coefficient, and node strength to module of ipsilateral NBM to limbic community. Either nonparametric Wilcoxon rank-sum test (for nonnormally distributed data) or t test (for normally distributed data) was used to evaluate differences between original participant data and data calculated from models. First, rank-sum statistic or t statistic was calculated, comparing original patient and original control metric. The test statistic was also calculated for the same metric per network model, comparing randomly perturbed patient networks (4,000 total networks) to the randomly perturbed control networks (4,000 total networks). A network model was considered to capture observed differences in patients with TLE if the network model differences were not distinguishable from differences between patients and controls seen in the empirical data.
Neurocognitive Testing and Epilepsy Measures
We also asked how NBM network properties may be related to clinical measures of disease severity and neurocognition. We determined patient demographics and epilepsy measures using treating epileptologists' assessments (table 1). Disease measures included MRI evidence of mesial temporal sclerosis, epilepsy duration, seizure type and frequency, and history of focal to bilateral tonic-clonic (secondarily-generalized) seizures. A licensed neuropsychologist administered comprehensive neuropsychological testing to patients, which we summarized into 6 neurocognitive categories as in prior work.17 We evaluated attention and concentration using Trail Making Test Part A, Digit Span Forward, Digit Span Backward, and Wechsler Adult Intelligence Scale –Fourth Edition Digit Span Sequencing. Visual memory testing included Brief Visuospatial Memory Test–Revised, Continuous Visual Memory Test, and Rey-Osterrieth Complex Figure Test. We tested cognitive processing with Working Memory Index. We tested language using Boston Naming Test, Neuropsychological Assessment Battery Naming Test, or Animal Naming. We evaluated verbal memory using California Verbal Learning Test part II and Wechsler Memory Scale (third and fourth editions). We evaluated executive function with Wisconsin Card Sorting Test, F-A-S Words, and Trail Making Test Part B. Overall performance per patient per neurocognitive domain was obtained by converting the score on each test to a z score and then averaging performance on all tests in each domain.
Logistic Regression
To further elucidate the reliability of NBM connectivity alterations in TLE, we asked whether connectivity properties of ipsilateral NBM alone could accurately identify whether each participant's dataset belonged to a patient or control. For comparison, we evaluated connectivity of ipsilateral hippocampus in identifying patients vs controls because it is known that connectivity of this limbic structure is markedly altered in TLE.35–37 Three key network properties were selected to generate 2 combinatory, binary logistic regression models. These measures, calculated for NBM and hippocampus, included (1) functional connectivity to the whole brain, (2) clustering coefficient, and (3) node strength to module. We trained logistic regression models on all patient and control data. To ascertain model performance variability, we used bootstrapping with 5-fold cross-validation to subsample the total participant population. We also calculated receiver operating characteristic curves and their associated measurements.
General Statistical Approaches
We used parametric tests for normally distributed data, as defined by use of the Anderson-Darling test,38 or nonparametric tests otherwise. We compared demographics in patients with TLE vs controls using paired t tests for continuous variables and the McNemar test for categorical variables. We used paired t tests to compare functional connectivity between patients and controls. We used the Mann-Whitney U test to compare network properties (clustering coefficient and node strength to module) between participant groups. We used the Pearson correlation to relate functional connectivity to continuous variable disease measures and the Spearman ρ to relate network properties to neuropsychological testing because these properties were not normally distributed. Statistical analyses were performed with MATLAB 2017a and SPSS 23 (Armonk, NY). We prospectively defined statistical significance at p < 0.05 for all tests and used post hoc Bonferroni-Holm to correct for multiple comparisons when indicated.
Data Availability
Due to restrictions from participant informed consent, data will not be made freely available in a public repository. Anonymized data can be made available on request if approved by our Institutional Review Board.
Results
NBM Functional Connectivity Is Decreased in Patients With TLE
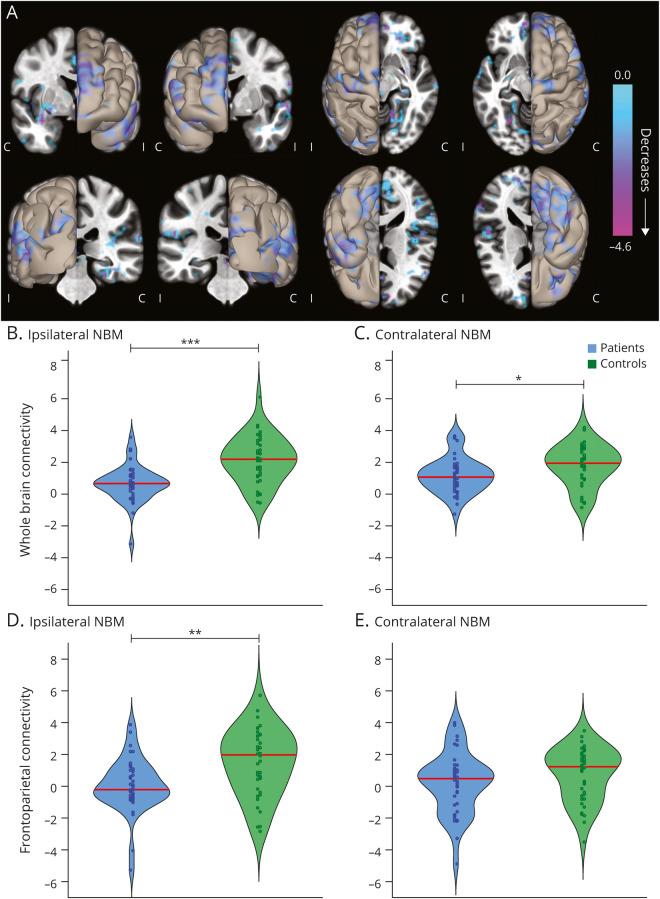
We first asked whether overall functional connectivity of NBM differs between 40 patients with unilateral mesial TLE and 40 healthy matched controls (demographics in table 1). In a voxel-wise comparison of bilateral NBM connectivity, we observed that patients displayed connectivity decreases between NBM and broad neocortical regions compared to controls (figure 1A). Overall, connectivity between NBM and the whole brain was reduced in patients on both the ipsilateral (0.65 ± 1.11 patients, 2.13 ± 1.43 controls, mean ± SD) and contralateral (1.18 ± 1.10 patients, 1.79 ± 1.25 controls) sides, with respect to side of seizure onset (p = 9 × 10⁻⁶ and p = 0.03, respectively, paired t tests, Bonferroni-Holm correction, figure 1, B and C). We noted large decreases in connectivity between ipsilateral NBM and frontoparietal cortex in patients (0.04 ± 1.66 patients, 1.47 ± 2.05 controls; figure 1D, p = 0.004) but observed no differences in contralateral NBM (0.20 ± 1.88 patients, 0.73 ± 1.63 controls, p = 0.18, paired t tests, Bonferroni-Holm correction, figure 1E). We observed greater connectivity decreases between NBM and frontoparietal cortex in patients with higher frequency of consciousness-impairing focal seizures (r = −0.41, p = 0.008) but saw no relationship between NBM-frontoparietal connectivity and frequency of consciousness-sparing focal seizures (r = −0.13, p = 0.418, Pearson correlation, uncorrected). Overall, these results demonstrate impaired NBM connectivity in TLE that is larger on the epileptogenic side of the brain and may be related to consciousness-impairing seizure frequency.
Figure 1. Functional Connectivity of the NBM Is Decreased in Patients With TLE Compared to Controls.
(A) Data represent seed-to-voxel fMRI functional connectivity maps (bivariate correlation) seeded from bilateral nucleus basalis of Meynert (NBM), comparing patients with temporal lobe epilepsy (TLE) vs control participants (paired t test, cluster threshold level p < 0.05, false discovery rate correction). These seed-to-voxel group-level comparisons are projected onto an average brain template. Negative contrasts are shown, and no connectivity increases were seen in patients. fMRIs are oriented with respect to the side of seizure onset for patients with TLE, and matched controls images are flipped accordingly. In evaluating functional connections between NBM and all other regions in the brain (excluding cerebellum), NBM connectivity reductions in patients with TLE vs controls are observed both (B) ipsilateral and (C) contralateral to the side of seizure onset. Restricting the analysis to selected frontoparietal regions, large reductions in NBM connectivity are noted in patients vs controls on the (D) ipsilateral but not (E) contralateral side. Red line shows median. N = 40 patients with TLE and 40 matched healthy control participants. C = contralateral; I = ipsilateral. ***p < 0.001, **p < 0.01, *p < 0.05, paired t tests with Bonferroni-Holm correction.
Patients With TLE Exhibit Altered NBM and Limbic Network Community Structure
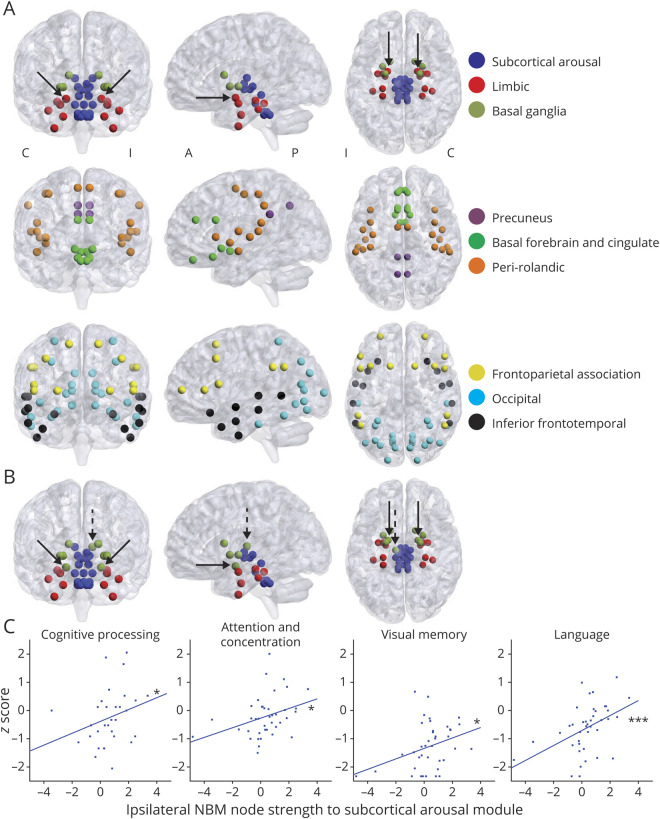
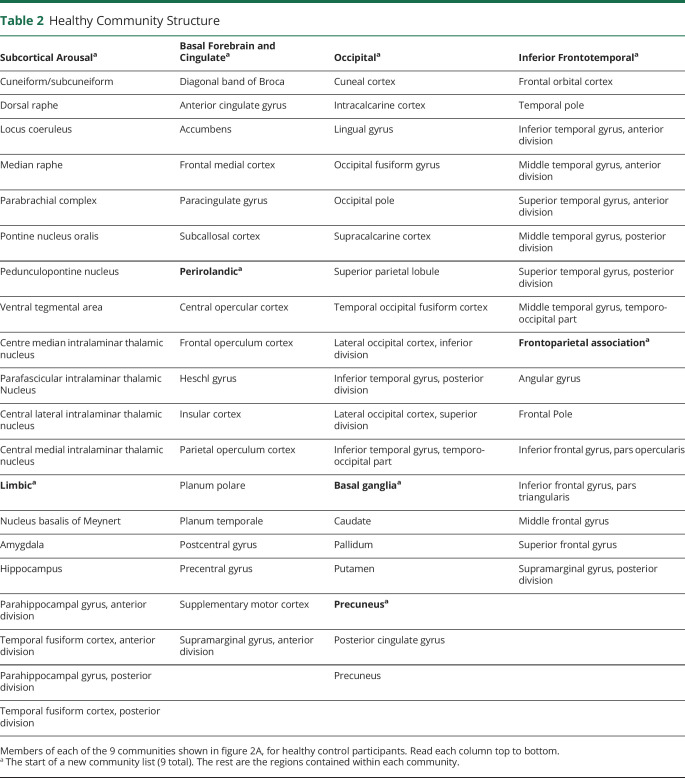
We also interrogated network connectivity by comparing community structure in controls with community structure in patients. First, in healthy controls, we identified 9 anatomically symmetric communities (figure 2A, regions per community in table 2). In controls, all brainstem ARAS and intralaminar thalamic nuclei clustered into 1 community we called subcortical arousal, while ipsilateral and contralateral NBM clustered into a community with limbic structures, including hippocampus and amygdala (figure 2A). This may suggest closer functional connections between NBM and limbic structures than with other subcortical arousal nuclei in controls.
Figure 2. Community Structure of NBM Is Altered in TLE.
(A) Communities were first defined in healthy control participants, and 9 communities were detected. We named these communities on the basis of anatomic and functional similarities between regions. Both ipsilateral and contralateral nucleus basalis of Meynert (NBM) (solid arrows) clustered together with limbic structures (red) and did not cluster within a community including other subcortical arousal nuclei, including ascending reticular activating system and intralaminar thalamic nuclei (blue). A list of all communities and nodes is provided in table 2. N = 40 healthy control participants. (B) When this community structure was applied to patients with temporal lobe epilepsy (TLE) and node strength to module was calculated, ipsilateral and contralateral NBM (solid arrows) in patients did not cluster (i.e., did not demonstrate maximum node strength to module) with the limbic community as in controls. Instead, these nodes clustered with the basal ganglia community. Other nodes that clustered with different communities in patients compared to controls included ipsilateral central lateral thalamic nucleus (dashed arrow), as well as ipsilateral frontal operculum cortex, ipsilateral orbitofrontal cortex, and contralateral orbitofrontal cortex (not shown). N = 40 patients with TLE. (C) We compared performance on neurocognitive testing in patients with ipsilateral NBM node strength to subcortical arousal module to determine whether there were any associations. On the y-axis for each plot is z-score performance in each domain in the title, and on x-axis in each plot is ipsilateral NBM node strength to subcortical module. We observed trends toward increasing node strength to module between ipsilateral NBM and subcortical arousal module associated with improved performance on tests measuring cognitive processing (n = 31 patients), attention and concentration (n = 40 patients), visual memory (n = 40 patients), and language abilities (n = 40 patients). A = anterior; C = contralateral; I = ipsilateral; P = posterior. ***p < 0.001, *p < 0.05, Spearman ρ, uncorrected.
Table 2.
Healthy Community Structure
To determine whether if communities differ in patients, we then calculated node strength to module, which should be maximal to the home community module of a node. While in controls both ipsilateral and contralateral NBM had maximal node strength to module with limbic community, in patients both NBMs demonstrated abnormal maximal node strength to module with basal ganglia community (figure 2B, solid arrows). This suggests that NBM no longer clusters with its home community in TLE. Other structures that did not cluster with their home community in patients included ipsilateral central lateral thalamic nucleus (figure 2B, dashed arrow), ipsilateral frontal operculum cortex, and ipsilateral and contralateral orbitofrontal cortex. All other 127 (95.5%) regions clustered with their home communities in TLE. Notably, all limbic regions except for NBM clustered in their home limbic community, suggesting that NBM may be among the most affected limbic structures.
Next, we asked whether functional connectivity disturbances of subcortical arousal communities are related to neurocognitive dysfunction in TLE. We measured node strength to module of ipsilateral NBM with subcortical arousal community and detected a clinically interesting but nonsignificant trend toward lower strength in this connection in patients (0.35 ± 1.45, mean ± SD) vs controls (0.91 ± 1.37, p = 0.07, Mann-Whitney U test). In patients, we noted modest trends toward improved performance on multiple neurocognitive measures with increasing (i.e., closer to controls) node strength to module between ipsilateral NBM and the subcortical arousal community (figure 2C). These included cognitive processing (r = 0.37, p = 0.035), attention and concentration (r = 0.39, p = 0.011), visual memory (r = 0.32, p = 0.039), and language abilities (r = 0.53, p < 0.001, Spearman ρ, uncorrected). There was no relationship between this node strength to module and either executive function or verbal memory (r = 0.22–0.29, p = 0.067–0.163, Spearman ρ, uncorrected). These findings suggest that aberrant connectivity between ipsilateral NBM and subcortical arousal network may be moderately related to worse neurocognitive performance in TLE.
Ipsilateral NBM Is a Key Node in a Central Network of Altered Connectivity in TLE
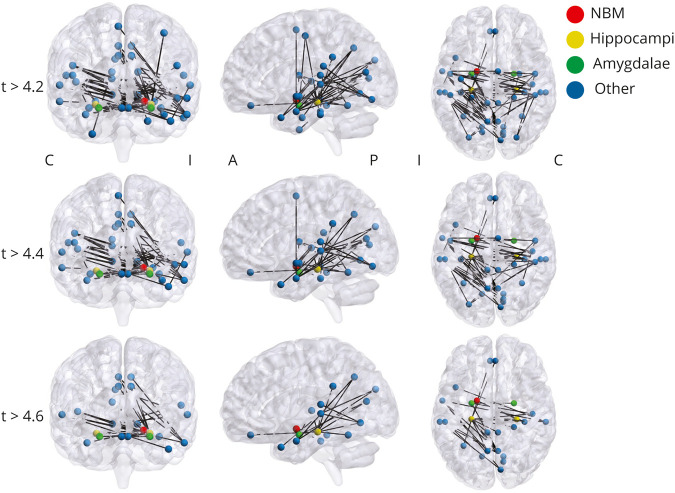
We next used the network-based statistic to expand on seed-based and community-based connectivity analyses and to define a network of functional connections that are reduced in patients with TLE compared to controls (figure 3). At multiple thresholds, we identified a network of decreased connections involving ipsilateral but not contralateral NBM, bilateral hippocampi and amygdalae, and other structures (figure 4). At a primary threshold of t statistic > 4.6, 27 edges remained suprathreshold in the network out of 8,778 possible altered connections. These included 2 of 27 edges involving ipsilateral NBM and 13 of 27 edges involving ipsilateral hippocampus. Although we have previously shown that other subcortical arousal structures have altered connectivity in TLE, ipsilateral NBM was the only subcortical arousal structure in this decreased connectivity network.
Figure 3. Calculation of the Network-Based Statistic in Patients With Temporal Lobe Epilepsy and Controls.
(A) Functional connectivity matrices for each participant are calculated. (B, left) A test statistic (t test) is calculated at each cell of the connectivity network. Then network components of interest are identified using a primary threshold of t statistic > 4.2, 4.4, 4.6. This thresholded network can be visualized in a matrix (B, middle) where white cells represent suprathreshold links or in a schematic diagram (B, right) where connected nodes represent the suprathreshold network components. (C) Random permutation of data labels (10,000 permutations) across participants is then applied to calculate family-wise error. (D) After the calculations are repeated on every permutation, a null distribution is generated, and family-wise error rate at desired level of p < 0.01 is controlled in the final result.
Figure 4. Core Network of Altered Connectivity in TLE Includes Bilateral Mesial Temporal Structures and Ipsilateral NBM.
Network-based statistic reveals a central network of nodes and edges that are altered in patients vs controls. This component network was tested at multiple t statistic thresholds, and the network contained 43 nodes and 66 edges at t > 4.2, 35 nodes and 49 edges at t > 4.4, and 24 nodes and 27 edges at t > 4.6. At multiple t statistic thresholds, this network included ipsilateral but not contralateral nucleus basalis of Meynert (NBM), included bilateral hippocampi and amygdalae, but did not include other subcortical arousal nuclei. Network-based statistic is performed at p < 0.01 with family-wise error correction. N = 40 patients with temporal lobe epilepsy (TLE) and 40 matched healthy control participants. A = anterior; C = contralateral; I = ipsilateral; P = posterior.
To further probe altered networks in TLE, we calculated clustering coefficient of all nodes across all participants. We found that NBM exhibited lower clustering coefficients in patients than in controls on both ipsilateral (2.23 ± 0.93 patients, 3.46 ± 1.17 controls, p = 3.38 × 10⁻⁶) and contralateral (2.63 ± 0.85 patients, 3.32 ± 1.12 controls, p = 0.005, Mann-Whitney U test, Bonferroni-Holm correction) sides. Notably, ipsilateral NBM exhibited the single greatest decrease in clustering coefficient in patients out of all 133 regions examined. In comparison, ipsilateral hippocampus and ipsilateral amygdala demonstrated 3rd and 12th largest decreases in clustering coefficient, respectively, in patients compared to controls. Overall, these results suggest that NBM ipsilateral to epileptogenic zone represents a key structure in the altered TLE network.
A Cohesive Network Model Explains the Key Role of NBM and Limbic System in TLE Networks
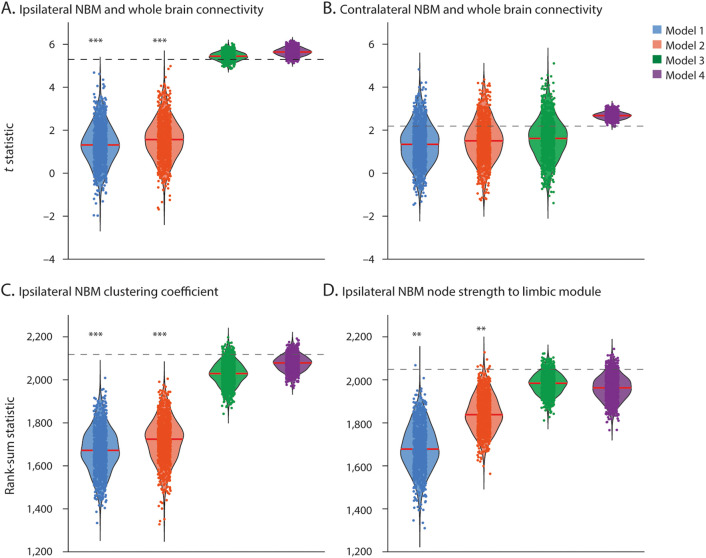
We next used an integrative modeling framework to identify the simplest model to cohesively account for key network connectivity abnormalities in patients (figure 5). Model 1 (controlling connectivity density) assumed that network differences can be explained by nonspecific, global network changes present in TLE. Model 2 (controlling limbic only) posited that network disruptions in the limbic system alone would account for the connectivity differences observed. Model 3 (controlling limbic and NBM) assumed that disruptions in both the limbic system and ipsilateral NBM play important roles in explaining observed findings. Model 4 (controlling nodes and modules) was a full explanatory model preserving average connectivity of all individual nodes and modules.
Figure 5. Network Models Explain Connectivity Differences Between Patients With TLE and Controls.
Data points represent test statistics (t statistic for normally distributed data or rank-sum statistic for nonnormally distributed data) quantifying differences between patient and control null models (1,000 data points per null model). Dashed line represents the original data test statistic. Models with sufficient data points above the line represent network models that capture the difference between patients and controls observed in empirical data. (A) Reduced connectivity of ipsilateral nucleus basalis of Meynert (NBM) with the whole brain is best explained by models 3 and 4, while (B) reductions in contralateral NBM connectivity with the whole brain are explained equally well by all models. Decreases in (C) ipsilateral NBM clustering coefficient and (D) ipsilateral NBM node strength to limbic module are best explained by models 3 and 4. The 4 models are defined in the Methods section. Red line shows median. N = 1,000 comparisons per model. ***p < 0.001, **p < 0.01, t statistic or rank-sum statistic.
When we considered reduced connectivity between ipsilateral NBM and the whole brain, models 1 and 2 were rejected and thus did not explain the finding, whereas models 3 and 4 were not rejected and could explain observed differences (figure 5A). This suggests that widespread alterations of ipsilateral NBM functional connectivity are most simply explained by the combination of network changes in both the limbic community and ipsilateral NBM because model 3 is less constrained than model 4. In contrast, when we considered reduced connectivity between contralateral NBM and the whole brain, none of the 4 models were rejected; thus, all could explain the result (figure 5B). Therefore, reduced connectivity of contralateral NBM might simply be reflective of nonspecific, global network changes in TLE. When we evaluated 2 other major findings in our study, diminished clustering coefficient of ipsilateral NBM (figure 5C) and altered strength between ipsilateral NBM and the limbic module (figure 5D), models 1 and 2 were rejected, while models 3 and 4 were not. Thus, model 3 was the simplest model to account for both these findings. Together, these results suggest that abnormalities in both ipsilateral NBM and the limbic community may be central to the core network perturbations we observed in TLE and that these findings are not simply related to nonspecific, global network changes.
Ipsilateral NBM Network Properties Alone May Distinguish Patients With TLE From Controls
Finally, we investigated whether ipsilateral NBM network measures alone are sufficient to predict whether each participant's dataset belonged to a patient or control. For comparison, we evaluated whether ipsilateral hippocampus network measures could identify patient vs control datasets. For each structure, a logistic regression model was generated incorporating 3 key connectivity measures. From bootstrapping analysis, we quantified variability in area under the curve (AUC) and accuracy of both models on the basis of subsampling total participant data. When all participant data were used, the ipsilateral NBM model demonstrated an AUC of 0.83 and an overall accuracy of 78% in accurately identifying patients vs controls. The sensitivity and specificity of this model (at maximum sensitivity plus specificity) were 75% and 83%, respectively. The bootstrapped analysis revealed an accuracy of 76 ± 11% (mean ± SD) and AUC of 0.84 ± 0.05. Conversely, with all participant data, the ipsilateral hippocampus model demonstrated an AUC of 0.85 and overall accuracy 76%, with a sensitivity and specificity of 78% and 83%, respectively (at maximum sensitivity plus specificity). The bootstrapping analysis showed an accuracy of 77 ± 11% and AUC of 0.86 ± 0.05. These results suggest that ipsilateral NBM connectivity patterns may identify patients with moderately high accuracy and that NBM connectivity perturbations are specific to patients. Furthermore, performance of ipsilateral NBM model was similar to that of ipsilateral hippocampus.
Discussion
In this work, we found that NBM ipsilateral to the side of seizure onset may be one of the most disturbed brain network nodes in TLE. Using the network-based statistic, we identified a central network of altered connectivity in patients including ipsilateral NBM and limbic structures known to be affected by TLE. Notably, despite having previously shown that other arousal structures are perturbed in TLE,7–9 in this analysis, ipsilateral NBM was the sole subcortical arousal structure included. Ipsilateral NBM also exhibited the largest decrease in clustering coefficient of all regions examined. Together, these findings suggest that NBM may be more strongly affected than other arousal structures in TLE.
It has been proposed that, on the basis of its anatomic connections, NBM is closely related to both the limbic system and brainstem ARAS.11,39 Supporting this, NBM clustered with the limbic community in healthy participants. In patients, NBM was the only limbic structure to no longer group with its home community. Our network model comparisons indicated that connectivity changes of the limbic system together with ipsilateral NBM are central to explaining broad network alterations observed in TLE and that NBM connectivity alterations are not simply reflective of global network changes in this disorder. Finally, we found that network measurements in ipsilateral NBM alone were sufficient to differentiate between patients and controls with comparable accuracy to ipsilateral hippocampus connectivity. Overall, these observations provide evidence that NBM may be among the most profoundly altered network structures in TLE, with connectivity perturbations comparable to limbic regions.
Loss of integration of NBM from the limbic community may be an adaptive response to prevent seizure propagation beyond limbic structures. This builds on the network inhibition hypothesis,6 which postulates that TLE seizures may cause dysfunction of subcortical arousal structures.11,40 Previous studies have suggested that brainstem atrophy and disrupted brainstem arousal connectivity in focal epilepsy may be related to consciousness-impairing seizure frequency, worse verbal neurocognition, and risk of sudden unexpected death in epilepsy.17,41,42 Likewise, we observed that larger decreases of NBM-frontoparietal connectivity were associated with more frequent consciousness-impairing seizures. While studies in rodent models of TLE have examined ictal NBM activity,15 to the best of our knowledge, interictal network properties of NBM in human TLE have not previously been examined. The relationships between these observed network changes and the effects of drugs, including antiepileptic (increase seizure threshold) and anticholinergic medications (decrease seizure threshold), have not been investigated. Future studies in animal models evaluating cholinergic neurotransmission in these networks would be central to parsing out these relationships. In addition, we found that some neurocognitive measures were moderately associated with strength of connectivity between NBM and other subcortical arousal structures. Further study of NBM and downstream networks may help elucidate certain broad yet unexplained deficits in TLE.
For patients with epilepsy who continue to experience frequent disabling seizures despite maximal medical therapy, neuromodulation may provide quality of life improvements, including amelioration of ictal impaired consciousness, treatment of neuropsychological comorbid conditions, or reduced sudden unexpected death in epilepsy risk.43–46 NBM has been proposed as a viable neurostimulation target to prevent consciousness impairment during seizures.45,47 Supporting this hypothesis, studies in anesthetized rats demonstrated that stimulating ARAS structures may increase functional connectivity between NBM and paralimbic structures, potentially restoring the normal functional relationship of that community.48 While neurostimulation of NBM has not been explored in human epilepsy, small trials of NBM neurostimulation for Parkinson disease dementia49 and Alzheimer disease50 indicated safety and tolerability. NBM may ultimately warrant investigation as an innovative neuromodulation target to treat deleterious brain network effects of TLE.
This study has limitations that should be discussed. Our patient cohort is not uniform: not all individuals exhibited hippocampal sclerosis on MRI; duration of epilepsy varied; not all patients had a history of tonic-clonic seizures; and medication dosage could not be controlled. This variability might influence applicability of our results to other patient populations. In addition, during resting-state fMRI acquisition, participants are reminded to stay awake with eyes closed, but we cannot positively ascertain whether participants become drowsy during scans, which may influence arousal network functional connectivity. In future studies, it may be interesting to use quantitative arousal measures such as simultaneous EEG to account for this variable. Similarly, we cannot account for possible influences of interictal discharges on BOLD signal. Simultaneous EEG-fMRI would also allow us to examine how interictal electrophysiology may affect these subcortical arousal structures. In addition, while examining all possible relationships between subcortical arousal structures and neurocognition was beyond the scope of the present study, in subsets of this cohort, we have previously examined relationships between brainstem ARAS and broad areas of neurocognitive testing17 and between intralaminar thalamus and visual attention.9 Future studies powered for examining relationships between connectivity of arousal structures and neurocognition would help discriminate which arousal networks are most associated with specific domains. Furthermore, NBM is a small structure in which fMRI signal may be susceptible to motion and other noise, although our connectivity analyses did incorporate correction for physiologic artifact and movement.
NBM connectivity is markedly perturbed in patients with TLE, and it may be a key network node involved in the broad pathophysiology of this disorder. Through network-based analyses, we found profound disturbances of NBM connectivity patterns in patients with TLE and observed subcortical arousal community properties that may be related to neurocognition and disease severity. This work may have important implications to help understand, treat, and prevent widespread deleterious effects of TLE on cognition, alertness, and cortical function.
Acknowledgment
The authors thank Srijata Chakravorti and Benoit Dawant for assistance generating participant-specific thalamic masks.
Glossary
- ARAS
ascending reticular activating system
- AUC
area under the curve
- BOLD
blood oxygenation level–dependent
- NBM
nucleus basalis of Meynert
- ROI
region of interest
- TLE
temporal lobe epilepsy
Appendix. Authors

Study Funding
This work was supported in part by NIH grants R00 NS097618 (D.J.E.), R01 NS112252 (D.J.E./C.C.), T32 EB021937 (H.F.J.G.), T32 GM007347 (H.F.J.G., G.W.J.), F31 NS106735 (H.F.J.G.), T32 EB001628-17 (S.N.), R01 NS108445 (V.L.M.), R01 NS110130 (V.L.M.), and R01 NS095291 (B.M.D.), as well as the Vanderbilt Institute for Surgery and Engineering.
Disclosure
The authors report no disclosures relevant to the manuscript. Go to Neurology.org/Nhttps://n.neurology.org/lookup/doi/10.1212/WNL.0000000000011523 for full disclosures.
References
- 1.Engel J Jr. What can we do for people with drug-resistant epilepsy? The 2016 Wartenberg Lecture. Neurology 2016;87:2483–2489. [DOI] [PMC free article] [PubMed] [Google Scholar]
- 2.Blumenfeld H, Taylor J. Why do seizures cause loss of consciousness? Neuroscientist 2003;9:301–310. [DOI] [PubMed] [Google Scholar]
- 3.Gargaro AC, Sakamoto AC, Bianchin MM, et al. Atypical neuropsychological profiles and cognitive outcome in mesial temporal lobe epilepsy. Epilepsy Behav 2013;27:461–469. [DOI] [PubMed] [Google Scholar]
- 4.Zhao F, Kang H, You L, Rastogi P, Venkatesh D, Chandra M. Neuropsychological deficits in temporal lobe epilepsy: a comprehensive review. Ann Indian Acad Neurol 2014;17:374–382. [DOI] [PMC free article] [PubMed] [Google Scholar]
- 5.Englot DJ, Morgan VL, Chang C. Impaired vigilance networks in temporal lobe epilepsy: mechanisms and clinical implications. Epilepsia 2020;61:189–202. [DOI] [PMC free article] [PubMed] [Google Scholar]
- 6.Englot DJ, Blumenfeld H. Consciousness and epilepsy: why are complex-partial seizures complex? Prog Brain Res 2009;177:147–170. [DOI] [PMC free article] [PubMed] [Google Scholar]
- 7.González HFJ, Goodale SE, Jacobs ML, et al. Brainstem functional connectivity disturbances in epilepsy may recover after successful surgery. Neurosurgery 2020;86:417–428. [DOI] [PMC free article] [PubMed] [Google Scholar]
- 8.Englot DJ, González HFJ, Reynolds BB, et al. Relating structural and functional brainstem connectivity to disease measures in epilepsy. Neurology 2018;91:e67–e77. [DOI] [PMC free article] [PubMed] [Google Scholar]
- 9.González HFJ, Chakravorti S, Goodale SE, et al. Thalamic arousal network disturbances in temporal lobe epilepsy and improvement after surgery. J Neurol Neurosurg Psychiatry 2019;90:1109–1116. [DOI] [PMC free article] [PubMed] [Google Scholar]
- 10.Mesulam MM, Mufson EJ, Levey AI, Wainer BH. Cholinergic innervation of cortex by the basal forebrain: cytochemistry and cortical connections of the septal area, diagonal band nuclei, nucleus basalis (substantia innominata), and hypothalamus in the rhesus monkey. J Comp Neurol 1983;214:170–197. [DOI] [PubMed] [Google Scholar]
- 11.Mesulam MM. The cholinergic innervation of the human cerebral cortex. Prog Brain Res 2004;145:67–78. [DOI] [PubMed] [Google Scholar]
- 12.Grothe MJ, Heinsen H, Amaro E Jr, Grinberg LT, Teipel SJ. Cognitive correlates of basal forebrain atrophy and associated cortical hypometabolism in mild cognitive impairment. Cereb Cortex 2016;26:2411–2426. [DOI] [PMC free article] [PubMed] [Google Scholar]
- 13.Tashakori-Sabzevar F, Ward RD. Basal forebrain mediates motivational recruitment of attention by reward-associated cues. Front Neurosci 2018;12:786. [DOI] [PMC free article] [PubMed] [Google Scholar]
- 14.Turchi J, Chang C, Ye FQ, et al. The basal forebrain regulates global resting-state fMRI fluctuations. Neuron 2018;97:940–952 e944. [DOI] [PMC free article] [PubMed] [Google Scholar]
- 15.Motelow JE, Li W, Zhan Q, et al. Decreased subcortical cholinergic arousal in focal seizures. Neuron 2015;85:561–572. [DOI] [PMC free article] [PubMed] [Google Scholar]
- 16.Templates and atlases included with FSL [online]. Available at: fsl.fmrib.ox.ac.uk/fsl/fslwiki/Atlases. Accessed December 2, 2014. [Google Scholar]
- 17.Englot DJ, D'Haese PF, Konrad PE, et al. Functional connectivity disturbances of the ascending reticular activating system in temporal lobe epilepsy. J Neurol Neurosurg Psychiatry 2017;88:925–932. [DOI] [PMC free article] [PubMed] [Google Scholar]
- 18.Liu Y, D'Haese PF, Newton AT, Dawant BM. Generation of human thalamus atlases from 7T data and application to intrathalamic nuclei segmentation in clinical 3T T1-weighted images. Magn Reson Imaging 2020;65:114–128. [DOI] [PubMed] [Google Scholar]
- 19.Chakravorti S, Morgan VL, Trujillo Diaz P, Wirz Gonzalez R, Dawant BM. A structural connectivity approach to validate a model-based technique for the segmentation of the pulvinar complex. Proc SPIE Int Soc Opt Eng 2018;10578:105780T. [DOI] [PMC free article] [PubMed] [Google Scholar]
- 20.Edlow BL, Takahashi E, Wu O, et al. Neuroanatomic connectivity of the human ascending arousal system critical to consciousness and its disorders. J Neuropathol Exp Neurol 2012;71:531–546. [DOI] [PMC free article] [PubMed] [Google Scholar]
- 21.Zaborszky L, Hoemke L, Mohlberg H, Schleicher A, Amunts K, Zilles K. Stereotaxic probabilistic maps of the magnocellular cell groups in human basal forebrain. Neuroimage 2008;42:1127–1141. [DOI] [PMC free article] [PubMed] [Google Scholar]
- 22.Eickhoff SB, Stephan KE, Mohlberg H, et al. A new SPM toolbox for combining probabilistic cytoarchitectonic maps and functional imaging data. Neuroimage 2005;25:1325–1335. [DOI] [PubMed] [Google Scholar]
- 23.Whitfield-Gabrieli S, Nieto-Castanon A. Conn: a functional connectivity toolbox for correlated and anticorrelated brain networks. Brain Connect 2012;2:125–141. [DOI] [PubMed] [Google Scholar]
- 24.SPM12 [online]. Available at: fil.ion.ucl.ac.uk/spm/software/spm12/. Accessed 2017. [Google Scholar]
- 25.Glover GH, Li TQ, Ress D. Image-based method for retrospective correction of physiological motion effects in fMRI: RETROICOR. Magn Reson Med 2000;44:162–167. [DOI] [PubMed] [Google Scholar]
- 26.Rubinov M, Sporns O. Complex network measures of brain connectivity: uses and interpretations. Neuroimage 2010;52:1059–1069. [DOI] [PubMed] [Google Scholar]
- 27.Newman ME, Girvan M. Finding and evaluating community structure in networks. Phys Rev E Stat Nonlin Soft Matter Phys 2004;69:026113. [DOI] [PubMed] [Google Scholar]
- 28.Blondel VD, Guillaume JL, Lambiotte R, Lefebvre E. Fast unfolding of communities in large networks. J Stat Mech Theory E 2008;2008:P10008. [Google Scholar]
- 29.Lancichinetti A, Fortunato S. Consensus clustering in complex networks. Sci Rep 2012;2:336. [DOI] [PMC free article] [PubMed] [Google Scholar]
- 30.Rubinov M, Sporns O. Weight-conserving characterization of complex functional brain networks. Neuroimage 2011;56:2068–2079. [DOI] [PubMed] [Google Scholar]
- 31.Zalesky A, Fornito A, Bullmore ET. Network-based statistic: identifying differences in brain networks. Neuroimage 2010;53:1197–1207. [DOI] [PubMed] [Google Scholar]
- 32.Xia M, Wang J, He Y. BrainNet viewer: a network visualization tool for human brain connectomics. PLoS One 2013;8:e68910. [DOI] [PMC free article] [PubMed] [Google Scholar]
- 33.Rubinov M. Constraints and spandrels of interareal connectomes. Nat Commun 2016;7:13812. [DOI] [PMC free article] [PubMed] [Google Scholar]
- 34.Schreiber T. Constrained randomization of time series data. Phys Rev Lett 1998;80:2105–2108. [Google Scholar]
- 35.Holmes M, Folley BS, Sonmezturk HH, et al. Resting state functional connectivity of the hippocampus associated with neurocognitive function in left temporal lobe epilepsy. Hum Brain Mapp 2014;35:735–744. [DOI] [PMC free article] [PubMed] [Google Scholar]
- 36.Morgan VL, Sonmezturk HH, Gore JC, Abou-Khalil B. Lateralization of temporal lobe epilepsy using resting functional magnetic resonance imaging connectivity of hippocampal networks. Epilepsia 2012;53:1628–1635. [DOI] [PMC free article] [PubMed] [Google Scholar]
- 37.Pereira FR, Alessio A, Sercheli MS, et al. Asymmetrical hippocampal connectivity in mesial temporal lobe epilepsy: evidence from resting state fMRI. BMC Neurosci 2010;11:66. [DOI] [PMC free article] [PubMed] [Google Scholar]
- 38.Glantz S. Primer of Biostatistics. 6th ed. New York: McGraw-Hill; 2005. [Google Scholar]
- 39.Mesulam MM. Principles of Behavioral and Cognitive Neurology. New York: Oxford University Press, Inc; 2000. [Google Scholar]
- 40.Picciotto MR, Higley MJ, Mineur YS. Acetylcholine as a neuromodulator: cholinergic signaling shapes nervous system function and behavior. Neuron 2012;76:116–129. [DOI] [PMC free article] [PubMed] [Google Scholar]
- 41.Mueller SG, Bateman LM, Laxer KD. Evidence for brainstem network disruption in temporal lobe epilepsy and sudden unexplained death in epilepsy. Neuroimage Clin 2014;5:208–216. [DOI] [PMC free article] [PubMed] [Google Scholar]
- 42.Mueller SG, Bateman LM, Nei M, Goldman AM, Laxer KD. Brainstem atrophy in focal epilepsy destabilizes brainstem-brain interactions: preliminary findings. Neuroimage Clin 2019;23:101888. [DOI] [PMC free article] [PubMed] [Google Scholar]
- 43.Meador KJ, Kapur R, Loring DW, Kanner AM, Morrell MJ; RNS® System Pivotal Trial Investigators. Quality of life and mood in patients with medically intractable epilepsy treated with targeted responsive neurostimulation. Epilepsy Behav 2015;45:242–247. [DOI] [PubMed] [Google Scholar]
- 44.Loring DW, Kapur R, Meador KJ, Morrell MJ. Differential neuropsychological outcomes following targeted responsive neurostimulation for partial-onset epilepsy. Epilepsia 2015;56:1836–1844. [DOI] [PubMed] [Google Scholar]
- 45.Gummadavelli A, Kundishora AJ, Willie JT, et al. Neurostimulation to improve level of consciousness in patients with epilepsy. Neurosurg Focus 2015;38:E10. [DOI] [PMC free article] [PubMed] [Google Scholar]
- 46.Devinsky O, Friedman D, Duckrow RB, et al. Sudden unexpected death in epilepsy in patients treated with brain-responsive neurostimulation. Epilepsia 2018;59:555–561. [DOI] [PubMed] [Google Scholar]
- 47.Kundu B, Brock AA, Englot DJ, Butson CR, Rolston JD. Deep brain stimulation for the treatment of disorders of consciousness and cognition in traumatic brain injury patients: a review. Neurosurg Focus 2018;45:E14. [DOI] [PMC free article] [PubMed] [Google Scholar]
- 48.Pillay S, Liu X, Baracskay P, Hudetz AG. Brainstem stimulation increases functional connectivity of basal forebrain-paralimbic network in isoflurane-anesthetized rats. Brain Connect 2014;4:523–534. [DOI] [PMC free article] [PubMed] [Google Scholar]
- 49.Gratwicke J, Zrinzo L, Kahan J, et al. Bilateral deep brain stimulation of the nucleus basalis of Meynert for Parkinson disease dementia: a randomized clinical trial. JAMA Neurol 2018;75:169–178. [DOI] [PMC free article] [PubMed] [Google Scholar]
- 50.Kuhn J, Hardenacke K, Lenartz D, et al. Deep brain stimulation of the nucleus basalis of Meynert in Alzheimer's dementia. Mol Psychiatry 2015;20:353–360. [DOI] [PubMed] [Google Scholar]
Associated Data
This section collects any data citations, data availability statements, or supplementary materials included in this article.
Data Availability Statement
Due to restrictions from participant informed consent, data will not be made freely available in a public repository. Anonymized data can be made available on request if approved by our Institutional Review Board.


