

Abstract
Objective
To understand the time course of β-amyloid (Aβ) deposition in the brain, which is crucial for planning therapeutic trials of Aβ-lowering therapies in Alzheimer disease (AD).
Methods
Two samples of participants from the Alzheimer's Disease Neuroimaging Initiative were studied with [18F]Florbetapir (FBP) Aβ PET and followed for up to 9 years. Sample A included 475 cognitively normal (CN) older people and those with mild cognitive impairment (MCI) and AD and sample B included 220 CN Aβ− individuals. We examined the trajectory of FBP over time in sample A and the incidence rate of conversion from negative to positive Aβ PET scans in sample B.
Results
The relationship between time and brain Aβ was sigmoidal, taking 6.4 years to transition from amyloid negative to positive and another 13.9 years to the onset of MCI. Aβ deposition rates began to slow only 3.8 years after reaching the positivity threshold. The incidence rate for scan positivity was 38/1,000 person-years, and factors associated with conversion were age, baseline FBP, and being a female APOE ε4 carrier. Among CN Aβ− individuals, FBP slopes were associated with rates of memory decline and brain tau measured with [18F]Flortaucipir PET 5 years after baseline.
Conclusions
Lowering brain Aβ must be accomplished early in the evolution of AD. Transitions of PET scans from Aβ− to Aβ+ should be predictable, and it is reasonable to expect that lowering rates of Aβ even in early stages could produce clinically significant benefits.
The clinical manifestations of Alzheimer disease (AD) are preceded by an incubation period of decades, when the aggregation of β-amyloid (Aβ) and tau proteins into pathologic forms likely plays a major role.1,2 The amyloid hypothesis, a widely held model of disease pathogenesis, postulates that Aβ is the earliest initiating event in this pathologic chain.3 However, because many therapeutic trials have lowered brain Aβ without producing clinical improvement in patients with AD, this model has been questioned.4,5 In turn, new approaches have suggested the use of anti-Aβ treatments before the development of symptoms and even before the detection of brain Aβ deposition in a “primary prevention” approach.6
Such early initiation of treatment requires knowledge of the time course of brain Aβ deposition. Most existing longitudinal amyloid PET studies have been limited by sample size and follow-up duration. The Alzheimer's Disease Neuroimaging Initiative (ADNI) began collecting serial amyloid [18F]florbetapir (FBP) PET scans in 2010 and has continued for some participants to the present. In this study, we used up to 6 serial FBP scans and a maximum follow-up time of 9 years to estimate longitudinal Aβ trajectories in impaired and unimpaired individuals who are likely to be on the AD pathway in order to estimate the temporal dynamics of amyloid accumulation over the full spectrum of AD. We then focused on amyloid-negative cognitively unimpaired participants to examine the rate of conversion to amyloid positivity and the factors associated with conversion.
Methods
Standard Protocol Approvals, Registrations, and Patient Consents
The ADNI protocol was approved by local institutional review boards and written informed consent was obtained from all participants.
Study Design and Participants
Individuals in this report include 2 overlapping samples with at least 2 FBP scans in each participant, based on data available as of April 2020. This study had multiple goals. The first was the description of amyloid accumulation through the full time course of AD, beginning with amyloid negativity and extending to mild cognitive impairment (MCI) and AD. For this purpose, we required a sample of individuals who were on the Alzheimer continuum; i.e., patients with Aβ+ MCI and AD.7 In order to include cognitively normal (CN) people who were amyloid-negative but might be on the AD continuum, we selected those CN individuals with increasing FBP slopes (>0) over time because many Aβ− individuals may never accumulate amyloid. This comprised sample A, and included a total of 475 participants, of whom 336 were Aβ+ at baseline (88 CN, 101 early MCI, 101 late MCI, 46 AD), and 139 CN individuals who were Aβ− at baseline with an increasing FBP slope.
Additional goals of the study were to define the rate of conversion from an Aβ− PET scan to an Aβ+ PET scan, to compare the baseline characteristics of converters vs nonconverters (including cognition, hippocampal volume, and glucose metabolism), to define baseline factors predicting conversion, and to examine how rates of Aβ accumulation are related to cognitive change and tau deposition. These goals required a separate sample of individuals who were all CN and Aβ− at baseline. These individuals, who comprised sample B, were 220 CN individuals with baseline Aβ− scans (regardless of slope) followed for up to 6 scans total (minimum 1.9, maximum follow-up time 9.1 years). The group of CN participants included 23% of participants who were recruited with subjective memory complaints (SMCs).8 Sample A and sample B included 139 CN individuals in common.
ADNI participant characteristics have been previously described; individuals diagnosed with AD and MCI and who met standard diagnostic criteria and all CN participants had CDR scores of 0.9 All were between ages 55 and 90 years at baseline, had completed at least 6 years of education, were fluent in Spanish or English, and were free of any other significant neurologic diseases.
Florbetapir-PET Imaging and Analysis
FBP images consisted of 4 × 5-minute frames acquired at 50–70 minutes postinjection that were realigned, averaged, resliced to a common voxel size (1.5 mm3), and smoothed to a common resolution of 8 mm3 full width at half maximum (FWHM). T1 MRI (magnetization-prepared rapid gradient echo) acquired concurrently with the baseline florbetapir images were used as a structural template to define cortical and reference regions in native space for each individual using Freesurfer (v5.3.0), as described previously.10
Baseline and follow-up florbetapir scans, acquired at approximately 2-year intervals, were coregistered to the baseline structural MRI scans used to calculate weighted cortical retention means from frontal, cingulate, parietal, and temporal regions that were averaged to create a cortical summary region. FBP means at each time point from this cortical summary region were divided by corresponding means of a composite reference region comprised of brainstem, whole cerebellum, and eroded WM that is optimized for longitudinal analyses.10 Annualized rates of change (change in cortical summary standardized uptake value ratio [SUVR] units per year) were calculated for each individual using linear regression. In order to facilitate comparison of our results to other reference regions and PET tracers, SUVRs were converted to Centiloids,11 with a modification to account for the composite reference used in this study. Specifically, we carried out an SUVR to Centiloids linear transformation to convert whole cerebellum-based SUVRs to whole cerebellum-based Centiloids as documented on the ADNI website (Centiloids = 196.9 × SUVR_wholecerebrefFBP − 196.03) using all ADNI participants with a baseline FBP scan (489 CN, 585 MCI, and 220 AD). To adapt this approach for use with the composite reference region, we used the same participants and scans to calculate the best fit linear regression equation to convert composite reference-based SUVRs to composite reference-based Centiloids (Centiloids = 287 × SUVR_compositerefFBP − 210).
Determination of Amyloid Positivity
An Aβ positivity threshold of 0.82 (25.3 Centiloids/composite reference region) corresponds to the ADNI standard whole cerebellum-based florbetapir positivity threshold of 1.11 and is based on the mean and SD of young controls processed with the ADNI pipeline.12
Structural Volumes and Glucose Metabolism
Hippocampal volume was defined on T1-weighted images acquired with the baseline florbetapir scan using Freesurfer v5.3 and adjusted using the association between hippocampal volume and total intracranial volume in healthy controls13 to account for head size. Glucose metabolism measurement used preprocessed FDG-PET images concurrent with the baseline florbetapir scans spatially normalized to the standard 15O-H2O PET template using SPM5. Mean FDG uptake quantitation for each individual used study-independent and previously validated meta–regions of interest (ROIs) averaged together and divided by the mean of a pons and cerebellar vermis reference region.14
Tau PET Scans
[18F]Flortaucipir (FTP)–PET images consisted of 6 × 5–minute frames acquired at 75–105 minutes postinjection, which were realigned, averaged, resliced to a common voxel size (1.5 mm3), and smoothed to a common resolution of 8 mm3 FWHM (adni-info.org). FTP scans were coregistered to a contemporaneous MRI scan, and FTP SUVRs in the following Freesurfer-defined regions were calculated relative to inferior cerebellar gray matter uptake15: entorhinal cortex (Braak 1), temporal composite (entorhinal, amygdala, parahippocampal, fusiform, inferior temporal, and middle temporal),16 and extratemporal neocortex (Braak 56).
Cognitive Assessments
We used previously validated longitudinal memory and executive function composite scores from the University of Washington that were derived from the ADNI neuropsychological battery using a nearly nonoverlapping sample of 800 ADNI normal controls, participants with MCI, and participants with dementia.17,18 Composite scores had a mean of 0 and SD of 1 at baseline for the individuals in this sample. These composite scores were developed to address the varying difficulty of different word lists within the Auditory Verbal Learning Test and the Alzheimer’s Disease Assessment Scale–cognitive subscale, which may affect the accuracy of measuring subtle differences in cognition cross-sectionally (between participants) and longitudinally (within participant). The mean follow-up time for longitudinal cognitive measurements was 4.9 ± 1.6 years. In addition, all participants underwent clinical follow-up at least annually, and status change (to MCI or dementia) was determined according to standard ADNI methods.9
Cardiovascular and Other Risk Factor Assessment
At the baseline visit, all participants underwent a medical interview. We searched recorded text fields from this interview for the presence of standard cardiovascular risk factors such as hypertension, diabetes, hyperlipidemia, and any smoking history. Participants were administered the Geriatric Depression Scale19 and antidepressant use was recorded. This information was examined as dichotomous categories (except for depression) in relationship to subsequent conversion from amyloid negative to positive.
Statistical Methods
We fit linear and quadratic equations to FBP slopes as a function of baseline FBP values for sample A participants and used the best-fitting equation to model approximate time between phases of Aβ accumulation. Starting from the average SUVR in the Aβ− CN subjects as time = 0 we used this equation to estimate the annual SUVR increase and plotted time vs SUVR to model this relationship. Subsequent analyses examined only baseline Aβ− CN participants (sample B). An individual was considered an amyloid “converter” if he or she had a baseline negative scan, crossed the threshold, and remained positive for subsequent FBP scans. Group differences between converters and nonconverters were examined using independent-samples t tests (continuous variables) and χ2 tests (categorical variables) at α = 0.05.
We examined regionwise baseline FBP comparisons between subsequent converters and nonconverters in 68 right and left subregions making up the cortical summary region used to determine Aβ positivity (see above). These comparisons used linear regression models to identify converter/nonconverter group differences (effect of interest) with age, sex, APOE ε4 status, total FBP follow-up time, and number of scans as additional covariates (α = 0.05, Bonferroni-Holm correction for multiple comparisons).
We examined continuous and dichotomous predictors of conversion to FBP-positive status using a Cox proportional hazards model, with age, presence of SMC, sex, APOE ε4 status, baseline FBP, and baseline memory scores as predictors. The baseline FBP variable was modeled using continuous SUVRs and, separately, Centiloids categorized in 6 intervals of 5 Centiloids (<0, 0–5, 5–10, 10–15, 15–20, 20–25).
Linear regression models were carried out predicting subsequent tau with the following independent variables: annualized FBP slopes, baseline FBP, age, sex, education, and APOE ε4. Separate models were examined with entorhinal (Braak 1), temporal composite, and extratemporal neocortical tau (Braak 56) regions as outcomes.
Linear mixed effects models were carried out predicting, separately, time-varying longitudinal memory and executive function composite scores. Independent variables included time, age, sex, education, APOE ε4, presence of SMC, baseline FBP, FBP slope, age × time, sex × time, APOE ε4 × time, presence of SMC × time, baseline FBP × time, and FBP slope × time, with a random effect of subject and an autoregressive covariance structure for repeated measurements.
Data Availability
All data used in this article are available to the public at the ADNI data repository at the Laboratory of Neuroimaging (adni.loni.usc.edu). Derived data are available from the authors upon request.
Results
Characteristics of sample A participants used to estimate the amyloid trajectory are shown in table 1.
Table 1.
Characteristics of Cognitively Normal (CN) and Cognitively Impaired Participants Used to Estimate Amyloid Trajectories Over Time (Sample A)

Temporal Dynamics of Aβ Across the Spectrum of AD
We examined FBP slopes as a function of baseline FBP SUVRs for individuals in sample A. The quadratic function accounted for more variability (R2 = 0.110) than a linear model (R2 = 0.028) (figure 1A), so we used the quadratic equation (y = −0.19x2 +0.33x − 0.13) to estimate time between phases of Aβ accumulation (figure 1B): 6.4 years from the mean of Aβ− cognitively normal participants (SUVR 0.745/SD 0.036, 4 Centiloids) to reach the FBP threshold (0.82, 25 Centiloids), 13.9 additional years from the threshold to the mean of Aβ+ MCI participants (0.993; 75 Centiloids), and an additional 7.7 years to reach the mean of Aβ+ AD participants (1.058; 94 Centiloids). The peak of this quadratic function and the inflection point of the sigmoidal function occurred at a baseline value of 0.87 SUVR (39 Centiloids) at an annual increase of 0.013 SUVR/year, indicating that the rate of amyloid accumulation begins to slow only 3.8 years after conversion to amyloid positivity and well before the typical MCI level. Among the 248 Aβ+ impaired participants included in this analysis, 222 (90%) were past the Aβ accumulation peak; 70/227 (31%) of the Aβ+ or Aβ− but increasing CN participants were past the peak. Whereas individuals on the descending limb of this function showed slowing rates of Aβ accumulation, some even showed evidence of negative slopes, indicating Aβ removal.
Figure 1. Time Course of β-amyloid (Aβ) Accumulation for Individuals on the Alzheimer disease (AD) Pathway.

(A) Cortical [18F]florbetapir (FBP) annual change (composite reference region) is shown as a function of baseline FBP for all participants who are likely to be on the AD pathway. (B) The best-fit quadratic equation was used to estimate Aβ-related events on the AD pathway. Each point reflects 1 year of time with important temporal landmarks in red. CL = Centiloids; CN, N = cognitively normal; EMCI = early mild cognitive impairment; LMCI = late mild cognitive impairment; MCI = mild cognitive impairment; SMC = subjective memory complaints; SUVR = standardized uptake value ratio.
We evaluated several variables that can affect these estimates. Assuming that the starting SUVR for CN/Aβ− participants was either 1 SD lower or 1 SD higher than the mean increased or decreased the time to the threshold (10.2 vs 3.1 years) but had no effect on the relative timing of events. Restricting the sample to CN individuals who ultimately became Aβ+ produced a time to threshold of 5.2 years and a time to peak of 8.6 years, whereas limiting the sample to those with an FBP slope greater than a previously defined test–retest reliability value (>1%)10 produced a time to threshold of 3.4 years and time to peak of 5.6 years.
We examined the 292 individuals with baseline FBP higher than the peak (>0.87) in order to determine whether the decreasing and negative FBP slopes in some of those individuals reflect true decreases in the rate of amyloid accumulation or whether they are an artifact of atrophy or longitudinal increases in the composite reference region. FBP slope was not correlated with change in frontal, cingulate, temporal, or parietal volumes (R2 range 0.0004–0.02). In the same individuals, FBP slope calculated using the composite reference region was highly correlated with FBP slope calculated using a nonoverlapping cerebellar GM reference region (R2 = 0.67), indicating that longitudinal WM-related increases in the composite reference region are unlikely to explain the decreases we observed in the cortical summary ROI.
Conversions to Aβ Positive Status
The 220 CN participants in sample B who were Aβ− at baseline had serial florbetapir scans for a minimum of 1.9 and maximum of 9.1 years (mean 5.3 ± 2.2 years). Forty-two participants (19%) converted from Aβ− to Aβ+ and remained Aβ+ at their last PET visit (figure 2). Conversion from Aβ− to Aβ+ occurred at a mean of 4.1 ± 1.8 years following the baseline scan. Three additional individuals converted from Aβ− to Aβ+ but reverted to Aβ− by their last PET visit and were not included as converters in these analyses. The crude incidence rate of conversion to Aβ+ status was 38 per 1,000 person-years of follow-up (42 converters over 1,093 total person-years). Figure 2 shows the trajectories of all participants who remained Aβ− compared to those who converted. Converters included some individuals whose baseline scans showed SUVRs close to the threshold, but also many individuals with starting values that were well below the threshold. The trajectories of converters were for the most part unambiguously positive, showing little evidence of fluctuating values, a pattern that was more common in those who remained Aβ−.
Figure 2. Longitudinal β-amyloid (Aβ) Trajectories for Cognitively Normal, Baseline Aβ−Negative Individuals.

Cortical [18F]florbetapir (FBP) trajectories are shown for all Aβ− participants (sample B) who either converted to Aβ+ (black) or remained Aβ− (cyan). SUVR = standardized uptake value ratio.
Table 2 shows the characteristics of sample B individuals who converted amyloid status or remained stable. Compared with the nonconverter group, the converter group included a significantly larger proportion of women and APOE ε4+ individuals, but did not differ on age, education, APOE ε2 status, total PET follow-up time, baseline cognitive function measured by the memory or executive function composites, conversions to a clinical diagnosis of MCI or dementia, or cardiovascular and health risk factors. Converters showed elevated baseline Aβ compared to nonconverters with a mean Centiloid value of 13.3 compared to 1.5. The annual rate of change in the nonconverters averaged 0 (SD 0.005) SUVR/year and 0.14 (SD 0.004) in the converters. Among the 88/178 nonconverters who had positive Aβ slopes (but remained Aβ−), the annual rate of change was 0.006 (SD 0.004), which was 40% the magnitude of the increase among converters. There were no differences between groups on baseline FDG-PET or hippocampal volume.
Table 2.
Characteristics of Cognitively Normal, Baseline β-Amyloid (Aβ)− Participants (Sample B)

Regional FBP Baseline Elevations in Subsequent Converters
We identified brain regions that were already elevated in baseline Aβ− participants who subsequently converted to Aβ+ compared with nonconverters. Participants who later converted were higher at baseline than nonconverters in 22 right and left temporal, medial and lateral parietal, cingulate, and medial and lateral orbitofrontal regions (figure 3).
Figure 3. Baseline Regional β-amyloid (Aβ) Elevations.
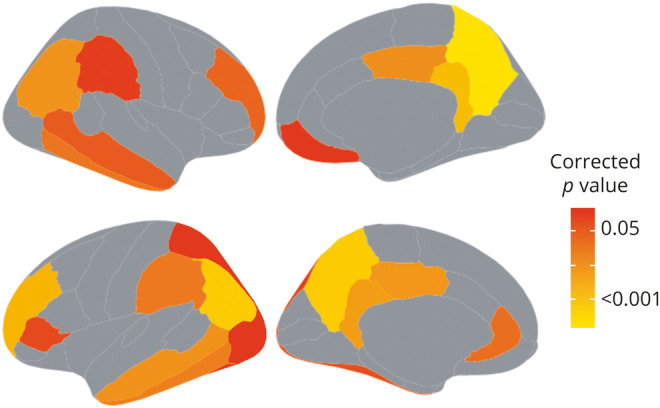
Regions in which [18F]florbetapir (FBP) was higher at baseline in cognitively normal, Aβ− participants who subsequently converted to Aβ+ compared to participants who did not convert (all p < 0.05, Bonferroni-Holm correction).
Predictors of Conversion
Initial Cox proportional hazard models did not show effects of sex and APOE ε4; however, because these variables both differed between converters and nonconverters at baseline, we added an interaction term to the model. Results indicated that baseline florbetapir (measured as either continuous or as 6 ordinal Centiloid intervals) and older age were predictors of conversion (table 3). Compared with the lowest Centiloid group (<0 Centiloids; n = 62), all groups with baseline Aβ− values at or above 5 Centiloids were at significantly greater risk of conversion during follow-up (figure 4A). Each decade increase in age above the mean was associated with an 11-fold greater risk of conversion (figure 4B). The sex × APOE ε4 interaction was significant (p = 0.031), and follow-up pairwise log rank tests indicated that APOE ε4− men and women did not differ (χ2 = 1.7, p = 0.19) but APOE ε4+ women were 3.22 times more likely to convert than APOE ε4+ males (χ2 = 4.2, p = 0.039; figure 4C).
Table 3.
Results of Cox Proportional Hazard Model

Figure 4. Baseline Variables That Increase the Risk of Conversion to β-Amyloid (Aβ)+.

Survival functions show (A) elevated risk of conversion with elevated [18F]florbetapir (FBP) shown as 5-Centiloid intervals (>0) relative to the reference group (Centiloids < 0). (B) Older age (note that age was a continuous variable in the proportional hazards model but is shown as categorical for illustration purposes) and (C) increased risk of conversion among female versus male APOE ε4 carriers. HR = hazard ratio.
Because baseline FBP was the major predictor of conversion, we examined the factors that were associated with elevated FBP within the negative range. In a regression model with the same predictors used in the proportional hazards model (except sex × APOE ε4, which was not significant and was removed from the model), female sex (β = 0.02, SE = 0.004, p = <0.001), age (β = −0.001, SE < 0.001, p = 0.011), APOE ε4 positivity (β = 0.011, SE = 0.006, p = 0.047), and marginally, presence of SMC (β = 0.01, SE = 0.005, p = 0.066) were associated with elevated FBP.
FBP Relationships With Subsequent Tau and Longitudinal Cognitive Measurements
Sample B CN participants had a minimum of 2 and a maximum of 9 years follow-up memory and executive function measurements over 4.9 ± 1.6 years. We carried out mixed effects models with baseline FBP, FBP slope, age, education, APOE ε4, sex, and presence/absence of SMC as predictors of longitudinal memory. Only age (β = −0.004, SE = 0.001; p < 0.001) and FBP slope (β = 1.50, SE = 0.749; p = 0.046) and marginally APOE ε4 (β = 0.024, SE = 0.01; p = 0.097) predicted longitudinal decreases in memory composite scores. In a similar model examining longitudinal executive function outcomes, only age (β = −0.006, SE = 0.002; p = 0.005) (and not APOE ε4, or baseline or longitudinal Aβ) predicted executive function decreases. To further investigate whether the subset of participants who converted to Aβ+ drove these effects, we re-examined these analyses without the converters with no substantive changes to the findings.
Fifty-five percent of sample B participants (93/178 nonconverters and 28/42 converters) had FTP PET scans an average of 5.3 ± 1.4 years after their baseline FBP PET scan. Among participants who converted to Aβ+, conversion occurred 0.6 ± 1.7 years before the FTP scan. In a regression model with baseline FBP, FBP slope, age, APOE ε4, sex, and presence/absence of SMC predicting entorhinal tau, only FBP slope was a significant predictor of entorhinal tau (β 3.23, SD 1.3, p = 0.018; overall model R2 = 0.097). None of the variables was a significant predictor of the temporal composite or extratemporal neocortical tau (Braak 56) (all p > 0.05).
Discussion
The long incubation period of AD, combined with the availability of brain biomarkers that can track protein aggregation, neurodegeneration, and cognition, provides a rare opportunity to track the evolution of disease. Whereas such studies have been possible for a while, small sample sizes and short follow-up durations have been limiting. In this report, we evaluated 1,659 longitudinal FBP scans in 782 participants and found evidence for a slowing of the rate of amyloid accumulation that occurs about 4 years after conversion from amyloid negative to positive and 10 years before the average diagnosis of MCI. The time-varying accumulation of Aβ conforms to hypothesized sigmoidal trajectories20 as well as previous reports21–24 indicating periods of about 20 years to progress from the amyloid positivity threshold to an Aβ level typical of AD. Our results differ in showing very early deceleration of Aβ deposition, which is a crucial observation in contemplating anti-amyloid therapies. Expecting clinical benefit through Aβ removal when patients are diagnosed with MCI or clinical AD—10 to 18 years after the rate of accumulation has already begun to slow—may be unrealistic. On the other hand, we were able to detect memory change associated with FBP increases in CN participants in the amyloid negative range, offering the hope that an effective Aβ-slowing intervention at an early stage could produce measurable cognitive benefit.
These findings may also explain the frequent observation in cross-sectional data that brain Aβ deposition is bimodal, with few individuals near the actual threshold.25 Whereas this reflects in part the likelihood that some individuals are not on a pathway to AD, it may also be a consequence of rapid Aβ accumulation at the time of transition from negative to positive. This is also consistent with animal data showing that Aβ aggregation follows a sigmoidal shape over time, including negative growth rates.26 The detection of negative FBP slopes in individuals with higher baseline FBP values suggests the possibility that at late stages, the balance between Aβ deposition and clearance becomes altered in humans, possibly related to diminished neural activity releasing Aβ,27 or to increased immune clearance.
In those individuals who were amyloid-negative at baseline, the rate of amyloid deposition as measured with FBP slope was related to subsequent cognitive decline and tau deposition. This cognitive decline was specific to memory. Previous reports, using both different subgroups of ADNI participants and other cohorts, have provided evidence that higher or rising brain Aβ even in the negative range is associated with harmful outcomes in terms of both brain tau and cognition.24,28–30 Crucially, the combination of this observation with the finding that brain Aβ accumulation begins to slow before the onset of dementia is strong evidence that the detrimental effects of Aβ occur very early in the course of the disease. However, a very small proportion of participants developed MCI or dementia during the period of observation, so the clinical implications of these changes within the follow-up time of the study are not clear.
There are relatively few published estimates of incidence rates of amyloid PET positivity and they vary considerably, ranging from 3%/year31 to 12%/year.32,33 These rates are age-dependent, but published data and our data are roughly comparable in age. Our estimate of 38/1,000 person-years, or about 4%/year, is thus on the lower end of reports. Although our sample size for estimating incidence rates (n = 220) was smaller than our sample estimating rates of Aβ deposition over the entire spectrum of disease progression, individuals were followed on average for over 5 years; previous reports were in the range of 2.5 years. Longer observation may be particularly important in detecting conversions in those with starting FBP values that are further from the threshold; one might expect this to increase conversion rates. Thus, the low rates of amyloid conversion are surprising in our data.
The factors associated with conversion of PET scans from amyloid-negative to positive were not surprising. At baseline, subsequent converters were more likely to be female, APOE ε4 carriers, and have higher baseline FBP values. In contrast to a recent report using a different ADNI sample to examine amyloid conversion,34 we did not find that cognition was lower at baseline among subsequent converters, possibly because our sample was limited to CN controls. Measurements of neurodegeneration, depression, and cardiovascular risk factors were also no different between converters and nonconverters at baseline, consistent with the hypothesis that these processes are either independent of, or sequential to, elevated brain Aβ.
Accounting for time to conversion in the proportional hazard model shows that baseline FBP values, even if slightly elevated—above 5 Centiloids—greatly increased the risk of conversion. The sex × APOE genotype interaction parallels results from large meta-analytic studies indicating stronger effects of the ε4 allele for AD risk in women.35,36 Increasing rate of conversion is also congruent with the prevailing view that APOE ε4 accelerates the onset of AD to earlier ages.
Similar factors were related to higher baseline FBP, with the addition that those with SMC showed higher levels. Regional FBP PET values at baseline revealed a number of brain regions that were elevated in those who subsequently converted, suggesting regions that might be useful early. However, there were many such regions found in medial and lateral frontal and parietal lobes as well as inferior temporal cortex, raising the question as to which might be the “best” predictor of subsequent amyloid change. Many previous studies have selected varying combinations of these regions as best predictors of future Aβ accumulation using ADNI data,37–40 suggesting that there may be no single region that is invariably the best predictor given variability in samples, follow-up, and PET methods such as ligands and SUVR quantification.
The strengths of this study largely relate to the sample size, which was large for estimation of rates of change in FBP and moderate for estimation of conversion, and the follow-up time, which averaged 5 years and extended up to 9 years. We further examined possible methodologic factors that could underlie the deceleration and negative slopes of Aβ accumulation and found no evidence that either longitudinal brain atrophy or changes in the PET reference region were driving these effects. Other strengths include the measurement of multiple biomarkers in the sample and the finding that multiple statistical approaches converged on similar indicators of amyloid progression. The major limitation of the study is the composition of the ADNI cohort itself, which is not fully representative of older individuals and individuals with dementia in the United States. In addition, some participants were enrolled in earlier phases of ADNI, before amyloid PET imaging was available, so that selective retention and dropout could mean that this is an unusually healthy group of people. Estimation of Aβ trajectories included amyloid-negative individuals with rising levels of brain Aβ in order to select a more “at risk” group for the modeling. However, many of these individuals may not be true amyloid accumulators and may never reach critical thresholds, or this may exclude individuals who eventually progress. In addition, these trajectories are averages and include substantial variability based on the characteristics of the sample and a number of assumptions, including the proportion of Aβ− individuals on the AD pathway, and the proportion of APOE ε4 carriers.41 We evaluated a number of these factors, such as the definition of the Aβ− group, and found that some had modest effects on the timing estimates. Whereas many of these factors may contribute to underestimations or overestimations of the rates of amyloid deposition and conversion, the depicted results provide a reasonable estimate of event timing on the Aβ pathway.
These findings indicate that among baseline amyloid-negative individuals, the rate of Aβ deposition is related to later tau deposition and memory decline. As Aβ accumulation continues past the threshold, accumulation begins to slow before overt clinical symptoms develop. The implications for amyloid-lowering therapies are obvious: they must occur very early, prior to or near the point of transition to amyloid-positive. On a more optimistic note, selection of amyloid-negative individuals to participate in such trials is practicable by using well-known variables that we confirm are associated with a likelihood of amyloid conversion including older age, female sex, APOE genotype, and higher baseline Aβ. The presence of SMCs may also help establish higher baseline Aβ. Findings that amyloid deposition rates are correlated with rates of memory decline and subsequent tau offer the hope that slowing Aβ deposition could yield a cognitively meaningful outcome, even in amyloid-negative people. The findings in this report argue for the importance and feasibility of targeting anti-amyloid therapies to amyloid-negative individuals.
Acknowledgment
The authors thank Suzanne Baker, Danielle Harvey, Robert Koeppe, Deniz Korman, Alice Murphy, and Tyler Ward for their help with processing and analyzing the data and providing advice. Data collection and sharing for this project was funded by the Alzheimer's Disease Neuroimaging Initiative (ADNI) (NIH grant U01 AG024904). ADNI is funded by the National Institute on Aging, the National Institute of Biomedical Imaging and Bioengineering, and through contributions from the following: Alzheimer's Association; Alzheimer's Drug Discovery Foundation; Araclon Biotech; BioClinica, Inc.; Biogen Idec, Inc.; Bristol-Myers Squibb Company; Eisai, Inc.; Elan Pharmaceuticals, Inc.; Eli Lilly and Company; EuroImmun; F. Hoffmann-La Roche Ltd. and its affiliated company Genentech, Inc.; Fujirebio; GE Healthcare; IXICO Ltd.; Janssen Alzheimer Immunotherapy Research & Development, LLC; Johnson & Johnson Pharmaceutical Research & Development LLC; Medpace, Inc.; Merck & Co., Inc.; Meso Scale Diagnostics, LLC; NeuroRx Research; Neurotrack Technologies; Novartis Pharmaceuticals Corporation; Pfizer Inc.; Piramal Imaging; Servier; Synarc Inc.; and Takeda Pharmaceutical Company. The Canadian Institutes of Health Research is providing funds to support ADNI clinical sites in Canada. Private sector contributions are facilitated by the Foundation for the NIH (fnih.org). The grantee organization is the Northern California Institute for Research and Education, and the study is coordinated by the Alzheimer's Disease Cooperative Study at the University of California, San Diego. ADNI data are disseminated by the Laboratory for NeuroImaging at the University of Southern California.
Glossary
- Aβ
β-amyloid
- AD
Alzheimer disease
- ADNI
Alzheimer's Disease Neuroimaging Initiative
- CN
cognitively normal
- FBP
[18F]florbetapir
- FTP
[18F]flortaucipir
- FWHM
full width at half maximum
- MCI
mild cognitive impairment
- ROI
region of interest
- SMC
subjective memory complaints
- SUVR
standardized uptake value ratio
Appendix 1. Authors

Appendix 2. Coinvestigator

Study Funding
National Institute on Aging (U01 AG024904).
Disclosure
W.J. Jagust has served as a consultant to Genentech, Biogen, Novartis, CuraSen, Bioclinica, and Grifols. S.M. Landau has previously consulted for Cortexyme and NeuroVision. Go to Neurology.org/N for full disclosures.
References
- 1.Price JL, Morris JC. Tangles and plaques in nondemented aging and “preclinical” Alzheimer's disease. Ann Neurol 1999;45:358–368. [DOI] [PubMed] [Google Scholar]
- 2.Jagust WJ. Imaging the evolution and pathophysiology of Alzheimer's disease. Nat Rev Neurosci 2018;19:687–700. [DOI] [PMC free article] [PubMed] [Google Scholar]
- 3.Hardy J, Selkoe DJ. The amyloid hypothesis of Alzheimer's disease: progress and problems on the road to therapeutics. Science 2002;297:353–356. [DOI] [PubMed] [Google Scholar]
- 4.Cummings J, Aisen PS, DuBois B, et al. Drug development in Alzheimer's disease: the path to 2025. Alzheimers Res Ther 2016;8:39. [DOI] [PMC free article] [PubMed] [Google Scholar]
- 5.Morris GP, Clark IA, Vissel B. Inconsistencies and controversies surrounding the amyloid hypothesis of Alzheimer's disease. Acta Neuropathol Commun 2014;2:135. [DOI] [PMC free article] [PubMed] [Google Scholar]
- 6.Golde TE, DeKosky ST, Galasko D. Alzheimer's disease: the right drug, the right time. Science 2018;362:1250–1251. [DOI] [PubMed] [Google Scholar]
- 7.Jack CR Jr, Bennett DA, Blennow K, et al. ; NIA-AA Research Framework. Toward a biological definition of Alzheimer's disease. Alzheimers Dement 2018;14:535–562. [DOI] [PMC free article] [PubMed] [Google Scholar]
- 8.Swinford CG, Risacher SL, Charil A, et al. Memory concerns in the early Alzheimer's disease prodrome: regional association with tau deposition. Alzheimers Dement 2018;10:322–331. [DOI] [PMC free article] [PubMed] [Google Scholar]
- 9.Petersen RC, Aisen PS, Beckett LA, et al. Alzheimer's Disease Neuroimaging Initiative (ADNI): clinical characterization. Neurology 2010;74:201–209. [DOI] [PMC free article] [PubMed] [Google Scholar]
- 10.Landau SM, Fero A, Baker SL, et al. Measurement of longitudinal beta-amyloid change with 18F-florbetapir PET and standardized uptake value ratios. J Nucl Med 2015;56:567–574. [DOI] [PMC free article] [PubMed] [Google Scholar]
- 11.Klunk WE, Koeppe RA, Price JC, et al. The Centiloid Project: standardizing quantitative amyloid plaque estimation by PET. Alzheimers Dement 2015;11:1–15.e1-4. [DOI] [PMC free article] [PubMed] [Google Scholar]
- 12.Joshi AD, Pontecorvo MJ, Clark CM, et al. Performance characteristics of amyloid PET with florbetapir F 18 in patients with alzheimer's disease and cognitively normal subjects. J Nucl Med 2012;53:378–384. [DOI] [PubMed] [Google Scholar]
- 13.Buckner RL, Head D, Parker J, et al. A unified approach for morphometric and functional data analysis in young, old, and demented adults using automated atlas-based head size normalization: reliability and validation against manual measurement of total intracranial volume. Neuroimage 2004;23:724–738. [DOI] [PubMed] [Google Scholar]
- 14.Landau SM, Harvey D, Madison CM, et al. Associations between cognitive, functional, and FDG-PET measures of decline in AD and MCI. Neurobiol Aging 2011;32:1207–1218. [DOI] [PMC free article] [PubMed] [Google Scholar]
- 15.Baker SL, Maass A, Jagust WJ. Considerations and code for partial volume correcting [(18)F]-AV-1451 tau PET data. Data Brief 2017;15:648–657. [DOI] [PMC free article] [PubMed] [Google Scholar]
- 16.Jack CR Jr, Wiste HJ, Weigand SD, et al. Defining imaging biomarker cut points for brain aging and Alzheimer's disease. Alzheimers Dement 2017;13:205–216. [DOI] [PMC free article] [PubMed] [Google Scholar]
- 17.Crane PK, Carle A, Gibbons LE, et al. Development and assessment of a composite score for memory in the Alzheimer's Disease Neuroimaging Initiative (ADNI). Brain Imaging Behav 2012;6:502–516. [DOI] [PMC free article] [PubMed] [Google Scholar]
- 18.Gibbons LE, Carle AC, Mackin RS, et al. A composite score for executive functioning, validated in Alzheimer's Disease Neuroimaging Initiative (ADNI) participants with baseline mild cognitive impairment. Brain Imaging Behav 2012;6:517–527. [DOI] [PMC free article] [PubMed] [Google Scholar]
- 19.Yesavage JA, Brink TL, Rose TL, et al. Development and validation of a geriatric depression screening scale: a preliminary report. J Psychiatr Res 1982;17:37–49. [DOI] [PubMed] [Google Scholar]
- 20.Jack CR Jr, Knopman DS, Jagust WJ, et al. Tracking pathophysiological processes in Alzheimer's disease: an updated hypothetical model of dynamic biomarkers. Lancet Neurol 2013;12:207–216. [DOI] [PMC free article] [PubMed] [Google Scholar]
- 21.Fleisher AS, Chen K, Quiroz YT, et al. Florbetapir PET analysis of amyloid-beta deposition in the presenilin 1 E280A autosomal dominant Alzheimer's disease kindred: a cross-sectional study. Lancet Neurol 2012;11:1057–1065. [DOI] [PMC free article] [PubMed] [Google Scholar]
- 22.Jack CR Jr, Wiste HJ, Lesnick TG, et al. Brain beta-amyloid load approaches a plateau. Neurology 2013;80:890–896. [DOI] [PMC free article] [PubMed] [Google Scholar]
- 23.Villemagne VL, Burnham S, Bourgeat P, et al. Amyloid beta deposition, neurodegeneration, and cognitive decline in sporadic Alzheimer's disease: a prospective cohort study. Lancet Neurol 2013;12:357–367. [DOI] [PubMed] [Google Scholar]
- 24.Leal SL, Lockhart SN, Maass A, et al. Subthreshold amyloid predicts tau deposition in aging. J Neurosci 2018;38:4482–4489. [DOI] [PMC free article] [PubMed] [Google Scholar]
- 25.Villain N, Chetelat G, Grassiot B, et al. Regional dynamics of amyloid-beta deposition in healthy elderly, mild cognitive impairment and Alzheimer's disease: a voxelwise PiB-PET longitudinal study. Brain 2012;135:2126–2139. [DOI] [PubMed] [Google Scholar]
- 26.Burgold S, Filser S, Dorostkar MM, et al. In vivo imaging reveals sigmoidal growth kinetic of beta-amyloid plaques. Acta Neuropathol Commun 2014;2:30. [DOI] [PMC free article] [PubMed] [Google Scholar]
- 27.Bero AW, Yan P, Roh JH, et al. Neuronal activity regulates the regional vulnerability to amyloid-beta deposition. Nat Neurosci 2011;14:750–756. [DOI] [PMC free article] [PubMed] [Google Scholar]
- 28.Tosun D, Landau S, Aisen PS, et al. Association between tau deposition and antecedent amyloid-beta accumulation rates in normal and early symptomatic individuals. Brain 2017;140:1499–1512. [DOI] [PubMed] [Google Scholar]
- 29.Landau SM, Horng A, Jagust WJ, et al. Memory decline accompanies subthreshold amyloid accumulation. Neurology 2018;90:e1452–e1460. [DOI] [PMC free article] [PubMed] [Google Scholar]
- 30.Farrell ME, Chen X, Rundle MM, et al. Regional amyloid accumulation and cognitive decline in initially amyloid-negative adults. Neurology 2018;91:e1809–e1821. [DOI] [PMC free article] [PubMed] [Google Scholar]
- 31.Vlassenko AG, Mintun MA, Xiong C, et al. Amyloid-beta plaque growth in cognitively normal adults: longitudinal [11C]Pittsburgh compound B data. Ann Neurol 2011;70:857–861. [DOI] [PMC free article] [PubMed] [Google Scholar]
- 32.Jack CR Jr, Wiste HJ, Weigand SD, et al. Amyloid-first and neurodegeneration-first profiles characterize incident amyloid PET positivity. Neurology 2013;81:1732–1740. [DOI] [PMC free article] [PubMed] [Google Scholar]
- 33.Jack CR Jr, Therneau TM, Wiste HJ, et al. Transition rates between amyloid and neurodegeneration biomarker states and to dementia: a population-based, longitudinal cohort study. Lancet Neurol 2016;15:56–64. [DOI] [PMC free article] [PubMed] [Google Scholar]
- 34.Elman JA, Panizzon MS, Gustavson DE, et al. Amyloid-beta positivity predicts cognitive decline but cognition predicts progression to amyloid-beta positivity. Biol Psychiatry 2020;87:819–828. [DOI] [PMC free article] [PubMed] [Google Scholar]
- 35.Farrer LA, Cupples LA, Haines JL, et al. Effects of age, sex, and ethnicity on the association between apolipoprotein E genotype and Alzheimer disease: a meta-analysis: APOE and Alzheimer Disease Meta Analysis Consortium. JAMA 1997;278:1349–1356. [PubMed] [Google Scholar]
- 36.Neu SC, Pa J, Kukull W, et al. Apolipoprotein E genotype and sex risk factors for Alzheimer disease: a meta-analysis. JAMA Neurol 2017;74:1178–1189. [DOI] [PMC free article] [PubMed] [Google Scholar]
- 37.Grothe MJ, Barthel H, Sepulcre J, et al. In vivo staging of regional amyloid deposition. Neurology 2017;89:2031–2038. [DOI] [PMC free article] [PubMed] [Google Scholar]
- 38.Palmqvist S, Scholl M, Strandberg O, et al. Earliest accumulation of beta-amyloid occurs within the default-mode network and concurrently affects brain connectivity. Nat Commun 2017;8:1214. [DOI] [PMC free article] [PubMed] [Google Scholar]
- 39.Mattsson N, Palmqvist S, Stomrud E, et al. Staging beta-amyloid pathology with amyloid positron emission tomography. JAMA Neurol 2019;76. [DOI] [PMC free article] [PubMed] [Google Scholar]
- 40.Insel PS, Mormino EC, Aisen PS, et al. Neuroanatomical spread of amyloid beta and tau in Alzheimer's disease: implications for primary prevention. Brain Commun 2020;2:fcaa007. [DOI] [PMC free article] [PubMed] [Google Scholar]
- 41.Burnham SC, Laws SM, Budgeon CA, et al. Impact of APOE-epsilon4 carriage on the onset and rates of neocortical Abeta-amyloid deposition. Neurobiol Aging 2020;95:46–55. [DOI] [PMC free article] [PubMed] [Google Scholar]
Associated Data
This section collects any data citations, data availability statements, or supplementary materials included in this article.
Data Availability Statement
All data used in this article are available to the public at the ADNI data repository at the Laboratory of Neuroimaging (adni.loni.usc.edu). Derived data are available from the authors upon request.