Abstract
Objective
To determine whether the genetic prevalence of the CTG expansion in the DMPK gene associated with myotonic dystrophy type 1 (DM1) in an unbiased cohort is higher than previously reported population estimates, ranging from 5 to 20 per 100,000 individuals.
Methods
This study used a cross-sectional cohort of deidentified dried blood spots from the newborn screening program in the state of New York, taken from consecutive births from 2013 to 2014. Blood spots were screened for the CTG repeat expansion in the DMPK gene using triplet-repeat primed PCR and melt curve analysis. Melt curve morphology was assessed by 4 blinded reviewers to identify samples with possible CTG expansion. Expansion of the CTG repeat was validated by PCR fragment sizing using capillary electrophoresis for samples classified as positive or premutation to confirm the result. Prevalence was calculated as the number of samples with CTG repeat size ≥50 repeats compared to the overall cohort.
Results
Of 50,382 consecutive births, there were 24 with a CTG repeat expansion ≥50, consistent with a diagnosis of DM1. This represents a significantly higher DM1 prevalence of 4.76 per 10,000 births (95% confidence interval 2.86–6.67) or 1 in every 2,100 births. There were an additional 96 samples (19.1 per 10,000 or 1 in 525 births) with a CTG expansion in the DMPK gene in the premutation range (CTG)35–49.
Conclusion
The prevalence of individuals with CTG repeat expansions in DMPK is up to 5 times higher than previous reported estimates. This suggests that DM1, with multisystemic manifestations, is likely underdiagnosed in practice.
Myotonic dystrophy type 1 (DM1) is an autosomal dominant disorder due to a noncoding CTG repeat expansion in the 3′untranslated region of the DMPK gene.1–3 DM1 is characterized by early-onset cataracts, delayed muscle relaxation (myotonia), and skeletal muscle weakness, but individuals with DM1 can also develop multisystemic manifestations.4 Individuals with 50 to 150 repeats typically have later onset and a less severe course, while individuals with ≥150 to 1,000 CTG expansions have the more typical young adult onset. Individuals with >1,000 CTG repeats have a more severe course with childhood or neonatal onset. Individuals with 35 to 49 CTG repeats are considered premutation carriers and are at risk for expansion in subsequent generations, especially in transmission from mother to child.
The current prevalence estimate of DM1 is between 5 and 20 per 100,000 individuals.4–6 The estimated prevalence may be higher in areas with a founder population. According to available literature, the true population prevalence has best been estimated as ≈1 in 8,000.5,6 However, this is likely an underestimate due to a cross section of the population who are currently asymptomatic, as well as an estimated 7-year delay in diagnosis.7
This study seeks to obtain an unbiased prevalence estimate for DMPK CTG repeat expansion using DNA samples obtained from a newborn screening cohort from a cosmopolitan US population (New York State). In addition, the study seeks to understand the prevalence of premutation carriers because these individuals represent risk of future repeat expansion.
Methods
The authors obtained permission from the New York State Newborn Screening Laboratory to test for repeat expansions in deidentified consecutive births. All studies were conducted with Institutional Review Board (IRB) approval.
Samples
Samples were obtained from dried blood spots (DBS) from 51,341 consecutive births occurring between December 2013 and April 2014 from the Newborn Screening Program at the New York State Newborn Screening Program, Wadsworth Center, New York State Department of Health under a University of Utah IRB–approved protocol (IRB No. 87466). These samples were collected throughout the state of New York. DBS were not sent from repeat heel sticks (for second samples), when parents declined participation in research, if the sample was unsuitable for DNA analysis, or there was not enough blood left for research. Genomic DNA was purified from healthy controls and individuals with DM1 after providing written informed consent under a separate University of Utah IRB–approved protocol to serve as positive and negative controls (IRB No. 40092).
Standard Protocol Approvals, Registrations, and Patient Consents
We received approval from the University of Utah IRB (IRB No. 87466).
High Throughput Screening With Triplet Primed PCR and Melt Curve Analysis
Currently, clinical detection of the repeat expansion in DMPK relies on a Southern blot assay, which is expensive, time-consuming, and not amenable to high-throughput activities. To enable low-cost, high-throughput population screening for the CTG expansion in DMPK, we previously optimized a triplet primed (TP) PCR with a melt curve analysis (MCA) and piloted the method on a subset of the DBS used in this study.8 Briefly, 3-mm punches from DBS were placed in plates, along with punches from healthy controls and known DM1 controls. DNA was extracted with a modified CASM method.9 TP-PCR for the (CTG)n repeat in DMPK was adapted from prior conditions10 and amplification was performed in 384-well PCR plates that included 9 control samples with known CTG repeat sizes for allele 1 and allele 2: 5::5, 5::13, 5::14, 5::30, 5::37, 5::75, 5::80, 5::480, and 14::2,530. High-resolution melt curves were measured after amplification on an Applied Biosystems QuantStudio 12K Flex instrument (Applied Biosystems, Foster City, CA).
Melt Curve Analysis
Temperature, normalized fluorescence intensity, and the negative derivative of normalized fluorescence intensity with respect to temperature (−dF/dT) were exported with the QuantStudio 12K Flex software, and the normalized −dF/dT values for each sample were plotted from 80°C to 94°C. Melt profiles from individual samples were scored by 4 blinded reviewers using averaged melt curves from 4 positive controls as a guide and classified into 1 of 6 categories: normal, high normal, premutation, positive, uncertain, and fail. These categories are based on the common (CTG)n size classes (ranges 5, 9–17, and 18–34 repeats) observed in worldwide populations. We have previously shown that the TP-PCR/MCA assay can discriminate the 5 and 9 to 17 size classes (normal) from the 18 to 34 size class (high normal) and the premutation range (35–49) from the mutation range (≥50).8 The final classification was made by majority call from the reviewers. In the event of a tie, the higher classification was assigned. For the clustering analysis of these samples, normalized −dF/dT data interpolated to 0.05°C increments were used with the Uniform Manifold Approximation and Projection (UMAP) dimension reduction technique.11
Confirmation of Expanded CTG Repeat Allele Size
We measured the size of the CTG repeat expansion on all samples with positive or premutation scores from blinded review. Additional validations were done for samples scored high normal and uncertain to ensure that true-positive samples were not missed. Given the low DNA yield from DBS, we opted to perform PCR fragment size analysis using capillary electrophoresis (CE) on an ABI3730xl instrument as previously described8 instead of traditional Southern blot analysis to validate the CTG repeat expansion. Genomic DNA from DBS selected for direct sizing analysis was further purified with Zymo DNA Clean and Concentrator-5 columns (Zymo Research, Irvine, CA). Samples suspected to have expansions of >75 CTG repeats were further validated with the AmplideX PCR/CE DMPK kit (Asuragen, Austin, TX) according to the manufacturer’s instructions. This PCR/CE approach can size the length of the (CTG)n repeat up to ≈200 repeats, with larger expansions classified as >200 repeats.
Relatedness, Population Structure, and Haplotype Estimation
Concentrated genomic DNA (≈100 ng) was used for SNP genotyping using Illumina Infinium Global Screening Array version 2.0 reagents (Illumina, San Diego, CA) following the manufacturer's standard protocols. Samples were filtered by genotyping success rate for the 660,664 SNPs on the array with a median success rate per sample of 98.3% with a minimum of 93.1%, and SNP genotypes were filtered for SNP missingness (>5%) and deviations from Hardy-Weinberg equilibrium. Genetic relatedness was inferred from estimated pair-wise kinship coefficients and pair-wise identity by descent segments using the KING software with the –related option.12 Haplotype phasing and genotype imputation were performed using the Michigan Imputation server running Minimac3 with the 1000 Genome Phase 3 reference panel.13 After imputed genotypes from 21 study samples were merged with 2,490 unrelated samples from the 1000 Genomes project,14 SNP data were pruned for markers in linkage disequilibrium using PLINK with the –indep-pairwise parameter set to 50 10 0.1. Population structure was estimated using the ADMIXTURE software15 with the clustering parameter K = 8 and merging results from 10 runs with different random seeds. The LASER/TRACE server16 was used to determine principal components from the study genotype data, and the 1000 Genome reference neighbors were calculated using the Euclidean distance measure implemented by the LASER K nearest neighbors algorithm. The DMPK haplotype block was assigned from the TaqI, Alu, and HinfI polymorphisms as described by Tishkoff et al.17 using phased genotypes from rs10415988 (TaqI, chr19:46246704), rs4802275 (Alu, chr19:46260375), and rs16939 (HinfI, chr19:46276056) that flank the DMPK CTG repeat at chr19:46273463 to 46273465 (hg19).
Prevalence Estimation
Prevalence of the CTG expansion in DMPK was based on 24 positive samples with a full repeat expansion (≥50 repeats) divided by the 50,382 birth cohort with the Wald 95% confidence intervals estimated for binomial proportions using SAS software, version 9.4 (SAS Institute, Cary NC).
Data Availability
Data will be made available to investigators on request. Table S1 and figures S1 and S2 are available from Dryad at doi.org/10.5061/dryad.xksn02vdf.
Results
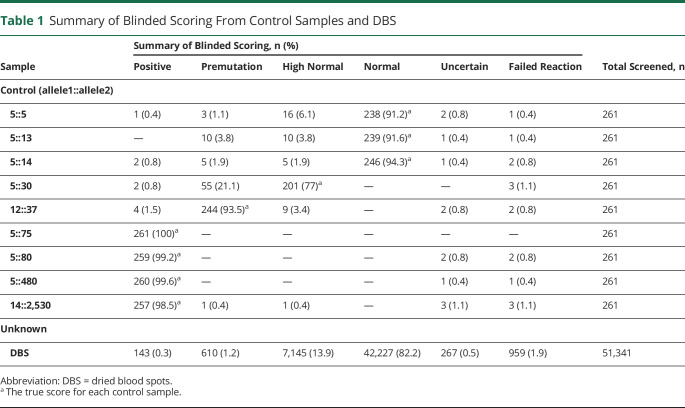
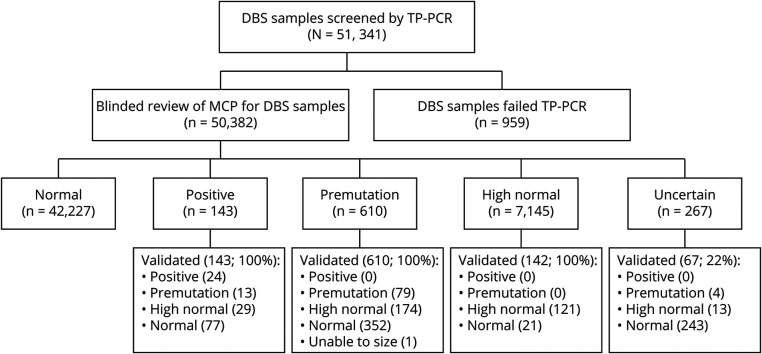
Melt curve profiles for the 9 control samples on each plate were scored correctly by blinded reviewers in the vast majority of cases (table 1), with a sensitivity of 99.2% and specificity of 99.6%. High normal (5:30) and premutation (12:37) controls were scored more variably but confirmed the ability of TP-PCR with MCA to accurately detect repeat expansions at the higher end of the normal range. From the study sample, 51,341 DBS were analyzed with 959 reaction failures (1.9%), leaving 50,382 samples available for analysis (table 1). A cluster analysis visualizes the distribution of repeat sizes on the melt curve (figure 1). One hundred forty-three samples were scored as positive and 610 samples as premutation by blinded review. Figure 2 demonstrates the allocation of each sample. All of these samples and a random selection of samples scored high normal or uncertain were analyzed by fluorescent PCR/CE fragment sizing.
Table 1.
Summary of Blinded Scoring From Control Samples and DBS
Figure 1. Clustering and Variability of Blinded Review of Melt Curves From DBS Samples.
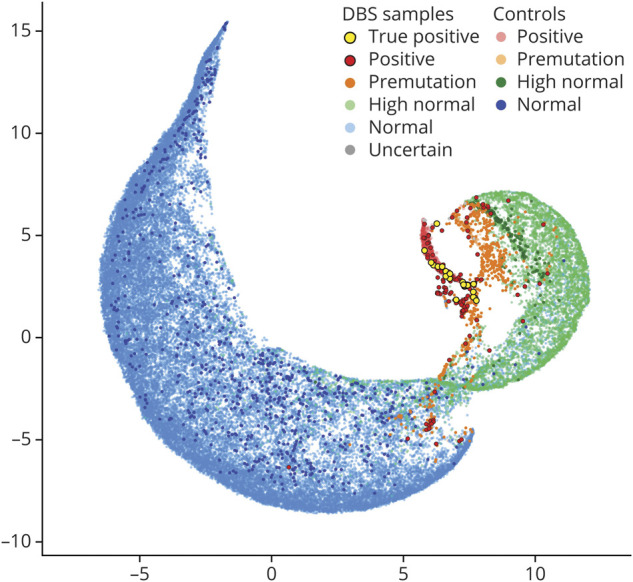
The −dF/dT data from 87.25°C to 96.70°C were clustered by Uniform Manifold Approximation and Projection and visualized as a 2-dimensional representation. Fifty thousand three hundred eighty-two dried blood spot (DBS) samples and 1,038 expanded (5::75, 5::80, 5::480, and 5::2,530), 259 premutation (12::37), 258 high normal (14::30), and 779 normal (5::5, 5::13, and 5::14) control melt profiles were used with sample points colored by the consensus call of blinded reviewers.
Figure 2. Sample Flow Diagram.
Results of blinded review of melt curve profiles (MCPs) and validation assay to estimate CTG repeat size for dried blood spot (DBS) samples. TP = triplet primed.
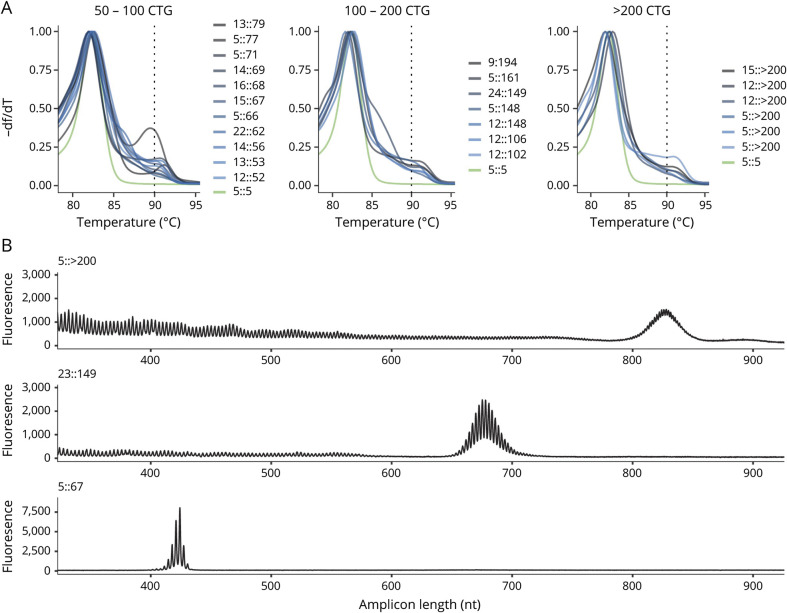
Of the 143 samples scored as positive from blinded review of the melt curve profile, 24 were found to have (CTG)n ≥50. Melt profiles for all 24 samples with positive repeat expansion (CTG repeat size ≥50) are shown in figure 3A, and capillary electropherograms from 3 representative samples (>200, 149, and 67 CTG repeats) are shown in figure 3B. Individual melt curve profiles and capillary electropherograms for all samples with a CTG repeat ≥50 are shown in figures S1 and S2 (doi.org/10.5061/dryad.xksn02vdf). Expansion of the CTG repeat in the premutation range (35–49 CTG repeats) was verified for 96 samples (13 from samples screened as positive, 79 from samples screened as premutation, and 4 from samples screened as uncertain). Validation studies did not identify any sample with CTG ≥50 from the 819 samples that were initially scored as premutation, high normal, or uncertain. Individual scores from blinded reviewers and final allele size estimation from the validation studies for all samples with final CTG repeat size in the positive or premutation range are included in table S1 (doi.org/10.5061/dryad.xksn02vdf). According to this population cohort, the prevalence of the CTG expansion in DMPK consistent with DM1 is 1:2,100 (4.76 per 10,000 births, 95% confidence interval 2.86–6.67). Furthermore, premutation carriers (35–49 CTG repeats) were 4 times as prevalent as positive samples (CTG ≥50) with 96 confirmed samples in 50,382 screened (prevalence 19.1 per 10,000 births) or 1 in 525 births.
Figure 3. Screening Melt Curve Analysis and Secondary Screening for 24 Samples Positive for DMPK CTG Repeat Expansions.
(A) Overlay of normalized derivative melt curves from each of the 24 positive samples with CTG repeat size confirmed by secondary screening. Melt curves are grouped by CTG repeat size, and each plot includes a melt curve from normal control (green). (B) Representative capillary electropherograms from the secondary screening of 3 representative samples with >200, 149, and 67 CTG repeats using Amplidex DM1 Dx kit.
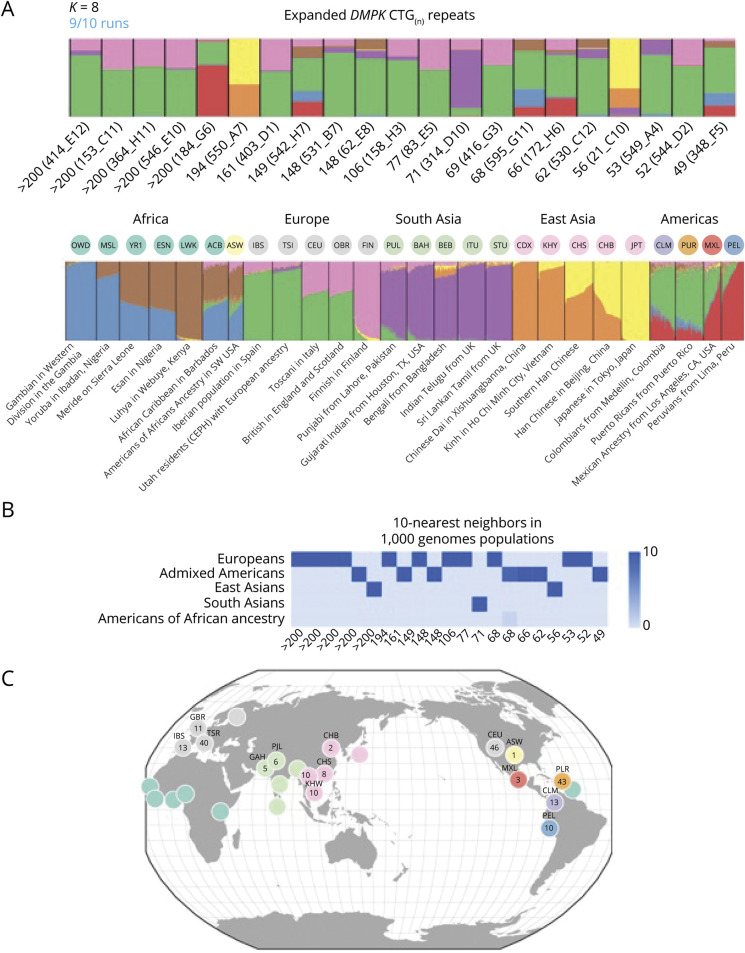
Genome-wide SNP data were recovered for 20 of the 24 positive (CTG repeat ≥50) samples plus 1 premutation (CTG repeat 49) sample and confirmed that these individuals were unrelated because kinship coefficients <0.05 were observed for all pair-wise comparisons. The SNP data were also used to infer genetic ancestry and the DMPK haplotypes. The positive samples clustered predominantly with populations of non-African ancestry (figure 4A), and population labeling showed 11 samples clustered with Europeans, 7 samples with admixed Americans, 2 samples with East Asians, and 1 sample with South Asians (figure 4B). Nearest neighbor analysis using 1000 Genome reference samples suggested that the admixed American samples were enriched for individuals with Puerto Rican ancestry (figure 4C).
Figure 4. Genetic Ancestry Structure for Samples With DMPK Repeat Expansions.
(A) Plot of ADMIXTURE clustering for K = 8 source populations. In the upper plot, 21 study samples are ordered by the largest (>200) to the smallest (49) DMPK CTG repeat number. Each individual is represented by a rectangle with colored segments that represent the proportions of genetic ancestry from each of 8 hypothetical source populations. The lower plot has the K = 8 clustering of 2,490 individuals from 26 different populations found in the 1000 Genomes Project (1KGP) sample resource. Each individual is represented by a vertical line with color heights proportional to the hypothetical source populations. Black vertical lines separate 1KGP population groups, which are annotated with 3-letter 1KGP population code and description. (B) Ancestry decomposition for the 21 study samples computed from principal component analysis using the 1KGP reference populations. Heat map shows the population membership for the 10 nearest reference individuals to each study sample, ordered by CTG repeat size as in panel (A). (C) Circles represent the geographic distribution of the 210 nearest neighbor 1KGP reference individuals with their individual counts displayed by population.
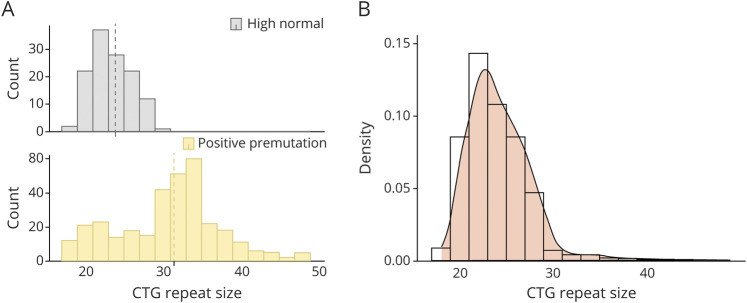
DMPK common haplotype inference for all 21 samples showed that they each carried the (+++) Alu/HinfI/Taq1 haplotype previously shown to be associated with both (CTG)18–34 high normal alleles and (CTG)50–80 mutations in worldwide populations.17 Figure 5A shows the repeat size distribution in the (CTG)18–34 range we observed from a random sampling of 142 high normal melt profiles compared to the 96 premutation (CTG repeat 35–49) samples. The combined distribution of high normal and premutations shown in figure 5B displays a positive skew (mode 23, median 24, mean 24.3) consistent with the (CTG)18–34 haplotype acting as a reservoir for new mutations.
Figure 5. CTG Repeat Distribution on the Risk Haplotype.
(A) Plots of CTG repeat sizes ≥18 inferred from the sampled high normal group (gray histogram) versus the size-validated premutation group (orange histogram). Size ranges on the x-axis are 2-repeat bins starting at 18 repeats, and the dashed lines show the mean size of 24 repeats for the high normal group and 31 repeats for the premutation group. (B) Combined histogram and density plot for the high normal and premutation samples. The high normal group has been scaled to 7,145 observations.
Discussion
DM1 is the most common form of muscular dystrophy, although the prevalence is likely underestimated. This study provides an unbiased population-based estimate of the prevalence of the CTG repeat expansion in the DMPK gene associated with DM1. The estimate, ≈1 in 2,100 (4.8 per 10,000), is significantly higher than previously reported (5–20 per 100,000 individuals).4,6 Several factors likely contribute to the increased prevalence estimate in our study compared to others. First, our study is focused on the number of individuals in a population with expansion of the CTG repeat in the DMPK gene. Hence, our study estimates genetic prevalence, while other studies are focused on prevalence in clinically diagnosed patients. Given the variable presentation in symptoms and age at onset, it is possible that many individuals with CTG expansions in DMPK in a given population are undiagnosed and undetected in clinically based prevalence studies. Second, even in symptomatic patients, there is significant delay in diagnosis in many individuals with DM1.7 More than half (16 of 24) of the positive cases in our population cohort have CTG repeat expansions between 50 and 150 (3 of these individuals have repeats between 147 and 149). Clinically, these patients are expected to have later onset and milder disease features that may go unnoticed, especially early in the course. Specifically, many of these individuals present only with early-onset cataracts and are best detected outside of a neuromuscular practice. Despite the low symptom burden, cardiac abnormalities associated with DM1 are common in this subpopulation.18 It is noteworthy that despite milder symptoms in these individuals, they are at high risk to pass larger repeat expansions to subsequent generations, and these may result in symptoms even in the newborn period.
While the prevalence of DM1 may be higher in some populations than others due to founder effects, we demonstrate that founder effects are not a likely cause for the increased prevalence identified in our study in which individuals with CTG expansion ≥50 were not closely related and have diverse genetic ancestry. New York State has broad ethnic and racial diversity in its population. In 2014, the year from which most of our samples came, there were 238,773 births with the reported ethnicity/race of birth mothers as 48.6% non-Hispanic White, 23.2% Hispanic, 19.6% Black, 11.2% Asian, and 0.3% American Indian or Alaska Native.19 In our cohort, the genetic ancestry of individuals with CTG repeat expansions largely reflects the New York population with 52% European, 33% admixed American, 10% East Asian, and 5% South Asian. An important exception is that none of the 21 samples available for analysis showed significant African ancestry, consistent with prior studies that have observed lower DM1 prevalence in African populations.4
In contrast to the diverse genetic ancestry in our samples with CTG ≥50, we show that all of these samples tested carry the same (+++) Alu/HinfI/Taq1 DMPK haplotype commonly associated with (CTG)18–34 high normal alleles and (CTG)50–80 mutations in worldwide populations.17 This observation is consistent with the hypothesis that individuals with DMPK CTG expansions, regardless of genetic ancestry, originate from a common risk pool of expanded alleles on the (CTG)18–34 haplotype.20 It follows that the variability in genetic prevalence of DM1 in different populations may parallel the population-specific CTG18–34 haplotype frequencies.
The methods described here provide a high-throughput approach to screening for DM1. Given the high number of prevalent cases with pathogenic CTG expansion compared to those with a clinical diagnosis of DM1, there are likely a large number of undiagnosed individuals in the general population. Affected individuals (even if undiagnosed) carry an increased risk for sudden cardiac death and other complications from DM1. Increased awareness of DM1 among practitioners will allow early recognition of symptoms and initiation of appropriate treatment and screening for complications. Furthermore, identification of cases early in the course will help to provide appropriate genetic counseling for individuals at high risk for passing increasingly expanded alleles to their children.
Individuals with expanded repeats (even in the high normal and premutation range) have increased risk of passing larger expansions to future generations.21 Studies examining anticipation in families with DM1 have observed a significant risk for premutation expansion with paternal transmission,22 and in 1 recent study, 12 of 18 (CTG)37–50 alleles and 57 of 63 (CTG)51–80 alleles expanded after a single transmission through the paternal germline.23 In our cohort, 1 of 525 individuals have a confirmed premutation allele with (CTG)35–50. Many more have high normal alleles (CTG)18–34. Both are at high risk for transmitting pathogenic CTG expansions to subsequent generations. Understanding the population structure that includes affected individuals and premutation carriers, but also individuals with smaller expansions on susceptible haplotypes, is an important part of understanding the landscape of genetic risk in a population. In addition to identification of cases with DM1, screening to identify individuals with high normal and premutation alleles may allow identification of high-risk families and facilitate appropriate genetic counseling about reproductive risks. It is difficult to identify approaches outside of population-based screening that will identify the totality of individuals at risk. In light of its relatively high prevalence, newborn screening for DM1 may be considered in the future. However, current management is largely limited to symptomatic and preventive care, and the costs of newborn screening in this scenario are unlikely to be higher than potential benefits. However, potential approval of therapies that would modify the course of the disease in the near future would likely alter this cost-benefit analysis. Furthermore, the assay developed here is amenable to this type of population-based screening.
There are several limitations to the current study. First, this is a deidentified newborn population. Therefore, clinical features cannot be assessed in identified cases. Indeed, symptoms may not be expected for many years. Second, the study was performed in a single state. New York was chosen as being a diverse and representative population, but it is possible that the prevalence may vary in other areas of the United States or world. While it is not a limitation, we note the absence of individuals of African descent in our study. This is consistent with prior haplotype studies suggesting that the founder mutation arose in those individuals who emigrated from Africa.17
Overall, this study provides a more precise genetic prevalence for DM1, making it the most prevalent form of muscular dystrophy. Additional efforts should be undertaken to enhance our diagnosis of undetected individuals.
Acknowledgment
The authors are grateful to the Myotonic Dystrophy Foundation for funding for this study. Additional funding from K23NS091511 (N.E.J.), K08 NS097631 (R.J.B.), and R21 NS100040 (R.B.W.). They are grateful to Kaycie Lawson, MS, Mark Shook, BS, Zoe Edmunds, BS, Denise Kay, PhD and Michele Caggana, ScD, FACMG, of the New York State Newborn Screening Program, Wadsworth Center, New York State Department of Health, for providing deidentified samples, and to Michael Klein, BS, of the University of Utah Genomics Core, for providing instrumentation and expertise for acquiring melt curves.
Glossary
- CE
capillary electrophoresis
- DBA
dried blood spots
- DM1
myotonic dystrophy type 1
- IRB
Institutional Review Board
- MCA
melt curve analysis
- TP
triplet primed
- UMAP
Uniform Manifold Approximation and Projection
Appendix. Authors

Study Funding
This study was supported by the Myotonic Dystrophy Foundation.
Disclosure
N.E. Johnson has received grant funding from National Institute of Neurological Disorders and Stroke (R01NS104010; R21TR003184), Centers for Disease Control and Prevention (1U01DD001242), and the Food and Drug Administrations (7R01FD006071). He receives royalties from the Congenital and Childhood Myotonic Dystrophy Health Index and the Charcot Marie Tooth Health Index. He receives research funds from Dyne, AveXis, CSL Behring, Vertex Pharmaceuticals, Fulcrum Therapeutics, ML Bio, Sarepta, and Acceleron Pharma. He has provided consultation for AveXis, AMO Pharma, Strongbridge BioPharma, Acceleron Pharma, Fulcrum Therapeutics, Dyne, Avidity, and Vertex Pharmaceuticals. R.J. Butterfield is receiving funding via contracts for clinical trials from PTC Therapeutics, Sarepta Therapeutics, Pfizer, Biogen, Carpricor, and Catabasis. He serves on scientific advisory boards for Sarepta Therapeutics, Biogen, and Pfizer. The remaining authors do not report conflicts of interest. Go to Neurology.org/N for full disclosures.
References
- 1.Mahadevan M, Tsilfidis C, Sabourin L, et al. Myotonic dystrophy mutation: an unstable CTG repeat in the 3' untranslated region of the gene. Science 1992;255:1253–1255. [DOI] [PubMed] [Google Scholar]
- 2.Fu YH, Pizzuti A, Fenwick RG Jr, et al. An unstable triplet repeat in a gene related to myotonic muscular dystrophy. Science 1992;255:1256–1258. [DOI] [PubMed] [Google Scholar]
- 3.Brook JD, McCurrach ME, Harley HG, et al. Molecular basis of myotonic dystrophy: expansion of a trinucleotide (CTG) repeat at the 3' end of a transcript encoding a protein kinase family member. Cell 1992;68:799–808. [DOI] [PubMed] [Google Scholar]
- 4.Harper PS. Myotonic Dystrophy, 3rd ed. London: WB Saunders; 2001. [Google Scholar]
- 5.Norwood FL, Harling C, Chinnery PF, Eagle M, Bushby K, Straub V. Prevalence of genetic muscle disease in Northern England: in-depth analysis of a muscle clinic population. Brain 2009;132:3175–3186. [DOI] [PMC free article] [PubMed] [Google Scholar]
- 6.Siciliano G, Manca M, Gennarelli M, et al. Epidemiology of myotonic dystrophy in Italy: re-apprisal after genetic diagnosis. Clin Genet 2001;59:344–349. [DOI] [PubMed] [Google Scholar]
- 7.Hilbert JE, Ashizawa T, Day JW, et al. Diagnostic odyssey of patients with myotonic dystrophy. J Neurol 2013;260:2497–2504. [DOI] [PMC free article] [PubMed] [Google Scholar]
- 8.Butterfield RJ, Imburgia C, Mayne K, et al. High throughput detection of expanded CTG repeat in myotonic dystrophy type 1 using melt curve analysis. medRxiv 2021.01.11.21249609; doi: 10.1101/2021.01.11.21249609 [DOI] [PMC free article] [PubMed]
- 9.Saavedra-Matiz CA, Isabelle JT, Biski CK, et al. Cost-effective and scalable DNA extraction method from dried blood spots. Clin Chem 2013;59:1045–1051. [DOI] [PubMed] [Google Scholar]
- 10.Falk M, Vojtísková M, Lukás Z, Kroupová I, Froster U. Simple procedure for automatic detection of unstable alleles in the myotonic dystrophy and Huntington's disease loci. Genet Test 2006;10:85–97. [DOI] [PubMed] [Google Scholar]
- 11.Diaz-Papkovich A, Anderson-Trocmé L, Gravel S. UMAP reveals cryptic population structure and phenotype heterogeneity in large genomic cohorts. PLoS Genet 2019;15:85–91. [DOI] [PMC free article] [PubMed] [Google Scholar]
- 12.Manichaikul A, Mychaleckyj JC, Rich SS, Daly K, Sale M, Chen WM. Robust relationship inference in genome-wide association studies. Bioinformatics 2010;26:2867–2873. [DOI] [PMC free article] [PubMed] [Google Scholar]
- 13.Das S, Forer L, Schönherr S, et al. Next-generation genotype imputation service and methods. Nat Genet 2016;48:1284–1287. [DOI] [PMC free article] [PubMed] [Google Scholar]
- 14.A global reference for human genetic variation. Nature 2015;526:68–74. [DOI] [PMC free article] [PubMed] [Google Scholar]
- 15.Alexander DH, Novembre J, Lange K. Fast model-based estimation of ancestry in unrelated individuals. Genome Res 2009;19:1655–1664. [DOI] [PMC free article] [PubMed] [Google Scholar]
- 16.Taliun D, Chothani SP, Schönherr S, et al. LASER server: ancestry tracing with genotypes or sequence reads. Bioinformatics 2017;33:2056–2058. [DOI] [PMC free article] [PubMed] [Google Scholar]
- 17.Tishkoff SA, Goldman A, Calafell F, et al. A global haplotype Analysis of the myotonic dystrophy locus: implications for the evolution of modern humans and for the origin of myotonic dystrophy mutations. Am J Hum Genet 1998;62:1389–1402. [DOI] [PMC free article] [PubMed] [Google Scholar]
- 18.Thornton CA. Myotonic dystrophy. Neurol Clin 2014;32:705–719. [DOI] [PMC free article] [PubMed] [Google Scholar]
- 19.Population Distribution and Change: 2000 to 2010. 2011. Available at: census.gov/prod/cen2010/briefs/c2010br-01.pdf. Accessed July 5, 2020. [Google Scholar]
- 20.Imbert G, Kretz C, Johnson K, Mandel J-L. Origin of the expansion mutation in myotonic dystrophy. Nat Genet 1993;4:72–76. [DOI] [PubMed] [Google Scholar]
- 21.Johnson NE, Heatwole CR. Myotonic dystrophy: from bench to bedside. Semin Neurol 2012;32:246–254. [DOI] [PubMed] [Google Scholar]
- 22.Martorell L, Monckton DG, Sanchez A, Lopez De Munain A, Baiget M. Frequency and stability of the myotonic dystrophy type 1 premutation. Neurology 2001;56:328–335. [DOI] [PubMed] [Google Scholar]
- 23.Joosten IBT, Hellebrekers DMEI, de Greef BTA, et al. Parental repeat length instability in myotonic dystrophy type 1 pre- and protomutations. Eur J Hum Genet 2020;28:956–962. [DOI] [PMC free article] [PubMed] [Google Scholar]
Associated Data
This section collects any data citations, data availability statements, or supplementary materials included in this article.
Data Availability Statement
Data will be made available to investigators on request. Table S1 and figures S1 and S2 are available from Dryad at doi.org/10.5061/dryad.xksn02vdf.


