

Abstract
Objective
To examine whether late-life exposure to PM2.5 (particulate matter with aerodynamic diameters <2.5 µm) contributes to progressive brain atrophy predictive of Alzheimer disease (AD) using a community-dwelling cohort of women (age 70–89 years) with up to 2 brain MRI scans (MRI-1, 2005–2006; MRI-2, 2010–2011).
Methods
AD pattern similarity (AD-PS) scores, developed by supervised machine learning and validated with MRI data from the Alzheimer’s Disease Neuroimaging Initiative, were used to capture high-dimensional gray matter atrophy in brain areas vulnerable to AD (e.g., amygdala, hippocampus, parahippocampal gyrus, thalamus, inferior temporal lobe areas, and midbrain). Using participants' addresses and air monitoring data, we implemented a spatiotemporal model to estimate 3-year average exposure to PM2.5 preceding MRI-1. General linear models were used to examine the association between PM2.5 and AD-PS scores (baseline and 5-year standardized change), accounting for potential confounders and white matter lesion volumes.
Results
For 1,365 women 77.9 ± 3.7 years of age in 2005 to 2006, there was no association between PM2.5 and baseline AD-PS score in cross-sectional analyses (β = −0.004; 95% confidence interval [CI] −0.019 to 0.011). Longitudinally, each interquartile range increase of PM2.5 (2.82 µg/m3) was associated with increased AD-PS scores during the follow-up, equivalent to a 24% (hazard ratio 1.24, 95% CI 1.14–1.34) increase in AD risk over 5 years (n = 712, age 77.4 ± 3.5 years). This association remained after adjustment for sociodemographics, intracranial volume, lifestyle, clinical characteristics, and white matter lesions and was present with levels below US regulatory standards (<12 µg/m3).
Conclusions
Late-life exposure to PM2.5 is associated with increased neuroanatomic risk of AD, which may not be explained by available indicators of cerebrovascular damage.
Compelling evidence has shown that ambient air pollution is an environmental risk factor of brain aging.1–7 Several studies from across the globe have collectively shown that long-term exposure to air pollution, especially late-life PM2.5 (particulate matter with aerodynamic diameters <2.5 µm), was associated with increased risk of dementia and Alzheimer disease (AD).8–15 Despite this increasing epidemiologic evidence, the underlying mechanism of how PM2.5 contributes to pathologic brain aging and the subsequent risk of dementia is not fully understood.1
Air pollution may be linked to dementia via its direct contribution to neurodegeneration or indirectly through increased cerebrovascular damage.16 In an attempt to elucidate the mechanism, a few human studies using neuroimaging data have recently investigated the PM2.5-neurodegenerative effects on vulnerable brain regions. In AD, a progressive loss of tissue across multiple brain regions, including the hippocampus, is observed. However, previous studies, either using the region-of-interest approach17–23 or conducting whole-brain analyses,24 showed only cross-sectional associations between ambient PM2.5 and smaller gray matter volumes in the prefrontal cortex and subcortical regions, including the basal ganglia, and reported inconsistent associations with hippocampal volumes. Therefore, we conducted a longitudinal air pollution–brain MRI aging study to test the hypothesis that long-term PM2.5 exposure contributes to the progressive gray matter atrophy in multiple brain areas vulnerable to AD neuropathologies.25,26
Methods
Standard Protocol Approvals, Registrations, and Patient Consents
The Institutional Review Board at the University of Southern California reviewed all study protocols. Written informed consent was obtained from all participants as part of the original Women's Health Initiative Memory Study (WHIMS)-MRI study.
Study Design and Population
We conducted a prospective cohort study that included participants of the WHIMS-MRI study. Participants were community-dwelling older women (n = 7,479; age ≥65 years) recruited across 48 states over the period of 1996 to 1999 who were free of dementia as determined by standardized WHIMS protocols (appendix e-1 available from Dryad, doi.org/10.5061/dryad.xgxd254cq), described in detail elsewhere.27,28 From April 2005 to January 2006, WHIMS participants (n = 1,403) from 14 (of 38) active WHIMS sites were enrolled in the WHIMS-MRI study. At this time, WHIMS-MRI participants underwent a first MRI scan, which yielded 1,365 scans that met quality control standards. A second MRI scan was performed for 730 women in 2010 to 2011, over an average of 4.7 years since MRI-1, which allowed enough time for the progression of neuropathology. Our cross-sectional analyses included all women with brain scans at MRI-1 that met quality control standards (n = 1,365), and our longitudinal analyses included those women who completed 2 brain scans (n = 712) (figure 1).
Figure 1. Study Flowchart.

WHIMS-MRI Data Acquisition and Processing
MRI series were acquired with a 22-cm field of view and a matrix of 256 × 256 in 1.5T scanners following standardized protocols that were developed by the MRI Quality Control Center.29,30 Included were oblique axial spin density/T2-weighted spin echo (repetition time 3,200 milliseconds, echo time 30/120 milliseconds, slice thickness 3 mm), fluid-attenuated inversion recovery T2-weighted spin echo (repetition time 8,000 milliseconds, inversion time 2,000 milliseconds, echo time 100 milliseconds, slice thickness 3 mm), and oblique axial 3-dimensional T1-weighted gradient echo (flip angle 30°, repetition time 21 milliseconds, echo time 8 milliseconds, slice thickness 1.5 mm) images from the vertex to the skull base parallel to the anterior commissure–posterior commissure plane.31
White matter lesions were segmented with an algorithm that was applied to T1, T2, and fluid-attenuated inversion recovery scans as part of the WHIMS-MRI protocol.32,33 The tissue and lesion segmentation algorithms were combined to classify each voxel as either normal or abnormal. Total white matter lesion volume was classified by combining abnormal brain volumes across all regions. In addition, intracranial volume (ICV) was estimated as the total cerebral hemispheric volumes, including CSF within ventricles and sulcal spaces.30
Estimation of AD Pattern Similarity Scores
The AD pattern similarity (AD-PS) scores used here were generated in previous work,26 and detailed descriptions about the MRI data processing across datasets are given in other reports.34 Briefly, a common template was generated that was based on a sample of cognitively normal White women (n = 50, age 55–90 years, mean age 76.8 years) selected at random from the Alzheimer's Disease Neuroimaging Initiative (ADNI) using a script consisting of 6 stages (brain extraction, template registration, tissue segmentation, improved template registration, cortical thickness registration, quality control, and summary measurements), available with the Advanced Normalization Tools software.34 The brain MRIs from both WHIMS-MRI and ADNI were aligned. The individual MRIs from both studies (n = 2,436) were then processed and warped to the common template. The AD-PS scores were derived with a high-dimensional (voxel-wise) supervised machine learning algorithm. An elastic net regularized logistic regression (EN-RLR) was used to analyze structural brain MRI data patterns at the voxel level.35 AD-PS scores of WHIMS-MRI participants were derived by first estimating an EN-RLR classifier on the basis of gray matter probability maps from cognitively normal individuals and cases with AD participating in ADNI. Next, the gray matter probability maps at baseline and follow-up of WHIMS-MRI were used as input to the EN-RLR classifier to generate AD-PS scores for WHIMS-MRI participants.31 The resulting AD-PS scores can be interpreted as a measure of how similar a WHIMS participant's spatial patterns of gray matter atrophy are to those of cases with AD defined by ADNI.
Discriminative maps were generated to pinpoint the gray matter areas involved in discriminating cases with AD from cognitively normal participants, and this metric was able to capture the unique spatial patterns of gray matter atrophy that involves local areas where AD neuropathologies are thought to first emerge (e.g., amygdala, hippocampus, parahippocampal gyrus, thalamus, inferior temporal lobe areas, and midbrain [all bilateral]).25,26 A graphical illustration of the methodologic approach used to derive the AD-PS score, as well as the discriminative maps with the pinpointed brain areas, can be found in the work by Casanova et al.26
Higher AD-PS scores have been shown to be associated with known risk factors and cognitive status both cross-sectionally and longitudinally, supporting the validity of this measure. For instance, higher AD-PS scores were associated with increased age, poorer cognitive function, and greater small-vessel ischemic disease volume in WHIMS-MRI participants.26 In a longitudinal study, older women with relatively lower AD-PS scores exhibited global cognitive trajectories that were more resilient to cognitive decline over 10 years.36
Air Pollution Exposure Assessment
Detailed procedures for air pollution estimation have been reported elsewhere.10 Briefly, participants' addresses were prospectively collected at each clinic visit, updated at least biannually, and then sent to a single vendor who followed standardized protocols for geocoding residential addresses.37 We generated residence-specific PM2.5 estimates at the individual level by constructing spatiotemporal models that are a function of space and time using the Bayesian Maximum Entropy (BME) method.38,39 The BME data fusion method integrates daily observed PM2.5 obtained from the US Environmental Protection Agency (EPA) Air Quality System nationwide monitoring data with the output of chemical transport models (CTMs). The CTMs fully characterize local emission sources, meteorology, chemical transformations, and the transport of pollutants.40,41 The BME data fusion consisted of 2 steps. In the first step, a Regionalized Air Quality Model Performance analysis41 was conducted to perform a localized bias correction of CTM outputs. The CTM outputs were obtained at an hourly time scale and at the finest spatial grid resolution available, which varied from 36 km for the nationwide domain down to 4 km in some highly populated areas.40,41 These resolutions provide a fine-scale description of PM2.5 across the nationwide domain. In the second step, we performed a BME data integration by using EPA observations as hard data and the Regionalized Air Quality Model Performance–corrected CTM output as soft data to obtain geostatistical estimates of PM2.5. This BME estimation results in maps of PM2.5 that combine the precision of observations and the fine-scale resolution of CTM outputs. The BME method is described elsewhere,38,39 and a summary is available from Dryad (appendix e-2, doi.org/10.5061/dryad.xgxd254cq).
To assess the accuracy of our BME model, we performed a 10-fold estimation analysis. The BME estimates of daily PM2.5 exposures correlated well with the observed Air Quality System–recorded concentrations (average Pearson R2 = 0.70). We then applied the statistically validated BME model to each geocoded residence in 1999 to 2010 to generate the late-life average PM2.5 3 years preceding MRI-1. We focused on regional PM2.5 exposure estimated at residential locations because the vast majority of air pollution epidemiologic studies have focused on exposure to air pollutants from the outdoor sources, which are regulated by the US EPA for their great effect on public health.
Covariate Data
At WHIMS enrollment, a structured questionnaire was administered to participants to gather information on demographics (age, race/ethnicity), socioeconomic factors (education, family income, employment status), and lifestyle factors (smoking status, alcohol use, physical activity). Clinical characteristics were also ascertained, including history of cardiovascular disease (heart problems, problems with blood circulation, or blood clots), hypertension, history of depression, calculated body mass index (BMI; kilograms per meters squared), diabetes mellitus (physician diagnosis plus oral medications or insulin therapy), and prior hormone therapy use. The self-reported medical histories and the physical measures have been shown to be reliable and valid for use in epidemiologic studies.42–44
Statistical Analysis
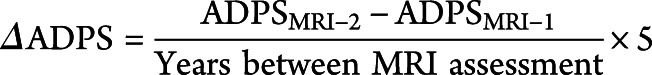
We regressed our outcome variables on 3-year average PM2.5 exposure preceding MRI-1, using the general linear model (GLM) to account for potential confounders. Our base model included age at MRI screening, race/ethnicity, geographic region, and ICV. Other covariates were sequentially added to GLM by categories (e.g., socioeconomic factors, lifestyle factors, clinical characteristics). In cross-sectional analyses, our primary outcome was AD-PS scores measured at MRI-1. Our primary outcome in the longitudinal analysis was defined as the 5-year standardized change in AD-PS scores from MRI-1 to MRI-2 over an individual's follow-up period, with higher scores indicating an increase in neuroanatomic risk of AD. This change score was calculated as follows:
 |
For comparison, we also examined the AD-PS score at MRI-1, which was also log-transformed to improve the normality of the distribution. To evaluate whether the observed associations between PM2.5 and AD-PS score, if any, could be influenced by MRI-measured cerebrovascular damage in late life, we conducted additional analyses further adjusting for white matter lesion volume or excluding those with incident clinical stroke ascertained during the follow-up period. To put the results of our GLMs into context, we also conducted an ad hoc Cox proportional hazards regression analysis among WHIMS-MRI participants who were free of probable dementia or AD before MRI-1 to estimate what an increase in AD-PS scores associated with an interquartile range (IQR) increase of PM2.5 would translate to with regard to AD risk, using outcome data determined by WHIMS protocols (appendix e-1 available from Dryad, doi.org/10.5061/dryad.xgxd254cq).
Several sensitivity analyses were carried out to test the robustness of our findings. These included a cross-sectional analysis restricted to only those who returned for a follow-up scan (n = 712). Three additional sets of longitudinal analyses were conducted: further adjusting for AD-PS scores at MRI-1, incorporating inverse probability weighting to account for possible biases resulting from selective participation in the study (appendixes e-3 and e-4 available from Dryad, doi.org/10.5061/dryad.xgxd254cq), or restricting the analytic sample to women (n = 473) with 3-year average PM2.5 exposures <12 µg/m3, which is the current regulatory standard set by the US EPA. In addition, for both cross-sectional and longitudinal analyses, we further adjusted for socioeconomic characteristics of residential neighborhood measured at the census track level (appendix e-5 available from Dryad, doi.org/10.5061/dryad.xgxd254cq).45 We also included an exploratory analysis excluding women with mild cognitive impairment/dementia before MRI-1 or over follow-up to explore whether the putative PM2.5 effect remains at the preclinical stage.
Finally, we examined whether PM2.5 effects could be modified by age or clinical characteristics, including history of cardiovascular disease, hypertension, high cholesterol, calculated BMI, diabetes mellitus, and white matter lesion volumes at MRI-1. All analyses were performed with SAS, version 9.4 (SAS Institute, Inc, Cary, NC).
Data Availability
The data used in this study may be made available following WHI policies.
Results
On average, AD-PS scores (range 0–1) increased from MRI-1 (0.28 ± 0.20) to MRI-2 (0.44 ± 0.26). Over the 5-year period, AD-PS scores increased by 0.17 (±0.15) on average and were normally distributed (figure e-1 available from Dryad, doi.org/10.5061/dryad.xgxd254cq). Older women with 2 brain MRI scans (n = 712) did not significantly differ from the others participating in MRI-1 only (n = 653) with respect to employment status, family income, education level, lifestyle factors, most clinical characteristics, white matter lesions, and ICV (table 1). Compared to those who only completed MRI-1, those included in the longitudinal analyses were younger (age 77.4 ± 3.5 years), had lower AD-PS scores, were exposed to lower PM2.5 levels in 2005 to 2006, and were more likely to reside in the Midwest and to self-identify as non-Hispanic Whites but were less likely to be hypertensive. The full table with all sample characteristics is available from Dryad (table e-1, doi.org/10.5061/dryad.xgxd254cq).
Table 1.
Distribution of Participants With and Without Follow-up MRI Across Sample Characteristics

Table 2 (full table is available from Dryad [table e-2, doi.org/10.5061/dryad.xgxd254cq]) describes the 3-year average PM2.5 exposure estimates among WHIMS-MRI participants included in our longitudinal analyses (n = 712). Participants with exposures estimated in the upper 2 quartiles (≥10.91 µg/m3) were more likely to be racial/ethnic minorities (Black or Hispanic White), to reside in the US Northeast region, to be unemployed at WHIMS baseline, and to have low white matter lesions. The corresponding exposure distribution among participants in the cross-sectional analyses is available from Dryad (table e-3 [n = 1,365], doi.org/10.5061/dryad.xgxd254cq). Table 3 (full table is available from Dryad [table e-4, doi.org/10.5061/dryad.xgxd254cq]) describes the population characteristics in relation to changes in AD-PS scores, as well as the baseline AD-PS score determined at MRI-1. Geographic region, age, education level, employment status, smoking status, alcohol intake, cardiovascular disease, diabetes mellitus, hypertension, and ICV significantly predicted either baseline AD-PS scores or changes in scores, suggesting that certain sample characteristics may contribute differentially to the developmental process before the MRI-1 and progression of neuroanatomic risk for AD during the follow-up (appendix e-6 available from Dryad, doi.org/10.5061/dryad.xgxd254cq).
Table 2.
Sample Distribution of 3-Year Average Exposure to Fine Particulate Matter in Relation to Sample Characteristics (n = 712)

Table 3.
Sample Characteristics in Relation to AD-PS Scores

In table 4, we present the results of the GLMs, with the regression coefficient β (95% confidence interval [CI]) expressed as the observed difference in the outcome variable associated with each IQR increase of 3-year average PM2.5 (cross-sectional 3.24 µg/m3, longitudinal 2.82 µg/m3). In both crude and adjusted models, we did not find a significant association between 3-year average PM2.5 and AD-PS scores at MRI-1. Similarly, nonsignificant associations were also observed with log-transformed AD-PS scores (table e-5 available from Dryad, doi.org/10.5061/dryad.xgxd254cq) and in the restricted sample of 712 women (table e-6 available from Dryad, doi.org/10.5061/dryad.xgxd254cq). However, in the longitudinal analyses, an IQR increment of PM2.5 was significantly associated with a 0.031 (β = 0.031, 95% CI 0.017–0.046) increase in standardized AD-PS scores in the crude model. In fully adjusted models accounting for age at MRI-1, race/ethnicity, region, income, education, employment status, alcohol use, smoking, physical activity, history of depression, prior hormone therapy use, BMI, high cholesterol, diabetes, hypertension, cardiovascular disease, and WHI hormone therapy intervention assignment, the effect estimate modestly decreased but remained statistically significant (β = 0.026, 95% CI 0.009–0.043; table 4, adjusted model 5). Our ad hoc Cox proportional hazards regression analysis revealed that this 0.026-unit increase in AD-PS scores associated with an IQR increase of PM2.5 would translate to a 24% (hazard ratio 1.24, 95% CI 1.14–1.34) increase in AD risk over a 5-year period after adjustment for sociodemographics, region, ICV, lifestyle factors, and clinical characteristics.
Table 4.
Multicovariate-adjusted GLM Analysis of Long-term Ambient Fine Particles on AD-PS Scores at MRI-1 and Changes in Standardized AD-PS Scores

Effect estimates were not sensitive to further adjustment for white matter lesion volume (table 4, adjusted model 6) or exclusion of 11 women with incident clinical stroke (β = 0.027, 95% CI 0.010–0.044). In our sensitivity analyses, we found that the positive associations of PM2.5 with changes in AD-PS scores were present even after further adjusting for AD-PS scores at baseline (table e-6 available from Dryad, doi.org/10.5061/dryad.xgxd254cq), applying inverse probability weights to account for possible biases resulting from selective participation in the study (table e-7 available from Dryad, doi.org/10.5061/dryad.xgxd254cq), or restricting to women with 3-year average PM2.5 exposure levels <12 μg/m3 (table e-8 available from Dryad, doi.org/10.5061/dryad.xgxd254cq). In addition, our findings remained even after our analytic sample was restricted to women who were cognitively normal before MRI-1 and over follow-up (tables e-9 and e-10 available from Dryad, doi.org/10.5061/dryad.xgxd254cq), indicating that the adverse effects of PM2.5 may be seen in the preclinical stage. In our analysis further adjusting for census track–level socioeconomic characteristics of residential neighborhood, the observed adverse PM2.5 effect on the increase in AD-PS score did not change (table e-11 available from Dryad, doi.org/10.5061/dryad.xgxd254cq).
In our longitudinal analyses examining whether the observed PM2.5 exposure effect differed by age or clinical characteristics (table e-12 available from Dryad, doi.org/10.5061/dryad.xgxd254cq), there were no statistically significant modifications by age (<76.84 vs ≥76.84 years), hypertension (yes vs no), high cholesterol (yes vs no), BMI (<30 vs ≥30 kg/m2), diabetes (yes vs no), cardiovascular disease (yes vs no), or white matter lesion volumes (≤0 vs >0).
Discussion
In this prospective study on older women without dementia at baseline, long-term exposure to ambient PM2.5 was associated with an increase in AD-PS score, which quantified the neuroanatomic risk for AD. The increased risk could not be explained by sociodemographic factors (age, geographic region, race/ethnicity, education, income, employment), ICV, lifestyle factors (smoking, alcohol, physical activity), clinical characteristics (history of depression, BMI, diabetes, high cholesterol, hypertension, cardiovascular diseases, hormone therapy), and 1 MRI measure of late-life cerebrovascular damage. We observed similar patterns of associations even among older women without the cardiovascular disease risk profiles that may accelerate brain aging. These associations were also observed at exposure levels below the current EPA regulatory standard for ambient PM2.5.
Our findings provide supporting evidence that the neurotoxicity of late-life exposure to PM2.5 contributes primarily to the progression in neuroanatomic risk of AD, not the development or initiation, as indicated by the lack of an association in cross-sectional analyses but a robust association in longitudinal analyses. Alternatively, it is possible that there is an association between PM2.5 and AD-PS scores at MRI-1 but that we were unable to capture this in our cross-sectional analyses. Perhaps we observed a statistically significant association between PM2.5 and changes in AD-PS scores only due to the statistical power and precision gained by having repeated measures of the study outcome, which is a known strength of longitudinal designs over cross-sectional designs. This longitudinal study investigated whether PM2.5 contributes to progressive gray matter atrophy in brain regions vulnerable to AD, as captured by the AD-PS score. Several cross-sectional studies have used neuroimaging data to explore the neurotoxic effects of PM2.5 on brain structure. Wilker et al.17 found that increased residential exposure to PM2.5 was associated with smaller total cerebral brain volumes. Using the WHIMS-MRI data, our region-of-interest analyses showed that living in locations with higher PM2.5 was associated with smaller total brain and white matter volumes.18 Using voxel-based morphometry, Casanova et al.24 reported cross-sectional associations between PM2.5 exposure and patterns of smaller gray matter primarily in the prefrontal cortex, with no significant associations in other regions (e.g., hippocampus; thalamus) affected in early AD. In the Atherosclerosis Risk in Communities study, there were only marginally significant associations between PM2.5 and smaller volumes of deep gray structures (thalamus, caudate, putamen, and pallidum).19 In addition to reproducing the negative associations between PM2.5 exposure and white matter volumes in the UK Biobank MRI cohort, investigators showed negative associations between PM2.5 and total gray matter and prefrontal cortical volumes but no association with thalamic volume.20–22 It is interesting to note that of 4 studies with region-of-interest analyses, only 1 study reported statistically significant associations between PM2.5 and hippocampal volume, which was constrained to the left side only.23 The defining neuropathologic signatures of AD include aggregation of phosphorylated tau in neurofibrillary tangles combined with β-amyloid plaque deposition. Tau aggregates first develop in the locus coeruleus and subsequently in the hippocampus and other regions of the neocortex, while β-amyloid deposits are first observed in the neocortex and then detected in increasingly caudal areas with disease progression.25 Therefore, several areas of the brain are affected in the early pathogenetic processes of AD, highlighting the need to look at the spatial distribution of brain atrophies rather than focusing on 1 region (i.e., hippocampus) as was done in these previous reports. Although progressive loss of tissue in the hippocampus is present at a higher rate in patients with AD, hippocampal atrophy is not specific to AD, or even dementia, because it is present in a variety of neuropsychiatric disorders and in healthy aging to some degree.46 In contrast, the validation of the AD-PS score was based on a clinically well-defined diagnosis of AD from the ADNI database; the use of the machine learning approach captured the spatial patterns of gray matter atrophy specific to an increased risk for AD.25,26
Our study results contribute to a better understanding of the underlying neuropathologic processes linking late-life exposure to ambient PM2.5 with brain aging, cognitive decline, and increased risk of dementia, including AD.1 Two major mechanistic pathways linking ambient air pollution to cognitive impairment and dementia have been hypothesized. The first mechanism proposes that exposure to high levels of PM2.5 increases cerebrovascular injuries and subsequent loss of brain tissues, linking air pollution to brain aging via this neurovascular pathway. The second argues for the direct neurotoxicity of PM2.5 on brain structure contributing to the neurodegenerative process of dementia.18 In our study, the adverse PM2.5 effects were robust even after further adjustment for white matter lesion volumes (proxy for cerebrovascular damage) or the exclusion of women with incident clinical stroke. Other published neuroimaging studies did not find strong evidence or consistent patterns of association between PM2.5 exposure and MRI-based measurements of late-life subclinical cerebrovascular disease to support this neurovascular pathway.17–19,47,48 Although based on cross-sectional data, collectively, these observations implied that cerebrovascular injuries measured in late life may not play a critical role for brain aging and increased risk of dementia associated with late-life exposure to PM2.5. Despite the robust association observed in this study, to fully investigate whether the neurodegenerative effects of late-life exposures to airborne particles may be contributed by or may be independent of cerebrovascular damage before or during late life, we call for future studies to replicate these results and to thoroughly explore other measures of cerebrovascular damage that may not be captured by white matter lesions and were not explored in our study (e.g., microbleeds, lacunar infarcts).
Our findings have important public health and regulatory implications. We showed that the putatively neurotoxic effect of PM2.5 was present even among healthy individuals without cognitive impairment or cardiovascular diseases, and the observed association between PM2.5 and AD-PS scores remained statistically significant when our analyses were restricted to concentrations below the EPA regulatory standard (table e-8 available from Dryad, doi.org/10.5061/dryad.xgxd254cq). Understanding the shape of the exposure-response curve has been critical for evaluating the public health impact of air pollution because current regulatory standards implicitly assume a threshold effect at 12 µg/m3. The majority of studies reporting increased dementia risk associated with PM2.5 were based on exposure levels that far exceeded the US regulatory standard,9,10,12,13,15,49 with concentrations reaching levels as high as 61.76 µg/m3 in 1 study. In WHIMS, we found that residing in places with PM2.5 concentrations >12 µg/m3 increased the risks for global cognitive decline by 81% and all-cause dementia by 92%.10 To date, only 1 study has reported an increase in dementia risk (54% per 0.88-µg/m3 increase in PM2.5) when the upper limit for the 5-year exposure period of PM2.5 (average 8.4 µg/m3, range ≈7.5–10 µg/m3) was below the US standard.50 Participants were drawn from a fairly homogeneous population of community-dwelling and institutionalized individuals residing in an urban district in Sweden, limiting the generalizability of these findings. Therefore, our study findings call for future studies using geographically diverse community-dwelling populations to determine whether long-term exposures to low levels of PM2.5 below the current regulatory standard still lead to increased AD risk in contemporary populations.
We recognize several limitations of our study. First, WHIMS neuroimaging data did not include PET scans, which are well established for measuring AD neuropathology in vivo.51 However, PET scans are not widely available in community samples, and the AD-PS score is a well-validated metric that has been shown to be associated with several AD risk factors and incident cognitive impairment.26,52 Second, although the PM2.5 exposures based on spatiotemporal interpolation were well cross-validated (average Pearson R2 = 0.70),10,41 nondifferential measurement errors in such estimates are unavoidable and would likely attenuate the observed associations. Third, nationwide PM2.5 monitoring data were unavailable before 1999 and WHI did not collect early-life residential location data, so we were unable to estimate PM2.5 exposures during the early-life or midlife periods. Air pollution levels have decreased over the past 2 decades, so it may be possible that early-life or midlife PM2.5 exposures could have greater adverse effects or initiate different neuropathologic processes (e.g., cerebrovascular damage before late life) that were not observed in our current study. However, our study findings are salient and particularly relevant to the increasing epidemiologic evidence for dementia risk associated with late-life exposures to PM2.5. Fourth, we focused only on regional PM2.5 and did not explore chemical constituencies (e.g., black carbon, inorganic secondary aerosols), other exposure sources (e.g., traffic emissions), or possible interactions with other pollutant mixtures.53 Fifth, although our sensitivity analyses suggest that cerebrovascular damage measured in late-life and stroke could not explain the observed adverse PM2.5 effects on AD-PS scores, it is important to note that our results did not rule out other measures of cerebrovascular damage that may not be captured by white matter lesions (e.g., microbleeds, lacunar infarcts). Although previously published air pollution neuroimaging studies have not provided strong evidence supporting the association between late-life air pollution and MRI-measured cerebrovascular damage,17–19,47,48 it is possible that PM2.5 exposures before late life could impart adverse effects that were missed in this study.31 Sixth, although an effort was made to account for the potential effects of differential dropout on parameter estimates by incorporating inverse probability weighting, it remains possible that selective participation may have biased our results. However, our weighted tables (tables e-13 and e-14 available from Dryad, doi.org/10.5061/dryad.xgxd254cq) demonstrate that our inverse probability weights resulted in cohort characteristics at MRI-2 that closely resembled those of the MRI-1 and WHI samples. Seventh, our sample size may have been too small to provide the statistical power needed to identify significant interactions between ambient air pollution and the clinical characteristics (table e-12 available from Dryad, doi.org/10.5061/dryad.xgxd254cq), so future studies are needed to repeat these analyses with larger sample sizes. Finally, our findings are not generalizable to men or younger populations.
This study also had several major strengths. First, we addressed a critical gap in current knowledge in a cost-efficient manner by leveraging existing data from a well-characterized and geographically diverse cohort of older women. Second, our analyses included 2 brain scans with enough time between each to allow the progression of neurodegeneration. In addition, we used a neuroanatomic brain MRI biomarker for increased risk of AD that captured the spatial patterns of gray matter atrophy specific to AD. Last, the comprehensive WHIMS data allowed us to control for potential confounding and other potential sources of biases.
This study provides the first supporting epidemiologic evidence that late-life exposure to ambient PM2.5 may increase the neuroanatomic risk of AD and may directly contribute to the neurodegenerative process of dementia independently of the neurovascular pathway. The adverse PM2.5 effect was present at low exposure levels below the US EPA regulatory standard and remained measurable in healthy older women without the high-risk cardiovascular profiles that may accelerate brain aging. Future studies using other AD biomarkers (e.g., PET scans, other MRI-based indices, CSF and blood-based biomarkers) in the preclinical stage are needed. If the adverse neurotoxic effects of PM2.5 are substantiated, the resulting knowledge should inform strategies for early interventions to target this modifiable environmental risk factor in the preclinical stage to prevent the neuropathologic cascade leading to the subsequent progression of AD.
Acknowledgment
The investigators appreciate Dr. Eric Whitsel from the University of North Carolina–Chapel Hill Gillings School of Global Public for assisting in postestimation data processing and delivering of pollution exposure data and neighborhood contextual data used in this study.
Glossary
- AD
Alzheimer disease
- ADNI
Alzheimer's Disease Neuroimaging Initiative
- AD-PS
AD pattern similarity
- BME
Bayesian Maximum Entropy
- BMI
body mass index
- CI
confidence interval
- CTM
chemical transport model
- EN-RLR
elastic net regularized logistic regression
- EPA
Environmental Protection Agency
- GLM
general linear model
- ICV
intracranial volume
- IQR
interquartile range
- PM2.5
particulate matter with aerodynamic diameters <2.5 µm
- WHIMS
Women's Health Initiative Memory Study
Appendix 1. Authors

Appendix 2. Coinvestigators

Study Funding
The results reported herein correspond to the specific aims of R21AG051113 to Drs. Casanova and Chen from the National Institute on Aging. This work is also supported by R01AG033078 (principal investigator [PI]: J.-C.C.), RF1AG054068 (PI: J.-C.C.), and P01AG055367. Research work of Drs. Younan and Chen is also supported by R01ES025888 and National Institutes of Environmental Health Sciences (5P30ES007048). Dr. Chui is supported by P50AG05142. Dr. Henderson is supported by P50AG047366. Dr. Resnick is supported by the Intramural Research Program, National Institute on Aging, NIH. The WHI programs are funded by the National Heart, Lung, and Blood Institute, NIH, US Department of Health and Human Services through contracts HHSN268201100046C, HHSN268201100001C, HHSN268201100002C, HHSN268201100003C, HHSN268201100004C, and HHSN271201100004C. For a list of all the investigators who have contributed to WHI science, please visit whi.org/researchers/Documents%20%20Write%20a%20Paper/WHI%20Investigator%20Long%20List.pdf. The WHIMS was funded as an ancillary study to the WHI by Wyeth Pharmaceuticals, Inc; Wake Forest University; the National Heart, Lung, and Blood Institute, NIH; and the National Institute of Aging, NIH (contract HHSN271-2011-00004C). The WHIMS-MRI was funded by contract N01-WH-44221 from the National Heart, Lung, and Blood Institute.
Disclosure
The authors report no disclosures relevant to the manuscript. Go to Neurology.org/N for full disclosures.
References
- 1.The Lancet Neurology. Air pollution and brain health: an emerging issue. Lancet Neurol 2018;17:103. [DOI] [PubMed] [Google Scholar]
- 2.Cipriani G, Danti S, Carlesi C, Borin G. Danger in the air: air pollution and cognitive dysfunction. Am J Alzheimers Dis Other Demen 2018;33:333–341. [DOI] [PMC free article] [PubMed] [Google Scholar]
- 3.Dimakakou E, Johnston HJ, Streftaris G, Cherrie JW. Exposure to environmental and occupational particulate air pollution as a potential contributor to neurodegeneration and diabetes: a systematic review of epidemiological research. Int J Environ Res Public Health 2018;15:1704. [DOI] [PMC free article] [PubMed] [Google Scholar]
- 4.Kilian J, Kitazawa M. The emerging risk of exposure to air pollution on cognitive decline and Alzheimer's disease: evidence from epidemiological and animal studies. Biomed J 2018;41:141–162. [DOI] [PMC free article] [PubMed] [Google Scholar]
- 5.Béjot Y, Reis J, Giroud M, Feigin V. A review of epidemiological research on stroke and dementia and exposure to air pollution. Int J Stroke 2018;13:687–695. [DOI] [PubMed] [Google Scholar]
- 6.Fu P, Guo X, Cheung FMH, Yung KKL. The association between PM 2.5 exposure and neurological disorders: a systematic review and meta-analysis. Sci Total Environ 2019;655:1240–1248. [DOI] [PubMed] [Google Scholar]
- 7.Peters R, Ee N, Peters J, Booth A, Mudway I, Anstey KJ. Air pollution and dementia: a systematic review. J Alzheimers Dis 2019;70:S145–S163. [DOI] [PMC free article] [PubMed] [Google Scholar]
- 8.Wu YC, Lin YC, Yu HL, et al. Association between air pollutants and dementia risk in the elderly. Alzheimers Dement (Amst) 2015;1:220–228. [DOI] [PMC free article] [PubMed] [Google Scholar]
- 9.Jung CR, Lin YT, Hwang BF. Ozone, particulate matter, and newly diagnosed Alzheimer's disease: a population-based cohort study in Taiwan. J Alzheimers Dis 2015;44:573–584. [DOI] [PubMed] [Google Scholar]
- 10.Cacciottolo M, Wang X, Driscoll I, et al. Particulate air pollutants, APOE alleles and their contributions to cognitive impairment in older women and to amyloidogenesis in experimental models. Transl Psychiatry 2017;7:e1022. [DOI] [PMC free article] [PubMed] [Google Scholar]
- 11.Kioumourtzoglou MA, Schwartz JD, Weisskopf MG, et al. Long-term PM2.5 exposure and neurological hospital admissions in the northeastern United States. Environ Health Perspect 2016;124:23–29. [DOI] [PMC free article] [PubMed] [Google Scholar]
- 12.Chen H, Kwong JC, Copes R, et al. Exposure to ambient air pollution and the incidence of dementia: a population-based cohort study. Environ Int 2017;108:271–277. [DOI] [PubMed] [Google Scholar]
- 13.Chen H, Kwong JC, Copes R, et al. Living near major roads and the incidence of dementia, Parkinson's disease, and multiple sclerosis: a population-based cohort study. Lancet 2017;389:718–726. [DOI] [PubMed] [Google Scholar]
- 14.Oudin A, Segersson D, Adolfsson R, Forsberg B. Association between air pollution from residential wood burning and dementia incidence in a longitudinal study in Northern Sweden. PLoS One 2018;13:e0198283. [DOI] [PMC free article] [PubMed] [Google Scholar]
- 15.Carey IM, Anderson HR, Atkinson RW, et al. Are noise and air pollution related to the incidence of dementia? A cohort study in London, England. BMJ Open 2018;8:e022404. [DOI] [PMC free article] [PubMed] [Google Scholar]
- 16.Raz L, Knoefel J, Bhaskar K. The neuropathology and cerebrovascular mechanisms of dementia. J Cereb Blood Flow Metab 2016;36:172–186. [DOI] [PMC free article] [PubMed] [Google Scholar]
- 17.Wilker EH, Preis SR, Beiser AS, et al. Long-term exposure to fine particulate matter, residential proximity to major roads and measures of brain structure. Stroke 2015;46:1161–1166. [DOI] [PMC free article] [PubMed] [Google Scholar]
- 18.Chen JC, Wang X, Wellenius GA, et al. Ambient air pollution and neurotoxicity on brain structure: evidence from Women's Health Initiative Memory Study. Ann Neurol 2015;78:466–476. [DOI] [PMC free article] [PubMed] [Google Scholar]
- 19.Power MC, Lamichhane AP, Liao D, et al. The association of long-term exposure to particulate matter air pollution with brain MRI findings: the ARIC study. Environ Health Perspect 2018;126:027009. [DOI] [PMC free article] [PubMed] [Google Scholar]
- 20.Gale SD, Erickson LD, Anderson JE, Brown BL, Hedges DW. Association between exposure to air pollution and prefrontal cortical volume in adults: a cross-sectional study from the UK biobank. Environ Res 2020;185:109365. [DOI] [PubMed] [Google Scholar]
- 21.Hedges DW, Erickson LD, Gale SD, Anderson JE, Brown BL. Association between exposure to air pollution and thalamus volume in adults: a cross-sectional study. PLoS One 2020;15:e0230829. [DOI] [PMC free article] [PubMed] [Google Scholar]
- 22.Erickson LD, Gale SD, Anderson JE, Brown BL, Hedges DW. Association between exposure to air pollution and total gray matter and total white matter volumes in adults: a cross-sectional study. Brain Sci 2020;10:164. [DOI] [PMC free article] [PubMed] [Google Scholar]
- 23.Hedges DW, Erickson LD, Kunzelman J, Brown BL, Gale SD. Association between exposure to air pollution and hippocampal volume in adults in the UK Biobank. Neurotoxicology 2019;74:108–120. [DOI] [PubMed] [Google Scholar]
- 24.Casanova R, Wang X, Reyes J, et al. A voxel-based morphometry study reveals local brain structural alterations associated with ambient fine particles in older women. Front Hum Neurosci 2016;10:495. [DOI] [PMC free article] [PubMed] [Google Scholar]
- 25.Brettschneider J, Del Tredici K, Lee VM, Trojanowski JQ. Spreading of pathology in neurodegenerative diseases: a focus on human studies. Nat Rev Neurosci 2015;16:109–120. [DOI] [PMC free article] [PubMed] [Google Scholar]
- 26.Casanova R, Barnard RT, Gaussoin SA, et al. Using high-dimensional machine learning methods to estimate an anatomical risk factor for Alzheimer's disease across imaging databases. Neuroimage 2018;183:401–411. [DOI] [PMC free article] [PubMed] [Google Scholar]
- 27.Shumaker SA, Legault C, Rapp SR, et al. Estrogen plus progestin and the incidence of dementia and mild cognitive impairment in postmenopausal women: the Women's Health Initiative Memory Study: a randomized controlled trial. JAMA 2003;289:2651–2662. [DOI] [PubMed] [Google Scholar]
- 28.Shumaker SA, Legault C, Kuller L, et al. Conjugated equine estrogens and incidence of probable dementia and mild cognitive impairment in postmenopausal women: Women's Health Initiative Memory Study. JAMA 2004;291:2947–2958. [DOI] [PubMed] [Google Scholar]
- 29.Coker LH, Hogan PE, Bryan NR, et al. Postmenopausal hormone therapy and subclinical cerebrovascular disease: the WHIMS-MRI Study. Neurology 2009;72:125–134. [DOI] [PMC free article] [PubMed] [Google Scholar]
- 30.Resnick SM, Espeland MA, Jaramillo SA, et al. Postmenopausal hormone therapy and regional brain volumes: the WHIMS-MRI Study. Neurology 2009;72:135–142. [DOI] [PMC free article] [PubMed] [Google Scholar]
- 31.Younan D, Petkus AJ, Widaman KF, et al. Particulate matter and episodic memory decline mediated by early neuroanatomic biomarkers of Alzheimer's disease. Brain 2020;143:289–302. [DOI] [PMC free article] [PubMed] [Google Scholar]
- 32.Lao Z, Shen D, Liu D, et al. Computer-assisted segmentation of white matter lesions in 3D MR images using support vector machine. Acad Radiol 2008;15:300–313. [DOI] [PMC free article] [PubMed] [Google Scholar]
- 33.Zacharaki EI, Kanterakis S, Bryan RN, Davatzikos C. Measuring brain lesion progression with a supervised tissue classification system. Med Image Comput Assist Interv 2008;11:620–627. [DOI] [PubMed] [Google Scholar]
- 34.Tustison NJ, Cook PA, Klein A, et al. Large-scale evaluation of ANTs and FreeSurfer cortical thickness measurements. Neuroimage 2014;99:166–179. [DOI] [PubMed] [Google Scholar]
- 35.Friedman J, Hastie T, Tibshirani R. Regularization paths for generalized linear models via coordinate descent. J Stat Softw 2010;33:1–22. [PMC free article] [PubMed] [Google Scholar]
- 36.Espeland MA, Chen JC, Weitlauf J, et al. Trajectories of relative performance with 2 measures of global cognitive function. J Am Geriatr Soc 2018;66:1575–1580. [DOI] [PMC free article] [PubMed] [Google Scholar]
- 37.Whitsel EA, Rose KM, Wood JL, Henley AC, Liao D, Heiss G. Accuracy and repeatability of commercial geocoding. Am J Epidemiol 2004;160:1023–1029. [DOI] [PubMed] [Google Scholar]
- 38.Christakos G. Modern Spatiotemporal Geostatistics.Oxford: Oxford University Press; 2000. [Google Scholar]
- 39.Christakos G, Bogaert P, Serre M. Temporal GIS: Advanced Functions for Field-Based Applications. Berlin: Springer Science & Business Media, 2012. [Google Scholar]
- 40.Xu Y, Serre ML, Reyes J, Vizuete W. Bayesian Maximum Entropy integration of ozone observations and model predictions: a national application. Environ Sci Technol 2016;50:4393–4400. [DOI] [PubMed] [Google Scholar]
- 41.Reyes JM, Xu Y, Vizuete W, Serre ML. Regionalized PM2.5 Community Multiscale Air Quality model performance evaluation across a continuous spatiotemporal domain. Atmos Environ (1994) 2017;148:258–265. [DOI] [PMC free article] [PubMed] [Google Scholar]
- 42.Heckbert SR, Kooperberg C, Safford MM, et al. Comparison of self-report, hospital discharge codes, and adjudication of cardiovascular events in the Women's Health Initiative. Am J Epidemiol 2004;160:1152–1158. [DOI] [PubMed] [Google Scholar]
- 43.Margolis KL, Lihong Qi, Brzyski R, et al. Validity of diabetes self-reports in the Women's Health Initiative: comparison with medication inventories and fasting glucose measurements. Clin Trials 2008;5:240–247. [DOI] [PMC free article] [PubMed] [Google Scholar]
- 44.Johnson-Kozlow M, Rock CL, Gilpin EA, Hollenbach KA, Pierce JP. Validation of the WHI brief physical activity questionnaire among women diagnosed with breast cancer. Am J Health Behav 2007;31:193–202. [DOI] [PubMed] [Google Scholar]
- 45.Qi L, Nassir R, Kosoy R, et al. Relationship between diabetes risk and admixture in postmenopausal African-American and Hispanic-American women. Diabetologia 2012;55:1329–1337. [DOI] [PMC free article] [PubMed] [Google Scholar]
- 46.Frisoni GB, Fox NC, Jack CR, Scheltens P, Thompson PM. The clinical use of structural MRI in Alzheimer disease. Nat Rev Neurol 2010;6:67–77. [DOI] [PMC free article] [PubMed] [Google Scholar]
- 47.Kulick ER, Wellenius GA, Kaufman JD, et al. Long-term exposure to ambient air pollution and subclinical cerebrovascular disease in NOMAS (the Northern Manhattan Study). Stroke 2017;48:1966–1968. [DOI] [PMC free article] [PubMed] [Google Scholar]
- 48.Wilker EH, Martinez-Ramirez S, Kloog I, et al. Fine particulate matter, residential proximity to major roads, and markers of small vessel disease in a memory study population. J Alzheimers Dis 2016;53:1315–1323. [DOI] [PMC free article] [PubMed] [Google Scholar]
- 49.Lee M, Schwartz J, Wang Y, Dominici F, Zanobetti A. Long-term effect of fine particulate matter on hospitalization with dementia. Environ Pollut 2019;254:112926. [DOI] [PMC free article] [PubMed] [Google Scholar]
- 50.Grande G, Ljungman PLS, Eneroth K, Bellander T, Rizzuto D. Association between cardiovascular disease and long-term exposure to air pollution with the risk of dementia. JAMA Neurol 2020;77:801–809. [DOI] [PMC free article] [PubMed] [Google Scholar]
- 51.Berti V, Pupi A, Mosconi L. PET/CT in diagnosis of dementia. Ann NY Acad Sci 2011;1228:81–92. [DOI] [PMC free article] [PubMed] [Google Scholar]
- 52.Casanova R, Hsu FC, Sink KM, et al. Alzheimer's disease risk assessment using large-scale machine learning methods. PLoS One 2013;8:e77949. [DOI] [PMC free article] [PubMed] [Google Scholar]
- 53.Petkus AJ, Younan D, Widaman K, et al. Exposure to fine particulate matter and temporal dynamics of episodic memory and depressive symptoms in older women. Environ Int 2020;135:105196. [DOI] [PMC free article] [PubMed] [Google Scholar]
Associated Data
This section collects any data citations, data availability statements, or supplementary materials included in this article.
Data Availability Statement
The data used in this study may be made available following WHI policies.