

Abstract
Purpose
Recent evidence supports a key role of gut microbiome in brain health. We conducted a pilot study to assess associations of gut microbiome with cancer-related fatigue and explore the associations with DNA methylation changes.
Methods
Self-reported Multidimensional Fatigue Inventory and stool samples were collected at pre-radiotherapy and one-month post-radiotherapy in patients with head and neck cancer. Gut microbiome data were obtained by sequencing the 16S ribosomal ribonucleic acid gene. DNA methylation changes in the blood were assessed using Illumina Methylation EPIC BeadChip.
Results
We observed significantly different gut microbiota patterns among patients with high vs. low fatigue across time. This pattern was characterized by low relative abundance in short-chain fatty acid—producing taxa (family Ruminococcaceae, genera Subdoligranulum and Faecalibacterium, all p < 0.05), with high abundance in taxa associated with inflammation (genera Family XIII AD3011 and Erysipelatoclostridium; all p < 0.05) for high-fatigue group. We identified nine KEGG Orthology pathways significantly different between high- vs. low-fatigue groups over time (all p < 0.001), including pathways related to fatty acid synthesis and oxidation, inflammation, and brain function. Gene set enrichment analysis (GSEA) was performed on the top differentially methylated CpG sites that were associated with the taxa and fatigue. All biological processes from the GSEA were related to immune responses and inflammation (FDR < 0.05).
Conclusions
Our results suggest different patterns of the gut microbiota in cancer patients with high vs. low fatigue. Results from functional pathways and DNA methylation analyses indicate that inflammation is likely to be the major driver in the gut-brain axis for cancer-related fatigue.
Keywords: Fatigue, Cancer, Gut microbiome, Epigenetic changes
Introduction
Fatigue is the most common side effect of cancer and its treatment [1], including in patients with head and neck cancer (HNC) [2, 3]. High levels of fatigue are predictive of poor quality of life and lower survival across different cancer diagnoses and treatment modalities [2, 3]. Unfortunately, the mechanisms of fatigue are not fully understood, which may explain in part that no pharmacological agent can reliably prevent or treat this debilitating symptom. Evidence from our group and other has suggested a consistent connection between inflammation and fatigue [4, 5]. Although cancer and its treatment induce inflammation and consequently lead to fatigue, our data have also suggested that the association between inflammation and fatigue is independent of treatment [4]. This independent effect indicates that other factors may contribute to inflammation and subsequently fatigue in cancer populations.
Recent evidence on the associations between the gut microbiome and brain has uncovered a new approach to research possible mechanisms of cancer-related fatigue. Gut microbiome impacts human brain in multiple ways, particularly through immune and inflammatory responses [6]. For instance, structural bacterial components such as lipopolysac-charides (LPS) stimulate the innate immune system, which produces systemic and/or central nervous system inflammation [7], while butyrate, a short-chain fatty acid (SCFA) produced by microbiota, improves inflammation including neuroinflammation [8]. Alterations in the gut microbiome have been implicated in the pathogenesis of various neuropsychological disorders, such as chronic fatigue syndrome [9], depression [10], and cognition dysfunction [11]. However, data are sparse and inconclusive, particularly for cancer-related fatigue.
Moreover, the mechanisms of gut microbiome’s impact on human health are not fully understood, which may further challenge finding a safe and healthy microbiome-based intervention. It is increasingly appreciated that the microbiome influences the host’s health state through epigenetic modifications [12, 13]. Epigenomic modifications are central mechanisms involved in directing transcriptional response to environmental cues such as the gut microbiome, and thus represent a potentially significant interface by which the microbiota can dynamically interact with the host genome and health. Studies have found that epigenetic modifications such as DNA methylation status are associated with gut microbiota composition [14, 15]. By-products of microbiota such as folate and butyrate either directly bring DNA methylation changes [16] or indirectly act via activation or inhibition of relevant enzymes [17]. These modifications have been linked to human health [14] and disease such as obesity [15]; however, more studies are needed.
In this pilot study among patients with HNC receiving active cancer treatment, we explored whether the gut microbiome is associated with cancer-related fatigue and whether inflammation-related DNA methylation changes play a key role in this association.
Material and methods
This study was a pilot investigation with a longitudinal, prospective design with questionnaire and biosample data collection at both pre- and 1-month post-radiation therapy (RT). Patients were recruited at the Oncology Clinics of Emory Winship Cancer Institute. The study was approved by Emory Institutional Review Board, and all enrolled patients provided informed consents.
Participant population
Eligible patients were enrolled into the study with the following inclusion criteria: histological proof of squamous cell carcinoma of head and neck region; clinical stage T1–4, any N with no distant metastasis; ≥21 years of age; and having adequate major organ functions. Main exclusion criteria were simultaneous primaries; previous invasive malignancies less than 3 years; pregnant women; patients with major psychiatric disorders or those who cannot understand English; and chronic medical conditions involving the immune system (e.g., HIV, hepatitis B or C) or regular use of immunosuppressive medications (such as glucocorticoids and methotrexate).
Social behavioral measures
Demographics and clinical information were collected at baseline or follow-up as appropriate, and included age, sex, race, marital status, history of smoking and alcohol use, body mass index (BMI), antibiotic usage (yes vs. no), comorbidities, primary cancer site, cancer stage (TNM), radiation dose, cancer treatment, and human papillomavirus (HPV) status. These variables were chosen for their potential influence on fatigue and the gut microbiome, based on literature reviews and our previous studies [18, 19].
Fatigue was measured using the Multidimensional Fatigue Inventory (MFI)-20 at pre- and 1-month post-RT. MFI is a self-report instrument with a total of 20 items covering five dimensions: general fatigue, physical fatigue, mental fatigue, reduced motivation, and reduced activity [20]. The sum of the 20 items is the total score, ranging from 20 to 100 with a higher score suggesting more fatigue. The MFI-20 has well-established validity and reliability in use with patients with cancer receiving RT [4]. Additionally, fatigue was categorized using mean into low- vs. high-fatigue groups across time for the comparison for gut microbiome.
Laboratory measures
Stool samples were collected at pre- and post-RT by patients using a standardized protocol adopted from the NIH Human Microbiome Project (HMP) guideline [21] before the clinical visits (baseline and follow-up). On the day of the clinical visits, patients delivered the frozen stool samples to our research staff according to the protocol, and the samples then were stored at −80 °C until assayed for DNA extraction for gut microbiome analysis.
Whole blood was collected into EDTA tubes for the isolation of buffy coats at pre- and post-RT. Buffy coats were separated by centrifugation at 1000×g for 10 min at 4 °C, and then aliquoted into siliconized polypropylene tubes and stored at −80 °C until DNA extraction for methylation.
Gut microbiome
DNA was extracted from baseline and follow-up visit stool samples using the PowerSoil isolation Kit (MO BIO Laboratories, Carlsbad, CA, USA) in line with the HMP Standard Operating Protocol. Gut microbiome composition and specific bacterial abundances were determined through bacterial 16S rRNA gene sequencing with amplification of the hyper-variable V3-V4 gene regions. 16S libraries were prepped from 12.5 ng of DNA using the 16S Metagenomic Sequencing Library Preparation workflow. Briefly, 16S amplicons were generated using KAPA HiFi HotStart ReadyMix (KAPA Biosystems, KK2600) and primers specific to the 16S region. PCR cleanup was performed using AMPure XP beads (Beckman, A63880) and indices were attached using the Nextera XT Index kit (Illumina, FC-131-1001). Cleanup was performed on the indexed libraries using AMPure XP beads. 16S libraries were pooled in equal amounts based on fluorescence quantification. Final library pools were quantitated via qPCR (Kapa Biosystems, catalog KK4824). The pooled library was sequenced on an Illumina miSeq using miSeq v3 600 cycles chemistry (Illumina, catalog MS-102-3003) at a loading density of 8 pM with 20% PhiX, at PE300 reads. The Emory Integrated Genomics Core performed the assays.
Genome-wide DNA methylation
DNA was isolated from buffy coat using the QIAamp DNA mini kit (Qiagen) or the Mag-Bind Blood and Tissue DNA HDQ 96 Kit (Omega). DNA quantification was determined using the Quant-iT dsDNA broad range assay kit (Thermo Fisher). DNA quality was assessed on a 2% agarose gel. DNA of greater concentration than 20 μg/ml was used for methylation analysis using MethylationEPIC BeadChip (Illumina) at the EIGC. Preparation of DNA for the array was performed according to the Illumina Infinium HD Assay Methylation Protocol Guide. Briefly, bisulfite conversion of 500 ng of DNA was performed using the EZ-96 DNA Methylation Kit (Zymo). This was followed by amplification of the bisulfite converted DNA, fragmentation, precipitation, DNA resuspension, and hybridization of the DNA to the BeadChip. Finally, BeadChips were imaged on an Illumina HiScan System.
Data processing and statistical analyses
Descriptive statistics using percentage or mean with a standard deviation were performed for demographic and clinical variables.
Gut microbiome
Sequence reads were demultiplexed and paired-end reads. High-quality sequence reads were then processed using DADA2 [22] algorithm to infer exact amplicon sequence variants (ASVs) and to correct amplicon sequence errors and filter the chimeric sequences, and subsequently assigned taxonomy using the pre-trained classifier on the Silva [23] reference databases. We derived a phylogenetic tree and further measured the composition of gut microbiome through QIIME 2 [24, 25].
A total of 26 stool samples from 13 patients at the two time points were used for high-throughput sequencing of bacterial 16S rRNA. The median sequence account per sample was 252,382 ranging from 204,113 to 976,098. The sequence data were analyzed using DADA2 and were trimmed at 20–275 to obtain high-quality sequences. An average 152,235±83,343 high-quality sequences per sample were retained after quality control. Rarefaction was performed at 7500 reads, and taxonomy was assigned using a Naïve Bayes classifier on Silva [23] reference databases with a 99% identify threshold.
Alpha-diversity was calculated using standardized estimates: observed operational taxonomic units (OTUs), Chao-1, Shannon’s index, Faith’s Phylogenetic Diversity (Faith_PD), and Pielou’s Evenness (Pielou_e). Spearman correlational analysis was conducted to analyze alpha-diversity estimates for fatigue at each time point. The Bray-Curtis, Jaccard, unweighted and weighted UniFrac distance metrics, and principal coordinates analysis (PCoA) were used to visualize patterns of beta-diversity. The 3D PCoA was performed by the Emperor tool [26]. Distance matrices were used to conduct permutational multivariate analysis of variance (PERMANOVA) and multivariate nonparametric analysis of dissimilarities (ADONIS) in QIIME 2. The longitudinal impact of time on the gut microbiome diversity and its association with fatigue levels was analyzed by generalized estimating equation (GEE) models. These analyses were performed using the QIIME 2 [25], R version 3.3.3, and SAS 9.4.
Functional profiles of 16S rRNA data were inferred using Tax4Fun, an open-source R package [27]. The output from the QIIME with a SILVA database extension was used for this analysis. Tax4Fun can survey the functional genes of bacterial communities based on the 16S rRNA sequencing data and provide a good approximation to the gene profiles obtained from metagenomic shotgun sequencing methods. The Kyoto Encyclopedia of Genes and Genomes (KEGG) pathways from Tax4Fun using the species levels were further analyzed using GEE models to assess the differences between high- vs. low- fatigue groups over time (SAS 9.4).
Differences in relative abundances of bacterial taxa between high- vs. low-fatigue groups were identified using the linear discriminant analysis effect size (LEfSe) method, which emphasizes both statistical significance and biological relevance [28]. The LEfSe uses the nonparametric Kruskal-Wallis test to detect features that have significantly different abundances between study groups. Then, linear discriminant analysis (LDA) was performed to estimate the effect size of each feature (p < 0.05 and LDA score/effect size threshold = 2). Time was considered as a subclass in the LEfSe for the analysis.
Genome-wide DNA methylation
DNA methylation data were preprocessed and quantile normalized with R package minfi [29]. We filtered probes according to the following criteria: probes with detection p value larger than 0.01 in more than 2 samples; probes with SNPs at CpG site; probes on the sex chromosomes; and cross-reactive probes [30]. The methylation data quality for each sample was checked by median of the methylation and unmethylation signal for each sample (removing samples with median < 10.5); consistency between predicted sex from methylation data and sex in our record; outliers in principal component analysis and clustering; beta value distribution of probes in each sample; and percentage of probes with detection p value larger than 0.01 (removing samples with percentage > 1%).
Taxa significantly different between the high- vs. low-fatigue groups over time identified by the LEfSe were used to examine their associations with DNA methylation. Paired regression models were fitted on β values to test methylation sites that changed significantly from pre- to 1-month post-RT for association with the identified taxa using the LEfSe. The regression analysis was performed with R package limma [31]. Gene set enrichment analysis (GSEA) using Gene Ontology (GO) was subsequently performed on the top differentially methylated CpG sites that were associated with the taxa. The number of CpG sites per gene was accounted to avoid bias during the analysis [32]. The GSEA was performed with R package missMethyl [33].
Results
Baseline characteristics of study participants
The study enrolled 13 eligible patients with an average age of 60 years, and majority being men, white, and married (Table 1). Approximately 70% had a history of alcohol use and 77% had a history of smoking. About half of them were diagnosed with oropharyngeal cancer and 54% were HPV-related HNCs. Fifty-four percent had chemoradiation and 62% had surgery. Only one patient used antibiotics at baseline and another patient used antibiotics at the follow-up. None of the baseline characteristics was statistically significantly different between low vs. high fatigue, except for the mean fatigue p = 0.006).
Table 1.
Baseline demographic and clinical characteristics of the pilot study participants (N = 13)
| Characteristic | Total (N = 13) Mean ± SD or N (%) |
Fatigue group** Mean ± SD or N (%) |
|
|---|---|---|---|
| Low (N = 6) | High (N = 7) | ||
| Age (years) | 60 ± 10 | 59 ± 10 | 61 ±10 |
| Men | 11 (85) | 5 (83) | 6 (86) |
| White | 11 (85) | 6 (100) | 5 (71) |
| Alcohol intake, drinks/week | |||
| < 1 | 04 (31) | 2 (33) | 2 (29) |
| ≥1 | 09 (69) | 4 (67) | 5 (71) |
| Tobacco smoking | |||
| Ever | 10 (77) | 4 (67) | 6 (86) |
| Never | 03 (23) | 3 (33) | 1 (14) |
| Married | 08 (62) | 4 (67) | 4 (57) |
| BMI (kg/m2) | 26 ± 5 | 26 ± 3 | 26 ± 6 |
| Cancer site | |||
| Oropharynx | 06 (46) | 4 (67) | 2 (29) |
| Non-oropharynx | 07 (54) | 2 (33) | 5 (71) |
| HPV status | |||
| Unrelated/unknown | 06 (46) | 2 (33) | 4 (57) |
| Related | 07 (54) | 4 (67) | 3 (43) |
| Cancer stage | |||
| II | 02 (15) | 2 (33) | 0 (0) |
| III | 03 (23) | 1 (17) | 2 (29) |
| IV | 08 (62) | 3 (50) | 5 (71) |
| Cancer treatment | |||
| Radiation and surgery | 06 (46) | 3 (50) | 3 (43) |
| Radiation and chemotherapy | 05 (38) | 2 (33) | 3 (43) |
| Radiation, chemotherapy, and surgery | 02 (16) | 1 (17) | 1 (14) |
| Surgery, yes | 08 (62) | 4 (67) | 4 (57) |
| Chemotherapy, yes | 07 (54) | 3 (50) | 7 (57) |
| Chemotherapy drug | |||
| Cisplatin | 05 (72) | 3 (100) | 2 (50) |
| Carboplatin/paclitaxel | 01 (14) | 0 (0) | 1 (25) |
| Other | 01 (14) | 0 (0) | 1 (25) |
| RT dose (Gy) | 65 ± 5 | 65 ± 6 | 65 ± 5 |
| Tube feeding*, yes | 05 (45) | 1 (20) | 4 (67) |
| Antibiotic use*, yes | 01 (9) | 0 (0) | 1 (100) |
| Anti-inflammatory drug use*, yes | 04 (36) | 1 (25) | 3 (75) |
| Fatigue score | 55 ± 20 | 41 ± 14 | 68 ± 14 |
None of the baseline characteristics statistically significantly differ between low vs. high fatigue was significant, except for the mean fatigue (p = 0.006) BMI body mass index, HPV human papillomavirus, RT radiation therapy, SD standard deviation
Have missing data: tube feeding N = 2; antibiotics N = 2; anti-inflammatory drug use N = 2
Dichotomized using mean among all study participants
Diversity analysis
For the primary continuous variable fatigue, higher fatigue was associated with decreased gut microbiome Pielou_e over time using the GEE model (p = 0.014). Fatigue was not associated with other alpha-diversity metrics. The beta-diversity-weighted distance showed a trend of significant dissimilarities between low vs. high fatigue based on the ADONIS (p = 0.066) and PERMANOVA (p = 0.079) analyses (Fig. 1). No significant difference was found based on Bray-Curtis distance between low- and high-fatigue levels or beta-diversity.
Fig. 1.

The beta-diversity-weighted distance between low- vs. high-fatigue groups based on the permutational multivariate analysis of variance (PERMANOVA)
Additionally, diversity analyses were performed for major demographic and clinical variables. Patients with alcohol use (Shannon: H = 4.938, P = 0.026; evenness: H = 5.707, P = 0.017) and no feeding tubes (Shannon: H = 2.939, P = 0.086; evenness: H = 3.913, P = 0.048) showed a significantly higher diversity in Shannon and evenness compared these without use of alcohol, and with feeding tubes.
Relative abundance analysis
At baseline (pre-RT), the phyla Bacteroidetes (43.3%) and Firmicutes (43.0%) were predominant across all patients, followed by Verrucomicrobia (5.8%) and Proteobacteria (5.4%). Similarly, at post-RT, the phyla Bacteroidetes (41.9%) and Firmicutes (40.6%) were still predominant, and followed by Verrucomicrobia (9.3%) and Actinobacteria (4.2%). No taxa at the phylum level were different from the pre- to post-RT using Mann-Whitney U test.
Results from the LEfSe analyses (Fig. 2) showed that Firmicutes were less abundant in patients with high-fatigue level, which was further reflected in less abundance in family Ruminococcaceae, genus Subdoligranulum, genus Faecalibacterium, and species uncultured Firmicutes bacterium. Additionally, less abundance of Firmicutes in high-fatigue patients was shown in genus Agathobacter, genus Lactococcus, and species Ruminococcus sp. N15.MGS-57. Genus Bifidobacterium and specifies Desulfovibrio fairfieldensis were also less abundant in the high-fatigue group compared to the low-fatigue group. Both the cladogram and LDA bar graphs in Fig. 2 demonstrated a similar pattern that Firmicutes and subsequent levels such as Ruminococcaceae were more abundant in the low-fatigue group than the high-fatigue group. The LEfSe results also showed that [Eubacterium] fissicatena group, Erysipelatoclostridium, and Family XIII AD3011 group at genus level were more abundant in the high-fatigue than the low-fatigue group. These LEfSe analyses considered time a subclass; similar findings were observed when time was not considered a sub-class. Additionally, a trend of increased Bacteroidetes/Firmicutes ratio in the high-fatigue group was observed (1.57 vs. 0.72;p = 0.051) at pre-RT, compared to the low-fatigue group.
Fig. 2.
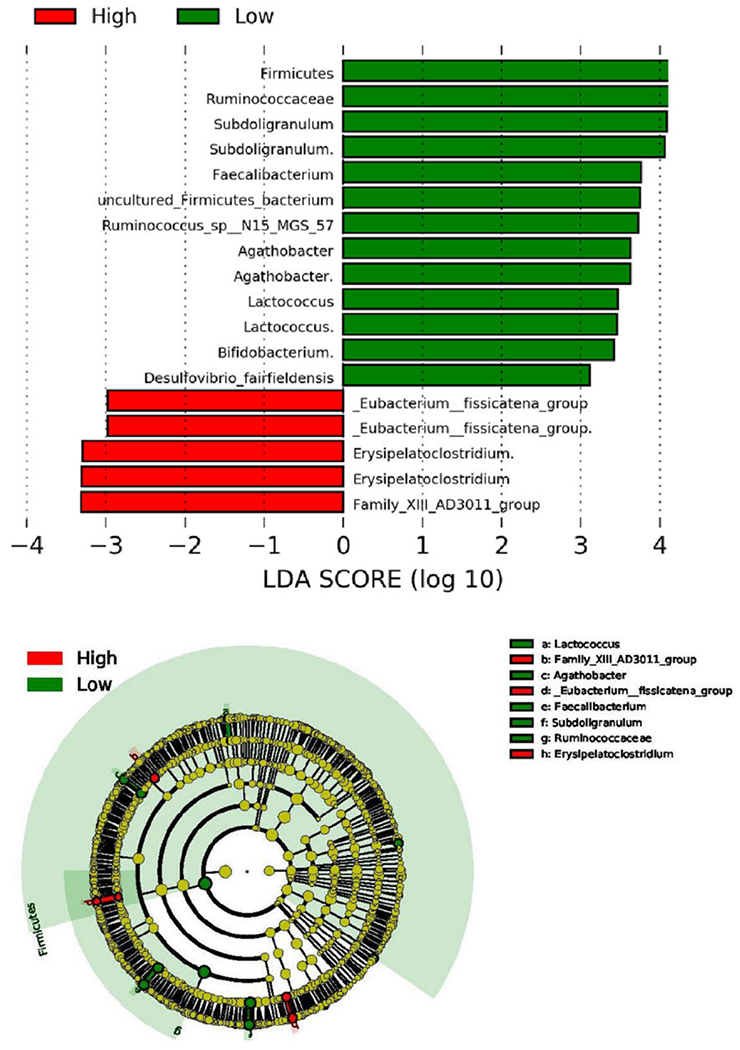
Comparison between high- vs. low-fatigue groups over time using linear discriminant analysis effect size (LEfSe). LDA = linear discriminant analysis. Taxa ended with a “.” indicate an unidentified species of that genus
Functional gene enrichment analysis
Tax4Fun was used to predict the functional profiles of intestinal bacteria. In total, abundances of 280 unique KEGG Orthology (KO) pathways were predicted in our data. Nine KO pathways were significantly different between high- vs. low-fatigue groups over time (p< 0.0005; Table 2). Most of these pathways were related to fatty acid synthesis and oxidation (citrate, riboflavin), inflammation (MAPK), and brain function (long-term potentiation and tyrosine metabolism).
Table 2.
Predicted Kyoto Encyclopedia of Genes and Genomes (KEGG) pathways with a significant different relative abundance between high- vs. low-fatigue groups (p < 0.0005)
| KEGG orthology (KO) pathways | Pre |
Post |
P | ||
|---|---|---|---|---|---|
| Low fatigue | High fatigue | Low fatigue | High fatigue | ||
| ko04011: MAPK signaling pathway | 3.83 × 10⁻⁴ | 4.11 × 10⁻⁴ | 4.16 × 10⁻⁴ | 4.19 × 10⁻⁴ | 0.0005 |
| ko00020: citrate cycle TCA cycle | 4.70 × 10⁻³ | 5.17 × 10⁻³ | 4.84 × 10⁻³ | 5.39 × 10⁻³ | 0.0003 |
| ko00730: thiamine metabolism | 1.00 × 10⁻² | 7.65 × 10⁻³ | 9.40 × 10⁻³ | 7.91 × 10⁻³ | 0.0003 |
| ko04510: focal adhesion | 1.27 × 10⁻⁵ | 1.26 × 10⁻⁵ | 1.27 × 10⁻⁵ | 1.62 × 10⁻⁵ | 0.0003 |
| ko05212: pancreatic cancer | 1.8 × 10⁻⁶ | 2.27 × 10⁻⁶ | 1.22 × 10⁻⁶ | 7.85 × 10⁻⁶ | 0.0003 |
| ko04720: long-term potentiation | 5.60 × 10⁻⁷ | 7.70 × 10⁻⁷ | 4.20 × 10⁻⁷ | 2.67 × 10⁻⁶ | 0.0002 |
| ko00350: tyrosine metabolism | 5.26 × 10⁻³ | 4.64 × 10⁻³ | 5.14 × 10⁻³ | 4.74 × 10⁻³ | < 0.0000 |
| ko00624: polycyclic aromatic hydrocarbon degradation | 2.78 × 10⁻³ | 2.24 × 10⁻³ | 2.52 × 10⁻³ | 2.22 × 10⁻³ | < 0.0000 |
| ko00740: riboflavin metabolism | 3.67 × 10⁻³ | 4.19 × 10⁻³ | 3.87 × 10⁻³ | 4.33 × 10⁻³ | < 0.0000 |
MAPK mitogen-activated protein kinase, TCA tricarboxylic acid
Methylation and gut microbiome
In a subset of eight patients who had DNA methylation data at both time points, we explored potential association between the gut microbiome and DNA methylation changes that were related to fatigue. The GSEA based on GO was performed on the top differentially methylated CpG sites that were associated with each of the 18 taxa identified by LEfSe for the association with fatigue. After quality control, there were 16 samples (8 patients at two time points) with 835,424 methylation sites in each sample left for the following analysis. Among the 18 taxa, with an FDR < 0.05 as a cutoff for enrichment analysis, all biological processes from the GSEA were related to immune responses and inflammation (Table 3). Those taxa included genus Faecalibacterium, species uncultured Firmicutes bacterium, species Agathobacter, and an undefined species within genus Lactococcus.
Table 3.
Gene set enrichment analysis (GSEA) biological processes from top differentially methylated CpG sites that are associated with taxa shown to be different among high- vs. low-fatigue patients in our data (FDR < 0.05)
| Taxa | Biological process | FDR |
|---|---|---|
| Genus Faecalibacterium | Neutrophil degranulation | 1.37 × 10⁻⁶ |
| Species uncultured Firmicutes bacterium | T cell activation | 0.001 |
| Species Agathobacter | Inflammatory response | 6.34 × 10⁻⁴ |
| Undefined species within genus Lactococcus | Neutrophil degranulation | 1.86 × 10⁻¹² |
| Inflammatory response | 4.61 × 10⁻⁴ | |
| T cell activation | 0.010 | |
| Adaptive immune response | 0.039 |
Discussion
This is one of the first kind that investigated the gut microbiome changes in association with cancer treatment—related fatigue among patients with HNC, and the potential epigenetic mechanisms underlying this association. Our preliminary results suggested a different microbial pattern seen among patients with high fatigue in comparison to those with low fatigue during acute phase of cancer treatment. This pattern was composed of reduction in SCFA-producing anti-inflammatory taxa with increases in taxa known to have associations with increased inflammation. Results from the functional pathway and DNA methylation analyses further indicated that inflammation was likely to be the major driver in the gut-brain axis for fatigue.
Patients with high fatigue have lower relative abundance of SCFA-producing bacterial taxa. These include lower abundance of family Ruminococcaceae, as well as its subsequent genera Subdoligranulum and Faecalibacterium, and species uncultured Firmicutes bacterium. Lower abundance of genera Bifidobacterium and Agathobacter was also observed in high- vs. low-fatigue group. These bacteria produce butyrate and other SCFAs such as acetate and propionate through the fermentation of dietary fiber [34, 35]. Butyrate, along with other SCFAs, is an essential metabolite in the human colon that has both immunomodulatory and anti-inflammatory properties [34, 35]. A lower abundance of SCFA-producing bacterial taxa could be associated with a proinflammatory state, which has been shown to be associated with fatigue in cancer patients [4].
Patients in the high-fatigue group were more likely to have higher relative abundance of bacterial taxa known to be associated with inflammation and diseases such as cancer [36]. For instance, higher abundance of genus Family XIII AD3011 has been reported in colonic inflammation and colorectal cancer [36]. Genus Erysipelatoclostridium has known positive associations with endotoxin or LPS [37], which is known to stimulate the innate immune system resulting in systemic and/or central nervous system inflammation [7]. Increased abundance of genus Eubacterium fissicatena group has also been observed in high-fat diet [38], which can lead to a systemic proinflammatory status and consequently be linked to diabetes and cancer [39]. Higher Bacteroidetes/Firmicutes ratio in our study has also been previously linked to inflammation [40] and chemotherapy treatment [41]. These findings suggest high proportion of taxa that are related lo increased inflammation could contribute to treatment-related fatigue in cancer patients.
Functional pathway analysis comparing the high- vs. low-fatigue groups identified a number of pathways related to fatty acid synthesis and oxidation, and inflammation. For instance, both citrate cycle or tricarboxylic acid (TCA) cycle and riboflavin metabolism are important for fatty acid synthesis and oxidation [42], which also plays a role in inflammatory responses and brain-gut axis [43]. A mitogen-activated protein kinase (MAPK or MAP kinase) pathway related to inflammatory signaling was also more abundant in the high-fatigue group than in the low-fatigue group. Furthermore, the long-term potentiation (LTP) and tyrosine metabolism pathways involved in brain functions and neurolransmitter metabolism were also differentially abundant in high- vs. low-fatigue groups [44]. Taken together, our functional pathway results suggested that the gut microbiota could be linked to cancer treatment–related fatigue through their effects on inflammation and neuro-functions.
Our exploratory DNA methylation analyses further supported the important role of inflammation and immune responses in the association between the gut microbiome and fatigue. Microbiota-related epigenetic modifications have been consistently linked to immune and inflammatory responses in previously published studies [45, 46], while these associations for cancer patients’ symptoms have not been explored. Our findings suggested that DNA methylation changes, particularly those related to inflammatory signaling pathways and immune responses, are involved in the association between the gut microbiome and fatigue. For instance, differentially methylated sites associated with genus Faecalibacterium, genus Agathobacter, and species uncultured Firmicutes bacterium, the SCFA-producing bacterial taxa, were enriched for neutrophil degranulation, T cell activation, or inflammatory responses. Both neutrophil degranulation and T cell activation participate in host immune responses by releasing various cytotoxic proteins such as cytokines. Previously published evidence has shown that bacterial SCFAs lead to an anti-inflammatory response by immunoregulation [47].
Our study has several limitations. First, this was a pilot study with a small sample size and limited statistical power to detect association especially for subgroup analyses. However, comparison between low- vs. high-fatigue groups for major demographic and clinical variables did not show significant differences between the groups and our LDA analysis did show significant taxa between the two groups with a commonly used cutoff of the LDA score of the two and p less than 0.05. We were not able to control for dietary intakes in the study; yet, a paired pre-post cancer treatment data collection may reduce potential confounding effects. Although considering cell composition variability is very important in epigenetic studies, including cell-type heterogeneity adjustment, it does not always improve the analysis and may include more false positives [48]. Since we have limited sample size in this study, the model might be overfitted if we include cell-type heterogeneity adjustment (more covariates in the model) for methylation analysis. Thus, we decided not to adjust for cell composition variability in this study, which could be a limitation as well. The pathway analysis of functional profiles was performed on the 16S rRNA data, while metagenomic shotgun sequencing or metatranscriptomics provides more accurate functional explanations of the gut microbiome.
Conclusions
Although this was a pilot study with limited sample size, we observed biologically plausible associations between the gut microbiome and fatigue in cancer patients, and obtained preliminary evidence that the DNA methylation could potentially play a role in this association. A dysbiotic pattern was observed in patients with high fatigue compared to those with low fatigue during acute phase of cancer treatment. This pattern is presentative with reductions in taxa producing SCFAs and increases in taxa associated with increased inflammation. Results from the functional pathway and DNA methylation analyses further suggested that inflammation was likely to be the major driver in the gut-brain axis for fatigue. Large studies are warranted to verify the findings and to develop targeted interventions supporting fatigue symptom management in cancer patients.
Acknowledgments
Funding The study was support by NIH/NCI P30CA138292 and Yale University School of Nursing Pilot Grant.
Footnotes
Conflict of interest The authors declare that they have no conflict of interest.
References
- 1.Goldstein D, Bennett B, Friedlander M, Davenport T, Hickie I, Lloyd A (2006) Fatigue states after cancer treatment occur both in association with, and independent of, mood disorder: a longitudinal study. BMC Cancer 6:240. [DOI] [PMC free article] [PubMed] [Google Scholar]
- 2.Fang FM, Liu YT, Tang Y, Wang CJ, Ko SF (2004) Quality of life as a survival predictor for patients with advanced head and neck carcinoma treated with radiotherapy. Cancer 100(2):425–432 [DOI] [PubMed] [Google Scholar]
- 3.Montazeri A (2009) Quality of life data as prognostic indicators of survival in cancer patients: an overview of the literature from 1982 to 2008. Health Qual Life Outcomes 7:102. [DOI] [PMC free article] [PubMed] [Google Scholar]
- 4.Xiao C, Beitler JJ, Higgins KA, Conneely K, Dwivedi B, Felger J, Wommack EC, Shin DM, Saba NF, Ong LY, Kowalski J, Bmner DW, Miller AH (2016) Fatigue is associated with inflammation in patients with head and neck cancer before and after intensity-modulated radiation therapy. Brain Behav Immun 52:145–152 [DOI] [PMC free article] [PubMed] [Google Scholar]
- 5.Bower JE (2007) Cancer-related fatigue: links with inflammation in cancer patients and survivors. Brain Behav Immun 21 (7):863–871 [DOI] [PMC free article] [PubMed] [Google Scholar]
- 6.Yoo BB, Mazmanian SK (2017) The enteric network: interactions between the immune and nervous systems of the gut. Immunity 46(6):910–926 [DOI] [PMC free article] [PubMed] [Google Scholar]
- 7.Galland L (2014) The gut microbiome and the brain. J Med Food 17(12): 1261–1272 [DOI] [PMC free article] [PubMed] [Google Scholar]
- 8.Matt SM, Allen JM, Lawson MA, Mailing LJ, Woods JA, Johnson RW (2018) Butyrate and dietary soluble fiber improve neuroinflammation associated with aging in mice. Front Immunol 9:1832. [DOI] [PMC free article] [PubMed] [Google Scholar]
- 9.Giloteaux L, Goodrich JK, Walters WA, Levine SM, Ley RE, Hanson MR (2016) Reduced diversity and altered composition of the gut microbiome in individuals with myalgic encephalomyelitis/chronic fatigue syndrome. Microbiome 4(1):30. [DOI] [PMC free article] [PubMed] [Google Scholar]
- 10.Cheung SG, Goldenthal AR, Uhlemann AC, Mann JJ, Miller JM, Sublette ME (2019) Systematic review of gut microbiota and major depression. Front Psychiatry 10:34. [DOI] [PMC free article] [PubMed] [Google Scholar]
- 11.Carlson AL, Xia K, Azcarate-Peril MA, Goldman BD, Ahn M, Styner MA, Thompson AL, Geng X, Gilmore JH, Knickmeyer RC (2018) Infant gut microbiome associated with cognitive devel-opment. Biol Psychiatry 83(2): 148–159 [DOI] [PMC free article] [PubMed] [Google Scholar]
- 12.Alenghat T (2015) Epigenomics and the microbiota. Toxicol Pathol 43(1):101–106 [DOI] [PMC free article] [PubMed] [Google Scholar]
- 13.Alenghat T, Artis D (2014) Epigenomic regulation of host-microbiota interactions. Trends Immunol 35(11 ):518–525 [DOI] [PMC free article] [PubMed] [Google Scholar]
- 14.Kumar H, Lund R, Laiho A, Lundelin K, Ley RE, Isolauri E, Salminen S (2014) Gut microbiota as an epigenetic regulator: pilot study based on whole-genome methylation analysis. mBio 5(6): e02113–e02114 [DOI] [PMC free article] [PubMed] [Google Scholar]
- 15.Ramos-Molina B, Sanchez-Alcoholado L, Cabrera-Mulero A, Lopez-Dominguez R, Carmona-Saez P, Garcia-Fuentes E, Moreno-Indias I, Tinahones FJ (2019) Gut microbiota composition is associated with the global DNA methylation pattern in obesity. Front Genet 10:613. [DOI] [PMC free article] [PubMed] [Google Scholar]
- 16.Crider KS, Yang TP, Berry RJ, Bailey LB (2012) Folate and DNA methylation: a review of molecular mechanisms and the evidence for folate’s role. Adv Nutr (Bcthcsda, Md.) 3(1):21–38 [DOI] [PMC free article] [PubMed] [Google Scholar]
- 17.Katada S, Imhof A, Sassone-Corsi P (2012) Connecting threads: epigenetics and metabolism. Cell 148(1–2):24–28 [DOI] [PubMed] [Google Scholar]
- 18.Mitchell SA (2010) Cancer-related fatigue: state of the science. PM R 2(5):364–383 [DOI] [PubMed] [Google Scholar]
- 19.Xiao C, Hanlon A, Zhang Q, Movsas B, Ang K, Rosenthal DI, Nguyen-Tan PF, Kim H, Le Q, Bruner DW (2014) Risk factors for clinician-reported symptom clusters in patients with advanced head and neck cancer in a phase 3 randomized clinical trial: RTOG 0129. Cancer 120(6):848–854 [DOI] [PMC free article] [PubMed] [Google Scholar]
- 20.Smets EM, Garssen B, Bonke B, De Haes JC (1995) The Multidimensional Fatigue Inventory (MFI) psychometric qualities of an instrument to assess fatigue. J Psychosom Res 39(3):315–325 [DOI] [PubMed] [Google Scholar]
- 21.Project NHM (2009) NIH Human Microbiome Project-Core Microbiome Sampling Protocol A (HMP-A). https://www.ncbi.nlm.nih.gov/projects/gap/cgi-bin/document.cgi?study_id=phs000228.v3.p1&phd=2235#sec92a
- 22.Callahan BJ, McMurdie PJ, Rosen MJ, Han AW, Johnson AJ, Holmes SP (2016) DADA2: high-resolution sample inference from Illumina amplicon data. Nat Methods 13(7):581–583 [DOI] [PMC free article] [PubMed] [Google Scholar]
- 23.Quast C, Pruesse E, Yilmaz P, Gerken J, Schweer T, Yarza P, Peplies J, Glockner FO (2013) The SILVA ribosomal RNA gene database project: improved data processing and web-based tools. Nucleic Acids Res 41 (Database issue):D590–D596 [DOI] [PMC free article] [PubMed] [Google Scholar]
- 24.Bai J, Jhaney I, Daniel G, Watkins BD (2019) Pilot study of vaginal microbiome using QIIME 2 in women with gynecologic cancer before and after radiation therapy. Oncol Nurs Forum 46(2):E48– E59 [DOI] [PubMed] [Google Scholar]
- 25.Bolyen E, Rideout JR, Dillon MR, Bokulich NA, Abnet CC, Al-Ghalith GA, Alexander H, Aim EJ, Arumugam M, Asnicar F, Bai Y, Bisanz JE, Bittinger K, Brejnrod A, Brislawn CJ, Brown CT, Callahan BJ, Caraballo-Rodríguez AM, Chase J, Cope EK, Da Silva R, Diener C, Dorrestein PC, Douglas GM, Durall DM, Duvallet C, Edwardson CF, Ernst M, Estaki M, Fouquier J, Gauglitz JM, Gibbons SM, Gibson DL, Gonzalez A, Gorlick K, Guo J, Hillmann B, Holmes S, Holste H, Huttenhower C, Huttley GA, Janssen S, Jarmusch AK, Jiang L, Kaehler BD, Kang KB, Keefe CR, Keim P, Kelley ST, Knights D, Koester I, Kosciolek T, Kreps J, Langille MGI, Lee J, Ley R, Liu Y-X, Loftfield E, Lozupone C, Maher M, Marotz C, Martin BD, McDonald D, LJ MI, Melnik AV, Metcalf JL, Morgan SC, Morton JT, Naimey AT, Navas-Molina JA, Nothias LF, Orchanian SB, Pearson T, Peoples SL, Petras D, Preuss ML, Pruesse E, Rasmussen LB, Rivers A, Robeson MS, Rosenthal P, Segata N, Shaffer M, Shiffer A, Sinha R, Song SJ, Spear JR, Swafford AD, Thompson LR, Torres PJ, Trinh P, Tripathi A, Tumbaugh PJ, Ul-Hasan S, van der Hooft JJJ, Vargas F, Vázquez-Baeza Y, Vogtmann E, von Hippel M, Walters W, Wan Y, Wang M, Warren J, Weber KC, Williamson CHD, Willis AD, Xu ZZ, Zaneveld JR, Zhang Y, Zhu Q, Knight R, Caporaso JG (2019) Reproducible, interactive, scalable and extensible microbiome data science using QI1ME 2. Nat Biotechnol 37(8):852–857 [DOI] [PMC free article] [PubMed] [Google Scholar]
- 26.Vazquez-Baeza Y, Pirrung M, Gonzalez A, Knight R (2013) EMPeror: a tool for visualizing high-throughput microbial commu-nity data. Gigascience 2(1): 16. [DOI] [PMC free article] [PubMed] [Google Scholar]
- 27.Asshauer KP, Wemheuer B, Daniel R, Meinicke P (2015) Tax4Fun: predicting functional profiles from metagenomic 16S rRNA data. Bioinfonnatics (Oxford, England) 31(17):2882–2884 [DOI] [PMC free article] [PubMed] [Google Scholar]
- 28.Segata N, Izard J, Waldron L, Gevers D, Miropolsky L, Garrett WS, Fluttenhower C (2011) Metagenomic biomarker discovery and ex-planation. Genome Biol 12(6):R60–R60 [DOI] [PMC free article] [PubMed] [Google Scholar]
- 29.Touleimat N, Tost J (2012) Complete pipeline for Infinium(®) Human Methylation 450K BeadChip data processing using subset quantile normalization for accurate DNA methylation estimation. Epigenomics 4(3):325–341 [DOI] [PubMed] [Google Scholar]
- 30.Chen YA, Lemire M, Choufani S, Butcher DT, Grafodatskaya D, Zanke BW, Gallinger S, Hudson TJ, Weksberg R (2013) Discovery of cross-rcactive probes and polymorphic CpGs in the Illumina Infinium HumanMethylation450 microarray. Epigenetics 8(2): 203–209 [DOI] [PMC free article] [PubMed] [Google Scholar]
- 31.Ritchie ME, Phipson B, Wu D, Hu Y, Law CW, Shi W, Smyth GK (2015) limma powers differential expression analyses for RNA-sequencing and microarray studies. Nucleic Acids Res 43(7):e47. [DOI] [PMC free article] [PubMed] [Google Scholar]
- 32.Geeleher P, Hartnett L, Egan LJ, Golden A, Raja Ali RA, Seoighe C (2013) Gene-set analysis is severely biased when applied to genome-wide methylation data. Bioinformatics (Oxford, England) 29(15): 1851–1857 [DOI] [PubMed] [Google Scholar]
- 33.Phipson B, Maksimovic J, Oshlack A (2016) missMethyl: an R package for analyzing data from Illumina’s Human Methylation 450 platform. Bioinformatics (Oxford, England) 32(2):286–288 [DOI] [PubMed] [Google Scholar]
- 34.Koh A, De Vadder F, Kovatcheva-Datchary P, Backhed F (2016) From dietary fiber to host physiology: short-chain fatty acids as key bacterial metabolites. Cell 165(6): 1332–1345 [DOI] [PubMed] [Google Scholar]
- 35.Riviëre A, Selak M, Lantin D, Leroy F, De Vuyst L (2016) Bifidobacteria and butyrate-producing colon bacteria: importance and strategies for their stimulation in the human gut. Front Microbiol 7:979–979 [DOI] [PMC free article] [PubMed] [Google Scholar]
- 36.Zhang Y, Wang X-L, Zhou M, Kang C, Lang H-D, Chen M-T, Hui S-C, Wang B, Mi M-T (2018) Crosstalk between gut microbiota and Sirtuin-3 in colonic inflammation and tumorigenesis. Exp Mol Med 50(4):21. [DOI] [PMC free article] [PubMed] [Google Scholar]
- 37.Li L-L, Wang Y-T, Zhu L-M, Liu Z-Y, Ye C-Q, Qin S (2020) Inulin with different degrees of polymerization protects against diet-induced endotoxemia and inflammation in association with gut microbiota regulation in mice. Sci Rep 10(1):978. [DOI] [PMC free article] [PubMed] [Google Scholar]
- 38.Heo J, Sco M, Park H, Lee WK, Guan LL, Yoon J, Caetano-Anolles K, Ahn H, Kim S-Y, Kang Y-M, Cho S, Kim H (2016) Gut microbiota modulated by probiotics and Garcinia cambogia extract correlate with weight gain and adipocyte sizes in high fat-fed mice. Sci Rep 6(1):33566. [DOI] [PMC free article] [PubMed] [Google Scholar]
- 39.Duan Y, Zeng L, Zheng C, Song B, Li F, Kong X, Xu K (2018) Inflammatory links between high fat diets and diseases. Front Immunol 9:2649–2649 [DOI] [PMC free article] [PubMed] [Google Scholar]
- 40.Henao-Mejia J, Elinav E, Jin C, Hao L, Mehal WZ, Strowig T, Thaiss CA, Kau AL, Eisenbarth SC, Jurczak MJ, Camporez JP, Shulman GI, Gordon JI, Hoffman HM, Flavell RA (2012) Inflammasome-mediated dysbiosis regulates progression of NAFLD and obesity. Nature 482(7384): 179–185 [DOI] [PMC free article] [PubMed] [Google Scholar]
- 41.Li H-L, Lu L, Wang X-S, Qin L-Y, Wang P, Qiu S-P, Wu H, Huang F, Zhang B-B, Shi H-L, Wu X-J (2017) Alteration of gut microbiota and inflammatory cytokine/chemokine profiles in 5-fluorouracil induced intestinal mucositis. Front Cell Infect Microbiol 7:455–455 [DOI] [PMC free article] [PubMed] [Google Scholar]
- 42.Williams NC, O’Neill LAJ (2018) A role for the krebs cycle intermediate citrate in metabolic reprogramming in innate immunity and inflammation. Front Immunol 9(141) [DOI] [PMC free article] [PubMed] [Google Scholar]
- 43.Dalile B, Van Oudenhove L, Vervliet B, Verbeke K (2019) The role of short-chain fatty acids in microbiota-gut-brain communication. Nat Rev Gastroenterol Hepatol 16(8):461–478 [DOI] [PubMed] [Google Scholar]
- 44.Jongkees BJ, Hommel B, Kuhn S, Colzato LS (2015) Effect of tyrosine supplementation on clinical and healthy populations under stress or cognitive demands-a review. J Psychiatr Res 70:50–57 [DOI] [PubMed] [Google Scholar]
- 45.Sokol H, Seksik P, Furet JP, Firmesse O, Nion-Larmurier I, Beaugerie L, Cosnes J, Corthier G, Marteau P, Dore J (2009) Low counts of Faecalibacterium prausnitzii in colitis microbiota. Inflamm Bowel Dis 15(8): 1183–1189 [DOI] [PubMed] [Google Scholar]
- 46.Takahashi K, Sugi Y, Nakano K, Tsuda M, Kurihara K, Hosono A, Kaminogawa S (2011) Epigenetic control of the host gene by com-mensal bacteria in large intestinal epithelial cells. J Biol Chem 286(41):35755–35762 [DOI] [PMC free article] [PubMed] [Google Scholar]
- 47.Corrêa-Oliveira R, Fachi JL, Vieira A, Sato FT, Vinolo MAR (2016) Regulation of immune cell function by short-chain fatty acids. Clin Transl Immunol 5(4):e73–e73 [DOI] [PMC free article] [PubMed] [Google Scholar]
- 48.McGregor K, Bernatsky S, Colmegna I, Hudson M, Pastinen T, Labbe A, Greenwood CM (2016) An evaluation of methods correcting for cell-type heterogeneity in DNA methylation studies. Genome Biol 17:84. [DOI] [PMC free article] [PubMed] [Google Scholar]