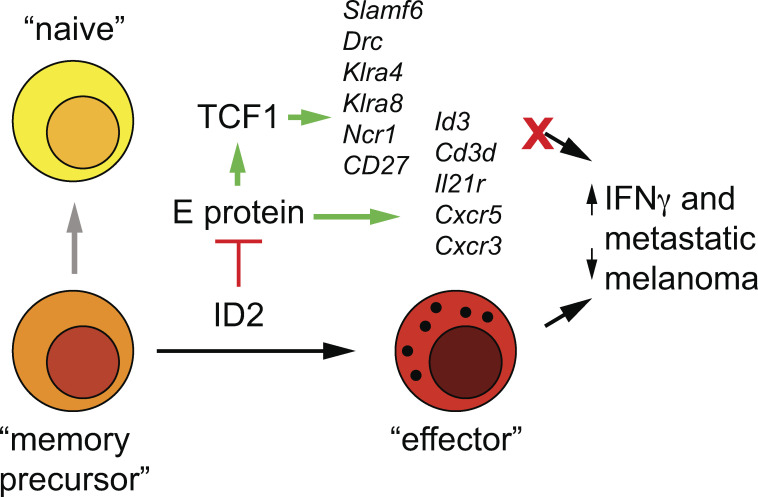
ID2 is an essential transcription factor for natural killer cell development. Through epistasis analysis, Li et al. show that ID2 controls the amplitude of TCF1 and allows for its temporal downregulation, thereby supporting natural killer cell maturation.
Abstract
Gaining a mechanistic understanding of the expansion and maturation program of natural killer (NK) cells will provide opportunities for harnessing their inflammation-inducing and oncolytic capacity for therapeutic purposes. Here, we demonstrated that ID2, a transcriptional regulatory protein constitutively expressed in NK cells, supports NK cell effector maturation by controlling the amplitude and temporal dynamics of the transcription factor TCF1. TCF1 promotes immature NK cell expansion and restrains differentiation. The increased TCF1 expression in ID2-deficient NK cells arrests their maturation and alters cell surface receptor expression. Moreover, TCF1 limits NK cell functions, such as cytokine-induced IFN-γ production and the ability to clear metastatic melanoma in ID2-deficient NK cells. Our data demonstrate that ID2 sets a threshold for TCF1 during NK cell development, thus controlling the balance of immature and terminally differentiated cells that support future NK cell responses.
Graphical Abstract
Introduction
Natural killer (NK) cells are the innate counterpart to CD8 T lymphocytes, and together, these cytotoxic cells create a formidable barrier against viral infection and cancer. CD8 T cells are generated as naive cells with rare specificities that require multiple signals for their activation, whereas NK cells arise as primed cells that can be broadly and rapidly activated with fewer stimulatory inputs. Therefore, NK cell function precedes that of CD8 T cells in most infections and can set the stage for a successful immune response (Sun and Lanier, 2011). In mice, NK cells arise as CD27+CD11b− cells that produce IFN-γ upon activation and mature into CD27+CD11b+ and CD27−CD11b+ cells that have robust cytotoxic properties (Chiossone et al., 2009). These subsets are analogous to human CD16−CD56high, CD16+CD56dimCD57−, and CD16+CD56dimCD57+ NK cells, respectively (Freud et al., 2017), which share common transcriptional regulatory circuits with their mouse counterparts (Collins et al., 2019). NK cell development and maturation rely on numerous transcription factors, including the T box factors Eomesodermin and TBET (Daussy et al., 2014; Gordon et al., 2012), known to regulate expression of the cytokine receptor CD122 and Zeb2 (Intlekofer et al., 2005; van Helden et al., 2015), a transcription factor that promotes CD8 terminal effector differentiation (Dominguez et al., 2015; Omilusik et al., 2015). The development of CD27+CD11b− NK cells is partially dependent on the T cell–associated transcription factor TCF1, encoded by the Tcf7 gene, which is downregulated during NK cell maturation (Held et al., 2003; Jeevan-Raj et al., 2017). Despite their negligible TCF1 expression, CD27−CD11b+ NK cells from Tcf7−/− mice show dysregulated expression of a subset of NK cell receptors and increased expression of granzyme b (GZMB; Held et al., 1999; Jeevan-Raj et al., 2017; Kunz and Held, 2001). TCF1 is expressed in naive and memory CD8 T cells and is associated with self-renewal of CD8 T cells during their activation and with the ability of a subset of exhausted T cells in tumors and chronic viral infection to become reactivated (Beltra et al., 2020; Im et al., 2016; Lin et al., 2016; Shan et al., 2020). However, the mechanisms controlling TCF1 expression during NK cell and CD8 T cell development are not well understood.
NK cells constitutively express the transcription factor ID2 (Boos et al., 2007; Yokota et al., 1999), which is required for NK cell effector maturation and for the primed state in CD27+CD11b− NK cells (Delconte et al., 2016; Zook et al., 2018). ID2 was proposed to inhibit the E protein–induced transcription of the suppressor of cytokine signaling protein gene Socs3 and, thereby, promote IL-15 signaling (Delconte et al., 2016), which would impact NK cell maturation. However, ID2 also represses a program of T cell–associated genes that are critical for both naive and memory CD8 T cells but whose expression is low in effector cells (Delconte et al., 2016; Zook et al., 2018). How this program is regulated during the maturation of NK cells, where ID2 is constitutively expressed, is not understood.
Here, we show that a critical function of ID2 in NK cells is to control the amplitude of TCF1 expression and to allow for its dynamic regulation during NK cell maturation. ID2-deficient NK cells showed elevated expression of TCF1 and multiple TCF1 target genes and had increased chromatin accessibility and nucleosome depletion at a Tcf7 intronic region. Deletion of TCF1 from ID2-deficient NK cells restored expression of multiple maturation-associated genes and proteins and improved their ability to produce IFN-γ in response to inflammatory cytokines and their ability to clear metastatic melanoma. Our data reveal TCF1 to be an important target of the E protein–ID2 transcriptional axis and provide critical insight into the regulatory circuits that coordinate the maturation program in NK cells.
Results
NK cell–specific deletion of Id2 results in arrested NK cell maturation
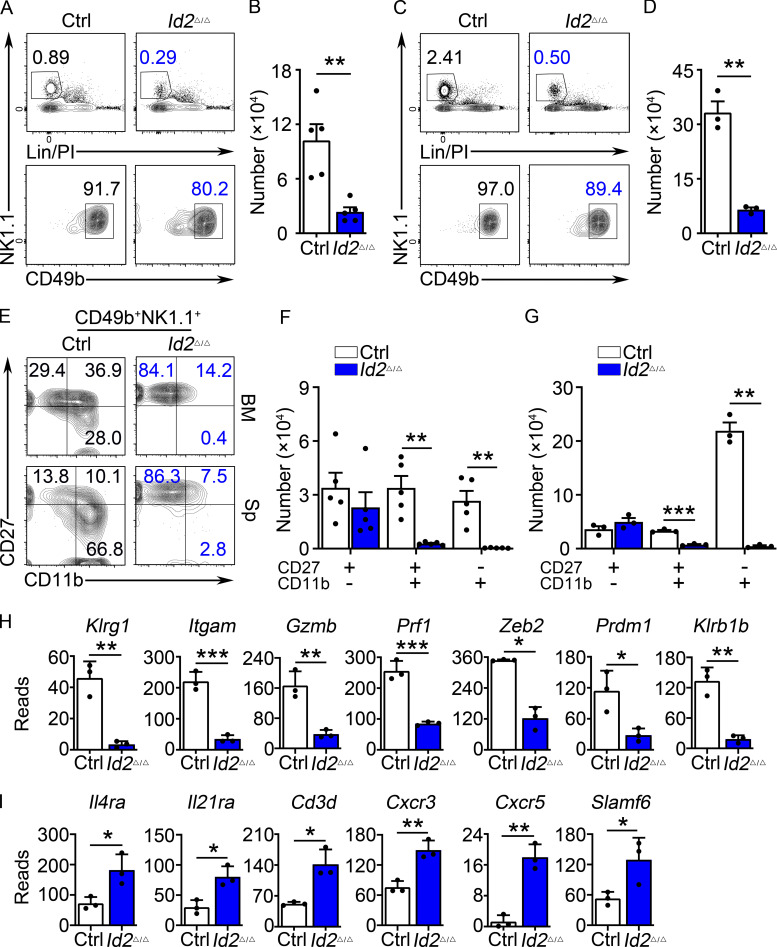
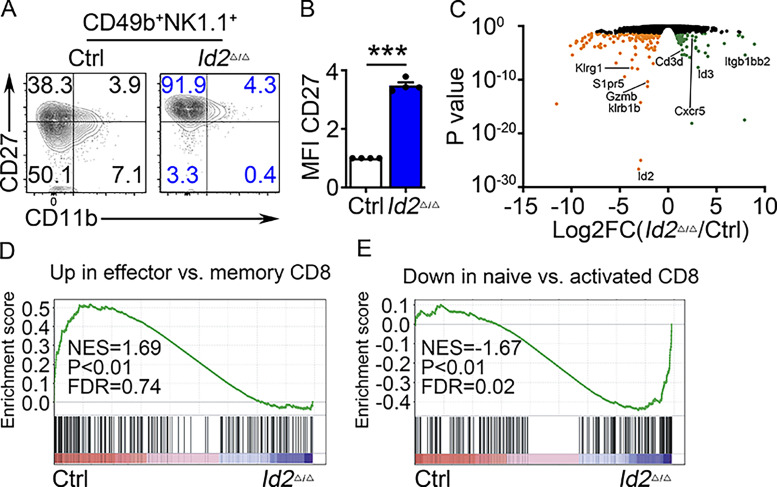
We have previously reported that mice in which the Id2 gene was deleted in all hematopoietic cells display a disruption in NK cell maturation (Zook et al., 2018). In the absence of ID2, CD27+CD11b− NK cells fail to acquire their “memory precursor-like” chromatin state and instead appear more similar to naive CD8 T cells and fail to activate the NK cell effector gene program. Here, we used Ncr1Cre to delete Id2 (Id2Δ/Δ) in NKp46+ cells (Walzer et al., 2007) and, as reported by Delconte et al. (2016), we found a reduced frequency and number of NK cells in the bone marrow (BM) and spleen (Fig. 1, A–D). In both tissues, NK cell differentiation was arrested at the CD27+CD11b− stage with increased mean fluorescence intensity (MFI) for CD27 (Fig. 1, E–G). BM NK cells enriched from Id2F/F (control [Ctrl]) and Id2Δ/Δ mice expanded and maintained their CD27hiCD11b− phenotype, with an increased MFI for CD27, when cultured in vitro in low-dose IL-15 (Fig. S1, A and B).
Figure 1.
Arrested NK cell maturation in Id2Δ/Δ mice. (A) Flow cytometry showing gating strategy for BM NK cells in Ctrl and Id2Δ/Δ mice. Top panels show lineage (Lin; CD3e)/PI versus NK1.1 on lymphoid cells in the BM. Lower panels show NK1.1 versus CD49b on Lin/PI-NK1.1+ cells. The percentage of cells in the gate is indicated. (B) Summary of the number of NK cells per 108 BM cells. Bar represents the average ± SEM. Ctrl (white) and Id2Δ/Δ (blue). Each circle represents one mouse. (C) Same as A but for spleen. (D) Same as B but for spleen. (E) CD49b+NK1.1+ NK cells from the BM (top) or spleen (bottom) were examined for expression of CD27 and CD11b by flow cytometry. The percentage of cells in each quadrant is indicated. (F and G) Summary of the number of CD27+CD11b−, CD27+CD11b+, and CD27−CD11b+ NK cells per 108 BM cells or per spleen (n = 5 for BM and n = 3 for spleen [Sp]; data are from independent experiments). (H and I) RNA expression for the indicated genes in Ctrl or Id2Δ/Δ determined by RNA-seq and expressed as normalized reads. Data are from three biological replicates. Error bars represent SD. Statistical significance was determined by two-tailed unpaired t test. *, P < 0.05; **, P < 0.01; ***, P < 0.005.
Figure S1.
Alterations in gene expression in Id2Δ/Δ BM NK cells. (A) CD49b+-enriched NK cells from BM were culture in 20 ng/ml IL-15 for 6 d, and then NK1.1+CD49b+ NK cells were analyzed for CD27 and CD11b by flow cytometry. Numbers indicate the percentage of cells in the respective quadrant (n = 4 from four independent experiments). (B) Summary of relative CD27 MFI. MFI of Ctrl NK cells was set as 1 in each experiment. Error bars represent SEM. Statistical significance was determined by two-tailed unpaired t test. ***, P < 0.005. (C) Volcano plot showing Log2FC versus adj. P value for RNA-seq data from Id2Δ/Δ and Ctrl NK cells. Data are combined from three biological replicates. (D and E) Example of enrichment data from GSEA of Ctrl and Id2Δ/Δ RNA-seq data. FDR, false discovery rate; NES, normalized enrichment score.
To further interrogate the phenotype of Id2Δ/Δ NK cells, we examined global changes in gene expression in NK1.1+CD49b+ BM cells using RNA sequencing (RNA-seq). We found 68 genes that increased and 138 that decreased in expression in Id2Δ/Δ NK cells (adjusted [adj.] P < 0.05; Fig. S1 C). Maturation-associated genes Klrg1, Itgam, Gzmb, Prf1, Zeb2, and Klrb1b, encoding the NK cell receptor NKR-P1B, were decreased (Fig. 1 H). In contrast, genes associated with naive and memory T lymphocytes, such as Il4ra, Il21r Cd3d, and Cxcr3, were increased as was Slamf6 and the E protein target gene Cxcr5 (Fig. 1 I). Gene set enrichment analysis (GSEA) indicated that Ctrl cells were enriched for genes expressed in CD8 T effector compared with memory cells, whereas Id2Δ/Δ NK cells were enriched for genes associated with naive compared with activated CD8 T cells (Fig. S1 D). Taken together, these data support that ID2 deficiency in NKp46+ cells prevented NK cell maturation and promoted transformation of CD27+CD11b− NK cells toward a naive gene program (Zook et al., 2018).
TCF1 expression was dysregulated in Id2Δ/Δ NK cells
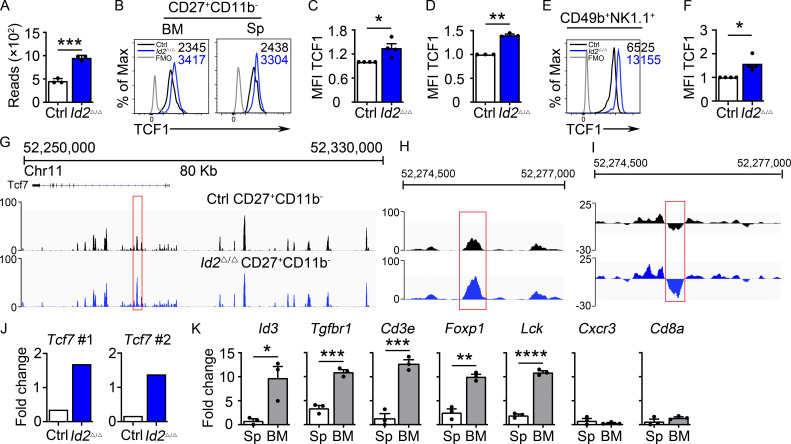
Id2Δ/Δ NK cells also showed increased Tcf7 mRNA (Fig. 2 A). TCF1 protein was elevated in Id2Δ/Δ BM and splenic CD27+CD11b− NK cells when compared with Ctrl NK cells (Fig. 2 B–D). TCF1 protein was also more highly expressed in Id2Δ/Δ NK cells than Ctrl NK cells after in vitro culture in IL-15 (Fig. 2, E and F). We examined Assay for Transposase-Accessible Chromatin (ATAC)-seq data from Ctrl and ID2-deficient CD27+CD11b− NK cells and found substantially increased chromatin accessibility in the second intron of Tcf7 in the absence of ID2, with no altered accessibility at upstream regions (Fig. 2, G and H). This intronic region, which also showed decreased nucleosome occupancy in the absence of ID2 (Fig. 2 I), contains three closely spaced E box motifs consistent with direct regulation by E protein transcription factors (Fig. S2 A). This Tcf7 genomic region was enriched by chromatin immunoprecipitation (ChIP) with E protein antibodies from extracts of Id2Δ/Δ compared with Ctrl BM NK cells, demonstrating that E proteins bind this region after deletion of ID2 (Fig. 2 J). Taken together, these data indicate that ID2 limited the ability of E proteins to directly promote Tcf7 transcription in NK cells.
Figure 2.
Dysregulation of Tcf7/TCF1 in Id2Δ/Δ NK cells. (A) Tcf7 mRNA in Ctrl and Id2Δ/Δ NK cells by RNA-seq expressed as normalized reads. Data are from three biological replicates. Error bars represent SD. (B) TCF1 in CD27+CD11b− NK cells from BM and spleen from Ctrl and Id2Δ/Δ mice determined by flow cytometry. The MFI of TCF1 is indicated for Ctrl (black) and Id2Δ/Δ (blue; n = 4 for BM and n = 3 for spleen; data are from independent experiments). (C and D) Summary of relative TCF1 MFI from BM and spleen. MFI of Ctrl NK cells was set as 1 in each experiment. (E) CD49b+-enriched BM NK cells were cultured in IL-15 (20 ng/ml) for 6 d before flow cytometry analysis for TCF1 in NK1.1+CD49b+ cells. The MFI for TCF1 in Ctrl (black) and Id2Δ/Δ (blue) is shown. (F) Summary of relative TCF1 MFI in IL-15–cultured NK cells. MFI of Ctrl NK cells was set as 1 in each experiment (n = 4; data are from independent experiments). Error bars represent SEM (C, D, and F). (G) Chromatin accessibility surrounding the Tcf7 gene as determined by ATAC-seq on CD27+CD11b− NK cells (Zook et al., 2018). Ctrl (black) and ID2-deficient (blue) NK cells. (H) Enhanced view of the indicated region of the Tcf7 intron showing increased chromatin accessibility in ID2-deficient CD27+CD11b− NK cells. (I) The same region as in H but showing nucleosome depletion. (J) E protein ChIP was performed on chromatin isolated from Ctrl or Id2Δ/Δ BM NK cells and amplified using two different primer sets flanking the region shown in H. Data are represented as the signal relative to input and are representative of two independent experiments with triplicate measurements. (K) TCF1 ChIP was performed on chromatin isolated from spleen (Sp) or BM NK cells and represented as the signal at the indicated gene relative to input. Data are representative of two experiments with triplicate samples. Statistical significance was determined using a two-tailed unpaired t test (A, D, and F). *, P < 0.05; **, P < 0.01; ***, P < 0.005; ****, P < 0.001.
Figure S2.
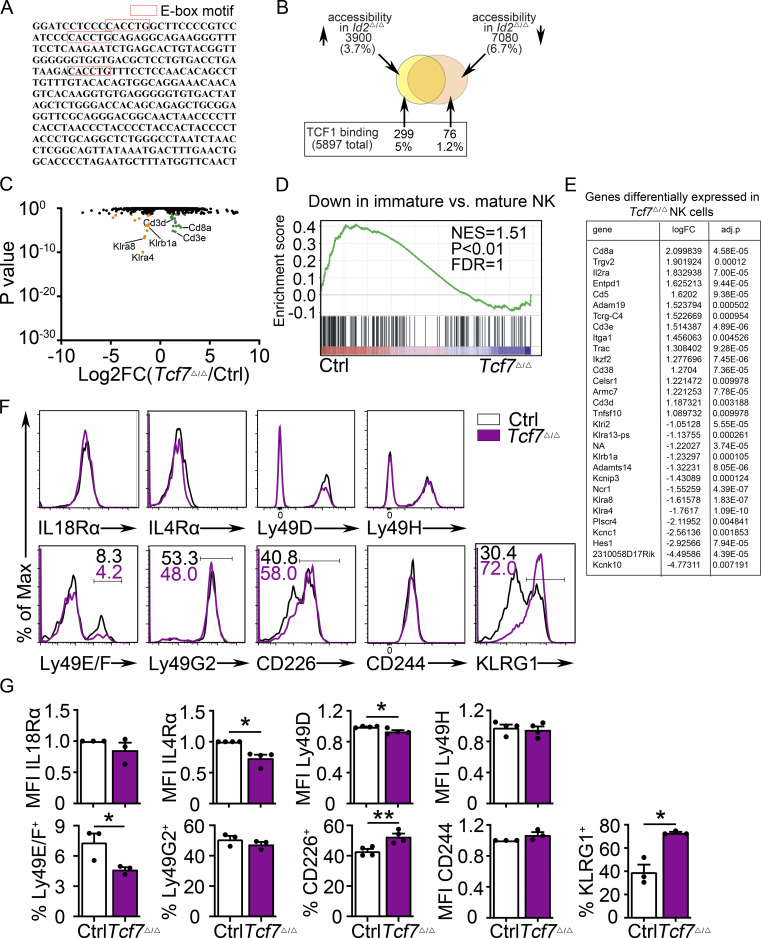
Altered gene expression in Tcf7Δ/Δ BM NK cells. (A) Sequence of the intronic region of Tcf7 that shows increased accessibility in ID2-deficient BM CD27+CD11b− NK cells. (B) Schematic representation of the overlap between regions with altered chromatin accessibility in ID2-deficient CD27+CD11b− NK cells by ATAC-seq and TCF1 binding sites in CD8 T cells determined by ChIP-seq (Gene Expression Omnibus accession no. GSE73239). Regions with increased accessibility by ATAC-seq are shown in yellow, decreased accessibility in peach, and no change in orange. TCF1 binding sites are significantly enriched in ATAC-seq regions that gain accessibility in ID2-deficient cells. P < 1.84610-66 (Fisher’s exact test). (C) Volcano plot showing Log2FC versus adj. P values for RNA-seq data from Tcf7Δ/Δ and Ctrl NK cells. Data were generated from three biological replicates. (D) GSEA for Ctrl versus Tcf7Δ/Δ NK cell RNA expression. (E) Table showing differentially expressed genes from RNA-seq data shown in C. (F) Flow cytometry plots of different proteins on NK cells of spleen from Tcf7Δ/Δ and Ctrl mice (n = 3–4 for each group from independent experiments). (G) Summary of the data in F. Error bars represent SEM. Statistical significance was determined by two-tailed unpaired t test. *, P < 0.05; **, P < 0.01. FDR, false discovery rate; NES, normalized enrichment score.
TCF1 bound to multiple genes that are dysregulated in ID2-deficient NK cells
We questioned whether TCF1 might bind to some of the genes that are dysregulated in the absence of ID2 (Zook et al., 2018). Using TCF1-binding coordinates near these genes in T cells (Emmanuel et al., 2018), we performed TCF1 ChIP using NK1.1+CD49b+ cells from the BM, which are predominately CD27+ NK cells that express TCF1, and spleen, which are predominately CD11b+ NK cells that have low TCF1 (Jeevan-Raj et al., 2017). Notably, TCF1 bound sites near the Id3, Tgfbr1, Cd3e, Foxp1, and Lck genes preferentially in BM compared with splenic NK cells (Fig. 2 K). In contrast, TCF1 binding was low at the regions tested near the Cxcr3 and CD8a genes in both the BM and the spleen, despite that Cxcr3 is dysregulated in Id2Δ/Δ NK cells (Fig. 2 K). To determine more globally whether TCF1 could contribute to gene dysregulation in Id2Δ/Δ NK cells, we compared published TCF1 ChIP-seq data from CD8 T cells with our ATAC-seq data (Steinke et al., 2014; Xing et al., 2016). Of the accessible regions that we identified in Ctrl and ID2-deficient NK cells by ATAC-seq, 10.4% were differentially accessible, with 6.7% of regions being more accessible in Ctrl and 3.7% being more accessible in ID2-deficient CD27+CD11b− NK cells (Fig. S2 B). TCF1 bound to 5,897 regions in CD8 T cells of which 299 (5.1%) were more accessible in ID2-deficient NK cells and only 79 (1.29%) were more accessible in Ctrl CD27+CD11b− NK cells (Fig. S2 B). Therefore, TCF1 binding sites are enriched in chromatin regions that become more accessible in ID2-deficient NK cells (Fig. S2 B). These data indicate that TCF1 could regulate a substantial set of genes in CD27+CD11b− NK cells and led us to hypothesize that TCF1 contributes to the arrested maturation and gene dysregulation in ID2-deficient NK cells.
TCF1 was required for optimal NK cell numbers and limited maturation
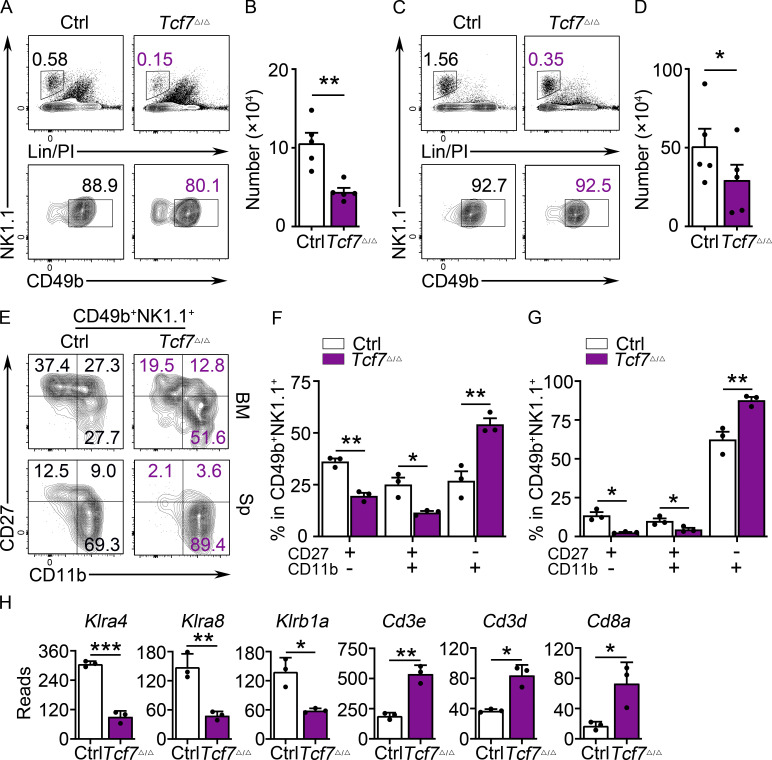
To further investigate the role of TCF1 in NK cell maturation, we created mice in which TCF1 was inactivated in NK cells using Ncr1Cre. Studies in mice with a germline mutation in Tcf7 demonstrated that TCF1 is required for development of NK progenitor (NKP) cells in the BM, promotes expression of the activating NK cell receptor Ly49A, and limits the cytotoxic protein GZMB (Jeevan-Raj et al., 2017). However, it was unknown whether TCF1 was required in mature NK cells or only at earlier developmental stages. In mice lacking TCF1 only in NKp46+ cells (Tcf7Δ/Δ), NK cell numbers were decreased in the BM and modestly decreased in the spleen (Fig. 3, A–D). Analysis of CD27 and CD11b revealed that Tcf7Δ/Δ NK cells were skewed toward the CD27−CD11b+ subset, consistent with the reported role for TCF1 in restraining NK cell maturation (Fig. 3, E–G; Held et al., 2003). Thus, deletion of Tcf7 in Ncr1+ cells had a similar, although less severe, consequence on NK cell development as germline deletion of Tcf7.
Figure 3.
Deletion of Tcf7 in mature NK cells impacts their numbers and maturation. (A) Flow cytometry for BM NK cells in Ctrl and Tcf7Δ/Δ mice. Top panels show lineage (Lin)/PI versus NK1.1 on lymphoid cells. Bottom panels show NK1.1 versus CD49b on Lin/PI-NK1.1+ cells. The percentage of cells in the gated region is indicated. (B) Summary of the number of NK cells per 108 BM cells in Ctrl (white) and Tcf7Δ/Δ (maroon). Bars represent the average ± SEM. Each circle represents one mouse (n = 5). (C) Same as A but for spleen. (D) Same as B but for spleen (n = 4). (E) NK1.1+CD49b+ NK cells from BM (top) or spleen (Sp; bottom) were examined for expression of CD27 and CD11b by flow cytometry. Numbers indicate the percentage of cells in the respective quadrant. (F and G) Summary of the percentage of CD27+CD11b−, CD27+CD11b+, and CD27−CD11b+ NK cells among CD49b+NK1.1+ NK cells in BM and in spleen (n = 3; all flow cytometry data are from independent experiments). (H) RNA expression for the indicated genes in Ctrl or Tcf7Δ/Δ NK cells determined by RNA-seq and expressed as normalized reads. Data represent three biological replicates. Error bars represent SD. Statistical significance was determined by two-tailed unpaired t test. *, P < 0.05; **, P < 0.01; ***, P < 0.005.
To gain further insight into how TCF1 supports NK cell development, we examined changes in mRNA expression in NK1.1+CD49b+ BM cells using RNA-seq. Surprisingly, only 14 genes showed decreased and 16 genes showed increased mRNA in the absence of TCF1 (adj. P < 0.05; Fig. S2, C and E). These genes included Klra4, Klra8, and Klrb1a, which were decreased, and T cell–associated Cd3d, CD3e, and Cd8a, which were increased in the absence of TCF1 (Fig. 3 H and Fig. S2, C and D). Despite the subtle increase in CD11b, Itgam was not significantly different in Tcf7Δ/Δ and Ctrl NK cells in this analysis. GSEA indicated enrichment for a mature NK cell gene program in Ctrl NK cells primarily driven by the decreased expression of NK cell receptor genes in the absence of TCF1 (Fig. S2 D). Thus, BM NK cells in Tcf7Δ/Δ mice showed only subtle changes in gene expression compared with Ctrl NK cells.
Tcf7Δ/Δ NK cells showed dysregulated NK cell receptor expression and altered function
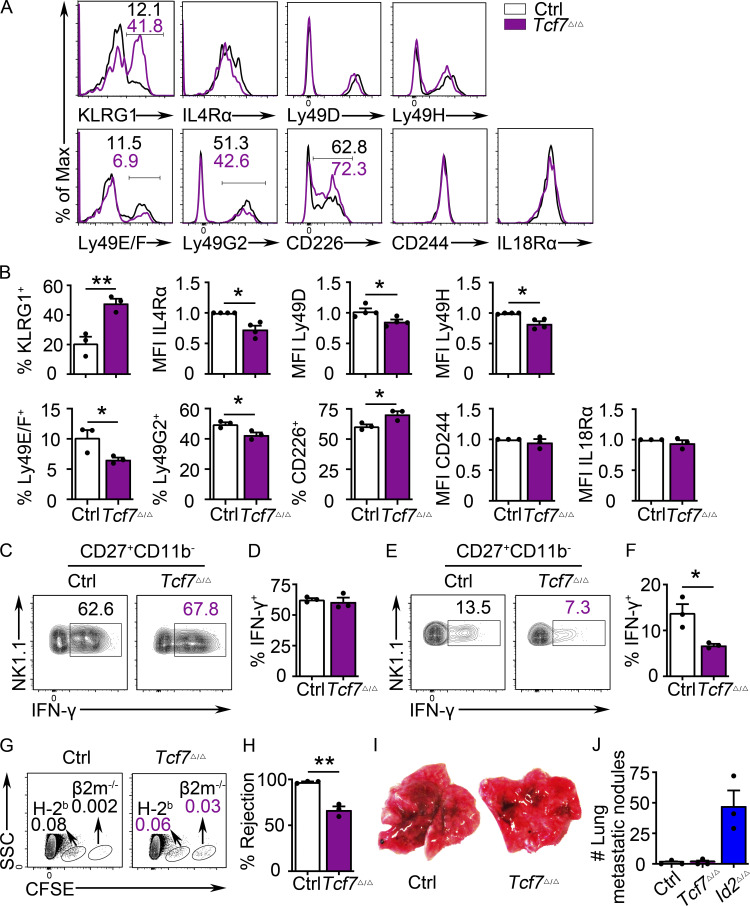
We examined multiple receptors on Tcf7Δ/Δ NK cells by flow cytometry. Although not evident by RNA-seq, there was an increased frequency of cells expressing KLRG1 among Tcf7Δ/Δ NK1.1+CD49b+ NK cells in the BM and spleen (Fig. 4, A and B; and Fig. S2, F and G). There was also a subtly increased frequency of CD226/DNAM-1+ NK cells and a decreased frequency of Ly49E/F+ and Ly49G2+ NK cells (Fig. 4, A and B). Consistent with the decreased Klra4 and Klra8 mRNA, their protein products, Ly49D or Ly49H, showed a reduced MFI on Tcf7Δ/Δ NK cells, although the frequency of positive NK cells was similar to Ctrl (Fig. 4, A and B; and Fig. S2, F and G). The MFI of IL-4rα was also reduced on Tcf7Δ/Δ NK cells, whereas IL-18R1 and CD244 were expressed similarly to Ctrl NK cells (Fig. 4, A and B; and Fig. S2). These modest changes in receptor expression could be indicative of an impact on Tcf7Δ/Δ NK cell function; therefore, we tested these cells in multiple functional assays. Tcf7Δ/Δ NK cells were able to expand in vitro in IL-15, and treatment with IL-2 and IL-12 led to robust IFN-γ production (Fig. 4, C and D). However, crosslinking of NK1.1 led to less IFN-γ in Tcf7Δ/Δ NK cells compared with Ctrl cells (Fig. 4, E and F). In addition, while injection of Ctrl mice with a mixture of splenocytes from WT C57BL/6 and β2 microglobulin (β2M)−/− mice led to rapid rejection of the β2M−/− cells, Tcf7Δ/Δ mice were less effective at rejecting the β2M−/− cells (Fig. 4, G and H), similar to what was reported for germline Tcf7−/− mice (Jeevan-Raj et al., 2017). However, in contrast to ID2-deficient animals, Tcf7Δ/Δ mice were able to efficiently clear B16-F10 melanoma cells from the lungs of mice (Fig. 4, I and J). These data demonstrate that Tcf7Δ/Δ mice had multiple alterations in NK cell receptor expression, were compromised in their ability to produce IFN-γ in response to receptor crosslinking, and were less efficient at killing MHC class I–deficient cells. Nonetheless, TCF1 was dispensable for IFN-γ production in response to inflammatory cytokines and for clearance of metastatic melanoma.
Figure 4.
TCF1 deficiency in mature NK cells impacts NK cell receptor expression and NK cell function. (A) Flow cytometry plots of multiple surface proteins on BM NK cells from Ctrl (white) and Tcf7Δ/Δ (maroon) mice. The percentage of cells in the gated region is indicated (n = 3 or 4 for each group in two to three independent experiments). (B) Summary of data shown in A. MFI of Ctrl NK cells was set as 1 in each experiment. (C) CD49b+-enriched NK cells from BM were stimulated by IL-2 and IL-12 followed by analysis of IFN-γ in NK1.1+CD49b+ NK cells by flow cytometry. Numbers are the percentage of cells in the indicated gates (n = 3). (D) Summary of data shown in C. (E) Flow cytometry for IFN-γ in NK1.1+CD49b+ NK cells 18 h after activation with anti-NK1.1 (n = 3). (F) Summary of data shown in E. (G) C57BL/6 (H-2b) and β2m−/− splenocytes were labeled with a low and high dose of CFSE, respectively, before injection into polyinosinic:polycytidylic acid–primed Tcf7Δ/Δ and Ctrl mice. Recipient spleens were analyzed 18 h later by flow cytometry. Numbers are the percentage of cells in the indicated gates (n = 3). (H) Summary showing percent rejection in Ctrl and Tcf7Δ/Δ mice (G). (I) Ctrl and Tcf7Δ/Δ mice were injected with B16-F10 cells, and lungs were analyzed for metastases on day 12 (n = 3 for each group in two independent experiments). (J) Summary of data shown in I for numbers of tumor nodules in the lung. Note that there is no significant difference between Ctrl and Tcf7Δ/Δ mice; Id2Δ/Δ mice are also shown for comparison. Error bars represent SEM (B, D, F, H, and J). Statistical significance was determined by two-tailed unpaired t test (B, D, F, H, and J). *, P < 0.05; **, P < 0.01. SSC, side scatter.
TCF1 limited maturation of Id2Δ/Δ NK cells
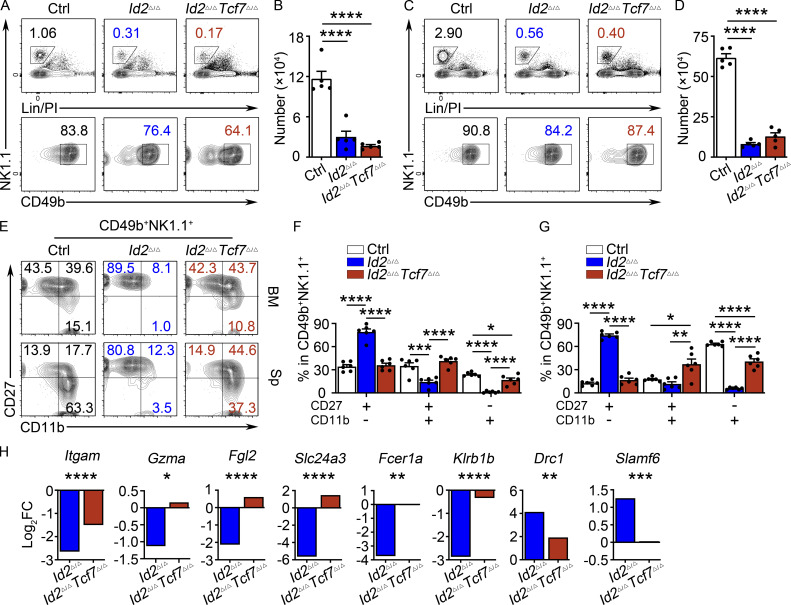
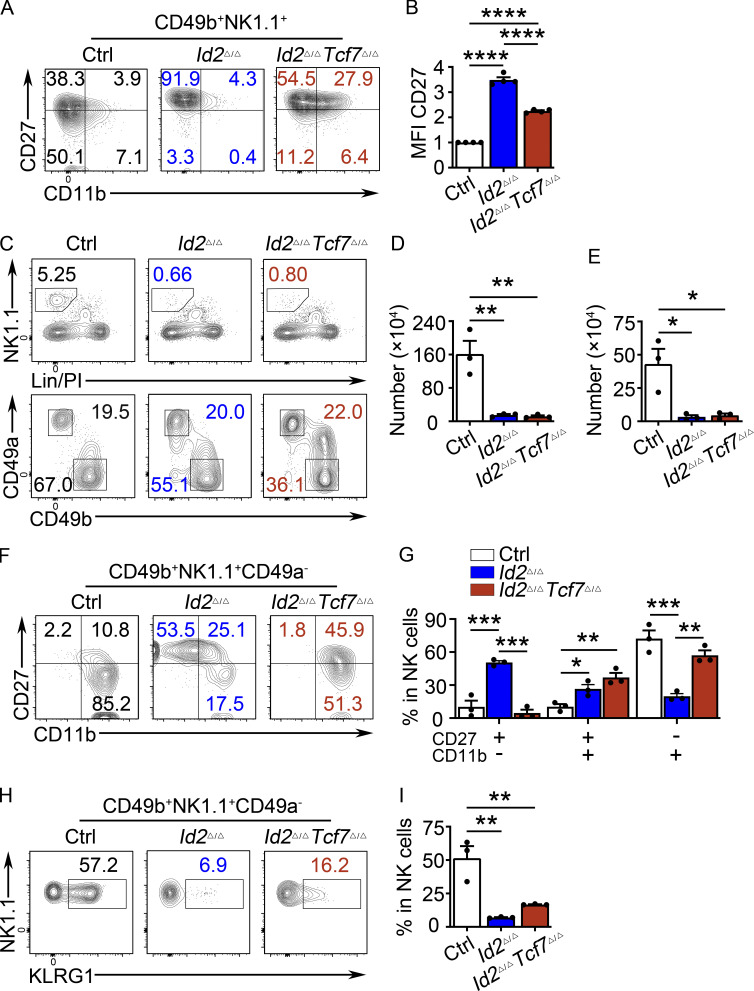
Given the dysregulation of Tcf7 in Id2Δ/Δ NK cells, we hypothesized that TCF1 was critical for the observed maturation arrest. To test this, we deleted both Id2 and Tcf7 in NK cells using Ncr1Cre (Id2Δ/ΔTcf7Δ/Δ). NK cell numbers in the BM and spleen were similarly low in Id2Δ/Δ and Id2Δ/ΔTcf7Δ/Δ mice (Fig. 5, A and D). However, TCF1 was necessary for the arrested maturation in Id2Δ/Δ NK cells as there was an increased frequency of CD27+CD11b+ and CD27−CD11b+ NK cells and a decreased frequency of CD27+CD11b− NK cells in Id2Δ/ΔTcf7Δ/Δ mice compared with Id2Δ/Δ mice (Fig. 5, E–G). In vitro, Id2Δ/ΔTcf7Δ/Δ NK cells grew in IL-15 and had a CD27 MFI intermediate between that of Ctrl and Id2Δ/Δ cells (Fig. S3, A and B). NK cell maturation was also restored in the liver of Id2Δ/ΔTcf7Δ/Δ mice, as evidenced by an increased frequency of CD27−CD11b+ cells and increased expression of KLRG1 (Fig. S3, F–I). ILC1s in the liver were affected by deletion of Id2 using Ncr1Cre, but their numbers are not restored in Id2Δ/ΔTcf7Δ/Δ mice (Fig. S3 E).
Figure 5.
TCF1 is required for the arrested maturation of Id2Δ/Δ NK cells. (A and C) BM and spleen from Id2Δ/ΔTcf7Δ/Δ, Id2Δ/Δ, and Ctrl mice were analyzed by flow cytometry for NK cells. The top panels show lineage (Lin) + PI versus NK1.1+ on lymphoid cells, and the bottom panels show NK1.1 versus CD49b on Lin/PI−NK1.1+ NK cells. Numbers are the percentage of cells in the indicated gates (n = 5). (B and D) Summary of data shown in A and C, respectively, for NK cell numbers per 108 cells. (E) CD49b+NK1.1+ NK cells from BM (top) and spleen (Sp; bottom) were analyzed by flow cytometry for CD27 and CD11b. Numbers indicate the percentage of cells in the respective quadrant (n = 6). (F and G) Summary of data shown in E for BM(F) and spleen (G) for frequencies of different NK cell subsets. Error bars represent SEM (B, D, F, and G). Statistical significance was determined by one-way ANOVA with Tukey’s multiple comparisons test (B, D, F, and G). (H) Log2FC for Id2Δ/Δ/Ctrl or Id2Δ/ΔTcf7Δ/Δ/Ctrl determined from RNA-seq. Data are from comparisons of three biological replicates. Statistical significance determined after adjustment for multiple comparisons. *, P < 0.05; **, P < 0.01; ***, P < 0.005; ****, P < 0.001.
Figure S3.
TCF1 deficiency partially rescues ID2-deficient NK cell maturation in the BM and liver. (A) CD49b+-enriched NK cells from BM were culture in 20 ng/ml IL-15 for 6 d, after which NK1.1+CD49b+ cells were analyzed for CD27 and CD11b by flow cytometry. Numbers indicate the percentage of cells in the respective quadrant (n > 4 from independent experiments). (B) Summary of CD27 MFI for n = 4 in A. MFI of Ctrl NK cells was set as 1 in each experiment. (C) Liver from Id2Δ/ΔTcf7Δ/Δ, Id2Δ/Δ, and Ctrl mice were analyzed by flow cytometry for NK and ILC1 cells. The top panels were from lymphocyte gate, and the bottom panels were from lineage (Lin)/PI−NK1.1+ gate. NK cells are defined as NK1.1+CD49b+CD49a−, and ILC1 cells are defined as NK1.1+CD49b−CD49a+. Numbers are the percentage of cells in the indicated gates (n = 3 from three independent experiments). (D and E) Summary of data shown in C for NK cell and ILC1 cell numbers per 108 cells. (F) NK1.1+CD49b+CD49a− NK cells from the liver were analyzed by flow cytometry for CD27 and CD11b. Numbers indicate the percentage of cells in the respective quadrant (n = 3 from three independent experiments). (G) Summary of data shown in F for frequencies of different NK cell subsets. (H) Flow cytometry plots of KLRG1 expression in Id2Δ/ΔTcf7Δ/Δ, Id2Δ/Δ, and Ctrl mice. Numbers indicate the percentage of cells in the respective quadrant (n = 3; data are from independent experiments). (I) Summary of data shown in H. Error bars represent SEM. Statistical significance was determined by one-way ANOVA with Tukey’s multiple comparisons test (B, D, E, and G) and Holm-Sidak’s multiple comparisons test (I). *, P < 0.05; **P < 0.01; ***, P < 0.005; ****, P < 0.001.
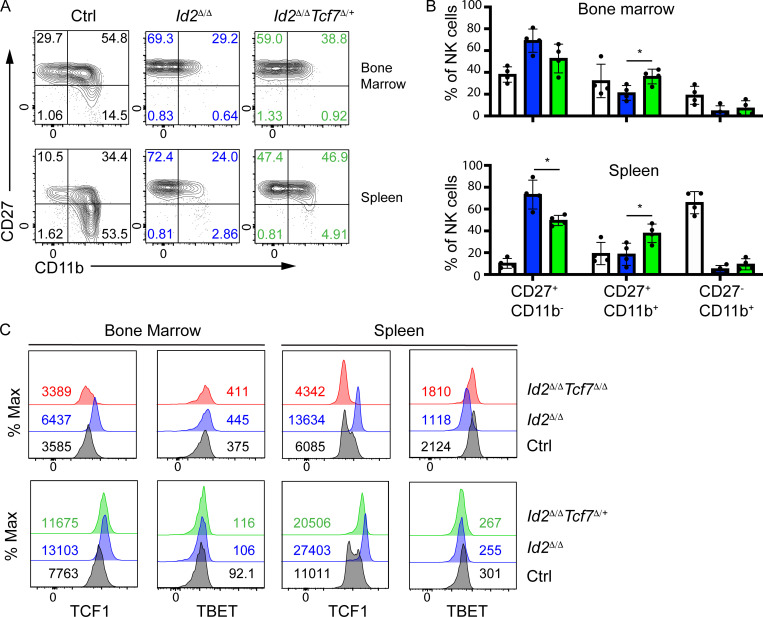
Analysis of Id2Δ/ΔTcf7Δ/+ NK cells revealed a partial restoration of NK cell maturation with an increased frequency of CD27+CD11b+ cells but no alteration in CD27−CD11b+ NK cells in the BM and spleen (Fig. S4, A–C). In the spleen of Id2Δ/ΔTcf7Δ/+, there was also a significant reduction in the frequency of CD27+CD11b− NK cells compared with Id2Δ/Δ mice (Fig. S4, A and C). TCF1 protein was reduced in Id2Δ/ΔTcf7Δ/+ NK cells compared with Id2Δ/Δ NK cells and was similar to the TCF1+ population in Ctrl NK cells, but this was not sufficient for further maturation of NK cells. In contrast, TCF1 protein was absent from Id2Δ/ΔTcf7Δ/Δ NK cells (Fig. S4 D). These observations led us to suggest that both amplitude and temporal regulation of TCF1 are essential for normal maturation. Consistent with this hypothesis, TBET expression was restored to Ctrl levels, or higher, in Id2Δ/ΔTcf7Δ/Δ NK cells but remained low in Id2Δ/ΔTcf7Δ/+ NK cells, suggesting continued Tbx21 repression by TCF1 in the Id2Δ/ΔTcf7Δ/+ NK cells.
Figure S4.
Heterozygous deletion of Tcf7 restores maturation of Id2Δ/Δ NK cells to the CD27+CD11b+ stage. (A) Flow cytometry showing CD27 and CD11b on CD3ε−NK1.1+DX5+ NK cells from the BM (top row) or spleen (bottom row) of Ctrl, Id2Δ/Δ (blue), and Id2Δ/ΔTcf7Δ/+ (green) mice (n = 4 from four independent experiments). (B) Summary of the frequency of each NK cell subset in CD3ε−NK1.1+DX5+ NK cells from the BM (top) or spleen (bottom) of Ctrl, Id2Δ/Δ (blue), and Id2Δ/ΔTcf7Δ/+ (green) mice. Error bars are SEM. *, P < 0.05 determined by one-way ANOVA with Tukey’s multiple comparisons test. (C) Intracellular expression of TCF1 or TBET in BM or spleen NK cells from each of the indicated mouse strains. Numbers are MFI. One representative experiment is shown (n = 2 for Id2Δ/ΔTcf7Δ/+ NK cells and n > 4 for Ctrl, Id2Δ/Δ, and Id2Δ/ΔTcf7Δ/Δ NK cells).
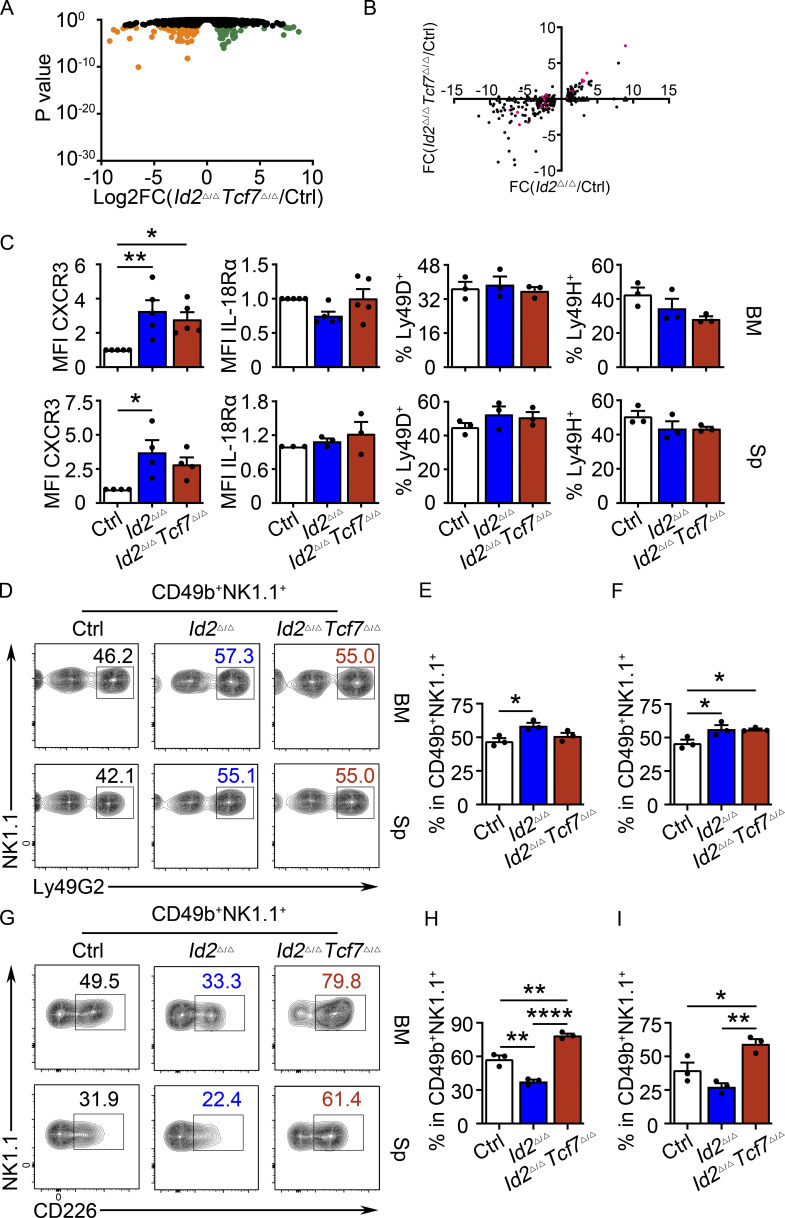
RNA-seq analysis of NK1.1+CD49b+ BM NK cells revealed that 67 genes were decreased in the Id2Δ/ΔTcf7Δ/Δ NK cells (compared with the 138 that were decreased in the Id2Δ/Δ NK cells) and 61 genes were increased (compared with 68 in the Id2Δ/Δ NK cells) when compared with Ctrl NK cells (adj. P > 0.05). Thus, Id2Δ/ΔTcf7Δ/Δ NK cells appeared more similar to Ctrl NK cells than did Id2Δ/Δ NK cells (Fig. S1 C and Fig. S5 A). Indeed, multiple genes that decreased in Id2Δ/Δ NK cells were at least partially restored in the Id2Δ/ΔTcf7Δ/Δ NK cells, with only 7 of 68 genes continuing to be significantly decreased (Fig. S5 B). Itgam was partially restored, whereas Gzma, Fgl2, Slc24a3, Fcer1a, and Klrb1b were restored to the level of Ctrl NK cells (Fig. 5 H). As expected, many proposed E protein target genes continued to be dysregulated in Id2Δ/ΔTcf7Δ/Δ NK cells, including Cd3e, Il4ra, Il21r, Cxcr5, and Cxcr3. However, there were some genes that increased in Id2Δ/Δ NK cells that were closer to Ctrl levels of Id2Δ/ΔTcf7Δ/Δ cells, such as Slamf6 and Drc1, suggesting that they are TCF1 targets rather than E protein targets (Fig. 5 H).
Figure S5.
Partial rescue of NK cell gene expression and surface receptor expression in Id2Δ/ΔTcf7Δ/Δ NK cells. (A) Volcano plot showing Log2FC versus adj. P values for RNA-seq data from Id2Δ/ΔTcf7Δ/Δ and Ctrl NK cells. Data represent three biological replicates. (B) Log2FC for Id2Δ/Δ/Ctrl versus Id2Δ/Δ/Id2Δ/ΔTcf7Δ/Δ for genes that were significant in Id2Δ/Δ/Ctrl (adj. P < 0.05). Each gene is represented by a circle. Pink indicates significance in both comparisons; black indicates significance only in Id2Δ/Δ/Ctrl. (C) Summary of expression of CXCR3, IL-18Rα, Ly49D, and Ly49H on NK cells from BM and spleen (Sp) determined by flow cytometry (n = 3–5 from independent experiments). (D and G) Flow cytometry plots of Ly49G2 and CD226 on NK cells of BM (top) and spleen (bottom) from Id2Δ/ΔTcf7Δ/Δ, Id2Δ/Δ, and Ctrl mice. Numbers are the percentage of cells in the indicated gates (n = 3 from independent experiments). (E and F) Summary of data for Ly49G2 on BM and spleen NK cells. (H and I) Summary of the data for CD226 on BM and spleen NK cells. Error bars represent SEM. Statistical significance was determined by one-way ANOVA with Tukey’s multiple comparisons test. *, P < 0.05; **, P < 0.01; ****, P < 0.001.
TCF1 deficiency in Id2Δ/Δ NK cells restored expression of multiple receptors associated with maturation
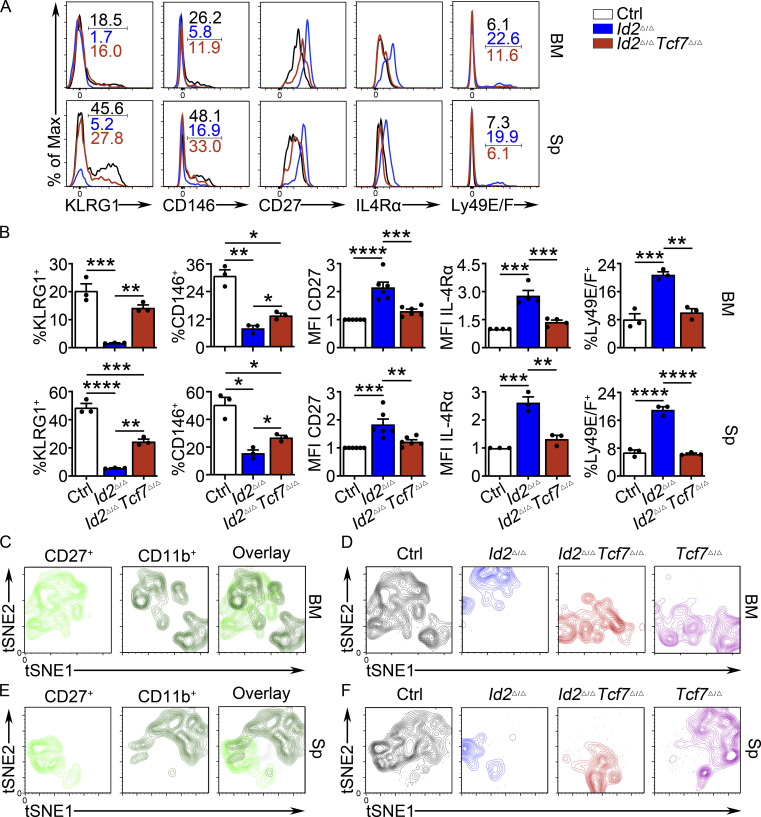
We further investigated the expression of maturation-associated NK cell receptors on Id2Δ/ΔTcf7Δ/Δ NK cells. Both KLRG1 and CD146 (Despoix et al., 2008; neural cell adhesion molecule) were substantially decreased on Id2Δ/Δ NK cells and showed a partial recovery on Id2Δ/ΔTcf7Δ/Δ NK cells in the BM and spleen (Fig. 6, A and B). The MFI for CD27 and IL-4ra was lower on Id2Δ/ΔTcf7Δ/Δ NK cells compared with Id2Δ/Δ NK cells, and the frequency of Ly49E/F+ cells returned to the level of Ctrl NK cells (Fig. 6, A and B; and Fig. S5 C). However, Ly49G2 continued to be increased on Id2Δ/ΔTcf7Δ/Δ splenic NK cells, and CD226 was increased similar to Tcf7Δ/Δ NK cells (Fig. S5, D–H). Therefore, TCF1 was required for dysregulation of multiple NK cell receptors on Id2Δ/Δ NK cells, particularly those associated with NK cell maturation.
Figure 6.
TCF1 deficiency restores NK cell surface receptor expression in Id2Δ/Δ NK cells. (A) Flow cytometry plots of different receptors on NK cells of BM (top) and spleen (Sp; bottom) from Id2Δ/ΔTcf7Δ/Δ (red), Id2Δ/Δ (blue), and Ctrl (black) mice. Numbers are the percentage of cells in the indicated gates. Data represent three to six independent experiments (n = 3–6 for each group). (B) Summary of data shown in A. MFI of Ctrl NK cells was set as 1 in each experiment for CD27 and IL-4Rα. Error bars represent SEM. Statistical significance was determined by one-way ANOVA with Tukey’s multiple comparisons test. *, P < 0.05; **, P < 0.01; ***, P < 0.005; ****, P < 0.001. (C and E) BM and spleen tSNE analysis showing expression of CD27 or CD11b on Ctrl NK1.1+CD49b+ NK cells and the overlay of the two markers. Data are representative of two experiments. (D and F) BM and spleen tSNE analysis on NK1.1+CD49b+ NK cells for each of the indicated genotypes. Plots were generated using surface receptors (NK1.1, CD49b, CD27, CD11b, CD49a, KLRG1, CD146, SLAMF6, CD226, IL4Ra, and CXCR3). Data are representative of two experiments.
To further interrogate the maturation state of Id2Δ/ΔTcf7Δ/Δ BM and spleen NK cells, we performed flow cytometry using a panel of 13 cell surface markers followed by dimensionality reduction using the t-distributed stochastic neighbor embedding (tSNE) algorithm to identify relationships between the cells. NK1.1+CD49b+ cells from the Ctrl, Id2Δ/Δ, Tcf7Δ/Δ, and Id2Δ/ΔTcf7Δ/Δ samples were concatenated and analyzed by tSNE followed by extraction and individual visualization (Fig. 6, C–F). An overlay of CD11b+ or CD27+ cells in Ctrl BM and spleen revealed identifiable clusters of CD27+CD11b−, CD27+CD11b+, and CD27−CD11b+ NK cells (Fig. 6, C and E). Tcf7Δ/Δ NK cells were enriched for cells that clustered near Ctrl CD27−CD11b+ NK cells in the BM and spleen, whereas Id2Δ/Δ NK cells were clustered near Ctrl CD27+CD11b− in the spleen and CD27+CD11b+ NK cells in the BM (Fig. 6, D and F). Strikingly, in the BM, Id2Δ/ΔTcf7Δ/Δ NK cells were found close to CD27−CD11b+ NK cells and overlapped substantially with Tcf7Δ/Δ NK cells (Fig. 6, C and D). In the spleen, Id2Δ/ΔTcf7Δ/Δ NK cells moved toward Ctrl CD27−CD11b+ NK cells along tSNE1 and were distinct from Id2Δ/Δ NK cells (Fig. 6, E and F). Taken together, our analysis reveals that deletion of Tcf7 from Id2Δ/Δ NK cells partially restored their maturation.
Restoration of NK cell functions in Id2Δ/ΔTcf7Δ/Δ NK cells
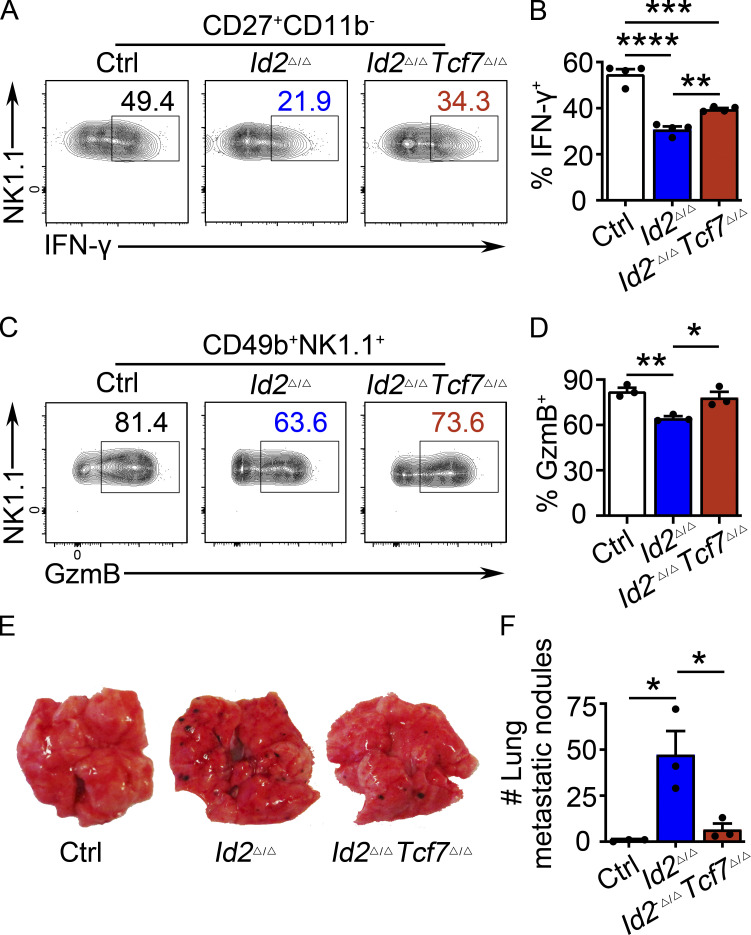
Given the partial restoration of NK cell maturation in Id2Δ/ΔTcf7Δ/Δ compared with Id2Δ/Δ NK cells, we questioned whether Id2Δ/ΔTcf7Δ/Δ NK cells would have restored function. To address this question, we examined functions that were altered in Id2Δ/Δ but not Tcf7Δ/Δ NK cells. Deletion of Tcf7 at least partially restored the ability of Id2Δ/Δ BM and spleen NK cells to produce IFN-γ and GZMB in response to IL-2 + IL-12 (Fig. 7, A–D). Remarkably, Id2Δ/ΔTcf7Δ/Δ NK cells also had a restored ability to prevent B16-F10 melanoma cells from forming tumor nodules in the lung (Fig. 7, E and F). Taken together, these data demonstrate that in addition to allowing for NK cell maturation, deletion of Tcf7 from Id2Δ/Δ NK cells restored at least some of the functional capacity of these cells. Overall, our data reveal that a major function of ID2 during NK cell development was to restrain the expression of TCF1, thus allowing for appropriate maturation and function.
Figure 7.
TCF1 deficiency in Id2Δ/Δ NK cells partially restores NK cell function. (A) CD49b+-enriched NK cells from BM were stimulated by IL-2 and IL-12 to analyze IFN-γ production by flow cytometry. Numbers are the percentage of cells in the indicated gates. Data represent four independent experiments (n = 4 for each group). (B) Summary of data shown in A. (C) CD49b+-enriched NK cells from BM were stimulated by IL-2 and IL-12 to analyze GZMB by flow cytometry. Numbers are the percentage of cells in the indicated gates (n = 3; data are from independent experiments). (D) Summary of data shown in C. (E) Id2Δ/ΔTcf7Δ/Δ, Id2Δ/Δ, and Ctrl mice were injected with B16 cells, and lungs were analyzed for B16 metastases on day 12. Data represent two independent experiments (n = 3 for each group). (F) Summary of data shown in E for numbers of tumor nodules. Error bars represent SEM (B, D, and F). Statistical significance was determined by one-way ANOVA with Tukey’s multiple comparisons test (B, D, and F). *, P < 0.05; **, P < 0.01; ***, P < 0.005; ****, P < 0.001.
Discussion
Constitutive ID2 expression is a hallmark of NK cells and other ILCs, and it is required for their proper development (Vivier et al., 2018; Zook and Kee, 2016). ID2 deficiency arrests NK cell maturation at the CD27+CD11b− stage and transforms these cells into naive-like cells with increased expression of multiple T cell–associated genes (Delconte et al., 2016; Zook et al., 2018). E proteins likely regulate many of these T cell genes, as evidenced by the presence of E boxes in regions that gain accessibility near these genes (Zook et al., 2018). Despite this, the essential targets of the ID2–E protein axis in controlling NK cell maturation were not known. Here, we showed that ID2 limited accessibility and E protein binding at an intronic Tcf7 enhancer and limited TCF1 expression to allow for NK cell maturation. Deletion of TCF1 in the context of ID2 deficiency partially restored a gene program associated with NK cell effector maturation and restored the ability to maximally produce IFN-γ and GZMB in response to the minimal cytokine combination of IL-2 + IL-12. TCF1 deficiency also restored the ability of Id2Δ/Δ NK cells to prevent growth of melanoma cells in a model of metastatic disease. Despite restoration of NK cell maturation and function, we found that the dysregulation of E protein activity continued to impact multiple genes, such as Cxcr3 and Cxcr5, indicating a broader requirement for ID2 in NK cells. Thus, while ID2 has many functions in NK cells, a critical function is to control the amplitude and temporal expression of TCF1 to allow for its dynamic modulation during NK cell maturation.
TCF1 is expressed at the inception of NK cell development, but its expression declines as NK cells mature into CD27−CD11b+ cells (Jeevan-Raj et al., 2017). Loss-of-function studies revealed an important role for TCF1 in NKPs (precursor NKP and revised NKP), where it restrains Gzmb and promotes the expression of Ly49A (Jeevan-Raj et al., 2017). Despite the loss of NKPs in Tcf7−/− mice, a notable population of terminally differentiated CD11b+ NK cells develop, even under competitive conditions, suggesting that TCF1 restrains maturation. Using a conditional allele of Tcf7 with deletion only in NKp46+ cells, we found no alteration in Gzmb transcription but confirmed that TCF1 was required for optimal NK cell numbers and proper expression of some receptors. In mature NK cells, TCF1 critically supported production of IFN-γ downstream of NK1.1 receptor ligation and was required for missing self-recognition (Jeevan-Raj et al., 2017). Consistent with our findings here, constitutive ectopic expression of full-length TCF1 is sufficient to arrest NK cell maturation in otherwise normal NK cells (Jeevan-Raj et al., 2017).
Our findings indicate that E proteins interfere with both the amplitude and the temporal regulation of TCF1 since Id2Δ/Δ NK cells with a heterozygous mutation in Tcf7 have near Ctrl levels of TCF1 but fail to undergo terminal maturation and fail to upregulate TBET. Thus, E proteins must be kept inactive for maturation to occur. E2A binds to the Tcf7 intronic region in memory CD8 T cells, whereas ID2 prevents memory cell formation (Masson et al., 2013). Our observations raise multiple questions about how this intronic region functions, including whether E proteins are required for its initial activation in NK cells or whether the loss of Tcf7 mRNA during NK cell maturation requires repression of this “enhancer.” At present, it is not known how Tcf7 downregulation occurs in NK cells, but computational analysis of chromatin accessibility in human NK cell subsets led to the hypothesis that BLIMP1, a transcriptional repressor expressed in and required for NK cell maturation, may play a role (Collins et al., 2019; Kallies et al., 2011). In tissue-resident CD8 T cells, Blimp1 binds to the Tcf7 gene, although none of the binding sites overlap with the intronic region affected by ID2 deficiency in NK cells (Mackay et al., 2016). The transcriptional repressor ZEB2, which binds to paired E box sequences, is also implicated in NK cell maturation and represses the memory gene program in CD8 T cells (Dominguez et al., 2015; Omilusik et al., 2015; van Helden et al., 2015). We note that the Tcf7 intronic region identified here also contains putative ZEB2 binding sites and that this region becomes less accessible with NK cell maturation (data not shown). Indeed, competition between E proteins and ZEB2 at closely spaced E box sites has been proposed in other contexts (Remacle et al., 1999; Sekido et al., 1997). Consistent with this possibility, Masson et al. (2013) demonstrated that ectopic expression of Tbx21, encoding TBET, resulted in decreased Tcf7 transcription in ID2-deficient CD8 T cells, where TBET induces Zeb2 (Dominguez et al., 2015). However, a third, and not mutually exclusive, possibility is that the increased expression of ID2 during NK cell maturation modulates E protein binding at this intronic enhancer, passing a critical threshold that results in extinguished transcription of Tcf7. In either scenario, increased E protein function augments Tcf7 transcription and prevents its downregulation. IL-12 signals the downregulation of TCF1 during CD8 T cell effector differentiation through a STAT4 dependent mechanism (Danilo et al., 2018). IL-12 has been shown to induce both TBET and ID2 in CD8 T cells and, thus, could inhibit TCF1 expression through either or both these mechanisms (Gray et al., 2014; Yang et al., 2011).
TCF1 is expressed in both naive and memory CD8 T cells, but its expression is substantially higher in naive cells where ID2 expression is low (Xing et al., 2016; Yang et al., 2011). TCF1 is associated with CD8 T cell self-renewal and stem cell–like properties, and this is consistent with its requirement in CD27+CD11b− NK cells, which function as a reservoir for NK cell effector differentiation and for adaptive NK cells generated in the context of mouse CMV infection (Jadhav et al., 2019; Kamimura and Lanier, 2015; Lin et al., 2016). Recent studies have identified TCF1 in a subset of exhausted CD8 T cells that retain the ability to be reinvigorated by checkpoint blockade in chronic viral infections and tumors (Beltra et al., 2020; Im et al., 2020; Utzschneider et al., 2016). The population most available for reprograming expresses Slamf6 (Beltra et al., 2020), reminiscent of our observation that Slamf6 mRNA is increased on Id2Δ/Δ CD27+CD11b− NK cells and restored to near WT levels after deletion of TCF1. Whether Slamf6 is an important mediator of TCF1 functions in self-renewal and NK cell maturation remains to be investigated; however, these observations suggest striking parallels between the transcriptional programs in self-renewing CD8 T cells and CD27+CD11b− or CD56bright NK cells in mice and humans. Thus, our data also suggest that in the context of NK cell and possibly T cell exhaustion, reducing ID2 expression could lead to increased Tcf7 transcription and induction of the stem cell–like state, allowing for reinvigoration of these cells.
Our data reveal that loss of TCF1 does not completely overcome the need for ID2 in NK cell maturation. We note that many genes that decline during this process have increased expression and increased chromatin accessibility at regions that contain E boxes and, therefore, likely fail to be downregulated because of the continued high E protein function. These genes may be TCF1 targets in CD27+CD11b− NK cells but could also be TCF1-independent genes that are coopted by E proteins in the absence of ID2. In addition, genes not traditionally associated with NK cell development are augmented in Id2Δ/Δ NK cell such as Cxcr5, encoding a chemokine receptor directing cells into the germinal center. Our data raise the possibility that these genes could be turned on by modulating expression of ID2 independent of the function of TCF1. Interestingly, CXCR5 is expressed on a subset of NK cells that traffic to germinal centers and can impact the generation of antibody responses (Rydyznski et al., 2015; Rydyznski et al., 2018). Thus, modulation of E protein activity may be useful therapeutically to manipulate the germinal center tropism of NK cells. Overall, our data demonstrate that ID2 controls the amplitude and temporal dynamics of TCF1 to program NK cell maturation.
Materials and methods
Mice
All experiments were performed in accordance with the guidelines and approval of The University of Chicago Institutional Animal Care and Use Committee. Ncr1CreId2f/f, Ncr1CreTcf7f/f, and Ncr1CreId2f/fTcf7f/f mice were bred and maintained on the C57BL/6 background. Tcf7F/F mice were provided by Fotini Gounari (The University of Chicago, Chicago, IL), and Ncr1Cre mice were provided by Eric Vivier (Aix Marseille University, Marseille, France). Experimental mice used were age- and sex-matched littermates whenever possible.
Flow cytometry
After single-cell suspension was prepared from BM and spleen, cells were pretreated with Fc block (2.4G2). In some experiments, a lineage cocktail of biotin-CD3ε, TCRβ, and γδTCR was used as indicated before surface marker staining. After surface staining, intracellular staining for TCF1 was performed with Foxp3/transcription factor staining buffer set (00-5523; eBioscience). In some experiments, propidium iodide (PI) was included to exclude dead cells. Data were acquired on an LSRFortessa 4-15 or LSRFortessa X20 flow cytometer (BD Biosciences) and were analyzed using FlowJo v10 software.
The following antibodies were from eBioscience: biotin-TCRβ (H57-597, 13-5961-85, 1:400), biotin-CD3ε (145-2C11, 13-0031-86, 1:400), biotin-γδTCR (UC7-13D5, 13-5811-85, 1:400), PerCp-cyanine5.5-streptavidin (45-4317-82, 1:400), FITC-CD49b (DX5,11-5971-85), PE-CD49b (DX5, 12-5971-82), eFluor450-CD49b (DX5, 48-5971-82), APC-NK1.1 (PK136, 17-5941-82), eFluor450-NK1.1 (PK136, 48-5941-82), PE-cyanine7-CD11b (M1/70, 25-0112-82, 1:400), APC-eFluor780-CD27 (LG.7F9, 47-0271-82), APC-KLRG1 (2F1, 17-5893-82), APC-Ly49D (eBio4E5, 17-5782-82), PE-Ly49H (3D10, 12-5886-82), APC-Ly49E/F (CM4, 17-5848-80), FITC-Ly49G2 (eBio4D11, 11-5781-82), APC-CD226 (10E5, 17-2261-82), and FITC-CD244 (eBio244F4, 11-2441-85, 1:200). Alexa Fluor 647–IL-18Rα (BG/IL18RA, 132903, 1:100) and Alexa Fluor 488–CD146 (ME-9F1, 134708) were from BioLegend. PE-IL-4Rα (mIL4R-M1, 552509, 1:200) was from BD Biosciences. Alexa Fluor 488–TCF1 (C63D9, #6444, 1:200) was from Cell Signaling Technology.
tSNE analysis was performed using FlowJo software. The cells were stained with 13 fluorochromes to label CD3/TCRb, NK1.1, CD49b, CD27, CD11b, KLRG1, CD146, SLAMF6, CD226, IL4Ra, CXCR3, Ly49E/F, and LY49G2 and the live/dead discrimination dye NIR. For analysis, CD3/TCRb−NK1.1+CD49b+ cells from all samples were concatenated, and clustering was performed using all markers or after removal of LY49E/F and LY49G2 since these markers did not impact the result but caused a visual division of clusters that was not maturation associated in the tSNE plot.
In vitro analysis of NK cell function
CD49b+ NK cells were enriched by magnetic sorting (Miltenyi) from BM. For stimulation through NK1.1, 10 µg/ml anti-NK1.1 (PK136, 108701; BioLegend) in NaHCO3 (pH 9.2) was precoated on an ELISA plate (655081; Greiner Bio-One). After culture in 20 ng/ml murine IL-15 (210-15; PeproTech) overnight, NK cells were then added to the plate with Brefeldin A (555029; BD Biosciences) for the last 4.5 h. For stimulation through cytokines, NK cells were cultured with 1,000 U/ml IL-2 (212-12; PeproTech) and 10 ng/ml IL-12 (210-12, PeproTech) overnight and Brefeldin A for the last 4.5 h. Cytofix/Cytoperm Fixation/Permeabilization Kit (554714; BD Biosciences) was used to detect IFN-γ (XMG1.2, 12-7311-81; eBioscience), and Cyto-Fast Fix/Perm Buffer Set (426803; BioLegend) was used to detect GZMB (QA16A02, 372207; BioLegend) according to the manufacturer’s instructions.
Killing assays
Mice were primed with 200 µg polyinosinic:polycytidylic acid (P1530; Sigma) by intraperitoneal injection. 24 h later, splenocytes from β2m-deficient and WT mice were depleted of red blood cells using ACK Lysing Buffer (A10492-01; Gibco) and labeled with 5 µM and 0.5 µM CFSE (C34554; Molecular Probes), respectively, and a mixture of 1 × 10⁶ H-2b (WT), and 1 × 10⁶ β2m-deficient cells were injected into mice through the retro-orbital vein. Recipient spleens were analyzed 18 h later by flow cytometry for the presence of transferred CSFE-labeled cells. The specific rejection was calculated as follows: 100 × [1 – (percentage of β2m-deficient (CFSEhigh) final / percentage of H-2b (CFSElow) final) / (percentage of β2m-deficient (CFSEhigh) initial / percentage of H-2b (CFSElow) initial)].
B16-F10 melanoma assay
B16-F10 melanoma cells were grown in F10 medium, and mice were given a retro-orbital injection of 5 × 10⁴ B16 melanoma cells. On day 12 after injection, lungs were collected, and B16 tumor nodules were counted using a dissecting microscope.
ChIP
NK1.1+CD49b+ cells were isolated from the BM and spleen of WT and Id2Δ/Δ mice by cell sorting, and ChIP was performed following the ChIPmentation protocol (Schmidl et al., 2015). Briefly, cells were fixed in 1% formaldehyde and quenched in 0.125 M glycine followed by sonication. Chromatin was incubated overnight at 4°C with 5 µg anti-TCF1 rabbit mAb (C63D9; Cell Signaling) and was immunoprecipitated using protein A beads that were precleared overnight at 4°C in radioimmunoprecipitation buffer. DNA from input and ChIP samples was amplified for 12 cycles using Nextera primers, and ChIP quantitative PCR was performed using the gene-specific primers. Amplification with gene-specific primers was normalized to input. E protein ChIP was performed using anti-E2A (sc-133075; Santa Cruz Biotechnologies) and anti-Tcf12 (SAB3500566; Sigma).
RNA-seq
NK cells were enriched from BM using biotin-CD49b antibody (DX5, 13-5971-85; eBioscience) by magnetic sorting (Miltenyi) followed by flow cytometric sorting for NK1.1+CD49b+ cells. Purified NK cells 2 × 10⁴ were sorted into RNeasy lysis buffer and total RNA was isolated using the RNeasy Micro Kit (QIAGEN) according to the manufacturer’s directions. Libraries were constructed using Nugen’s Ultralow Library Systems and were subsequently subjected to 76 cycles of NextSeq 500 sequencing. Sequencing data were processed as described previously (Jacobsen et al., 2020). Data are available through the Gene Expression Omnibus (accession no. GSE156046).
Integration of ATAC-seq and ChIP-seq data
ATAC-seq was performed on Ctrl and GzmbCreId2F/F CD27+CD11b− NK cells as described previously (Xu et al., 2015; Zook et al., 2018; Gene Expression Omnibus accession no. GSE109518). These data were reanalyzed and visualized on the Integrated Genome Viewer from the Broad Institute. TCF1 ChIP-seq data were from Gene Expression Omnibus accession no. GSE73239 (ChIP, GSM1889262; input, GSM1889251) and (ChIP, GSM1258235; IgG, GSM1258239) and were mapped to mm10 using Burrows–Wheeler Aligner MEM, PCR duplicates were removed using Picard MarkDuplicates, and peaks were called using MACS2. The two ChIP samples were compared to generate a list of overlapping high-confidence peaks that were then compared with the ATAC-seq data.
Statistics
All statistical analyses were performed using GraphPad Prism 8 software and two-tailed t test, after determining equal variance, unless otherwise indicated.
Online supplemental materials
Fig. S1 shows increased CD27 on Id2Δ/Δ NK cells cultured in vitro and the analysis of RNA-seq data from Ctrl and Id2Δ/Δ BM NK cells. Fig. S2 shows the sequence of the intronic region of Tcf7 bound by E proteins in Id2Δ/Δ NK cells, the overlap of TCF1 binding sites in CD8 T cells with changes in chromatin accessibility in Id2Δ/Δ NK cells, and the analysis of gene and protein changes in Tcf7Δ/Δ BM NK cells. Fig. S3 shows the analysis of NK cell and ILC1 numbers and phenotype in the liver Id2Δ/ΔTcf7Δ/Δ mice. Fig. S4 shows the analysis of NK cell maturation in Id2Δ/ΔTcf7Δ/+ mice and expression of TCF1 and TBET in the BM and spleen of Ctrl, Id2Δ/Δ, Id2Δ/ΔTcf7Δ/+, and Id2Δ/ΔTcf7Δ/Δ mice. Fig. S5 shows the analysis of RNA-seq data from Id2Δ/ΔTcf7Δ/Δ BM NK cells and the restoration of multiple NK cell receptors on Id2Δ/ΔTcf7Δ/Δ NK cells.
Acknowledgments
We thank the members of the Kee Lab and M. Verykokakis for helpful conversations and comments on the manuscript, G. van der Voort and S. Cuthbert for technical assistance, T. Gajewski (University of Chicago, Chicago, IL) for the B16-F10 melanoma cells, E. Vivier for the Ncr1Cre mice, and F. Gounari for the Tcf7F/F mice and for helpful discussions. We thank the Cytometry and Antibody Technology and the Functional Genomics Facility cores at The University of Chicago and The University of Chicago Comprehensive Cancer Center for support.
This work was supported by National Institutes of Allergy and Infectious Diseases grants R01 AI106352 (B.L. Kee) and National Cancer Institute grant P30 CA014599 (The University of Chicago Comprehensive Cancer Center).
Author contributions: Z.-Y. Li designed, performed, and analyzed experiments; edited the manuscript; and assembled the figures. R.E. Morman performed and analyzed experiments. E. Hegermiller performed and analyzed experiments. M. Sun performed and analyzed experiments. E.T. Bartom performed the bioinformatic analysis on the RNA-seq data. M. Maienschein-Cline performed the bioinformatic analysis on the ATAC-seq, RNA-seq, and ChIP-seq data. M. Sigvardsson sequenced RNA. B.L. Kee conceptualized the project, analyzed and interpreted data, wrote the manuscript, and obtained funding.
References
- Beltra, J.C., Manne S., Abdel-Hakeem M.S., Kurachi M., Giles J.R., Chen Z., Casella V., Ngiow S.F., Khan O., Huang Y.J., et al. 2020. Developmental relationships of four exhausted CD8+ T Cell subsets reveals underlying transcriptional and epigenetic landscape control mechanisms. Immunity. 52:825–841.e8. 10.1016/j.immuni.2020.04.014 [DOI] [PMC free article] [PubMed] [Google Scholar]
- Boos, M.D., Yokota Y., Eberl G., and Kee B.L.. 2007. Mature natural killer cell and lymphoid tissue-inducing cell development requires Id2-mediated suppression of E protein activity. J. Exp. Med. 204:1119–1130. 10.1084/jem.20061959 [DOI] [PMC free article] [PubMed] [Google Scholar]
- Chiossone, L., Chaix J., Fuseri N., Roth C., Vivier E., and Walzer T.. 2009. Maturation of mouse NK cells is a 4-stage developmental program. Blood. 113:5488–5496. 10.1182/blood-2008-10-187179 [DOI] [PubMed] [Google Scholar]
- Collins, P.L., Cella M., Porter S.I., Li S., Gurewitz G.L., Hong H.S., Johnson R.P., Oltz E.M., and Colonna M.. 2019. Gene regulatory programs conferring phenotypic identities to human NK cells. Cell. 176:348–360.e12. 10.1016/j.cell.2018.11.045 [DOI] [PMC free article] [PubMed] [Google Scholar]
- Danilo, M., Chennupati V., Silva J.G., Siegert S., and Held W.. 2018. Suppression of Tcf1 by inflammatory cytokines facilitates effector CD8 T cell differentiation. Cell Rep. 22:2107–2117. 10.1016/j.celrep.2018.01.072 [DOI] [PubMed] [Google Scholar]
- Daussy, C., Faure F., Mayol K., Viel S., Gasteiger G., Charrier E., Bienvenu J., Henry T., Debien E., Hasan U.A., et al. 2014. T-bet and Eomes instruct the development of two distinct natural killer cell lineages in the liver and in the bone marrow. J. Exp. Med. 211:563–577. 10.1084/jem.20131560 [DOI] [PMC free article] [PubMed] [Google Scholar]
- Delconte, R.B., Shi W., Sathe P., Ushiki T., Seillet C., Minnich M., Kolesnik T.B., Rankin L.C., Mielke L.A., Zhang J.G., et al. 2016. The helix-loop-helix protein ID2 governs NK cell fate by tuning their sensitivity to interleukin-15. Immunity. 44:103–115. 10.1016/j.immuni.2015.12.007 [DOI] [PubMed] [Google Scholar]
- Despoix, N., Walzer T., Jouve N., Blot-Chabaud M., Bardin N., Paul P., Lyonnet L., Vivier E., Dignat-George F., and Vély F.. 2008. Mouse CD146/MCAM is a marker of natural killer cell maturation. Eur. J. Immunol. 38:2855–2864. 10.1002/eji.200838469 [DOI] [PubMed] [Google Scholar]
- Dominguez, C.X., Amezquita R.A., Guan T., Marshall H.D., Joshi N.S., Kleinstein S.H., and Kaech S.M.. 2015. The transcription factors ZEB2 and T-bet cooperate to program cytotoxic T cell terminal differentiation in response to LCMV viral infection. J. Exp. Med. 212:2041–2056. 10.1084/jem.20150186 [DOI] [PMC free article] [PubMed] [Google Scholar]
- Emmanuel, A.O., Arnovitz S., Haghi L., Mathur P.S., Mondal S., Quandt J., Okoreeh M.K., Maienschein-Cline M., Khazaie K., Dose M., and Gounari F.. 2018. TCF-1 and HEB cooperate to establish the epigenetic and transcription profiles of CD4+CD8+ thymocytes. Nat. Immunol. 19:1366–1378. 10.1038/s41590-018-0254-4 [DOI] [PMC free article] [PubMed] [Google Scholar]
- Freud, A.G., Mundy-Bosse B.L., Yu J., and Caligiuri M.A.. 2017. The broad spectrum of human natural killer cell diversity. Immunity. 47:820–833. 10.1016/j.immuni.2017.10.008 [DOI] [PMC free article] [PubMed] [Google Scholar]
- Gordon, S.M., Chaix J., Rupp L.J., Wu J., Madera S., Sun J.C., Lindsten T., and Reiner S.L.. 2012. The transcription factors T-bet and Eomes control key checkpoints of natural killer cell maturation. Immunity. 36:55–67. 10.1016/j.immuni.2011.11.016 [DOI] [PMC free article] [PubMed] [Google Scholar]
- Gray, S.M., Kaech S.M., and Staron M.M.. 2014. The interface between transcriptional and epigenetic control of effector and memory CD8+ T-cell differentiation. Immunol. Rev. 261:157–168. 10.1111/imr.12205 [DOI] [PMC free article] [PubMed] [Google Scholar]
- Held, W., Kunz B., Lowin-Kropf B., van de Wetering M., and Clevers H.. 1999. Clonal acquisition of the Ly49A NK cell receptor is dependent on the trans-acting factor TCF-1. Immunity. 11:433–442. 10.1016/S1074-7613(00)80118-1 [DOI] [PubMed] [Google Scholar]
- Held, W., Clevers H., and Grosschedl R.. 2003. Redundant functions of TCF-1 and LEF-1 during T and NK cell development, but unique role of TCF-1 for Ly49 NK cell receptor acquisition. Eur. J. Immunol. 33:1393–1398. 10.1002/eji.200323840 [DOI] [PubMed] [Google Scholar]
- Im, S.J., Hashimoto M., Gerner M.Y., Lee J., Kissick H.T., Burger M.C., Shan Q., Hale J.S., Lee J., Nasti T.H., et al. 2016. Defining CD8+ T cells that provide the proliferative burst after PD-1 therapy. Nature. 537:417–421. 10.1038/nature19330 [DOI] [PMC free article] [PubMed] [Google Scholar]
- Im, S.J., Konieczny B.T., Hudson W.H., Masopust D., and Ahmed R.. 2020. PD-1+ stemlike CD8 T cells are resident in lymphoid tissues during persistent LCMV infection. Proc. Natl. Acad. Sci. USA. 117:4292–4299. 10.1073/pnas.1917298117 [DOI] [PMC free article] [PubMed] [Google Scholar]
- Intlekofer, A.M., Takemoto N., Wherry E.J., Longworth S.A., Northrup J.T., Palanivel V.R., Mullen A.C., Gasink C.R., Kaech S.M., Miller J.D., et al. 2005. Effector and memory CD8+ T cell fate coupled by T-bet and eomesodermin. Nat. Immunol. 6:1236–1244. 10.1038/ni1268 [DOI] [PubMed] [Google Scholar]
- Jacobsen, J.A., Bartom E.T., Sigvardsson M., and Kee B.L.. 2020. Ezh2 represses transcription of innate lymphoid genes in B lymphocyte progenitors and maintains the B-2 cell fate. J. Immunol. 204:1760–1769. 10.4049/jimmunol.1901188 [DOI] [PMC free article] [PubMed] [Google Scholar]
- Jadhav, R.R., Im S.J., Hu B., Hashimoto M., Li P., Lin J.X., Leonard W.J., Greenleaf W.J., Ahmed R., and Goronzy J.J.. 2019. Epigenetic signature of PD-1+ TCF1+ CD8 T cells that act as resource cells during chronic viral infection and respond to PD-1 blockade. Proc. Natl. Acad. Sci. USA. 116:14113–14118. 10.1073/pnas.1903520116 [DOI] [PMC free article] [PubMed] [Google Scholar]
- Jeevan-Raj, B., Gehrig J., Charmoy M., Chennupati V., Grandclément C., Angelino P., Delorenzi M., and Held W.. 2017. The transcription factor Tcf1 contributes to normal NK cell development and function by limiting the expression of granzymes. Cell Rep. 20:613–626. 10.1016/j.celrep.2017.06.071 [DOI] [PubMed] [Google Scholar]
- Kallies, A., Carotta S., Huntington N.D., Bernard N.J., Tarlinton D.M., Smyth M.J., and Nutt S.L.. 2011. A role for Blimp1 in the transcriptional network controlling natural killer cell maturation. Blood. 117:1869–1879. 10.1182/blood-2010-08-303123 [DOI] [PubMed] [Google Scholar]
- Kamimura, Y., and Lanier L.L.. 2015. Homeostatic control of memory cell progenitors in the natural killer cell lineage. Cell Rep. 10:280–291. 10.1016/j.celrep.2014.12.025 [DOI] [PMC free article] [PubMed] [Google Scholar]
- Kunz, B., and Held W.. 2001. Positive and negative roles of the trans-acting T cell factor-1 for the acquisition of distinct Ly-49 MHC class I receptors by NK cells. J. Immunol. 166:6181–6187. 10.4049/jimmunol.166.10.6181 [DOI] [PubMed] [Google Scholar]
- Lin, W.W., Nish S.A., Yen B., Chen Y.H., Adams W.C., Kratchmarov R., Rothman N.J., Bhandoola A., Xue H.H., and Reiner S.L.. 2016. CD8+ T lymphocyte self-renewal during effector cell determination. Cell Rep. 17:1773–1782. 10.1016/j.celrep.2016.10.032 [DOI] [PMC free article] [PubMed] [Google Scholar]
- Mackay, L.K., Minnich M., Kragten N.A., Liao Y., Nota B., Seillet C., Zaid A., Man K., Preston S., Freestone D., et al. 2016. Hobit and Blimp1 instruct a universal transcriptional program of tissue residency in lymphocytes. Science. 352:459–463. 10.1126/science.aad2035 [DOI] [PubMed] [Google Scholar]
- Masson, F., Minnich M., Olshansky M., Bilic I., Mount A.M., Kallies A., Speed T.P., Busslinger M., Nutt S.L., and Belz G.T.. 2013. Id2-mediated inhibition of E2A represses memory CD8+ T cell differentiation. J. Immunol. 190:4585–4594. 10.4049/jimmunol.1300099 [DOI] [PMC free article] [PubMed] [Google Scholar]
- Omilusik, K.D., Best J.A., Yu B., Goossens S., Weidemann A., Nguyen J.V., Seuntjens E., Stryjewska A., Zweier C., Roychoudhuri R., et al. 2015. Transcriptional repressor ZEB2 promotes terminal differentiation of CD8+ effector and memory T cell populations during infection. J. Exp. Med. 212:2027–2039. 10.1084/jem.20150194 [DOI] [PMC free article] [PubMed] [Google Scholar]
- Remacle, J.E., Kraft H., Lerchner W., Wuytens G., Collart C., Verschueren K., Smith J.C., and Huylebroeck D.. 1999. New mode of DNA binding of multi-zinc finger transcription factors: deltaEF1 family members bind with two hands to two target sites. EMBO J. 18:5073–5084. 10.1093/emboj/18.18.5073 [DOI] [PMC free article] [PubMed] [Google Scholar]
- Rydyznski, C., Daniels K.A., Karmele E.P., Brooks T.R., Mahl S.E., Moran M.T., Li C., Sutiwisesak R., Welsh R.M., and Waggoner S.N.. 2015. Generation of cellular immune memory and B-cell immunity is impaired by natural killer cells. Nat. Commun. 6:6375. 10.1038/ncomms7375 [DOI] [PMC free article] [PubMed] [Google Scholar]
- Rydyznski, C.E., Cranert S.A., Zhou J.Q., Xu H., Kleinstein S.H., Singh H., and Waggoner S.N.. 2018. Affinity maturation is impaired by natural killer cell suppression of germinal centers. Cell Rep. 24:3367–3373.e4. 10.1016/j.celrep.2018.08.075 [DOI] [PMC free article] [PubMed] [Google Scholar]
- Schmidl, C., Rendeiro A.F., Sheffield N.C., and Bock C.. 2015. ChIPmentation: fast, robust, low-input ChIP-seq for histones and transcription factors. Nat. Methods. 12:963–965. 10.1038/nmeth.3542 [DOI] [PMC free article] [PubMed] [Google Scholar]
- Sekido, R., Murai K., Kamachi Y., and Kondoh H.. 1997. Two mechanisms in the action of repressor deltaEF1: binding site competition with an activator and active repression. Genes Cells. 2:771–783. 10.1046/j.1365-2443.1997.1570355.x [DOI] [PubMed] [Google Scholar]
- Shan, Q., Hu S., Chen X., Danahy D.B., Badovinac V.P., Zang C., and Xue H.H.. 2020. Ectopic Tcf1 expression instills a stem-like program in exhausted CD8+ T cells to enhance viral and tumor immunity. Cell. Mol. Immunol. 10.1038/s41423-020-0436-5 [DOI] [PMC free article] [PubMed] [Google Scholar]
- Steinke, F.C., Yu S., Zhou X., He B., Yang W., Zhou B., Kawamoto H., Zhu J., Tan K., and Xue H.H.. 2014. TCF-1 and LEF-1 act upstream of Th-POK to promote the CD4(+) T cell fate and interact with Runx3 to silence Cd4 in CD8(+) T cells. Nat. Immunol. 15:646–656. 10.1038/ni.2897 [DOI] [PMC free article] [PubMed] [Google Scholar]
- Sun, J.C., and Lanier L.L.. 2011. NK cell development, homeostasis and function: parallels with CD8+ T cells. Nat. Rev. Immunol. 11:645–657. 10.1038/nri3044 [DOI] [PMC free article] [PubMed] [Google Scholar]
- Utzschneider, D.T., Charmoy M., Chennupati V., Pousse L., Ferreira D.P., Calderon-Copete S., Danilo M., Alfei F., Hofmann M., Wieland D., et al. 2016. T cell factor 1-expressing memory-like CD8(+) T cells sustain the immune response to chronic viral infections. Immunity. 45:415–427. 10.1016/j.immuni.2016.07.021 [DOI] [PubMed] [Google Scholar]
- van Helden, M.J., Goossens S., Daussy C., Mathieu A.L., Faure F., Marçais A., Vandamme N., Farla N., Mayol K., Viel S., et al. 2015. Terminal NK cell maturation is controlled by concerted actions of T-bet and Zeb2 and is essential for melanoma rejection. J. Exp. Med. 212:2015–2025. 10.1084/jem.20150809 [DOI] [PMC free article] [PubMed] [Google Scholar]
- Vivier, E., Artis D., Colonna M., Diefenbach A., Di Santo J.P., Eberl G., Koyasu S., Locksley R.M., McKenzie A.N.J., Mebius R.E., et al. 2018. Innate lymphoid cells: 10 years on. Cell. 174:1054–1066. 10.1016/j.cell.2018.07.017 [DOI] [PubMed] [Google Scholar]
- Walzer, T., Bléry M., Chaix J., Fuseri N., Chasson L., Robbins S.H., Jaeger S., André P., Gauthier L., Daniel L., et al. 2007. Identification, activation, and selective in vivo ablation of mouse NK cells via NKp46. Proc. Natl. Acad. Sci. USA. 104:3384–3389. 10.1073/pnas.0609692104 [DOI] [PMC free article] [PubMed] [Google Scholar]
- Xing, S., Li F., Zeng Z., Zhao Y., Yu S., Shan Q., Li Y., Phillips F.C., Maina P.K., Qi H.H., et al. 2016. Tcf1 and Lef1 transcription factors establish CD8(+) T cell identity through intrinsic HDAC activity. Nat. Immunol. 17:695–703. 10.1038/ni.3456 [DOI] [PMC free article] [PubMed] [Google Scholar]
- Xu, Y., Evaristo C., Alegre M.L., Gurbuxani S., and Kee B.L.. 2015. Analysis of GzmbCre as a model system for gene deletion in the natural killer cell lineage. PLoS One. 10:e0125211. 10.1371/journal.pone.0125211 [DOI] [PMC free article] [PubMed] [Google Scholar]
- Yang, C.Y., Best J.A., Knell J., Yang E., Sheridan A.D., Jesionek A.K., Li H.S., Rivera R.R., Lind K.C., D’Cruz L.M., et al. 2011. The transcriptional regulators Id2 and Id3 control the formation of distinct memory CD8+ T cell subsets. Nat. Immunol. 12:1221–1229. 10.1038/ni.2158 [DOI] [PMC free article] [PubMed] [Google Scholar]
- Yokota, Y., Mansouri A., Mori S., Sugawara S., Adachi S., Nishikawa S., and Gruss P.. 1999. Development of peripheral lymphoid organs and natural killer cells depends on the helix-loop-helix inhibitor Id2. Nature. 397:702–706. 10.1038/17812 [DOI] [PubMed] [Google Scholar]
- Zook, E.C., and Kee B.L.. 2016. Development of innate lymphoid cells. Nat. Immunol. 17:775–782. 10.1038/ni.3481 [DOI] [PubMed] [Google Scholar]
- Zook, E.C., Li Z.Y., Xu Y., de Pooter R.F., Verykokakis M., Beaulieu A., Lasorella A., Maienschein-Cline M., Sun J.C., Sigvardsson M., and Kee B.L.. 2018. Transcription factor ID2 prevents E proteins from enforcing a naïve T lymphocyte gene program during NK cell development. Sci. Immunol. 3:eaao2139. 10.1126/sciimmunol.aao2139 [DOI] [PMC free article] [PubMed] [Google Scholar]


