Abstract
Schima superba (Theaceae) is a subtropical evergreen tree and is used widely for forest firebreaks and gardening. It is a plant that tolerates salt and typically accumulates elevated amounts of manganese in the leaves. With large ecological amplitude, this tree species grows quickly. Due to its substantial biomass, it has a great potential for soil remediation. To evaluate the thorough framework of the mRNA, we employed PacBio sequencing technology for the first time to generate S. Superba transcriptome. In this analysis, overall, 511,759 full length non-chimeric reads were acquired, and 163,834 high-quality full-length reads were obtained. Overall, 93,362 open reading frames were obtained, of which 78,255 were complete. In gene annotation analyses, the Kyoto Encyclopedia of Genes and Genomes (KEGG), Clusters of Orthologous Genes (COG), Gene Ontology (GO), and Non-Redundant (Nr) databases were allocated 91,082, 71,839, 38,914, and 38,376 transcripts, respectively. To identify long non-coding RNAs (lncRNAs), we utilized four computational methods associated with protein families (Pfam), Cooperative Data Classification (CPC), Coding Assessing Potential Tool (CPAT), and Coding Non-Coding Index (CNCI) databases and observed 8,551, 9,174, 20,720, and 18,669 lncRNAs, respectively. Moreover, nine genes were randomly selected for the expression analysis, which showed the highest expression of Gene 6 (Na_Ca_ex gene), and CAX (CAX-interacting protein 4) was higher in manganese (Mn)-treated group. This work provided significant number of full-length transcripts and refined the annotation of the reference genome, which will ease advanced genetic analyses of S. superba.
Keywords: Schima superba, manganese, transcriptome, full-length transcript, alternative splicing
Introduction
Schima superba is naturally grown in mining areas and abundantly absorbs different metals, particularly manganese (Mn). Due to this absorbance ability, this tree is being used as phytoremediation agent in metal toxic soils (Yang et al., 2008). This tree belongs to the family Theaceae, and it is commonly used for gardening and forest firebreak. Characteristically, the leaves of this tree contain an unusual high concentration of Mn (Yang et al., 2021).
Hyper-accumulation of harmful metals in different plants helps in cleaning or decontaminating soils. Contamination of metals in the soil can be reduced through plants’ absorbance and transportation, which is a kind of green environmental remediation technology (Padmavathiamma and Li, 2007). Woody plants have high biomass and long-life cycle, and those are unique advantages in the phytoremediation of heavy metal. But the competency of woody trees to accumulate heavy metals is usually very low, and most of heavy metals are accumulated in the roots of woody trees (Capuana, 2020). As reported by Baker and Brooks (1989), more than 10,000 mg/kg concentrations of Mn in above ground tissues of plants are considered as the hyper-accumulation of Mn. Along with having a potential to accumulate Mn, S. superba has vast ecological amplitude, dominant canopy species (Tang et al., 2020) and has considerable biomass, which suggests its potential use in the soil remediation (Luo et al., 2006).
Although, researchers have reported the hyper-accumulation of Mn in leaves, roots, and shoots, no study has performed the transcriptomic analysis of S. superba till date. Since the establishment of large-scale sequencing technology, transcript sequences have become a significant source of studying gene expression and regulation (Levy and Myers, 2016). The restriction of sequencing read length in the second-generation, the full-length record acquired by splicing is not finished, and the third-generation sequencing technology signified by Pacific Biosciences (PacBio) has successfully overcome this issue (Jiao and Schneeberger, 2017; Slatko et al., 2018). Based on its long-read length, high-quality full-length record can be legitimately acquired to distinguish simple sequence repeat (SSR), fulfill functional annotation of transcripts, and lncRNA (Wang et al., 2015; Xie et al., 2020). Transcriptomics provides information of the complete set of RNA transcripts in a specific tissue or cell under different developmental or physiological stages, involving ribosomal RNA, transfer RNA, messenger RNA, and non-coding RNAs. Moreover, it concentrates on the gene expression, gene structure, and function at RNA level that help to reveal the molecular processes involved in various biological mechanisms (Dong and Chen, 2013).
In this research, a single molecule real-time sequencing (SMRT) has been completed to get the full-length transcriptome of S. superba. Utilizing the transcriptome data functional annotations of transcripts, transcriptional factors (TFs) analysis, prediction of lnRNA, and basic sequence repeat (SSR) analysis were performed. In addition, the expression pattern of various genes provides basic understanding of transcriptional regulation of S. superba. This study will not only assist future functional genomics research but also provide an avenue for further selective genetic engineering and breeding projects of S. superba.
Materials and Methods
Pot Experiment and Sample Collection
A pot test was carried out in the glasshouse of Shanghai Jiao Tong University, China, by using 1-year-old S. superba saplings. For this purpose, 18 saplings, with same growth potential (about 35 cm high), were taken and randomly allocated into two groups: control (CK) and Mn concentration 100 mM (WT), in three replicates. Plant tissues were collected after 1, 5, and 10 days of transplantation in quarter-strength of Hoagland solution. The tissues were collected in liquid nitrogen and processed through the isolation of RNA at −80°C.
RNA Extraction
RNA extraction from the collected plant samples (0.2 g leaves) was performed with the RNeasy plus Mini Kit (Qiagen, Valencia, United States). Using the Nano drop ND-1000 (Nano drop Technologies, Rockland, DE, United States) spectrophotometer, its quality and quantity were calculated after observing RNA on agarose gel. By using Qubit® RNA Assay Kit and RNA Nano 6000 Assay Kit, RNA quality has been identified clearly.
Library Construction and SMRT Sequencing
For sequencing, C2 sequencing reagents were used in Pacific Biosciences (PacBio) real-time sequencer. Purified RNA was utilized for synthesizing cDNA by SMRT PCR cDNA Synthesis Kit (Clontech, CA, United States). Full-length cDNA of different sizes was selected and cDNA libraries were constructed using the BluePippin® (SageScience, Beverly, MA, United States). After BluePippin screening, the fragments were pacified to large-scale PCR to get sufficient total cDNA and evaluate using Qubit fluorometer (Life Technologies, Carlsbad, CA, United States). The libraries’ uniqueness was maintained by using Agilent Bio analyzer 2100 system and SMRT sequencing was achieved.
Error Correction and Quality Filtering
Sequence statistics were obtained by using the SMRT link 5.1 software. Relevant parameters such as no-polish TRUE, min-length 50, max-drop-fraction 0.8, min-predicted-accuracy 0.8, min-passes 2, min-z score -9999.0, and max-length 15000 were followed to produce CCS by subreading BAM files. The output was CCS.BAM files, which, using pbclassify.py, were categorized into full length and non-full length reads. Full and non-full length FASTA files were fed into the cluster stage, and additional nucleotide errors were corrected by LoRDEC software in the consensus readings. Unnecessary data in the corrected consensus reads were separated using CD-HIT (-c 0.95 -T 6 -G 0 -aL 0.00 -aS 0.99) to acquire final transcripts for the subsequent investigation.
Functional Annotation of Transcripts
We recognized functional annotations matching by searching to the non-redundant nucleotide database (Nr), Swiss-Prot, Pfam, non-supervised orthologous groups egg (NOG), clusters of orthologous groups (COG), eukaryotic orthologous groups (KOG), Gene Ontology (GO), Kyoto Encyclopedia of Genes and Genomes (KEGG), and BLAST alignment databases, and all transcript sequences were examined for homology (Bairoch and Apweiler, 2000; Li et al., 2002; Tatusov et al., 2003; Kanehisa et al., 2004).
Identification of TFs, lncRNAs, and SSR
Plant transcription factors were predicted using iTAK v1.7a (Zheng et al., 2016). Four tools, CNCIv2 (Sun et al., 2013), CPCvcpc-0.9-r2 with e-value “1e-10” (Kong et al., 2007), Pfam-scan (E 0.001 -domE 0.001) (Finn et al., 2016) and PLEKv1.2 with min length 200 (Li et al., 2002) were chosen to predict candidate lncRNAs. Transcripts predicted with coding capacity by all of the mentioned above tools were separated out, and those without coding prospective were considered as candidate set of lncRNAs.
Development of SSR Markers
Simple sequence repeats were identified by MISA v1.01 (Beier et al., 2017), with default parameters. MISA can recognize seven types of SSR, namely mono, di, tri, tetra, penta, and hexa nucleotide by analyzing transcript sequences. By using tool Batch primer 3, SSR primers were designed. DNA was extracted from S. superba for PCR amplification, and the product was extracted in 8% polyacrylamide gel.
qRT-PCR Analysis
All 36 saplings of control group (CK) and Mn-treated group (WT) were utilized by RNA extraction via RNeasy plus Mini Kit (Qiagen, Valencia, United States). The cDNA was synthesized using SMRT PCR cDNA synthesis kit (Clontech, United States). The qRT PCR was performed to see the expression of nine different transporter genes (Supplementary Table S5). The reaction mixture consisted of 7.8 μl of cDNA and 10 μl of 2× qPCR. The process involve initial denaturation at 95°C for 10 min, which is followed by 45 cycles of denaturation at 95°C for 15 s, while annealing and extension at 60°C for 60 1 min.
Results
SMRT Sequencing Data of S. superba
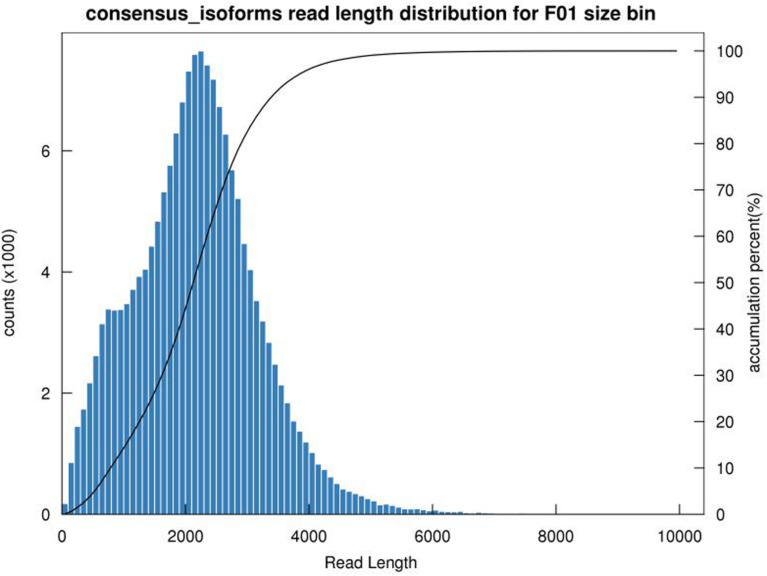
Plant tissues were used for RNA extraction and library construction of cDNA. After removing adaptor sequences, a total of 1,311,552,27 low-quality sequences were obtained. It comprised of 1–6 kb data. After self-correction of subread sequences (with minPasses = 39), overall 588,479 circular consensus sequence (CCS) were obtained. Moreover, 511,759 full-length non-chimeric (FLNC) picks were also identified. Iterative sequence clustering revealed 167,782 consensus isoforms, with a mean read length of 2187 bp. Together with non-FL sequence, the Quiver program corrected the consistent sequence in each cluster, yielding 163834 high-quality transcripts (high- quality isoforms) with more than 97.65% accuracy. In addition, the low-quality record was corrected with the corresponding sequencing data to enhance the accuracy of the isoforms. Finally, using CD HIT (3.3) tools, 97,520 bar non-redundant transcript sequences were obtained (Tables 1, 2 and Figure 1).
TABLE 1.
Sequencing data statistics table.
| Sample name | Sample ID | cDNA size | SMRT cells | Data size |
| Schima superba | F01 | 1–6 k | 1 | 40 G |
TABLE 2.
Reads summary insert from single molecule long-read sequencing.
| Samples | cDNA size | CCS no. | Read bases of CCS | Mean read length | Mean no. of passes |
| F01 | 1–6 k | 588,479 | 1,311,552,271 | 2,228 | 39 |
| F02 | All | 588,479 | 1,311,552,271 | 2,228 | 39 |
FIGURE 1.
Length distribution of full-length non-chimeric sequence.
Open Reading Frame and AS Event Prediction
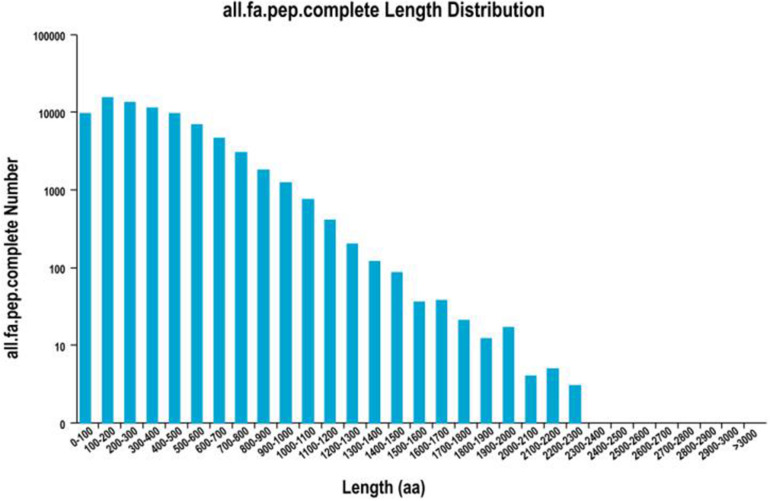
About 93,362 ORFs were predicted using Trans Decoder software. Overall, 78,255 complete ORFs were recognized, and the complete ORFs were successfully analyzed for length distribution (Figure 2); 7,489 AS events were revealed out of all transcripts obtained by SMRT sequencing (Supplementary Table S1). Owing to the lack of an unavailable S. Superba reference genome, the classification of the forms of AS events in future research would be justified (Figure 2).
FIGURE 2.
Division of predicted CDS-encoded protein length.
Long Non-coding RNA Identification
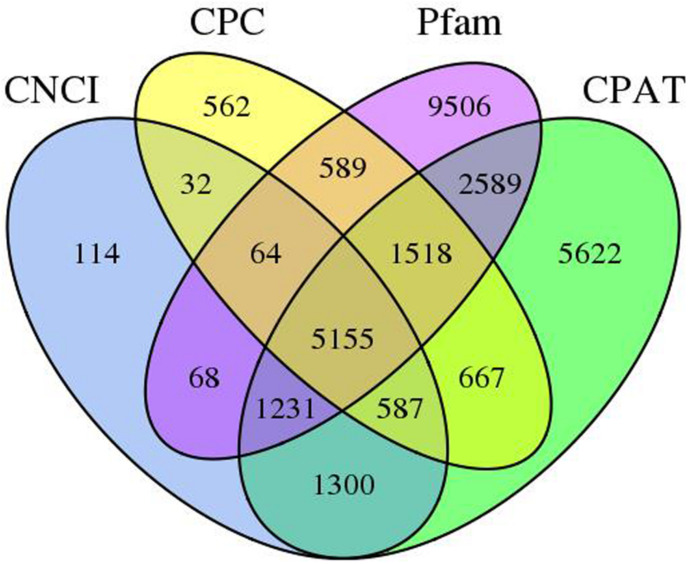
These are a group of non-coding poly-A RNAs that are involved in growth and stress response of the plant. In this work, we utilize four computational methods to recognize lncRNAs, associated with Pfam, CPC, CPAT, and CNCI databases. Overall, 8,551, 9,174, 20,720, and 18,669 lncRNAs were recognized in the Pfam, CPC, CPAT, and CNCI, respectively (Supplementary Table S2). By filtering the record of less than 300 bp, 2,011 transcripts were examined as lncRNAs by all four mechanisms (Figure 3).
FIGURE 3.
LncRNAs predicted by the CNCI, CPAT, Pfam, and CPC protein structure domain analysis.
Transcription Factor Prediction
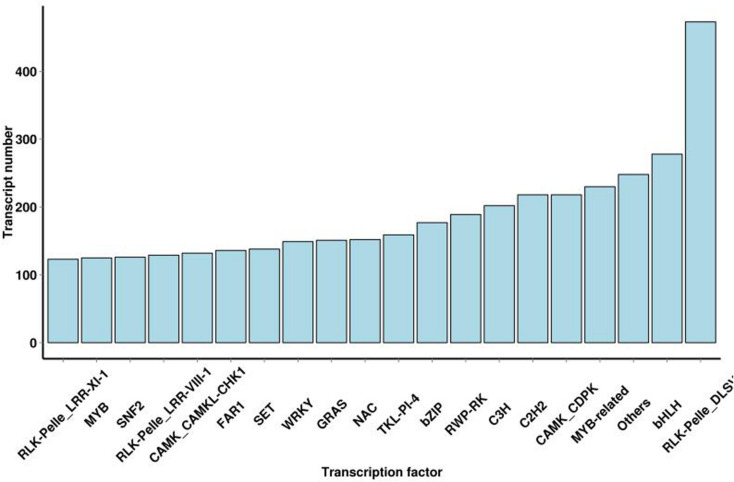
These are the key regulators of gene expression and play a significant role in plant growth and development. In this study, TFs are divided into 64 families, and 9423 putative TFs were identified (Supplementary Table S3). TFs in S. superba transcriptome were mostly related to the RLK-Pelle-DLS (473,5.02%), bHLH (278,2.95%), MYB-related (230,2.44%), CAMK-CDPK (218,2.31%), C2H2 (218,2.31%), C3H (202,2.14%), RWP-RK (189,2.01%), bZIP (177,1.88%), TKL-PI-4 (159,1.69%), and NAC (152,1.61%) families (Figure 4).
FIGURE 4.
Distribution of transcription factor types.
Functional Annotation of Transcripts
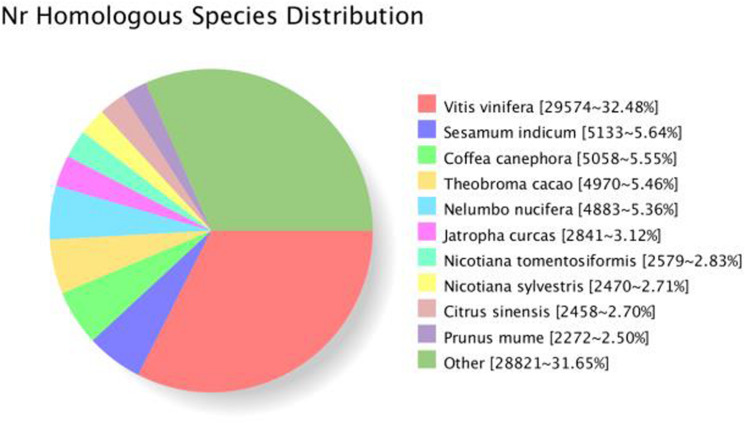
All 16,3834 unique SMRT transcripts were practically annotated by seven data storage, such as GO, KOG, Pfam, Swiss-Prot, COG, Nr, and KEGG using BLAST (7) software [version 2.2.26] (Table 3). By comparing the transcript sequence to NR with homologous species, 68,630 genes were annotated (Figure 5).
TABLE 3.
Functional annotation of S. superba transcriptome.
| Annotated databases | Isoform number |
| COG | 38,914 |
| GO | 71,839 |
| KEGG | 38,376 |
| KOG | 58,193 |
| PfAM | 73,647 |
| Eggnog | 89,727 |
| Swiss-Prot | 66,790 |
| Nr | 91,082 |
| All | 91,617 |
FIGURE 5.
Species distribution of S. superba transcriptome annotated in the Nr database.
GO Classified Transcripts
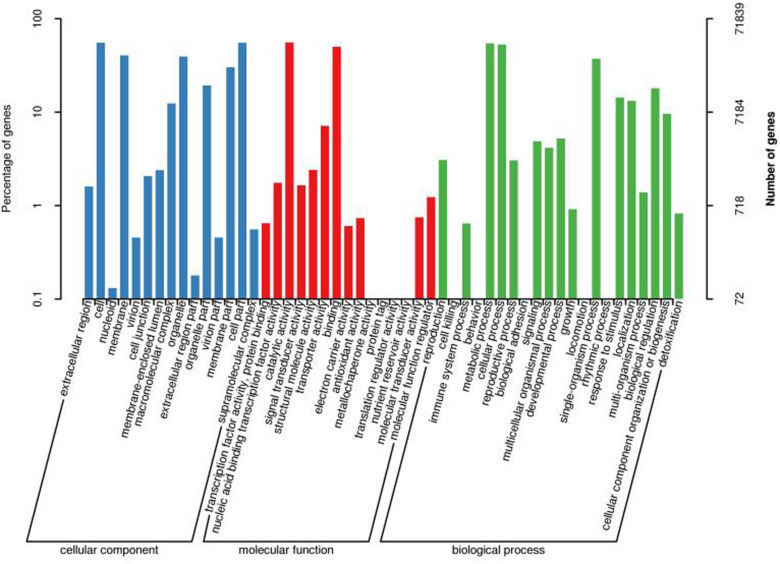
Transcripts GO classification statistics demonstrated 71,839 unique genes, which were enriched in major categories of molecular function, cellular component, biological component, and catalytic activity (Figures 3, 5). This analysis also helped us to get transcripts COG classification statistics (Figure 6).
FIGURE 6.
Transcript GO annotation classification statistics graph.
COG Classification
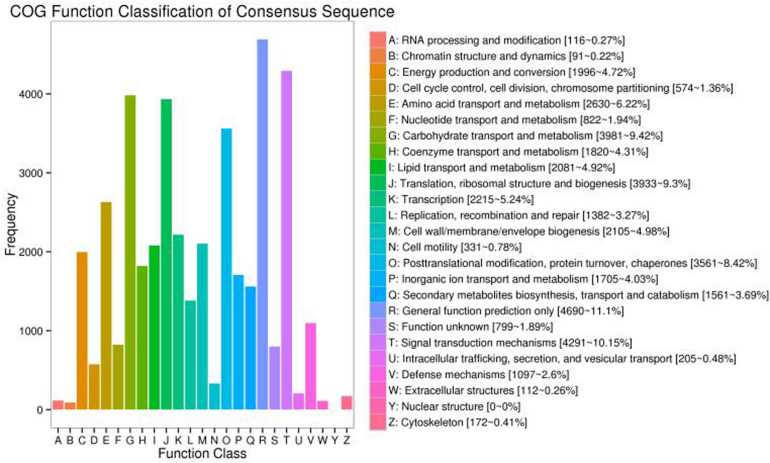
To examine the functional annotation and classification of S. Superba for further study, all the transcripts were checked against the COG database clusters2. This investigation indicated that 38,914 transcripts were allocated into 24 categories (Figure 7). The highest group was general function prediction only (4,690, 11.1%), followed by signal transduction (4,291, 10.15%) whereas carbohydrate transport and metabolism was 3,981, 9.42%. Our results revealed six groups percentage were less than 1.00%, i.e., nuclear structure and modification, chromatin structure and dynamics including extracellular structure (Figure 7).
FIGURE 7.
COG annotation classification statistics of transcripts.
KEGG Annotated Transcripts
KEGG data storage interpreted a total of 67,426 sequences and plotted 367 operative categories in S. superba. Among them, metabolism was the largest category. The functional annotations of all 78,559 unique transcripts were detected in this work (Supplementary Table S4). A significant number of genes, especially interrelated in salt-tolerance and fatty acid component of S. superba were annotated, such as oxidative phosphorylation (1073), plant hormone signal transduction (506), fatty acid biosynthesis (246), biosynthesis of unsaturated fatty acids (94), and α-linolenic acid metabolism (199). We also recognized matches to our unique transcripts in clusters of orthologous class of proteins (COG) (44,376, 56.49%), Pfam database (41,535, 52.87%), and Swiss-Prot (58,535, 74.51%) (Table 4).
TABLE 4.
Topmost pathways annotated by the KEGG database.
| No. | Name of pathways | Pathway ID | Transcripts (%) |
| 1. | Carbon metabolism | ko01200 | 886(9.68%) |
| 2. | Protein of processing in endoplasmic reticulum | Ko04141 | 462 (5.05%) |
| 3. | Biosynthesis of amino acid | ko01230 | 621 (6.79%) |
| 4. | Spliceosome | ko03040 | 520 (5.68%) |
| 5. | Ribosome | ko03010 | 332 (3.63%) |
| 6. | RNA transport | ko03013 | 356 (3.89%) |
| 7. | Sucrose and starch metabolism | ko00500 | 384 (4.20%) |
| 8. | Plant hormone signal transduction | ko04075 | 401 (4.38%) |
| 9. | Oxidative phosphorylation | ko00190 | 240 (2.62%) |
| 10. | Glycolysis/gluconeogenesis | ko00010 | 350 (3.82%) |
| 11. | Plant pathogen interaction | ko04626 | 388 (4.24%) |
| 12. | mRNA surveillance pathway | ko03015 | 339 (3.7%) |
| 13. | Ubiquitin mediated proteolysis | ko04120 | 253 (2.76%) |
| 14. | Amino sugar and nucleotide sugar metabolism | ko00520 | 245 (2.68%) |
| 15. | Endocytosis | ko04144 | 270 (2.95%) |
Analysis of Gene Expression in qRT PCR
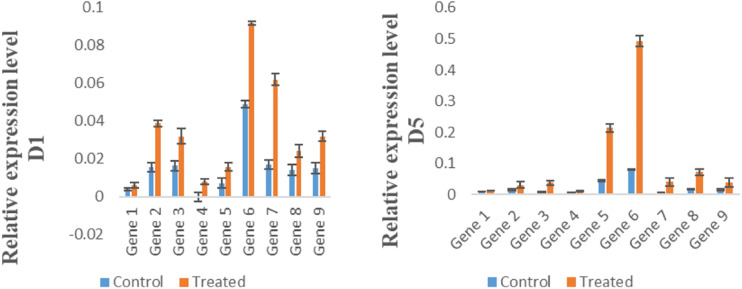
For the expression analysis of potential high expression genes, nine transporter genes were selected randomly for qRT PCR. Results of qRT PCR analysis showed the highest expression by Gene 6 (Na_Ca_ex), in Mn-treated group (WT) on day 1, 5, and 10, while the expression of CAX (CAX-interacting protein 4) was higher in Mn-treated group (WT) at day 5 (Figure 8).
FIGURE 8.
Expression of genes in control group (CK) and Mn-treated group (WT) at day 1, day 5, and day 10. Error bars represent the standard deviation.
SSR Identification
After the screening of 95,258 obtained transcripts, about 58,396 possible SSRs were recognized from 29,075 transcripts. Among them 26,312 composed one SSR, and 19,007 contained two loci or more. In addition, 29,075 and 18,324 transcripts contained one SSR and at least two SSRs, respectively. Whereas observed compound formations were 18,324 SSRs. As shown in Table 5, the number of mono-, di-, tri-, tetra-, penta-, and hexa-nucleotide repeats were 44,045, 51,716, 14,521, 1,675, 753, and 988, accordingly. SSRs with 10 repeat units (16949, 14.9%) were the most abundant, followed by those with 6 (12563, 11%), 11 (10564, 9.2%), and 7 (7995, 87.03%) (Table 6).
TABLE 5.
Summary of SSR identified in Schima superba.
| Searching item | Numbers |
| Total no. of sequence examined | 95,258 |
| Total size of examined sequences (bp) | 225,274,809 |
| No. of SSR containing sequences | 58,396 |
| No. of sequences containing more than one SSR | 29,075 |
| No. of SSRs present in compound formation | 18,324 |
| Mono-nucleotide | 44,045 |
| Di-nucleotide | 51,716 |
| Tri-nucleotide | 14,521 |
| Tetra-nucleotide | 1,675 |
| Penta-nucleotide | 753 |
| Hexa-nucleotide | 988 |
TABLE 6.
SSRs distribution based on the number of repeat units.
| No. of repeat units | Mono | Di | Tri | Tetra | Penta | Hexa | Total | Percentage |
| 5 | 0 | 0 | 6914 | 1146 | 573 | 763 | 9396 | 8.263997608 |
| 6 | 0 | 8785 | 3099 | 353 | 150 | 176 | 12563 | 11.04944678 |
| 7 | 0 | 6163 | 1661 | 113 | 26 | 32 | 7995 | 7.031785959 |
| 8 | 0 | 5669 | 977 | 44 | 3 | 15 | 6708 | 5.899839927 |
| 9 | 0 | 5588 | 734 | 17 | 0 | 0 | 6339 | 5.575295959 |
| 10 | 11953 | 4542 | 452 | 2 | 0 | 0 | 16949 | 14.90703442 |
| 11 | 7151 | 3099 | 314 | 0 | 0 | 0 | 10564 | 9.29128041 |
| 12 | 5263 | 2203 | 178 | 0 | 0 | 0 | 7644 | 6.723073405 |
| 13 | 3813 | 2115 | 82 | 0 | 0 | 0 | 6010 | 5.28593291 |
| 14 | 3294 | 2111 | 45 | 0 | 0 | 0 | 5450 | 4.79340006 |
| ≥15 | 12571 | 11441 | 65 | 0 | 1 | 2 | 24080 | 21.17891256 |
Development of SSR Markers
By using Primer 3.0 software, 95,374 pair of primers were designed, and among them, 200 were randomly selected for PCR (Supplementary Table S6). The product of 180 PCR pairs was examined successfully, with an efficiency rate of 90%. However, the remaining 20 pairs of primer failed to amplify at various annealing temperatures.
Discussion
Since the development of high-throughput sequencing technology, transcriptomic analysis has become a valuable technology to study gene expression and regulation (Wang et al., 2015; Dharshini et al., 2016). However, due to read length limitation of the second-generation sequencing in different organisms, the full-length transcript obtained by splicing is not complete (Rhoads and Au, 2015). SMRT sequencing technology effectively solves this problem. This study is the first transcriptome analysis of S. superba using SMRT sequencing technology. The sequencing peaks were gained from leaf samples using the Pacific Biosciences Iso-Seq platform. After sequencing, 511,759 full-length non-chimerics (FLNC) were identified. Previous studies also reported similar results that newly discovered transcripts by SMRT in red clover and wheat were 45 bp longer than the known transcripts (Dong et al., 2015; Chao et al., 2018). Subsequently, our results also showed that the SMRT technology is very efficient for full-length cDNA sequencing and provided a rich resource for further functional genomics analysis in S. superba (Workman et al., 2018; Zuo et al., 2018).
In past years, PacBio platform was used to sequence the full-length transcriptional group of tea (Camellia sinensis) (Qiao et al., 2019). Finally, 213,389 polished consensus sequences were obtained, 223,120 CDS sequences were predicted, 195,062 SSR loci were detected, and 5,785 transcription factors belonging to 60 transcription factor families were predicted. PacBio RS II platform was used to analyze the full-length transcription group of sunflowers, 10.43 Gb clean data were obtained, and 38,302 de-redundant sequences were obtained (Chen et al., 2018). Previous research on S. superba was mainly focused on genetic mapping, gene expression, and proteomic analysis (Chen et al., 2014; Zhang et al., 2019, Yang et al., 2021). However, these techniques could not provide and assembled full-length transcripts. On the other hand, PacBio SMRT single-molecule long-read sequencing revealed a better capacity in capturing transcript sequences, mainly long transcript sequences. The transcriptome sequencing of 18 samples was completed, and a total of 124.45 G of clean data were obtained, with Q30 reaching 85%. These data were corrected by Illumina clean reads, after the integration and quality control of data from the two platforms. After sequencing, 588,479 circular consensus (CCS) reads were obtained, including 511,759 full-length reads non-chimeric (FLNC) sequences. Previous studies showed that the length of the FLNC sequence emulates the length of the cDNA sequence in whole sequence library, whereas the library can be examined by the length of FLNC sequence (Chao et al., 2018). The full-length non-chimeric sequences were clustered to obtain 167,782 consensus sequences, and 163,834 high-quality consensus sequences were obtained by polishing the consensus sequences. The low-quality consensus sequences were corrected with the second-generation transcriptome data, and they were consistent with high-quality. The sequences were merged and subjected to de-redundancy analysis to obtain 41,112 transcript sequences. Each sample obtained 7,489 alternative splicing, and a total of 113,698 SSR and 78,255 complete CDS regions were obtained. Previous studies showed variations in the percentage of tetra, penta, and hexa nucleotide repeats observed in sorghum (5.4%), rice (2.54%), Populus (1.66%), and Medicago (0.94%) (Ref 4). Our findings of sequence library provide basic information for improving the S. superba draft genome annotation and complete characterization of this species transcriptome.
Results of qRT PCR analysis indicated the highest expression of Gene 6 (CAX-interacting protein 4), in Mn-treated group (WT) on day 1, 5, and 10. Our results are similar with the study of Pittman and Hirschi (2016). Previous studies indicated that CAX shows high expression under salt stress. Moreover, the higher expression of CAX (Na_Ca_ex) in Mn-treated group (WT) was also observed. The CAX proteins are one of the five transporter families that constitute Ca2+/cation antiporters (CaCA) superfamily (Shigaki et al., 2006; Emery et al., 2012). Although the CAX family members were at first identified as Ca2+ transporters, related work revealed their ability to transport a wide array of ions (Pittman and Hirschi, 2016). In plants, the CAXs mediate efflux of ions present into the vacuole. This study has provided enriched information about expression and regulation of genes in stress conditions of S. superba. In addition, this study provided for the first time a full-length transcriptome of the S. superba using the SMRT sequencing method. The transcriptome design in this research will assist future research on functional genomics and facilitate support for advance genetic engineering of S. superba.
Data Availability Statement
Data are available at the SRA portal (https://www.ncbi.nlm.nih.gov/sra/PRJNA679388) of NCBI, accession number: PRJNA679388.
Author Contributions
QL designed the experiments and supervised the research work. FL executed the experiments and wrote the manuscript. MM analyzed the results and formatted the manuscript. SA, UH, and JS did data compilation. WZ and SS did analyses and sample collection. SC supervised the research work. All authors read and approved the final manuscript.
Conflict of Interest
The authors declare that the research was conducted in the absence of any commercial or financial relationships that could be construed as a potential conflict of interest.
Funding. This research is financially supported by Shanghai Sciences and Technology Commission, Project No: 18DZ2283500.
Supplementary Material
The Supplementary Material for this article can be found online at: https://www.frontiersin.org/articles/10.3389/fgene.2021.635043/full#supplementary-material
Summary of the predicted alternative splicing (AS) events.
Summary of lncRNA predicted by CPC, CNCI, CPAT, and Pfam protein structure domain analysis.
Summary of identified TFs.
Summary of the transcripts annotated to the reference canonical pathways in the KEGG database.
The primers used for qRT-PCR analysis.
The characterization of EST-SSR markers.
References
- Bairoch A., Apweiler R. (2000). The SWISS-PROT protein sequence database and its supplement TrEMBL in 2000. Nucleic Acids Res. 28 45–48. 10.1093/nar/28.1.45 [DOI] [PMC free article] [PubMed] [Google Scholar]
- Baker A. J., Brooks R. (1989). Terrestrial higher plants which hyperaccumulate metallic elements. a review of their distribution, ecology and phytochemistry. Biorecovery 12 81–126. [Google Scholar]
- Beier S., Thiel T., Münch T., Scholz U., Mascher M. (2017). MISA-web: a web server for microsatellite prediction. Bioinformatics 33 2583–2585. 10.1093/bioinformatics/btx198 [DOI] [PMC free article] [PubMed] [Google Scholar]
- Capuana M. (2020). A review of the performance of woody and herbaceous ornamental plants for phytoremediation in urban areas. IForest 13:139. 10.3832/ifor3242-013 17959540 [DOI] [Google Scholar]
- Chao Y., Yuan J., Li S., Jia S., Han L., Xu L. (2018). Analysis of transcripts and splice isoforms in red clover (Trifolium pratense L.) by single-molecule long-read sequencing. BMC Plant Biol. 18:300. 10.1186/s12870-018-1534-8 [DOI] [PMC free article] [PubMed] [Google Scholar]
- Chen J., Hu W. J., Wang C., Liu T. W., Chalifour A., Shen Z. J., et al. (2014). Proteomic analysis reveals differences in tolerance to acid rain in two broad-leaf tree species, Liquidambar formosana and Schima superba. PLoS One 9:e102532. 10.1371/journal.pone.0102532 [DOI] [PMC free article] [PubMed] [Google Scholar]
- Chen J., Tang X., Ren C., Wei B., Wu Y., Wu Q., et al. (2018). Full-length transcriptome sequences and the identification of putative genes for flavonoid biosynthesis in safflower. BMC Genomics 19:548. 10.1186/s12864-018-4946-9 [DOI] [PMC free article] [PubMed] [Google Scholar]
- Dharshini S., Chakravarthi M., Manoj V. M., Naveenarani M., Kumar R., Meena M., et al. (2016). De novo sequencing and transcriptome analysis of a low temperature tolerant Saccharum spontaneum clone IND 00-1037. J. Biotechnol. 231 280–294. 10.1016/j.jbiotec.2016.05.036 [DOI] [PubMed] [Google Scholar]
- Dong L., Liu H., Zhang J., Yang S., Kong G., Chu J. S., et al. (2015). Single-molecule real-time transcript sequencing facilitates common wheat genome annotation and grain transcriptome research. BMC Genomics 16:1039. 10.1186/s12864-015-2257-y [DOI] [PMC free article] [PubMed] [Google Scholar]
- Dong Z., Chen Y. (2013). Transcriptomics: advances and approaches. Sci. China Life Sci. 56 960–967. 10.1007/s11427-013-4557-2 [DOI] [PubMed] [Google Scholar]
- Emery L., Whelan S., Hirschi K. D., Pittman J. K. (2012). Protein phylogenetic analysis of Ca2+/cation antiporters and insights into their evolution in plants. Front. Plant Sci. 3:1. 10.3389/fpls.2012.00001 [DOI] [PMC free article] [PubMed] [Google Scholar]
- Finn R. D., Coggill P., Eberhardt R. Y., Eddy S. R., Mistry J., Mitchell A. L., et al. (2016). The Pfam protein families database: towards a more sustainable future. Nucleic Acids Res. 44 D279–D285. [DOI] [PMC free article] [PubMed] [Google Scholar]
- Jiao W. B., Schneeberger K. (2017). The impact of third generation genomic technologies on plant genome assembly. Curr. Opin. Plant Biol. 36 64–70. 10.1016/j.pbi.2017.02.002 [DOI] [PubMed] [Google Scholar]
- Kanehisa M., Goto S., Kawashima S., Okuno Y., Hattori M. (2004). The KEGG resource for deciphering the genome. Nucleic Acids Res. 32 D277–D280. [DOI] [PMC free article] [PubMed] [Google Scholar]
- Kong L., Zhang Y., Ye Z. Q., Liu X. Q., Zhao S. Q., Wei L., et al. (2007). CPC: assess the protein-coding potential of transcripts using sequence features and support vector machine. Nucleic Acids Res. 35 W345–W349. [DOI] [PMC free article] [PubMed] [Google Scholar]
- Levy S. E., Myers R. M. (2016). Advancements in next-generation sequencing. Annu. Rev. Genomics Hum. Genet. 17 95–115. [DOI] [PubMed] [Google Scholar]
- Li W., Jaroszewski L., Godzik A. (2002). Tolerating some redundancy significantly speeds up clustering of large protein databases. Bioinformatics 18 77–82. 10.1093/bioinformatics/18.1.77 [DOI] [PubMed] [Google Scholar]
- Luo C., Shen Z., Li X., Baker A. J. (2006). Enhanced phytoextraction of Pb and other metals from artificially contaminated soils through the combined application of EDTA and EDDS. Chemosphere 63 1773–1784. 10.1016/j.chemosphere.2005.09.050 [DOI] [PubMed] [Google Scholar]
- Padmavathiamma P. K., Li L. Y. (2007). Phytoremediation technology: hyper-accumulation metals in plants. Water Air Soil Pollut. 184 105–126. 10.1007/s11270-007-9401-5 [DOI] [Google Scholar]
- Pittman J. K., Hirschi K. D. (2016). CAX-ing a wide net: cation/H+ transporters in metal remediation and abiotic stress signalling. Plant Biol. 18 741–749. 10.1111/plb.12460 [DOI] [PMC free article] [PubMed] [Google Scholar]
- Qiao D., Yang C., Chen J., Guo Y., Li Y., Niu S., et al. (2019). Comprehensive identification of the full-length transcripts and alternative splicing related to the secondary metabolism pathways in the tea plant (Camellia sinensis). Sci. Rep. 9:2709. [DOI] [PMC free article] [PubMed] [Google Scholar]
- Rhoads A., Au K. F. (2015). PacBio sequencing and its applications. Genomics Proteomics Bioinformatics 13 278–289. 10.1016/j.gpb.2015.08.002 [DOI] [PMC free article] [PubMed] [Google Scholar]
- Shigaki T., Rees I., Nakhleh L., Hirschi K. D. (2006). Identification of three distinct phylogenetic groups of CAX cation/proton antiporters. J. Mol. Evol. 63 815–825. 10.1007/s00239-006-0048-4 [DOI] [PubMed] [Google Scholar]
- Slatko B. E., Gardner A. F., Ausubel F. M. (2018). Overview of next-generation sequencing technologies. Curr. Protoc. Mol. Biol. 122:e59. [DOI] [PMC free article] [PubMed] [Google Scholar]
- Sun L., Luo H., Bu D., Zhao G., Yu K., Zhang C., et al. (2013). Utilizing sequence intrinsic composition to classify protein-coding and long non-coding transcripts. Nucleic Acids Res. 41:e166. 10.1093/nar/gkt646 [DOI] [PMC free article] [PubMed] [Google Scholar]
- Tang C. Q., Han P. B., Li S., Shen L. Q., Huang D. S., Li Y. F., et al. (2020). Species richness, forest types and regeneration of Schima in the subtropical forest ecosystem of Yunnan, southwestern China. For. Ecosyst. 7 1–19. [Google Scholar]
- Tatusov R. L., Fedorova N. D., Jackson J. D., Jacobs A. R., Kiryutin B., Koonin E. V., et al. (2003). The COG database: an updated version includes eukaryotes. BMC Bioinformatics 4:41. 10.1186/1471-2105-4-41 [DOI] [PMC free article] [PubMed] [Google Scholar]
- Wang Y., Wang J., Cheng J., Xu D., Jiang L. (2015). Genetic interactions between the Golgi Ca2 + /H+ exchanger Gdt1 and the plasma membrane calcium channel Cch1/Mid1 in the regulation of calcium homeostasis, stress response and virulence in Candida albicans. FEMS Yeast Res. 15:fov069. 10.1093/femsyr/fov069 [DOI] [PubMed] [Google Scholar]
- Workman R. E., Myrka A. M., Wong G. W., Tseng E., Welch K. C., Jr., Timp W. (2018). Single-molecule, full-length transcript sequencing provides insight into the extreme metabolism of the ruby-throated hummingbird Archilochus colubris. GigaScience 7 giy009. [DOI] [PMC free article] [PubMed] [Google Scholar]
- Xie J., Zuo J., Huang Y., Li C., Chen Y. (2020). The origin and germplasm collection for cultivated Dendrobium officinale K. Kimura & Migo individuals revealed by EST-SSR markers. Genet. Resour. Crop Evol. 67 1209–1219. 10.1007/s10722-020-00906-7 [DOI] [Google Scholar]
- Yang S. X., Deng H., Li M. S. (2008). Manganese uptake and accumulation in a woody hyperaccumulator Schima superba. Plant Soil Environ. 54 441–446. 10.17221/401-pse [DOI] [Google Scholar]
- Yang Z., Zhang R., Zhou Z. (2021). Selection and Validation of Appropriate Reference Genes for Gene Expression Studies in Schima Superba. [Google Scholar]
- Zhang R., Yang H., Zhou Z., Shen B., Xiao J., Wang B. (2019). A high-density genetic map of Schima superba based on its chromosomal characteristics. BMC Plant Biol. 19:41. 10.1186/s12870-019-1655-8 [DOI] [PMC free article] [PubMed] [Google Scholar]
- Zheng Y., Jiao C., Sun H., Rosli H. G., Pombo M. A., Zhang P., et al. (2016). iTAK: a program for genome-wide prediction and classification of plant transcription factors, transcriptional regulators, and protein kinases. Mol. Plant 9 1667–1670. [DOI] [PubMed] [Google Scholar]
- Zuo C., Blow M., Sreedasyam A., Kuo R. C., Ramamoorthy G. K., Torres-Jerez I., et al. (2018). Revealing the transcriptomic complexity of switchgrass by PacBio long-read sequencing. Biotechnol. Biofuels 11:170. [DOI] [PMC free article] [PubMed] [Google Scholar]
Associated Data
This section collects any data citations, data availability statements, or supplementary materials included in this article.
Supplementary Materials
Summary of the predicted alternative splicing (AS) events.
Summary of lncRNA predicted by CPC, CNCI, CPAT, and Pfam protein structure domain analysis.
Summary of identified TFs.
Summary of the transcripts annotated to the reference canonical pathways in the KEGG database.
The primers used for qRT-PCR analysis.
The characterization of EST-SSR markers.
Data Availability Statement
Data are available at the SRA portal (https://www.ncbi.nlm.nih.gov/sra/PRJNA679388) of NCBI, accession number: PRJNA679388.


