

Abstract
Central nervous system (CNS) tumors in von Hippel–Lindau syndrome (VHL) include hemangioblastomas and metastatic clear cell renal cell carcinomas (Met CCRCC). While these tumors often show similar histologic features, differentiating them is of significant importance as Met CCRCC are higher‐grade tumors with worse prognosis. No single current immunohistochemical marker unequivocally differentiates between these two entities. MicroRNAs (miRNAs) are noncoding cellular small RNA molecules that play an important role in cancer. We hypothesized that hemangioblastomas and Met CCRCC display distinct miRNA signatures enabling their histologic differentiation. MiRNAs were profiled in 10 cases each of hemangioblastomas, Met CCRCC and primary CCRCC. Ten miRNAs had greater abundance (including miR‐9 (∼10‐fold) and miR‐135a (∼7‐fold)) and 39 miRNAs were lower [including miR‐200a (∼22‐fold) and miR‐200b (∼12‐fold)] in hemangioblastomas compared with Met CCRCC. Quantitative real‐time RT‐PCR in 20 hemangioblastomas and 13 Met CCRCC showed a 12‐fold increase in miR‐9 and a 15‐fold decrease of miR‐200a in hemangioblastomas compared with Met CCRCC. Finally, in situ hybridization for miR‐9 in 15 hemangioblastomas and 10 Met CCRCC confirmed these results. Our data suggest that miR‐9 and miR‐200a can distinguish between hemangioblastomas and Met CCRCC. Further, these results may also provide insight in understanding the biology of hemangioblastomas.
Keywords: hemangioblastoma, metastatic clear cell renal cell carcinoma, microRNA, miR‐9, miR‐200a, von Hippel–Lindau syndrome
Abbreviations:
- CNS
central nervous system
- Met CCRCC
CNS metastatic clear cell renal cell carcinoma
- CCRCC
primary clear cell renal cell carcinoma
- VHL
von Hippel–Lindau (VHL) syndrome
- miRNA
microRNA
- RT‐PCR
reverse transcription polymerase chain reaction
- miR‐X
Hsa‐microRNA‐X
- FFPE
formalin fixed, paraffin embedded tissues
- Hsa
Homo sapiens
- Mmu
Mus musculus
INTRODUCTION
Hemangioblastomas are low‐grade, well‐circumscribed tumors composed of vacuolated stromal cells embedded in a rich vascular network that frequently occur in VHL (1). They often present in the cerebellum, brain stem, spinal cord and more rarely in the supratentorial regions and the peripheral nervous system 1, 3. Met CCRCC also occur within the VHL spectrum of lesions (3). They show characteristic lipidized cells with extensive vasculature appearing histologically similar to hemangioblastomas and are sometimes virtually indistinguishable on routine H&E sections 1, 35. The prognosis of hemangioblastomas is excellent if surgical resection can be achieved. Met CCRCC are more aggressively treated and carry a worse prognosis, underscoring the importance of differentiating the two entities (3). Immunohistochemical analyses are currently used to distinguish hemangioblastomas from Met CCRCC. Current markers favored to be more commonly expressed in hemangioblastomas compared with Met CCRCC are inhibin‐α(12), D2/40 (oncofetal M2A antigen) (31), endothelial GLUT1 (26), brachyury (29) and aquaporin‐1 6, 18, 33, 35. Conversely, markers expressed more commonly in Met CCRCC compared with hemangioblastomas are cytokeratins AE1/AE3 (35), epithelial membrane antigen (EMA) (9), CD10 (15), telomerase RNA expression and higher MiB‐1 index (2), CCRCC (renal cell carcinoma marker) (14), Pax2 and Pax8 5, 30. However, no single marker has been shown to unequivocally differentiate between these two entities, and a panel of two or more antibodies has been suggested to help differentiate hemangioblastomas from Met CCRCC.
MiRNAs are 20–22 nucleotide noncoding RNA molecules that play important roles in diagnosis and pathogenesis of cancer. A large number of recent studies have implicated miRNAs in regulating diverse mechanisms involved in cancers such as cell differentiation, growth, proliferation and apoptosis [reviewed in (4)]. Many tumors have also shown specific miRNA expression signatures that predict important biological aspects such as metastatic capability, migratory potential and prognosis (20). We hypothesized that hemangioblastomas will show specific miRNA signatures that will enable differentiation from Met CCRCC and help better understand the biology of these tumors. We demonstrate that miR‐9 and miR‐200a can differentiate between hemangioblastomas and Met CCRCC.
METHODS
Cases
The University of Pennsylvania institutional review board approved all experiments. Hemangioblastomas and Met CCRCC cases were selected from formalin fixed, paraffin embedded (FFPE) archival tissues from the Department of Pathology, University of Pennsylvania, between the years 1992 and 2009. Only blocks containing more than 95% tumor were selected in order to minimize contamination from surrounding brain tissues and 20 hemangioblastomas and 13 Met CCRCC met this criterion. Hemangioblastoma cases ranged from 21 to 80 years with a median of 49 years, thirteen were male and seven were female. Fifteen of the hemangioblastomas were excised from the cerebellum, one was from the spinal cord and site of excision was not available in four cases. Met CCRCC cases ranged from 35 to 72 years with a median of 59 years, seven were male and six were female. Sites of excision of Met CCRCC were: four from frontal cortex, four from cerebellum, three from occipital cortex and not available in two cases. We were unable to obtain VHL mutational status on both hemangioblastomas and Met CCRCC cases. Ten randomly selected adult primary CCRCC and 15 nonlesional brain tissues were used as controls. Control brain tissue consisted of fifteen temporal lobectomy specimens obtained from patients with intractable epilepsy and showed histopathologic evidence of mild to focally moderate gliosis but no lesions. These cases ranged in age from 22 to 61 years with a median age of 38 years; 10 of the control cases were male and five were female.
MiRNA microarray profiling
Total RNA was isolated from five rolls of 5‐µm‐thick FFPE tissue sections using RecoverAll Total Nucleic Acid Isolation Kit. Five nanograms of total RNA was used per sample as input for the FlashTag Biotin HSR labeling reaction (3DNA Array Detection Kit, Genisphere, Hatfield, PA, USA). Biotinylated RNA samples were hybridized to GeneChip miRNA Arrays (Affymetrix, Santa Clara, CA, USA), then washed, stained with streptavidin‐phycoerythrin and scanned for fluorescence quantitation as described in the Affymetrix GeneChip Technical Manual. The microarray contains probes for all microRNAs from all species in the miRBase database v. 11 (http://www.mirbase.org).
Real‐time qQRT‐PCR
Total RNA was isolated from five rolls of 5‐µm‐thick FFPE tissue sections using RecoverAll Total Nucleic Acid Isolation Kit. Ten nanograms of total RNA was used in each 15 µL reverse transcription reaction (RT). First‐strand cDNA synthesis was carried out using primers specific for miR9, miR200a, miR200b, miR330 and SNU6B (TaqMan MiRNA Assays Kit, Applied Biosystems, Foster City, CA, USA) and TaqMan MiRNA Reverse Transcription Kit (Applied Biosystems), according to the manufacturer's instructions. Reverse transcription reactions were performed on the iCycler IQ (Bio‐Rad Laboratories, Hercules, CA, USA) as follows: 16°C, 30 minutes; 42°C, 30 minutes; 85°C, 5 minutes; 4°C hold. 1.33 uL of cDNA template was used for quantitative TaqMan real‐time PCR. qPCR was performed using TaqMan universal PCR master mix, No AmpErase UNG (Life Technologies, Branchburgh, NJ, USA), using a miR9, miR200a, miR200b or miR330 primer (TaqMan MiRNA Assays Kit; Applied Biosystems) according to the manufacturer's instructions. qPCR was performed on the iCycler IQ (Bio‐Rad Laboratories) as follows: 50°C, 2 minutes; 95°C, 10 minutes; one cycle, followed by 40 cycles of 95°C, 15 s; 60°C 1 minute. To normalize experimental samples for RNA content, the RNU6B snRNA was used as a control. Data were analyzed by relative quantitation analysis using the 2−DDC T method.
In situ hybridization
In situ hybridization was performed on FFPE tissue using previously well‐characterized protocols (7). LNA probes (Exiqon, Woburn, MA, USA) were digoxigenin labeled with Dig‐ddUTP and the Dig‐3′‐end labeling kit (Roche, Indianapolis, IN, USA) and stored at −20°C at 2 mM. Five‐micrometer‐thin sections of FFPE tissue were placed onto Probe‐on slides. Slides were first warmed at 60°C for 45 minutes in an oven and then deparaffinized in xylene, 2 × 40 minutes on 50 rpm shaker, followed by 5 minutes each in serial dilution of ethanol (100%, 100%, 95%, 80% and 70%), followed by two changes of PBS. Slides were then digested with proteinase K (40 mg/mL) for 20 minutes at 37°C and rinsed in PBS (two rinses). Slides were prehybridized at 22°C for 1 h in hybridization buffer (65% formamide, 5xSSC, 0.1% Tween‐20, adjusted to pH 6.0 with 9.2 mM citric acid, 50 mg/mL heparin, 500 mg/mL yeast tRNA). Following prehybridization, slides were hybridized overnight at 49.5°C in an oven with constant motion, using 2 mL of probe in ∼200 mL of prewarmed hybridization buffer. Sections were rinsed twice in 5xSSC, followed by three washes of 20 minutes at 50°C in 50% formamide/2xSSC. Sections were then rinsed five times in PBS/0.1%Tween‐20 (PBST), and blocked for 1 h in blocking solution (2% sheep serum, 2 mg/mL BSA in PBST). Anti‐digoxigenin/HRP antibody (Roche) was pre‐adsorbed at 1:1000 dilution in blocking solution for 2 h and applied on sections overnight at 4°C. Next, slides were washed three times, 5 minutes each with TNT buffer (0.1 M Tris‐HCl pH 9.0, 0.15 M NaCl and 0.3% Triton X‐100). Slides were then incubated with Cy3 labeled tyramide amplification buffer (1:50, 100 µL/slide) and incubated for 10 minutes at room temperature away from light. Slides were washed three times, 5 minutes each with TNT buffer and PBS, coverslipped in PermaMount. For photomicrographs, images were obtained using a digital camera on a fluorescence microscope; all photographs were processed in identical fashion, using identical settings for image capture and further processing.
Statistical analysis
Data were analyzed using PRISM software (Graphpad, San Diego, CA, USA). Student's t‐test or one‐way analysis of variance (anova) tests with posttest Bonferroni correction and 95% confidence intervals were used to analyze data. We calculated one‐way anova across all three groups of tumors or two groups of tumors and control brain tissues and pairwise contrasts between hemangioblastomas and Met CCRCC (for microarray data, Student's t‐test). Only miRNAs that showed a greater than threefold difference and a p‐value less than 0.05 were considered and prioritized by p‐value and fold changes. Data are graphically represented as mean ± standard error of the mean.
RESULTS
MiRNAs differ in hemangioblastomas compared with Met CCRCC
MiRNAs were profiled and compared between 10 cases each of hemangioblastomas and Met CCRCC using FFPE archival tissue. We found 10 miRNAs had greater abundance and 39 miRNAs were lower by more than threefold (P < 0.05) in hemangioblastomas compared with Met CCRCC (Table 1 and Figure 1). MiRNAs with higher expression levels in hemangioblastomas compared with Met CCRCC included miR‐9 (∼10‐fold, P < 0.001) and miR‐135 (∼7‐fold, P < 0.001) (Figure 1). MiR‐200a (22‐fold, P < 0.0001), miR‐200b (12‐fold, P < 0.0001) and miR‐21 (16‐fold, P < 0.0001) were among the miRNAs with lower expression in hemangioblastomas compared with Met CCRCC (Table 2 and Figure 1).
Table 1.
MicroRNAs with more abundance in hemangioblastomas compared to Met CCRCC. Abbreviations: Met CCRCC = CNS metastatic clear cell renal cell carcinoma; miR‐X = Hsa‐microRNA‐X (Hsa—Homo sapiens); mmu = Mus musculus.
| # | MicroRNA | Fold difference | P‐value |
|---|---|---|---|
| 1 | miR‐9 | 9.7 | 0.0002 |
| 2 | miR‐135a | 6.9 | 0.0086 |
| 3 | mmu‐miR‐466l | 6 | 1.40E‐10 |
| 4 | miR‐140‐5p | 5.8 | 0.0002 |
| 5 | mmu‐miR‐466g | 5.6 | 3.39E‐10 |
| 6 | miR‐140‐3p | 5.5 | 0.0002 |
| 7 | mmu‐miR‐466b‐3‐3p | 4.2 | 3.39E‐10 |
| 8 | mmu‐miR‐574‐3p | 3.9 | 0.0016 |
| 9 | mmu‐miR‐669h‐3p | 3.8 | 1.82E‐09 |
| 10 | miR‐631 | 3.1 | 0.0109 |
Data were analyzed between hemangioblastomas and Met CCRCC using the Student's t‐test with 95% confidence intervals.
Figure 1.
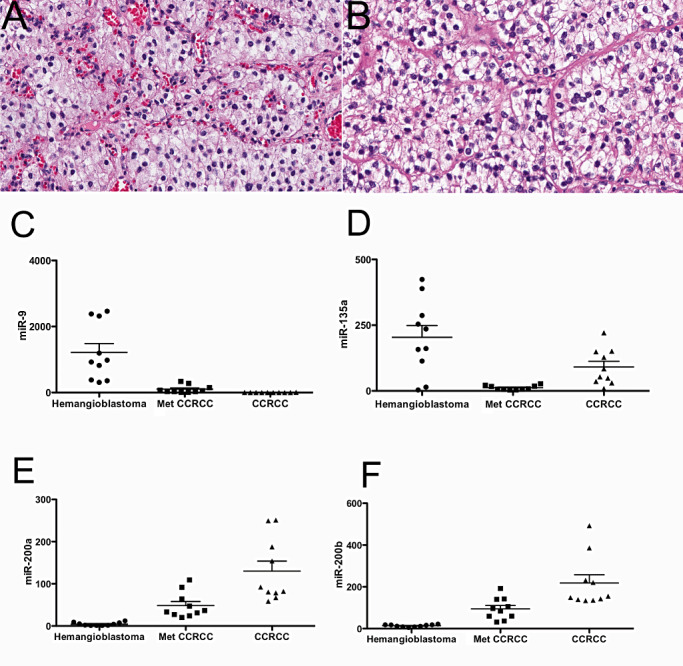
MiRNA profiles from hemangioblastomas and Met CCRCC. H&E sections from hemangioblastoma (A) and Met CCRCC (B) show histologically similar features (40X). Tumor cells are composed of vacuolated or lipidized cells embedded in an extensive vasculature network. MiRNA expression levels by microarray assays showed significantly more miR‐9 (P < 0.001) (C) and miR‐135 (P < 0.001) (D) in hemangioblastomas compared with Met CCRCC. Significantly less miR‐200a (P < 0.0001) (E) and miR‐200b (P < 0.0001) (F) were detected in hemangioblastomas compared with Met CCRCC. Met CCRCC = CNS metastatic clear cell renal cell carcinoma; CCRCC = primary clear cell renal cell carcinoma. Data were analyzed using analysis of variance (anova) with 95% confidence intervals.
Table 2.
MicroRNAs with less abundance in hemangioblastomas compared with Met CCRCC. Abbreviations: Met CCRCC = CNS metastatic clear cell renal cell carcinoma; miR‐X = Hsa‐microRNA‐X (Hsa—Homo sapiens); mmu = Mus musculus; SNORD = small nucleolar RNA.
| # | MicroRNA | Fold difference | P‐value |
|---|---|---|---|
| 1 | miR‐200a | −21.9 | 9.55E‐08 |
| 2 | miR‐21 | −16.7 | 1.14E‐06 |
| 3 | miR‐200b | −12.1 | 9.84E‐09 |
| 4 | miR‐196a | −8.1 | 0.0001 |
| 5 | miRPlus‐E1038 | −6.7 | 4.21E‐06 |
| 6 | miRPlus‐E1136 | −6.5 | 2.79E‐08 |
| 7 | miR‐1308 | −6.3 | 6.15E‐06 |
| 8 | miR‐146b‐5p | −5.2 | 0.0011 |
| 9 | hsa‐SNORD10 | −4.9 | 0.0001 |
| 10 | miR‐194 | −4.9 | 0.0057 |
| 11 | miR‐105 | −4.9 | 3.83E‐05 |
| 12 | mmu‐miR‐155 | −4.8 | 0.0004 |
| 13 | miR‐192 | −4.7 | 0.0051 |
| 14 | miRPlus‐E1100 | −4.7 | 0.0001 |
| 15 | miR‐1259 | −4.7 | 9.55E‐08 |
| 16 | miRPlus‐E1219 | −4.4 | 1.19E‐08 |
| 17 | miR‐429 | −4.1 | 0.0039 |
| 18 | miRPlus‐E1088 | −3.9 | 0.0258 |
| 19 | miRPlus‐E1170 | −3.9 | 6.15E‐06 |
| 20 | miRPlus‐E1108 | −3.8 | 5.96E‐06 |
| 21 | miR‐182 | −3.7 | 0.0031 |
| 22 | miR‐221 | −3.6 | 0.0068 |
| 23 | miR‐193b | −3.6 | 4.59E‐06 |
| 24 | miR‐193a‐3p | −3.5 | 0.0016 |
| 25 | miRPlus‐E1016 | −3.5 | 6.85E‐05 |
| 26 | miR‐222 | −3.5 | 0.0061 |
| 27 | hsa‐SNORD6 | −3.4 | 2.34E‐05 |
| 28 | miR‐10a | −3.4 | 0.0198 |
| 29 | miR‐31 | −3.4 | 0.0203 |
| 30 | miR‐1201 | −3.3 | 0.0080 |
| 31 | miR‐365 | −3.3 | 0.0001 |
| 32 | miR‐886‐3p | −3.2 | 0.0056 |
| 33 | miRPlus‐E1060 | −3.2 | 1.16E‐05 |
| 34 | hsa‐SNORD4A | −3.1 | 0.0009 |
| 35 | miR‐219‐5p | −3.1 | 0.0464 |
| 36 | SNORD49A‐5 | −3.1 | 2.18E‐05 |
| 37 | miR‐199a | −3.1 | 0.0408 |
| 38 | miR‐424 | −3.1 | 0.0043 |
| 39 | miR‐20a | −3.0 | 0.0181 |
Data were analyzed between hemangioblastomas and Met CCRCC using the Student's t‐test with 95% confidence intervals.
Quantitative RT‐PCR and in situ hybridization confirmation of profiling data
We performed real‐time quantitative RT‐PCR in 20 hemangioblastomas, 13 Met CCRCC and 15 cases of control nonlesional brain tissue obtained from temporal lobectomy specimens. Hemangioblastomas showed 12‐fold more miR‐9 (P = 0.002) and 15‐fold less miR‐200a (P = 0.0001, Figure 2) compared with Met CCRCC. Quantitative RT‐PCR performed on 10 samples each of hemangioblastomas, Met CCRCC and primary CCRCC showed 56‐fold less miR‐200b (P < 0.0001, Figure 2) in hemangioblastomas, but no difference in miR‐330 (P = 0.8316) performed as an additional control.
Figure 2.
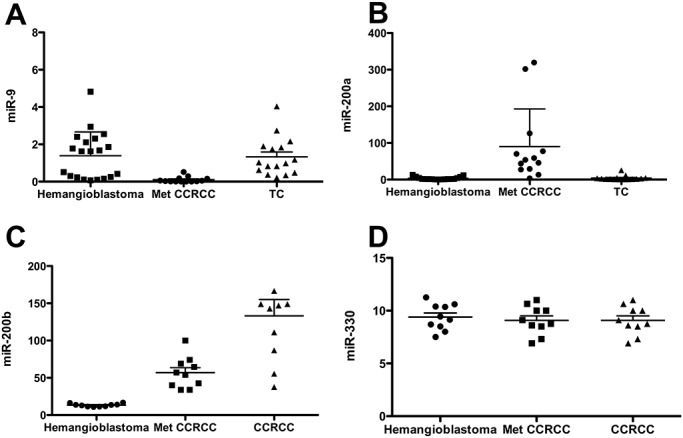
qQT‐RT‐PCR shows greater abundance of miR‐9 and lower abundance of miR‐200a/200b in hemangioblastomas compared with Met CCRCC. Quantitative real‐time RT‐PCR was used to assess miRNA expression in hemangioblastomas and Met CCRCC. MiR‐9 was significantly more abundant in hemangioblastomas compared with Met CCRCC (P = 0.002) (A). MiR‐200a (P = 0.0001) (B) and miR‐200b (P < 0.0001) (C) showed significant lower abundance in hemangioblastomas compared with Met CCRCC. MiR‐330 was unchanged (P = 0.8316) and served as a control (D). Met CCRCC = CNS metastatic clear cell renal cell carcinoma; TC = temporal cortex; CCRCC = primary clear cell renal cell carcinoma. Data were analyzed using analysis of variance (anova) with 95% confidence intervals.
In situ hybridization was performed for miR‐9 on FFPE sections using previously well‐characterized protocols (7). As miR‐9 is expressed in oligodendrogliomas, sections from oligodendrogliomas (WHO grade II/IV) were used as positive controls (25). Parallel sections without probe were used as negative controls. In situ hybridization for miR‐9 performed in 15 cases of hemangioblastomas and 10 cases of Met CCRCC showed abundant miR‐9 expression in all hemangioblastomas (Figure 3). Signal levels equivalent to the negative control without probe were observed in all examined Met CCRCC (Figure 3).
Figure 3.
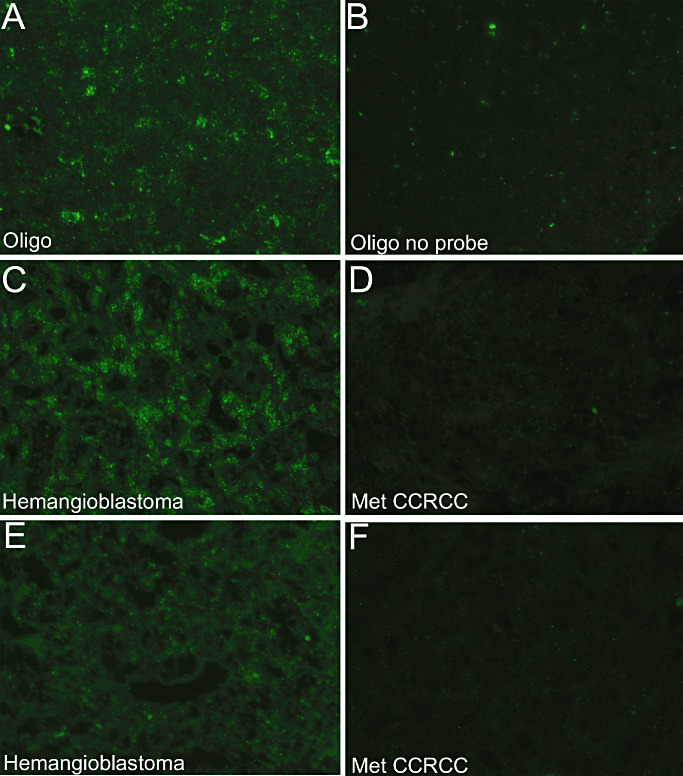
MiR‐9 in situ hybridization in hemangioblastoma and Met CCRCC. In situ hybridization for miR‐9 was performed on formalin fixed, paraffin embedded (FFPE) sections using described protocols (7) and imaged at 40X using oligodendrogliomas as a positive control (25) (A). Oligodendroglioma sections without the miR‐9 probe were used as negative controls (B). Hemangioblastomas showed greater abundance of miR‐9 (two different cases, C,E) compared with Met CCRCC (two different cases, D,F). Met CCRCC = CNS metastatic clear cell renal cell carcinoma; Oligo = oligodendroglioma.
DISCUSSION
VHL is a rare autosomal dominant disorder characterized by mutations of the VHL tumor suppressor gene located on chromosome 3p25 (37). Several benign and malignant tumors have been associated with VHL including hemangioblastoma, primary and Met CCRCC, endolymphatic sac tumors, angiomas and pheochromocytomas 3, 19. Of these tumors, hemangioblastomas and Met CCRCC most often occur in the CNS (3). Histologically, these tumors are similar (1) and distinguishing them is of significant importance as Met CCRCC are treated more aggressively (3). Immunohistochemistry is relied upon using panels of different antibodies as no single marker can unequivocally differentiate these entities. Various combinations of markers including CD10 and inhibin‐α(15), aquaporin‐1 and the cytokeratin cocktail AE1/AE3 (35) or inhibin‐α and Pax2/Pax8 5, 30 have been proposed to separate these entities.
As miRNA biology has advanced our understanding of the pathogenesis, therapeutics and classification of various cancers, we sought to determine if miRNAs were differentially expressed in hemangioblastomas vs. Met CCRCC. We determined miRNA profiles using FFPE tissues from hemangioblastomas and Met CCRCC. Our data suggest that miR‐9 is more abundant in hemangioblastomas than in Met CCRCC (1, 2, 3 and Table 1). The opposite pattern was observed with miR‐200a and miR‐200b (1, 2 and Table 2). These data were confirmed using quantitative real‐time RT‐PCR and in situ hybridization in FFPE tissues for miR‐9 using recently well‐characterized protocols (7) (Figure 3). Interestingly, Pax8 is a predicted target of miR‐9 (http://www.microrna.org/microrna/home.do), which may explain the Pax8 negative phenotype seen in hemangioblastomas. Similarly, aquaporin‐1 is a predicted target of miR‐200b, which may account for the lower expression of aquaporin‐1 expression in Met CCRCC. Direct interactions of these miRNAs with their predicted targets are beyond the scope of this study but represent avenues of future experimentation. Further, our data are in agreement with previously published results showing decreased expression of miR‐9 caused by methylation in primary CCRCC (11) and increased expression of miR‐21 in VHL associated primary CCRCC (24).
The limitations of our study include the relatively small number of cases and the lack of VHL mutational status information on the cases. The expression of miR‐9 morphologically appeared to be in both the stromal as well as vascular components of the tumor (Figure 3). Future studies combining in situ hybridization with immunohistochemistry for stromal cell markers and vascular markers may clarify this expression pattern. Further, miR‐9 was not completely absent in Met CCRCC but was expressed at much lower levels compared with hemangioblastomas (∼12‐fold lower, Figure 2A) as detected by quantitative real‐time RT‐PCR. However, the sensitivity of the in situ hybridization assay for miR‐9 was such that signal levels equivalent to the negative control without probe were observed in all examined Met CCRCC in contrast to abundant miR‐9 expression in all hemangioblastomas (Figure 3). However, in situ hybridization for microRNAs may not currently represent an expeditious alternative to immunohistochemistry in routine diagnostics. We performed a panel of immunohistochemical stains including inhibin‐α, EMA, RCC, CD10 and D2/40 on all the cases in this study. Sensitivities in differentiating the two entities were as follows: inhibin‐α—90%, EMA—85%, RCC—46%, CD10—85% and D2/40–80%. Specificities were 100% for inhibin‐α, EMA, RCC and CD10, and 85% for D2/40. A combination of inhibin‐α, D2/40 and EMA enhanced the sensitivity to 100%. Despite these limitations, microRNAs are beginning to be of significant utility in diagnosing various cancers and as these methodologies transition to routine diagnostics, our data may be helpful in distinguishing hemangioblastomas from Met CCRCC. More importantly, these results may also provide future leads into understanding the biology of hemangioblastomas.
The cell of origin for hemangioblastomas has been the subject of extensive debate. Immunohistochemical and ultrastructural studies have been inconclusive and suggest a variety of histogenic origins such as glial, fibroblastic, endothelial, arachnoid and neuronal origins [reviewed in (1)]. More recently, Lonser and colleagues reported the ability of hemangioblastoma tumor cells obtained from VHL patients to differentiate into erythrocytic, granulocytic and endothelial progenitors under defined conditions. These results, along with brachyury expression (an early mesodermal marker), led them to propose that the cell of origin is a mesodermal embryologically arrested hemangioblast (29). However, the histogenesis of hemangioblastomas remains to be completely elucidated.
Increased expression on miR‐9 in hemangioblastomas may help understand the biology and provide insight into the histogenesis of hemangioblastomas. Increasing evidence suggests that miR‐9 regulates several aspects of neurogenesis. For example, miR‐9 targets many transcription factors that determine neuronal stem cell fate including REST and TLX 28, 32, 38. Reprogramming of fibroblasts into neurons is regulated by miR‐9 (36). Moreover, midbrain‐hindbrain patterning (17), columnar patterning of motor neurons in the developing spinal cord (27) and neuronal stem cell migration (8) are also mediated by miR‐9. This association raises the possibility of a neural or neural‐related lineage for hemangioblastoma. This could include the possibility of a neuronal stem cell origin or possibly a neuronal‐related, but more pluripotent precursor in line with the evidence that hemangioblastoma tumor cells retain capacity to differentiate along endothelial and erythrocytic lines (29). In contrast, the role of miR‐9 in cancer is less understood. Many cancers including primary brain malignancies (23), breast carcinomas 13, 22, ovarian cancers 10, 16 and gastric cancer 21, 34 show differential expression of miR‐9, where it regulates diverse functions such as apoptosis and metastatic potential of tumor cells. Taken together, it is possible that miR‐9 in hemangioblastomas may regulate several aspects that are yet to be elucidated.
MicroRNAs have provided a new paradigm to study cancer, and as these technologies transition to routine histopathologic diagnostics our data may provide means to differentiate hemangioblastomas from Met CCRCC in the brain. Moreover, these data provide avenues for future experimentation to evaluate the biological significance of these differentially expressed miRNAs and their targets in human tissues as well as cell culture to study the biology of hemangioblastomas in VHL.
ACKNOWLEDGMENTS
We thank Aihua Liu, Amy Ziober, Yuan Yao, Paul Le and Daniel Martinez for excellent technical expertise and help. This work was supported by a University of Pennsylvania resident research grant (SV) and Anatomic Pathology research fund (PL). This paper was awarded the Lucien J. Rubenstein award for best paper on Neuro‐oncology at the 86th American Association of Neuropathologists Annual Meeting.
REFERENCES
- 1. Aldape KD, Plate KH, Vortmeyer AO, Zagzag D, Neumann HPH (2007) Hemangioblastoma. In: WHO Classification of Tumors of the Central Nervous System, 4th edn. Louis DN , Ohgaki H, Wiestler OD, Cavenee WK (eds), pp. 184–186. The International Agency for Research on Cancer: Lyon. [Google Scholar]
- 2. Brown DF, Gazdar AF, White CL 3rd, Yashima K, Shay JW, Rushing EJ (1997) Human telomerase RNA expression and MIB‐1 (Ki‐67) proliferation index distinguish hemangioblastomas from metastatic renal cell carcinomas. J Neuropathol Exp Neurol 56:1349–1355. [DOI] [PubMed] [Google Scholar]
- 3. Butman JA, Linehan WM, Lonser RR (2008) Neurologic manifestations of von Hippel–Lindau disease. JAMA 300:1334–1342. [DOI] [PMC free article] [PubMed] [Google Scholar]
- 4. Calin GA, Croce CM (2006) MicroRNA signatures in human cancers. Nat Rev Cancer 6:857–866. [DOI] [PubMed] [Google Scholar]
- 5. Carney EM, Banerjee P, Ellis CL, Albadine R, Sharma R, Chaux AM et al (2011) PAX2(−)/PAX8(−)/inhibin A(+) immunoprofile in hemangioblastoma: a helpful combination in the differential diagnosis with metastatic clear cell renal cell carcinoma to the central nervous system. Am J Surg Pathol 35:262–267. [DOI] [PubMed] [Google Scholar]
- 6. Chen Y, Tachibana O, Oda M, Xu R, Hamada J, Yamashita J et al (2006) Increased expression of aquaporin 1 in human hemangioblastomas and its correlation with cyst formation. J Neurooncol 80:219–225. [DOI] [PubMed] [Google Scholar]
- 7. de Planell‐Saguer M, Rodicio MC, Mourelatos Z (2010) Rapid in situ codetection of noncoding RNAs and proteins in cells and formalin‐fixed paraffin‐embedded tissue sections without protease treatment. Nat Protoc 5:1061–1073. [DOI] [PubMed] [Google Scholar]
- 8. Delaloy C, Liu L, Lee JA, Su H, Shen F, Yang GY et al (2010) MicroRNA‐9 coordinates proliferation and migration of human embryonic stem cell‐derived neural progenitors. Cell 6:323–335. [DOI] [PMC free article] [PubMed] [Google Scholar]
- 9. Frank TS, Trojanowski JQ, Roberts SA, Brooks JJ (1989) A detailed immunohistochemical analysis of cerebellar hemangioblastoma: an undifferentiated mesenchymal tumor. Mod Pathol 2:638–651. [PubMed] [Google Scholar]
- 10. Guo LM, Pu Y, Han Z, Liu T, Li YX, Liu M et al (2009) MicroRNA‐9 inhibits ovarian cancer cell growth through regulation of NF‐kappaB1. FEBS J 276:5537–5546. [DOI] [PubMed] [Google Scholar]
- 11. Hildebrandt MA, Gu J, Lin J, Ye Y, Tan W, Tamboli P et al (2010) Hsa‐miR‐9 methylation status is associated with cancer development and metastatic recurrence in patients with clear cell renal cell carcinoma. Oncogene 29:5724–5728. [DOI] [PubMed] [Google Scholar]
- 12. Hoang MP, Amirkhan RH (2003) Inhibin alpha distinguishes hemangioblastoma from clear cell renal cell carcinoma. Am J Surg Pathol 27:1152–1156. [DOI] [PubMed] [Google Scholar]
- 13. Hsu PY, Deatherage DE, Rodriguez BA, Liyanarachchi S, Weng YI, Zuo T et al (2009) Xenoestrogen‐induced epigenetic repression of microRNA‐9‐3 in breast epithelial cells. Cancer Res 69:5936–5945. [DOI] [PMC free article] [PubMed] [Google Scholar]
- 14. Ingold B, Wild PJ, Nocito A, Amin MB, Storz M, Heppner FL, Moch H (2008) Renal cell carcinoma marker reliably discriminates central nervous system haemangioblastoma from brain metastases of renal cell carcinoma. Histopathology 52:674–681. [DOI] [PubMed] [Google Scholar]
- 15. Jung SM, Kuo TT (2005) Immunoreactivity of CD10 and inhibin alpha in differentiating hemangioblastoma of central nervous system from metastatic clear cell renal cell carcinoma. Mod Pathol 18:788–794. [DOI] [PubMed] [Google Scholar]
- 16. Laios A, O'Toole S, Flavin R, Martin C, Kelly L, Ring M et al (2008) Potential role of miR‐9 and miR‐223 in recurrent ovarian cancer. Mol Cancer 7:35. [DOI] [PMC free article] [PubMed] [Google Scholar]
- 17. Leucht C, Stigloher C, Wizenmann A, Klafke R, Folchert A, Bally‐Cuif L (2008) MicroRNA‐9 directs late organizer activity of the midbrain‐hindbrain boundary. Nat Neurosci 11:641–648. [DOI] [PubMed] [Google Scholar]
- 18. Longatti P, Basaldella L, Orvieto E, Dei Tos AP, Martinuzzi A (2006) Aquaporin 1 expression in cystic hemangioblastomas. Neurosci Lett 392:178–180. [DOI] [PubMed] [Google Scholar]
- 19. Lonser RR, Glenn GM, Walther M, Chew EY, Libutti SK, Linehan WM, Oldfield EH (2003) von Hippel–Lindau disease. Lancet 361:2059–2067. [DOI] [PubMed] [Google Scholar]
- 20. Lu J, Getz G, Miska EA, Alvarez‐Saavedra E, Lamb J, Peck D et al (2005) MicroRNA expression profiles classify human cancers. Nature 435:834–838. [DOI] [PubMed] [Google Scholar]
- 21. Luo H, Zhang H, Zhang Z, Zhang X, Ning B, Guo J et al (2009) Down‐regulated miR‐9 and miR‐433 in human gastric carcinoma. J Exp Clin Cancer Res 28:82. [DOI] [PMC free article] [PubMed] [Google Scholar]
- 22. Ma L, Young J, Prabhala H, Pan E, Mestdagh P, Muth D et al (2010) miR‐9, a MYC/MYCN‐activated microRNA, regulates E‐cadherin and cancer metastasis. Nat Cell Biol 12:247–256. [DOI] [PMC free article] [PubMed] [Google Scholar]
- 23. Nass D, Rosenwald S, Meiri E, Gilad S, Tabibian‐Keissar H, Schlosberg A et al (2009) MiR‐92b and miR‐9/9* are specifically expressed in brain primary tumors and can be used to differentiate primary from metastatic brain tumors. Brain Pathol 19:375–383. [DOI] [PMC free article] [PubMed] [Google Scholar]
- 24. Neal CS, Michael MZ, Rawlings LH, Van der Hoek MB, Gleadle JM (2010) The VHL‐dependent regulation of microRNAs in renal cancer. BMC Med 8:64. [DOI] [PMC free article] [PubMed] [Google Scholar]
- 25. Nelson PT, Baldwin DA, Kloosterman WP, Kauppinen S, Plasterk RH, Mourelatos Z (2006) RAKE and LNA‐ISH reveal microRNA expression and localization in archival human brain. RNA 12:187–191. [DOI] [PMC free article] [PubMed] [Google Scholar]
- 26. North PE, Mizeracki A, Mihm MC Jr, Mrak RE (2000) GLUT1 immunoreaction patterns reliably distinguish hemangioblastoma from metastatic renal cell carcinoma. Clin Neuropathol 19:131–137. [PubMed] [Google Scholar]
- 27. Otaegi G, Pollock A, Hong J, Sun T (2011) MicroRNA miR‐9 modifies motor neuron columns by a tuning regulation of FoxP1 levels in developing spinal cords. J Neurosci 31:809–818. [DOI] [PMC free article] [PubMed] [Google Scholar]
- 28. Packer AN, Xing Y, Harper SQ, Jones L, Davidson BL (2008) The bifunctional microRNA miR‐9/miR‐9* regulates REST and CoREST and is downregulated in Huntington's disease. J Neurosci 28:14341–14346. [DOI] [PMC free article] [PubMed] [Google Scholar]
- 29. Park DM, Zhuang Z, Chen L, Szerlip N, Maric I, Li J et al (2007) von Hippel‐Lindau disease‐associated hemangioblastomas are derived from embryologic multipotent cells. PLoS Med 4:e60. [DOI] [PMC free article] [PubMed] [Google Scholar]
- 30. Rivera AL, Takei H, Zhai J, Shen SS, Ro JY, Powell SZ (2010) Useful immunohistochemical markers in differentiating hemangioblastoma versus metastatic renal cell carcinoma. Neuropathology 30:580–585. [DOI] [PubMed] [Google Scholar]
- 31. Roy S, Chu A, Trojanowski JQ, Zhang PJ (2005) D2‐40, a novel monoclonal antibody against the M2A antigen as a marker to distinguish hemangioblastomas from renal cell carcinomas. Acta Neuropathol 109:497–502. [DOI] [PubMed] [Google Scholar]
- 32. Shibata M, Nakao H, Kiyonari H, Abe T, Aizawa S (2011) MicroRNA‐9 regulates neurogenesis in mouse telencephalon by targeting multiple transcription factors. J Neurosci 31:3407–3422. [DOI] [PMC free article] [PubMed] [Google Scholar]
- 33. Takei H, Powell SZ (2011) Novel immunohistochemical markers in the diagnosis of nonglial tumors of nervous system. Adv Anat Pathol 17:150–153. [DOI] [PubMed] [Google Scholar]
- 34. Wan HY, Guo LM, Liu T, Liu M, Li X, Tang H (2010) Regulation of the transcription factor NF‐kappaB1 by microRNA‐9 in human gastric adenocarcinoma. Mol Cancer 9:16. [DOI] [PMC free article] [PubMed] [Google Scholar]
- 35. Weinbreck N, Marie B, Bressenot A, Montagne K, Joud A, Baumann C et al (2008) Immunohistochemical markers to distinguish between hemangioblastoma and metastatic clear‐cell renal cell carcinoma in the brain: utility of aquaporin1 combined with cytokeratin AE1/AE3 immunostaining. Am J Surg Pathol 32:1051–1059. [DOI] [PubMed] [Google Scholar]
- 36. Yoo AS, Sun AX, Li L, Shcheglovitov A, Portmann T, Li Y et al (2011) MicroRNA‐mediated conversion of human fibroblasts to neurons. Nature 476:228–231. [DOI] [PMC free article] [PubMed] [Google Scholar]
- 37. Zbar B, Kaelin W, Maher E, Richard S (1999) Third International Meeting on von Hippel–Lindau disease. Cancer Res 59:2251–2253. [PubMed] [Google Scholar]
- 38. Zhao C, Sun G, Li S, Shi Y (2009) A feedback regulatory loop involving microRNA‐9 and nuclear receptor TLX in neural stem cell fate determination. Nat Struct Mol Biol 16:365–371. [DOI] [PMC free article] [PubMed] [Google Scholar]