

Abstract
Glioblastoma is the most common malignant brain tumor and patients usually succumb to their disease within 2 years. Aldehyde dehydrogenase 1A1 (ALDH1A1) has been suggested as a marker for cancer stem cells that is associated with poor prognosis in human gliomas. However, little is known about the expression and the function of ALDH1A1 in early stages of brain development. We analyzed ALDH1A1 expression in developing and mature central nervous system (CNS) as well as in 93 cases of primary glioblastomas. Surprisingly, ALDH1A1 was absent in the stem cell niches at varying stages of CNS development, but strong ALDH1A1 expression was observed in mature astrocytes coexpressing GFAP and S100. There were 92 out of 93 glioblastomas (99%) that showed ALDH1A1 protein expression in up to 49% of tumor cells. The majority of these cells co‐expressed GFAP, but not established stem cell markers such as Nestin, OLIG2 or SOX2. Finally, strong expression of ALDH1A1 correlated with a significantly better survival of the patients and proved to be an independent prognostic marker in our series (P < 0.01). In contrast to other published data, we therefore provide evidence for ALDH1A1 as a marker of astrocytic differentiation during brain development and of better prognosis in patients suffering from primary glioblastoma.
Keywords: Aldh1, astrocytes, development, glioma, survival
INTRODUCTION
Aldehyde dehydrogenase (ALDH) depicts a large enzyme superfamily with up to 19 different isoforms (16). The isoenzyme ALDH1A1 is a cytosolic homo‐tetramer catalyzing the conversion of aldehydes to the corresponding acids and is ubiquitously distributed in various tissues including lens, liver, gastrointestinal tract, red blood cells, prostate and brain (17). Moreover, ALDH1A1 has been linked to stem cell properties in various epithelial and carcinoma tissues (15) and therefore claimed to be a marker for the identification of cancer stem cells (CSCs) (3). According to the CSC hypothesis, this small subset of pluripotent and undifferentiated tumor cells has the ability to self‐renew and might be responsible for tumor propagation as well as unsatisfying response to current anticancer therapies (20). In support of this, ALDH1A1 expression has been demonstrated to serve as a reliable marker for poor prognostic outcome in several tumor entities 3, 6, 7.
The presence of CSCs has also been described in glioblastoma, the most aggressive subtype of astrocytic brain tumors (24). Despite progress in surgery (25) and radio‐/chemotherapy (26), these tumors are hardly affected by any therapeutic regime so that to date, glioblastoma is still an incurable disease with dismal prognosis (14). This resistance to therapy depends on several known factors such as genome instability and the infiltrative character of glioblastoma cells (14), but it may also depend on cell‐autonomous resistance mechanisms that appear to be characteristic for CSCs (23). In line with this, ALDH1A1 has recently been suggested as a novel stem cell marker in a small series of human glioblastomas (19).
Although these studies have demonstrated first results regarding malignant gliomas, expression and function of ALDH1A1 in the central nervous system (CNS) and in tumors deriving thereof are largely unknown. As CSCs and normal stem cells share similar properties, it appears particularly interesting to obtain a more detailed knowledge on the expression of ALDH1A1 and the function it might have in the developing brain during the pre‐ and postnatal period. We therefore sought to examine the role of ALDH1A1 in multiple stages of human brain development as well as in a large series of primary glioblastoma, in order to get a closer insight into the role of this suggested prognostic stem cell marker.
MATERIALS AND METHODS
Patients and tumor samples
Normal brain tissue sections were taken from autopsy material from patients who did not reveal any clinical or neuropathological signs of a CNS disorder. Tissues were taken from fetuses with 10, 14 or 20 weeks of gestation and from adult patients that were 50, 55 and 60 years of age. Staining was performed on whole brain sections from the fetuses and on tissue from the right frontal median gyrus as well as from the right cerebellar hemisphere of adult brains. Tumor tissue was analyzed from a total of 93 patients. All patients had signed informed consent forms according to the local ethics committee. Tissue samples for histopathological diagnosis and molecular genetic analysis were acquired either via microsurgical tumor resection (n = 56) or stereotactical serial biopsy (n = 37). Autopsy and biopsy samples for histological analyses were all fixed in formalin and embedded in paraffin wax. Tumor diagnoses of primary glioblastoma were established by standard light‐microscopic evaluation of H&E sections and verified by two independent neuropathologists based on the criteria of the latest World Health Organization brain tumor classification (14).
All patients were treated at the Ludwig‐Maximilians‐University Hospital (Munich, Germany) and enrolled in quality assurance strategies of the German glioma network. All clinical data are summarized in Supporting Information Table S1. After confirmation of a glioblastoma, five patients did not receive further tumor specific therapy due to poor clinical status (Karnofsky Performance Scale < 70). The majority of patients was treated with combined radiochemotherapy with concomitant temozolomide (TMZ) followed by adjuvant chemotherapy with temozolomide (5/28 days) alone according to the EORTC/NCIC study protocol (n = 71). Of these, six patients received additional medication after enrolment into clinical studies [IL‐13 convection enhanced delivery (CED), cilengitide, nimotizumab, imatinib and hydroxyurea]. All other patients (n = 17, mainly before 2005) were treated with radiation therapy alone but one patient was given temozolomide as an adjuvant treatment until disease progression and two patients received additional radioimmunotherapy with 131‐iodine.
In case of recurrent disease, salvage treatment was chosen according to our institutional guidelines based on the concept of a personalized cancer therapy. Treatment options included re‐resection (n = 18), re‐irradiation (n = 9), first time (TMZ 5/28 days, n = 14) or intensification of TMZ (TMZ 7/7, “one week on—one week off,” n = 19) or change of chemotherapy‐protocols [PC (V) = procarbazin + CCNU (+vincristin), n = 13; ACNU, n = 1]. Moreover, several treatment procedures in compassionate use [radioimmunotherapy, n = 4; BCNU‐wafer, n = 2; stereotactic brachytherapy, n = 6; stereotactic interstitial photodynamic therapy, n = 4; or interstitial immunotoxin (IL‐13‐CED), n = 2] were delivered either alone or in combination with each other. For details, see Supporting Information Table S1.
The average age of the glioblastoma patients was 61 years; median age was 62 years, ranging from 33 to 86 years. Clinical follow‐up was available for 93 patients and ranged from 0 to 61 months, with an average of 16 months and a median follow‐up of 12 months. Progression‐free survival (PFS) ranged from 3 to 32 months with a median of 7.5 months and an average of 9.9 months. Methylation of O6‐methylguanine‐DNA methyltransferase (MGMT) was determined in 77 glioblastoma cases as described previously (4). Thirty‐three of them showed methylated MGMT promoter sequences.
Antibodies and immunohistochemistry
The primary antibodies used were anti‐ALDH1 (monoclonal mouse, BD Biosciences, Franklin Lakes, NJ, USA; 1:100), anti‐GFAP (DAKO, Carpinteria, CA, USA; 1:3000), anti‐S100 (DAKO, 1:1000), anti‐OLIG2, Chemicon, Temecula, CA, USA; 1:1000), anti‐Nestin (Chemicon, 1:2000), anti‐SOX2 (Chemicon, 1:2000) and anti‐phospho‐histone H3 (PHH3, Cell Signaling, Danvers, MA, USA; 1:1000). Secondary antibodies used for fluorescence labeling were Alexa 488 goat anti‐rabbit and Alexa 546, goat anti‐mouse (both Invitrogen, Darmstadt, Germany; 1:300). Immunohistochemistry was performed on formalin‐fixed, paraffin‐embedded sections using the DAB method on an automated system (Benchmark, Roche, Grenzach‐Wyhlen, Germany). For the visualization of nuclei, hematoxylin was used.
For double labeling, tissues were boiled on citrate buffer (pH 6) to unmask antigene epitopes. After washing in H20, endogenous peroxydase was blocked with 3% H2O2 in MeOH at room temperature for 20 minutes. To block nonspecific binding sites, I‐block blocking solution was applied for 5 minutes. Antibodies were appropriately diluted and incubated at 4°C overnight. Secondary antibodies were diluted and incubated for 45 minutes at room temperature. Cell nuclei were visualized by DAPI.
RNA extraction, real‐time RT‐PCR
For real‐time reverse transcription polymerase chain reaction (RT‐PCR) experiments, C57Bl6 wild‐type mice of indicated ages were sacrificed and total RNA was extracted from whole cerebella using TRIzol® reagent (Invitrogen). Random hexamers and Superscript II reverse transcriptase (Invitrogen) were used to run reverse transcription. For real‐time quantitative RT‐PCR, the LightCycler480 system (Roche, Basel, Switzerland) and the SYBR Green detection format was used with Beta‐2‐microglobulin as a housekeeper. Primers for B2m have been previously published (18). Sequences for Aldh1a1 were as follows: Aldh1a1 (cDNA) forward, 5′‐AGACCTGGATAAGGCCATCA‐3′; Aldh1a1 (cDNA) reverse, 5′‐GCACTGGGCTGACAACATC‐3′. For each set of primers, postamplification melting curves were analyzed using the LightCycler480 software (Roche), and agarose gel electrophoresis was performed to verify the presence of a single amplification product.
GeneChip analysis
Data from gene expression profiles during cerebellar development were obtained from the Cerebellar Developmental Transcriptome Database (CDTDB, http://www.cdtdb.brain.riken.jp/CDT/Top.jsp) and from previously published literature (10). Both data from CDTDB as well as data published by Kho et al (10) were generated by utilizing the GeneChip system (Affymetrix Mu11K, Santa Clara, CA, USA; 12 654 probes, including known mouse genes and expressed sequence tags). Data from gene expression profiles of Glioblastoma multiformes (GBMs) were obtained from the Repository of Molecular Brain Neoplasia Data (Rembrandt; http://caintegrator‐info.nci.nih.gov/rembrandt). Here, RNA has been processed using U133 2 Plus mRNA expression chips (Affymetrix), which contains >54 000 probe sets analyzing the expression level of >47 000 transcripts and variants, including 38 500 well‐characterized human genes.
Statistical analysis
ALDH1A1 expression was determined quantitatively by cell counting using the IMAGE J cell counting program (NationalInstitutes of Health, Bethesda, MD, USA). At least 1000 tumor cells per tissue sample were counted, except for stereotactically removed biopsies, where only at least 200 cells were counted due to material limitations. Two equally large subgroups were established with high and low ALDH1A1 expression, using an expression of 7.0% as cutoff. The results were entered into a database and analyzed with Sigma Stat statistics software (Systat Software, Inc., San Jose, CA, USA). Overall survival and PFS were determined by Kaplan–Meier analysis (9) and statistical significance of differences between the subgroups was evaluated using the log‐rank test. Multivariate analysis was performed by Cox regression using SPSS 17.0 software (Chicago, IL, USA). A P‐value <0.05 was considered as statistically significant.
RESULTS
ALDH1A1 expression is abundant in mature astrocytes, but absent in stem cell niches of the human CNS
In order to investigate the expression of ALDH1A1 during human CNS development, we performed immunohistochemical stainings using antibodies against ALDH1A1 on several prenatal stages. ALDH1A1 expression was neither found in the cerebrum nor in the cerebellum of a 10‐ and 14‐week‐old fetus (data not shown). Expression of ALDH1A1 during cerebral development was first detectable at 20 weeks of gestation. At this point, some ALDH1A1‐immunopositive (ALDH1A1+) cells were found in the fetal cerebral white matter (intermediate zone, Figure 1A,B). Also, a number of equally distributed cerebellar cells with multiple processes bound antibodies to ALDH1A1 (Figure 1D). ALDH1A1+ cells were located in the vermis of the cerebellum, whereas the cerebellar hemispheres were still negative for ALDH1A1 (Figure 1A). No expression was detectable in the major stem cell niches, namely the germinal matrix of the cerebrum (Figure 1A,C), the ventricular zone (Figure 1A,E) or the cerebellar external granular layer (Figure 1F). In adult brain tissue, ALDH1A1+ cells were detectable in all parts of cerebral and cerebellar gray and white matter (Figure 1G–N). While ALDH1A1+ cells had astrocytic processes, cortical neurons both in the cerebrum as well as in the cerebellum were clearly negative (Figure 1H,K–M). These data indicated that expression of ALDH1A1 increased during the development of the human CNS. In order to confirm these findings by an independent method, we extracted RNA from whole murine cerebella of different ages and quantitatively analyzed the expression of Aldh1a1 by real‐time RT‐PCR. As demonstrated in Figure 2, we found that Aldh1a1 expression clearly increases over time with low levels at posnatal day 0 and a more than 10‐fold increase by postnatal day 30. This finding of Aldh1a1 being up‐regulated over time during brain development was also confirmed when looking at publically available data from the Riken Cerebellar Developmental Transcriptome Database (Supporting Information Figure S1) and from the literature (10) (Supporting Information Figure S2). In this context, we not only looked at the expression of Aldh1a1, but also at multiple other Aldh isoforms, that is, Aldh1a2, Aldh1a3, Aldh1a7, Aldh1b1, Aldh1l1, Aldh1l2 and Aldh2. Interestingly enough, Aldh1a1 showed by far the highest expression in the CNS and was the only one that paralleled our own immunohistochemical and RNA data on increased expression levels over time (Supporting Information Figures S1 and S2). It therefore appears plausible that the antibody used for Aldh1a1 protein detection is isoform specific, and this had also been confirmed by others 8, 27.
Figure 1.
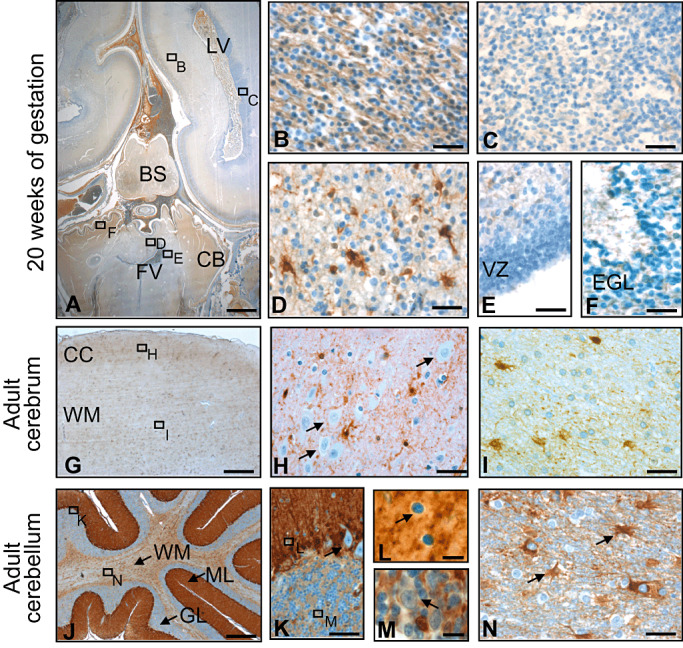
Expression of ALDH1A1 during development and in adulthood. Some expression is visible in the fetal cerebral white matter (intermediate zone; A,B), but not in the germinal matrix of the cerebrum (A,C). In the cerebellum, first expression is appearing in the vermis with strong staining in white matter cells with multiple processes (A,D). In the stem sell niches, namely the ventricular zone and the external granular layer, no ALDH1A1 expression can be observed at 20 weeks of gestation (A,E,F). In adulthood, ALDH1A1 expression is found in cells of astrocytic morphology (G–I) while neurons are negative (arrows in H). Immunostaining of the adult cerebellum reveals strong staining of Bergmann glia (J,K). Purkinje cells (arrow in K), basket cells (arrow in L) as well as Golgi cells (arrow in M) do not express ALDH1A1 and stand out negatively by a small cytoplasmic rim. In the cerebellar white matter, astrocytes express ALDH1A1 (arrows in N). LV, lateral ventricle; FV, fourth ventricle; BS, brain stem; CB, cerebellum; VZ, ventricular zone; EGL, external granular layer; CC, cerebral cortex; WM, white matter; ML, molecular layer; GL, granular layer. Bar is 2.5 mm for A; 100 µm for G and J; 20 µm for B–F, H, I, K and N; and 10 µm for L and M.
Figure 2.
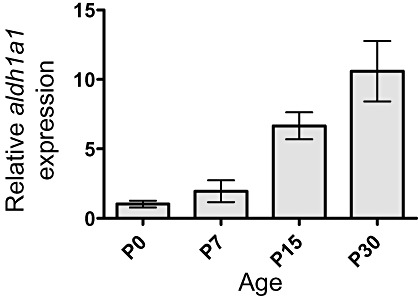
Expression of aldh1a1 during murine cerebellar development. Relative quantification of aldh1a1 expression in mouse cerebellum using quantitative real‐time RT‐PCR with results normalized to b2m. Adh1a1 expression levels increased in a time‐dependent manner from postnatal day 0 to 30.
To verify the nature of ALDH1A1‐expressing cells in the human brain, we performed co‐labeling studies on sections from human cerebellar tissue, revealing that ALDH1A1 was co‐localized with GFAP and S100, both known markers of astroglial differentiation (Figure 3A,B). In contrast, expression of ALDH1A1 and OLIG2 was mutually exclusive, suggesting that oligodendrocytes do not express ALDH1A1 (Figure 3C).
Figure 3.
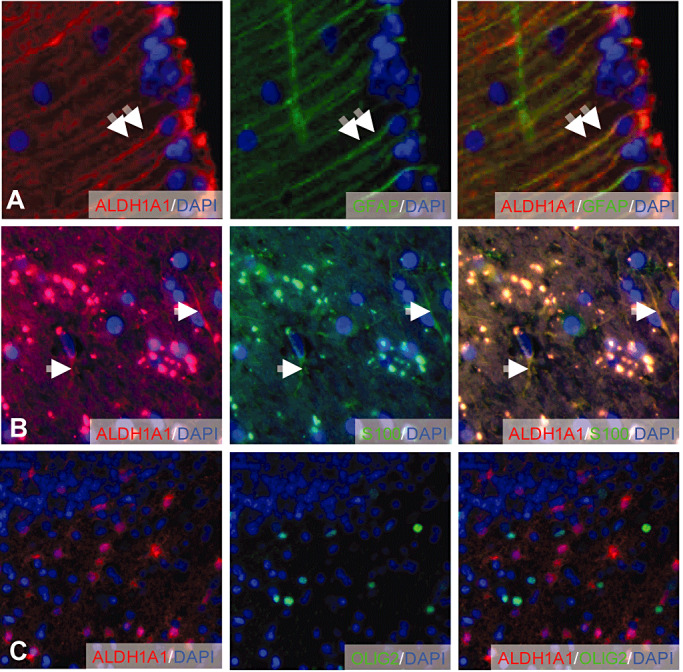
Colocalization of ALDH1A1 with GFAP, S100 and OLIG2 in adult human brain. Mature Bergmann glia cells in the cerebellar cortex co‐express GFAP and ALDH1A1 (A). ALDH1A1‐positive cells in the cerebellar white matter co‐express S100 (B). OLIG2‐positive oligodendrocytes are negative for ALDH1A1 (C). Double arrows and arrows indicate ALDH1A1‐positive cells expressing GFAP and S100, respectively.
ALDH1A1 is expressed in 99% of the analyzed GBM samples
As a next step, we investigated the expression of ALDH1A1 in human primary glioblastoma specimens. ALDH1A1 expression in glioblastoma was present in 92/93 cases (99%, Figure 4) and ranged from 0% to 49% of the tumor cells (Figure 4A–D). For further characterization of the ALDH1A1‐labeled cells within the tumor mass, we performed co‐labeling studies using antibodies against GFAP and found that 82% of the ALDH1A1+ cells expressed GFAP (103/125), suggesting an astrocytic differentiation of the ALDH1A1‐labeled tumor cells (Figure 5A,F). We also used antibodies against phosphorylated Histone H3 (PHH3), a marker for cells in the M‐phase of the cell cycle, to investigate whether ALDH1A1+ cells showed mitotic activity (Figure 5C). We only found 1.9% (14/732) of all ALDH1A1+ cells positive for PHH3, pointing toward a rather low mitotic rate of the ALDH1A1‐expressing cells (Figure 5F). Last, we tested whether ALDH1A1+ tumor cells expressed markers that are described to identify glioma stem cells, that is, Nestin (22), OLIG2 (12) or SOX2 (13). However, only a minority of ALDH1A1+ cells expressed OLIG2 (21/157, 13%, Figure 5B,F), SOX2 (42/381, 11%, Figure 5D,F) or Nestin (34/178, 19%, Figure 5E,F), suggesting that the majority of ALDH1A1+ cells does not feature stem cell characteristics.
Figure 4.
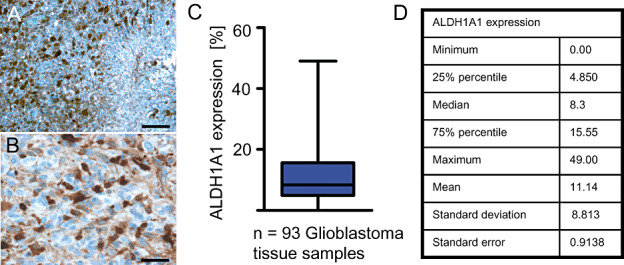
ALDH1A1 immunostaining of primary glioblastoma. Low (A) and high (B) magnifications of a representative immunostaining. There were 92 of 93 analyzed human glioblastoma samples that showed ALDH1A1 expression to various extends (C). Statistical details of ALDH1A1 expression are listed in D. Bar is 100 µm for A and 10 µm for B.
Figure 5.
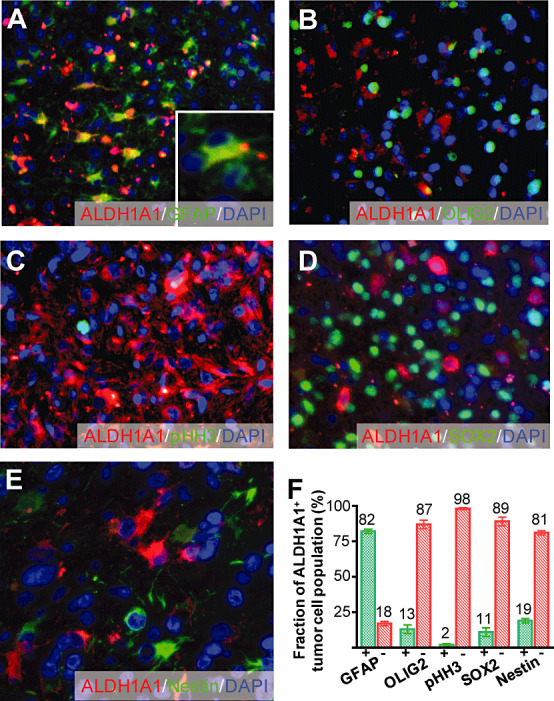
Characterization of ALDH1A1+ tumor cells. Eighty‐two percent of the ALDH1A1‐expressing cells showed a co‐expression of GFAP (A,F). However, only a minority did express the mitosis marker phosphorylated Histone H3 (pHH3, C,F) or stem cell markers such as OLIG2 (B,F), SOX2 (D,F) or Nestin (E,F).
ALDH1A1 is a marker of better clinical outcome in glioblastoma patients
In order to test whether the expression of ALDH1A1 is associated with a better or worse clinical outcome, we documented patients' clinical follow‐up, which is included in Figure 6A. We then performed Cox regression analyses with ALDH1A1 expression as an increasing scale variable in a first step. This analysis revealed a clear, but not statistically significant trend toward a better outcome in patients with glioblastoma that showed high expression of ALDH1A1. In a second step, patients were sorted on the basis of expression of ALDH1A1 and subsequently dichotomized on the basis of a series of ALDH1A1 expression levels. This strategy implemented the big advantage of generating a clear cutoff value that can be used in clinical neuropathology to estimate a patient's risk and stratify patients for clinical studies. Log‐rank significance was calculated for each cutoff and a cutoff of 7.0% was found to produce the best P‐value out of the sequence. Using this cutoff, we established two groups of patients, one of them suffering from tumors with strong expression of ALDH1A1 (n = 54) and one of them expressing tumors with weaker ALDH1A1 immunoreactivity (n = 39). Kaplan–Meier curves including these groups revealed that patients with a relatively high percentage of tumor cells expressing ALDH1A1 had a statistically significant better overall survival than patients with only moderately or weakly positive glioblastomas (P < 0.01, Figure 6B). The 2‐year survival rate was 0.31 for patients with strong expression, but only 0.11 for the remaining patients (Figure 6B). While the trend was similar for PFS, statistical significance was not reached after comparison of tumors with strong and weak ALDH1A1 expression (P = 0.267, Figure 6C). Next, we sought to investigate whether an independent cohort of GBM patients (n = 177) would show similar results. To this end, we reanalyzed data from the publicly available Rembrandt database (http://caintegrator‐info.nci.nih.gov/rembrandt) and again found a trend toward better survival in patients with GBMs expressing higher levels of ALDH1A1 (P = 0.071, Supporting Information Figure S3). The 2‐year survival rate was 30% vs. 18% in GBM patients with tumors expressing higher and lower levels of ALDH1A1, respectively.
Figure 6.
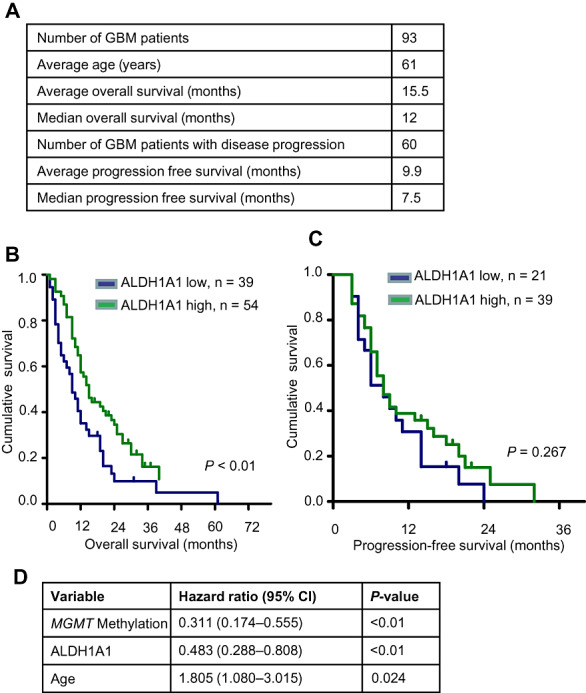
Clinical Role of ALDH1A1 expression for glioblastoma patients. Clinical data and ALDH1A1 expression data are summarized in (A). Kaplan–Meier analysis demonstrates that patients suffering from primary glioblastoma with a high number of ALDH1A1+ tumor cells have a significantly better overall survival (P < 0.01) (B). No statistically significant difference could be observed in progression‐free survival of this patient group (P < 0.01) (C). Cox multivariate analysis of overall survival is shown in (D). When compared with known prognostic factors, ALDH1A1 status was an independent prognostic factor of prognosis.
In order to assess whether ALDH1A1 expression may represent an independent prognostic marker, we performed multivariate analyses on our series (n = 93) using the Cox proportional hazard models. In addition to ALDH1A1, the model included age and MGMT promoter methylation, two known prognostic markers for overall survival for patients with glioblastoma (5). As shown in Figure 6D, expression of ALDH1A1 turned out to be a prognostic marker (P < 0.01), independent of the MGMT promoter methylation status (P = 0.024) and the age of the patient (P = 0.024) in our series.
To exclude that these results depend on the patient treatment, we separately performed the same analysis within the group of patients who were treated according to EORTC protocol, that is, radiotherapy and TMZ (n = 71). Within this group, MGMT promoter methylation is a predictive marker of high statistical significance (P < 0.001), confirming results that had previously been published by others (5) and indicating that our series was representative with respect to MGMT promoter methylation and response to TMZ treatment. Kaplan–Meier analysis within this group that compared glioblastomas with low ALDH1A1 expression (n = 29) and high ALDH1A1 expression (n = 42) again showed a significantly better overall survival for patients with tumors that display high levels of ALDH1A1 expression (P < 0.01, data not shown). Furthermore, the Cox multivariate analysis within the EORTC subgroup also confirmed ALDH1A1 as an independent marker of prognosis when looking at ALDH1A1 expression, MGMT promoter methylation status and age (P = 0.041, data not shown). We therefore conclude that ALDH1A1 expression in glioblastoma, as detected by immunohistochemistry, was associated with a better survival of the patients.
DISCUSSION
Brain tumor growth and brain development share similar mechanisms, in a way that both processes may depend on the activity of stem cells which have the capacity to self‐renew and to differentiate into different lineages (23). In malignant gliomas, these brain tumor stem cells or more commonly speaking CSCs have been accused of being at least in part responsible for the lack of persistent treatment response and therefore poor prognosis of this devastating disease (19). Identification of CSCs and continuous search for new tumor markers are therefore indispensable in order to develop new treatment strategies for glioblastomas. Thus, a closer look at expression patterns of suggested stem cell markers at different stages of brain development might lead to a deeper knowledge of brain pathology in the initiation and proliferation of malignant gliomas.
As ALDH1A1 has been suggested as a new marker for CSCs in glioblastomas (19), we analyzed a large series of various pre‐ and postnatal stages of human CNS development. Remarkably, expression of ALDH1A1 was restricted to differentiated astroglia and was not detectable in neurons, neuronal precursors or other progenitor populations. While we cannot totally exclude that ALDH1A1 may be expressed in stages earlier than 10 weeks of gestation, we think that this is unlikely, given the continuously increasing number of ALDH1A1+ cells starting at 20 weeks of gestation. Hence, our results indicate that ALDH1A1 expression first appears in the more differentiated parts of the developing brain like cerebellar vermis or fetal white matter, especially regarding the total lack of expression in the stem cell niches of the cerebellar external granule cell layer and of the cerebral germinal matrix. ALDH1A1 protein expression therefore seems to be associated with advanced differentiation of astroglia. These results are in line with recent studies on Aldh1a1‐deficient mice showing that Aldh1a1 is dispensable for the function of CNS stem cells (11). Moreover, our own experimental data as well as data from publicly available gene expression analysis showed a time‐dependent increase in Aldh1a1 expression in the murine cerebellum, which further supports our findings.
Immunohistochemical analysis of ALDH1A1 expression in human glioblastoma tissue revealed broad expression in almost all samples of a large series of tumor samples (n = 93). In particular, we found that ALDH1A1 expression was largely confined to tumor cells that appeared differentiated and expressed GFAP, but not OLIG2, SOX2 or Nestin. Interestingly, Rasper and colleagues had shown that ALDH1A1 was co‐expressed with Musashi‐1 in LN18 glioma cells (19). However, these results were restricted to a single cell line and to Musashi‐1 as the only marker used for co‐labeling analysis (19). They also found various degrees of ALDH1A1 expression in 20 out of 24 glioblastoma samples, with four specimens being negative. While the presence of ALDH1A1+ cells in this small series was detected mainly in the perivascular and hypoxic areas around tumor necrosis, both the biological nature as well as the clinical significance of ALDH1A1+ tumor cells remained unclear (19).
Another study indeed linked expression of ALDH1A1 to poor overall survival in glioblastoma patients (1). A major difference, however, between our study and the work by Campos et al is the antibody that had been used to detect expression of ALDH1A1. While we and others have extensively verified specificity of the clone 44 antibody to detect ALDH1A1 8, 27, cross‐reaction of the ALDH1‐antibodies used by Campos et al with other isoenzymes appears possible. Apart from the specificity of the different antibodies, we feel that our clinical data are supported by the results from developmental expression patterns by ourselves and others. It also appears worth mentioning that Campos and colleagues did not display exact criteria for quantification of high and low ALDH1A1 expression as we did in the present study. Last, it is unclear how many of all patients analyzed truly had primary glioblastomas and how they had been treated. Altogether, these unanswered questions limit comparability of both studies and further confirmatory investigations will be necessary to elucidate the role of ALDH1A1 for clinical outcome in patients with primary glioblastomas.
In line with our findings that ALDH1A1 is predominantly expressed by differentiated astroglia during normal development and by differentiated glial tumor cells, we found that strong expression of ALDH1A1 in glioblastoma is associated with a significantly better survival of the patients. While this was independent from MGMT promoter methylation status and age in our series, it remains unclear whether expression of ALDH1A1 is associated with other tumor features such as distinct molecular subgroups that are defined by global gene expression profiling and that may influence patient's outcome. Similar to ALDH1A1, aldehyde dehydrogenase 1 family member L1 (ALDH1L1) had previously been shown to be correlated with a significantly better outcome in patients with pilocytic astrocytoma (21). Even if our results are further supported by a study that links ALDH1A1 expression to favorable outcome in ovarian and pancreatic cancer 2, 8, they are in contrast to the findings obtained in breast cancer tissue, where ALDH1A1 was found to be expressed by cancer stem cells and associated with a particularly poor clinical outcome (3). One could therefore conclude that ALDH1A1 may have different functions and prognostic values depending on the tissue that is analyzed.
In conclusion, we present evidence that ALDH1A1 may serve as a marker for astroglial differentiation in CNS development. Furthermore, our immunohistochemistry on diagnostic paraffin sections helped to identify tumors with a different biological behavior and thus may provide a further step to personalize therapy. To find out if ALDH1A1 expression can be linked reliably with better or worse clinical outcome, future prospective studies will have to be performed.
Supporting information
Figure S1. Expression of different Aldh isoforms in mouse cerebellar tissue at different developmental timepoints. RNA from whole cerebellar of indicated ages was extracted and quantitatively explored by GeneChip analyses. Data were obtained from the Cerebellar Developmental Transcriptome Database (CDTDB, http://www.cdtdb.brain.riken.jp/CDT/Top.jsp).
Figure S2. Expression of different Aldh isoforms in mouse cerebellar tissue at different developmental timepoints. RNA from whole cerebellar of indicated ages was extracted and quantitatively explored by GeneChip analyses. Graphs are build from reanalyzed data from previously published research (10).
Figure S3. Kaplan–Meier survival plot for GBM samples with differential ALDH1A1 gene expression. Publicly available data from the Repository of Molecular Brain Neoplasia Data (Rembrandt; http://caintegrator‐info.nci.nih.gov/rembrandt) were analyzed for gene expression of ALDH1A1 in GBM patients. Rembrandt allows categorization of patients into three groups (up‐regulated, intermediate and down‐regulated). Up‐regulation (>2×) was only observed in four patients and therefore not considered for statistical analysis. Intermediate expression (n = 96) was therefore considered as higher and down‐regulation (n = 81) as lower expression. Affymetrix gene expression analysis of ALDH1A1 [Reporter: 212224_at (Lowest Geometric Mean Intensity)] in GBM shows a tendency toward better prognosis for patients with higher vs. lower expression [Log‐rank P‐value = 0.071 (for significance of difference of survival between group of samples)].
Table S1. Summary of clinical data, molecular genetic signatures (MGMT promoter status, ALDH expression) and individual treatment modalities of all analyzed patients. Histological and molecular genetic analysis was acquired by tumor resection (TR) or stereotactical serial biopsy (SBx). First‐line therapy consisted either of radiation therapy (RT) alone (mainly before 2005) or of radiotherapy with concomitant chemotherapy with temozolomide (RCTx) followed by temozolomide (TMZ 5/28 days) for at least six cycles according to the EORTC/NCIC‐protocol (26). In case of tumor recurrence, individual treatment concepts were rendered in order to meet the requirements for a personalized cancer therapy. Treatment options included re‐resection (ReTR), re‐irradation (ReRT) with/without chemotherapy (+TMZ) or anti‐angiogenic therapy with bevacizumab (+BEV) as well as a dose‐intensified TMZ protocol (TMZ 7/7 = one week on − one week off) or other chemotherapy protocols like PC(V) [procarbazin + CCNU (+vincristin)] or ACNU. Moreover, local therapies included microsurgical BCNU‐wafer implantation and stereotactical interstitial photodynamic therapy (iPDT) as well as stereotactical brachytherapy (SBT) using transient 125‐iodine seeds. Only few patients had received additional study medication as they were included into clinical trials [IL‐13 convection enhanced delivery (CED), cilengitide (CIL), nimotizumab (NIM), imatinib (IMA) and hydroxyurea (HU)]. In case of failure of all reasonable tumor‐specific therapies, supportive and palliative care (SPC) was initiated. If patients were lost to clinical follow‐up (LTFU), the last status was acquired by chart review or contact with the family doctor. A change in therapy is indicated by an arrow (→).
Supporting info item
Supporting info item
ACKNOWLEDGMENTS
The authors thank M. Schmidt, M. Ruiter, A. Henn and B. Kraft for excellent technical assistance, as well as M. Deschner for support with the clinical data inquiry, and Dr. R. Glass for helpful discussions. This work was supported by the Deutsche Krebshilfe (Max‐Eder‐Nachwuchsgruppen‐programm), the Wilhelm‐Sander‐Stiftung and the Friedrich‐Baur‐Stiftung (all to U.S.). This study was performed as a local, single institutional study within the framework of the German Glioma Network funded by “Deutsche Krebshilfe.”
REFERENCES
- 1. Campos B, Centner F‐S, Bermejo JL, Ali R, Dorsch K, Wan F et al (2011) Aberrant expression of retinoic acid signaling molecules influences patient survival in astrocytic gliomas. Am J Pathol 178:1953–1964. [DOI] [PMC free article] [PubMed] [Google Scholar]
- 2. Chang B, Liu GZ, Xue FX, Rosen DG, Xiao LC, Wang XM et al (2009) ALDH1 expression correlates with favorable prognosis in ovarian cancers. Mod Pathol 22:817–823. [DOI] [PMC free article] [PubMed] [Google Scholar]
- 3. Ginestier C, Hur MH, Charafe‐Jauffret E, Monville F, Dutcher J, Brown M et al (2007) ALDH1 is a marker of normal and malignant human mammary stem cells and a predictor of poor clinical outcome. Cell Stem Cell 1:555–567. [DOI] [PMC free article] [PubMed] [Google Scholar]
- 4. Grasbon‐Frodl EM, Kreth FW, Ruiter M, Schnell O, Bise K, Felsberg J et al (2007) Intratumoral homogeneity of MGMT promoter hypermethylation as demonstrated in serial stereotactic specimens from anaplastic astrocytomas and glioblastomas. Int J Cancer 121:2458–2464. [DOI] [PubMed] [Google Scholar]
- 5. Hegi ME, Liu LL, Herman JG, Stupp R, Wick W, Weller M et al (2008) Correlation of O‐6‐Methylguanine methyltransferase (MGMT) promoter methylation with clinical outcomes in glioblastoma and clinical strategies to modulate MGMT activity. J Clin Oncol 26:4189–4199. [DOI] [PubMed] [Google Scholar]
- 6. Huang EH, Hynes MJ, Zhang T, Ginestier C, Dontu G, Appelman H et al (2009) Aldehyde dehydrogenase 1 is a marker for normal and malignant human colonic stem cells (SC) and tracks SC overpopulation during colon tumorigenesis. Cancer Res 69:3382–3389. [DOI] [PMC free article] [PubMed] [Google Scholar]
- 7. Jiang F, Qiu Q, Khanna A, Todd NW, Deepak J, Xing LX et al (2009) Aldehyde dehydrogenase 1 is a tumor stem cell‐associated marker in lung cancer. Mol Cancer Res 7:330–338. [DOI] [PMC free article] [PubMed] [Google Scholar]
- 8. Kahlert C, Bergmann F, Beck J, Welsch T, Mogler C, Herpel E et al (2011) Low expression of aldehyde deyhdrogenase 1A1 (ALDH1A1) is a prognostic marker for poor survival in pancreatic cancer. BMC Cancer 11:275. [DOI] [PMC free article] [PubMed] [Google Scholar]
- 9. Kaplan EL, Meier P (1958) Nonparametric estimation from incomplete observations. J Am Stat Assoc 53:457–481. [Google Scholar]
- 10. Kho AT, Zhao Q, Cai Z, Butte AJ, Kim JY, Pomeroy SL et al (2004) Conserved mechanisms across development and tumorigenesis revealed by a mouse development perspective of human cancers. Genes Dev 18:629–640. [DOI] [PMC free article] [PubMed] [Google Scholar]
- 11. Levi BP, Yilmaz OH, Duester G, Morrison SJ (2009) Aldehyde dehydrogenase 1a1 is dispensable for stem cell function in the mouse hematopoietic and nervous systems. Blood 113:1670–1680. [DOI] [PMC free article] [PubMed] [Google Scholar]
- 12. Ligon KL, Huillard E, Mehta S, Kesari S, Liu H, Alberta JA et al (2007) Olig2‐regulated lineage‐restricted pathway controls replication competence in neural stem cells and malignant glioma. Neuron 53:503–517. [DOI] [PMC free article] [PubMed] [Google Scholar]
- 13. Liu QH, Nguyen DH, Dong QH, Shitaku P, Chung K, Liu OY et al (2009) Molecular properties of CD133+glioblastoma stem cells derived from treatment‐refractory recurrent brain tumors. J Neurooncol 94:1–19. [DOI] [PMC free article] [PubMed] [Google Scholar]
- 14. Louis DN, Ohgaki H, Wiestler OD, Cavenee WK (2007) WHO Classification of Tumours of the Central Nervous System. IARC Press: Lyon. [DOI] [PMC free article] [PubMed] [Google Scholar]
- 15. Ma I, Allan AL (2011) The role of human aldehyde dehydrogenase in normal and cancer stem cells. Stem Cell Rev 7:292–306. [DOI] [PubMed] [Google Scholar]
- 16. Marcato P, Dean CA, Giacomantonio CA, Lee PWK (2011) Aldehyde dehydrogenase Its role as a cancer stem cell marker comes down to the specific isoform. Cell Cycle 10:1378–1384. [DOI] [PubMed] [Google Scholar]
- 17. Niederreither K, Fraulob V, Garnier JM, Chambon P, Dollé P (2002) Differential expression of retinoic acid‐synthesizing (RALDH) enzymes during fetal development and organ differentiation in the mouse. Mech Dev 110:165–171. [DOI] [PubMed] [Google Scholar]
- 18. Pöschl J, Lorenz A, Hartmann W, von Bueren AO, Kool M, Li S et al (2011) Expression of BARHL1 in medulloblastoma is associated with prolonged survival in mice and humans. Oncogene 30:4721–4730. [DOI] [PMC free article] [PubMed] [Google Scholar]
- 19. Rasper M, Schäfer A, Piontek G, Teufel J, Brockhoff G, Ringel F et al (2011) Aldehyde dehydrogenase 1 positive glioblastoma cells show brain tumor stem cell capacity. Neuro-Oncol 12:1024–1033. [DOI] [PMC free article] [PubMed] [Google Scholar]
- 20. Rich JN, Eyler CE (2008) Cancer stem cells in brain tumor biology. In: Control and Regulation of Stem Cells. Stillman B, Stewart S, Grodzicker T (eds), pp. 411–420. Cold Spring Harbor Laboratory Press: Woodbury. [DOI] [PMC free article] [PubMed] [Google Scholar]
- 21. Rodriguez FJ, Giannini C, Asmann YW, Sharma MK, Perry A, Tibbetts KM et al (2008) Gene expression profiling of NF‐1‐associated and sporadic pilocytic astrocytoma identifies aldehyde dehydrogenase I family member L1 (ALDHIL1) as an underexpressed candidate biomarker in aggressive subtypes. J Neuropathol Exp Neurol 67:1194–1204. [DOI] [PMC free article] [PubMed] [Google Scholar]
- 22. Singh SK, Clarke ID, Hide T, Dirks PB (2004) Cancer stem cells in nervous system tumors. Oncogene 23:7267–7273. [DOI] [PubMed] [Google Scholar]
- 23. Singh SK, Clarke ID, Terasaki M, Bonn VE, Hawkins C, Squire J et al (2003) Identification of a cancer stem cell in human brain tumors. Cancer Res 63:5821–5828. [PubMed] [Google Scholar]
- 24. Singh SK, Hawkins C, Clarke ID, Squire JA, Bayani J, Hide T et al (2004) Identification of human brain tumour initiating cells. Nature 432:396–401. [DOI] [PubMed] [Google Scholar]
- 25. Stummer W, Pichlmeier U, Meinel T, Wiestler OD, Zanella F, Reulen HJ et al (2006) Fluorescence‐guided surgery with 5‐aminolevulinic acid for resection of malignant glioma: a randomised controlled multicentre phase III trial. Lancet Oncology 7:392–401. [DOI] [PubMed] [Google Scholar]
- 26. Stupp R, Mason WP, van den Bent MJ, Weller M, Fisher B, Taphoorn MJB et al (2005) Radiotherapy plus concomitant and adjuvant temozolomide for glioblastoma. N Engl J Med 352:987–996. [DOI] [PubMed] [Google Scholar]
- 27. Vogler T, Kriegl L, Horst D, Engel J, Sagebiel S, Schäffauer AJ et al (2012) The expression pattern of aldehyde dehydrogenase 1 (ALDH1) is an independent prognostic marker for low survival in colorectal tumors. Exp Mol Pathol 92:111–117. [DOI] [PubMed] [Google Scholar]
Associated Data
This section collects any data citations, data availability statements, or supplementary materials included in this article.
Supplementary Materials
Figure S1. Expression of different Aldh isoforms in mouse cerebellar tissue at different developmental timepoints. RNA from whole cerebellar of indicated ages was extracted and quantitatively explored by GeneChip analyses. Data were obtained from the Cerebellar Developmental Transcriptome Database (CDTDB, http://www.cdtdb.brain.riken.jp/CDT/Top.jsp).
Figure S2. Expression of different Aldh isoforms in mouse cerebellar tissue at different developmental timepoints. RNA from whole cerebellar of indicated ages was extracted and quantitatively explored by GeneChip analyses. Graphs are build from reanalyzed data from previously published research (10).
Figure S3. Kaplan–Meier survival plot for GBM samples with differential ALDH1A1 gene expression. Publicly available data from the Repository of Molecular Brain Neoplasia Data (Rembrandt; http://caintegrator‐info.nci.nih.gov/rembrandt) were analyzed for gene expression of ALDH1A1 in GBM patients. Rembrandt allows categorization of patients into three groups (up‐regulated, intermediate and down‐regulated). Up‐regulation (>2×) was only observed in four patients and therefore not considered for statistical analysis. Intermediate expression (n = 96) was therefore considered as higher and down‐regulation (n = 81) as lower expression. Affymetrix gene expression analysis of ALDH1A1 [Reporter: 212224_at (Lowest Geometric Mean Intensity)] in GBM shows a tendency toward better prognosis for patients with higher vs. lower expression [Log‐rank P‐value = 0.071 (for significance of difference of survival between group of samples)].
Table S1. Summary of clinical data, molecular genetic signatures (MGMT promoter status, ALDH expression) and individual treatment modalities of all analyzed patients. Histological and molecular genetic analysis was acquired by tumor resection (TR) or stereotactical serial biopsy (SBx). First‐line therapy consisted either of radiation therapy (RT) alone (mainly before 2005) or of radiotherapy with concomitant chemotherapy with temozolomide (RCTx) followed by temozolomide (TMZ 5/28 days) for at least six cycles according to the EORTC/NCIC‐protocol (26). In case of tumor recurrence, individual treatment concepts were rendered in order to meet the requirements for a personalized cancer therapy. Treatment options included re‐resection (ReTR), re‐irradation (ReRT) with/without chemotherapy (+TMZ) or anti‐angiogenic therapy with bevacizumab (+BEV) as well as a dose‐intensified TMZ protocol (TMZ 7/7 = one week on − one week off) or other chemotherapy protocols like PC(V) [procarbazin + CCNU (+vincristin)] or ACNU. Moreover, local therapies included microsurgical BCNU‐wafer implantation and stereotactical interstitial photodynamic therapy (iPDT) as well as stereotactical brachytherapy (SBT) using transient 125‐iodine seeds. Only few patients had received additional study medication as they were included into clinical trials [IL‐13 convection enhanced delivery (CED), cilengitide (CIL), nimotizumab (NIM), imatinib (IMA) and hydroxyurea (HU)]. In case of failure of all reasonable tumor‐specific therapies, supportive and palliative care (SPC) was initiated. If patients were lost to clinical follow‐up (LTFU), the last status was acquired by chart review or contact with the family doctor. A change in therapy is indicated by an arrow (→).
Supporting info item
Supporting info item