

Abstract
Neuroendocrine, metabolic and autonomic nervous system dysfunctions are prevalent among patients with Huntington's disease (HD) and may underlie symptoms such as depression, weight loss and autonomic failure. Using post‐mortem paraffin‐embedded tissue, we assessed the integrity of the major neuropeptide populations in the paraventricular nucleus (PVN)—the hypothalamic neuroendocrine and autonomic integration center—in HD patients. The number corticotropin‐releasing hormone, cocaine‐ and amphetamine‐regulated transcript, arginine vasopressin and oxytocin immunoreactive (ir) neurons did not differ between HD patients and control subjects. However, the significant positive correlation between arginine vasopressin and oxytocin ir neurons in control subjects (P = 0.036) was absent in patients. Corticotropin‐releasing hormone mRNA levels were 68% higher in HD patients (P = 0.046). Thyrotropin‐releasing hormone mRNA levels did not differ between HD patients and control subjects, although a negative correlation with disease duration was present in the former (P = 0.036). These findings indicate that the PVN is largely unaffected in HD patients. However, our findings suggest that hypothalamic‐pituitary‐thyroid axis activity may alter during the course of the disease and that autonomic nervous system dysfunction might partly arise from an imbalance between arginine vasopressin and oxytocin neurons in the PVN.
Keywords: cocaine‐ and amphetamine‐regulated transcript, corticotropin‐releasing hormone, Huntington's disease, hypothalamus, paraventricular nucleus, thyrotropin‐releasing hormone
INTRODUCTION
In Huntington's disease (HD), an autosomal dominant neurodegenerative disorder caused by an expanded CAG repeat sequence in the HTT gene, neuroendocrine and autonomic disturbances are prevalent 8, 20, 23, 24. In both HD patients and transgenic mouse models of this disease disturbances of the hypothalamic‐pituitary‐adrenal (HPA) and hypothalamic‐pituitary‐thyroid (HPT) axes have been reported 6, 8, 22, 29. Autonomic nervous system (ANS) disturbances, such as gastrointestinal complaints, urinary incontinence and cardiovascular disturbances, have also repeatedly been reported in HD patients 5, 11, 21, 30. With its extensive projections throughout the central nervous system and to the pituitary, the hypothalamic paraventricular nucleus (PVN) is one of the major structures involved in central ANS and neuroendocrine functioning (31).
Elucidation of the mechanisms underlying neuroendocrine and autonomic alterations in HD patients is of great importance as these alterations might underlie potentially treatable and prevalent symptoms such as depression, weight loss and ANS dysfunction 3, 33. As the PVN serves as a major hypothalamic neuroendocrine and autonomic integration center (31) and has so far only been studied once at neuropeptide level in HD patients (15), we aimed to assess its functional integrity. Therefore, we determined the expression of its major regulatory neuropeptides, that is, corticotropin‐releasing hormone and thyrotropin‐releasing hormone (CRH and TRH, respectively), arginine vasopressin (AVP), oxytocin (OXT) and cocaine‐ and amphetamine‐regulated transcript (CART).
METHODS
Post‐mortem material
Paraffin‐embedded hypothalamic tissue of nine HD patients and nine control subjects matched for sex, age, clock time and month of death; post‐mortem delay and fixation time (Table 1) were obtained through the Netherlands Brain Bank (NBB). Written informed consent for brain autopsy, use of brain material and use of medical records for research purposes was acquired by the NBB from patients or their next of kin.
Table 1.
Clinicopathological characteristics of patients with Huntington's disease and control subjects. Abbreviations: NBB = Netherlands Brain Bank number; M = male; F = female; CTD = clock time of death; MD = month of death; PMD = post‐mortem delay; FIX = fixation time (in days); CAG = mutant Huntingtin CAG repeat length; HD = Huntington's disease; NA = not assessed; SEM = standard error of mean; Vonsattel = HD disease staging according to Vonsattel et al's criteria (36)
| NBB | Sex | Age | Onset | CTD | MD | PMD | Fix | CAG | CSF pH | Vonsattel | Cause of death | ||
|---|---|---|---|---|---|---|---|---|---|---|---|---|---|
| Patients | 99‐108 | HD‐1 | M | 49 | 40 | 9:15 | 8 | 5:45 | 49 | 51 | 6.30 | 3 | Cachexia |
| 03‐047 | HD‐2 | F | 50 | 35 | 18:25 | 6 | 5:40 | 55 | 47 | 6.46 | 2 | Pneumonia | |
| 92‐105 | HD‐3 | M | 54 | 41 | 9:55 | 12 | 3:50 | 80 | ND | ND | 2 | Sudden death | |
| 95‐060 | HD‐4 | M | 57 | 42 | 3:30 | 6 | 7:30 | 53 | 46 | 6.46 | 3 | Cachexia | |
| 08‐044 | HD‐5 | M | 59 | 50 | 18:10 | 5 | 5:05 | 52 | 44 | 6.90 | 1 | Legal euthanasia | |
| 01‐128 | HD‐6 | M | 61 | 39 | 10:55 | 11 | 10:25 | 48 | 43 | 6.57 | 2 | Pneumonia | |
| 98‐047 | HD‐7 | F | 67 | 56 | 10:10 | 4 | 6:05 | 41 | 45 | 6.70 | 1 | Legal euthanasia | |
| 99‐120 | HD‐8 | M | 79 | 54 | 19:00 | 10 | 6:15 | 34 | 44 | 6.45 | 4 | Pneumonia | |
| 00‐109 | HD‐9 | F | 80 | 58 | 7:15 | 10 | 22:30 | 49 | 41 | 6.54 | 2 | Pneumonia | |
| Mean | 62 | 46 | 11:50 | 8 | 8:07 | 51 | 45 | 6.55 | 2 | ||||
| SEM | 4 | 3 | 1:49 | 1 | 1:53 | 4 | 1 | 0.06 | 0.3 | ||||
| Controls | 99‐080 | C‐1 | M | 56 | — | 20:40 | 3 | 12:20 | 112 | — | ND | — | Heart failure |
| 97‐127 | C‐2 | F | 49 | — | 3:30 | 4 | 13:30 | 165 | — | ND | — | Cervix carcinoma | |
| 98‐027 | C‐3 | M | 54 | — | 9:00 | 12 | 8:00 | 59 | — | ND | — | Hepatocellular carcinoma | |
| 99‐141 | C‐4 | M | 44 | — | 10:00 | 7 | 7:00 | 149 | — | ND | — | Cardiac infarction | |
| 98‐127 | C‐5 | M | 56 | — | 15:45 | 8 | 5:25 | 35 | — | 6.55 | — | Cardiac infarction | |
| 92‐042 | C‐6 | M | 61 | — | 21:00 | 4 | 13:50 | 52 | — | 7.20 | — | Esophageal carcinoma | |
| 98‐161 | C‐7 | F | 61 | — | 8:06 | 8 | 8:54 | 87 | — | ND | — | Ovarium carcinoma | |
| 93‐060 | C‐8 | M | 79 | — | 14:00 | 2 | 3:00 | 53 | — | ND | — | Leaking aorta prosthesis | |
| 00‐022 | C‐9 | F | 83 | — | 7:45 | 2 | 21:00 | 34 | — | 6.52 | — | Cardiac infarction | |
| Mean | 60 | — | 12:11 | 6 | 10:19 | 83 | — | 6.76 | — | ||||
| SEM | 4 | — | 2:00 | 1 | 1:48 | 16 | — | 0.13 | — | ||||
| Level of significance | 0.73* | — | 0.88† | 0.71† | 0.08* | 0.14* | — | — | — |
Mardia–Watson test.
Mann–Whitney U‐test.
The diagnosis of HD was clinically and neuropathologically confirmed in all patients. Additionally, the diagnosis was genetically confirmed (CAG repeat ≥ 39) in all but one patient (NBB 92‐105). The latter patient, however, had a positive family history and the clinical features of HD, and a confirmed Vonsattel grade II HD neuropathology with neuronal intranuclear and cytoplasmic inclusions (36). Vonsattel grading (Table 1) was conducted by neuropathologists at the Leiden University Medical Center, which has extensive experience on HD, as it serves as the Dutch center of reference for this disease. Exclusion criteria for control subjects were primary neurological and/or psychiatric disorders; and for both HD patients and control subjects, glucocorticoid therapy during the last 2 months prior to death.
Immunocytochemistry
Every 100th, 6 µm thick, section of the PVN was mounted in four series, one each for CRH, AVP, OXT and CART, on Superfrost Plus slides (Menzel, Germany) and dried for 2 days at 37°C. Sections were deparaffinized in xylene, rehydrated in graded ethanol and incubated in a rat‐anti‐human‐CRH antibody (PFU 83, Netherlands Institute for Neuroscience) 1:100 000, or a rabbit‐anti‐human‐AVP antibody (Truus, Netherlands Institute for Neuroscience) 1:800 or a rabbit‐anti‐human‐OXT antibody (O2T, Netherlands Institute for Neuroscience) 1:1000 or a mouse‐anti‐human‐CART antibody (Santa Cruz, sc‐73764, Santa Cruz, CA, USA) 1:5000 in SUMI (0.25% gelatin, 0.5% TritonX‐100, 0.05 M Tris and 0.15 M NaCl; pH 7.6). After overnight incubation, sections were further incubated in biotinylated goat‐anti‐rat IgG, goat‐anti‐rabbit IgG or goat‐anti‐mouse IgG (Vector Laboratories Inc., Burlingame, CA, USA) 1:400 in SUMI, respectively, and afterwards in ABC‐complex (Vector Laboratories Inc.) 1:800 in TBS (0.05 M Tris and 0.15 M NaCl; pH 7.6). Visualization of the immunoreaction product (ir) was achieved by incubation in 3,3′‐diaminobenzidine (Sigma, St. Louis, MO, USA) 0.5 mg/mL TBS, containing 0.23% (w/v) nickel ammonium sulfate (Merck, Rahway, NJ, USA) and 0.01% (v/v) H2O2 (Merck).
Antibody specificity
Specificity of the CRH, AVP and OXT antibodies has been described before 7, 28, 34, 38. In addition, none of the latter antibodies nor the CART antibody showed reactivity with spot‐blots of the following peptides (20 pmol), formalin‐fixed onto 0.2% gelatin‐coated nitrocellulose paper (32), using an identical staining procedure as used for the hypothalamic sections as described in the immunocytochemistry section: porcine neuropeptide Y [1–36], agouti‐related peptide [83–132], α‐melanocyte stimulating hormone (MSH), β‐MSH, γ‐MSH, galanin, adrenocorticotropic hormone (ACTH) [1–39], luteinizing hormone releasing hormone, somatostatin‐14 and ‐28 and melanin concentrating hormone (MCH). Moreover, the CRH antibody showed no reactivity with CART [106–129], OXT and AVP peptide; the AVP antibody had no reactivity with CART [106–129], OXT and CRH peptide; the OXT antibody did not react with CART [106–129], CRH or AVP peptide. The CART antibody also showed no reactivity with CRH, AVP and OXT peptide.
CRH in situ hybridization (ISH)
Methods used for CRH ISH were identical to what has been described by others (17). Briefly, a 48‐bp oligonucleotide probe complementary to bp 1853–1900 of the human prepro‐CRH gene (GenBank V00571) was used. The probe was end labeled with [35S] dATP (PerkinElmer, Waltham, MA, USA) by means of terminal transferase (Roche, Indianapolis, IN, USA) and was dissolved in hybridization buffer (HBF: 0.5 M NaCl, 1 × Denhardt's solution, 10 mM Tris‐HCl, 1 mM EDTA, 10% dextran sulphate, 0.5 mg/mL yeast tRNA, 50% Formamide and 800 mM DTT). Following deparaffinization in xylene, rehydration via a descending series of ethanol and brief rinses in phosphate‐buffered saline (PBS), sections were autoclaved at 120°C under a pressure of 1 bar in 0.01 M citrate buffer (pH 6.0). Each section was incubated with approximately 1.0 × 10⁶ cpm, coverslipped and hybridized overnight at 42°C. The following day, coverslips were gently removed and sections sequentially washed in 0.3 M sodium chloride solution with 0.015 M sodium citrate (SSC) at 46°C. Finally, sections were dehydrated in graded mixtures of 300 mM ammonium acetate (pH 5.5) and absolute ethanol and exposed to autoradiographic film (Eastman Kodak Company, Rochester, NY, USA) for 5 days. Subsequently, films were developed for 5 minutes in Kodak D‐19 developer (Eastman Kodak Company) and fixed in Kodak Maxfix for 5 minutes.
TRH ISH
Methods used for TRH ISH and probe specificity have been extensively described by others (1). Briefly, an oligonucleotide probe complementary to bp 330–549 of the human prepro‐TRH gene was used. The probe was end labeled with [35S] dCTP (PerkinElmer) by means of terminal transferase (Roche) and dissolved in HBF to a final concentration of 0.8 × 10⁶ cpm per section. Consecutively, sections were coverslipped and hybridized overnight at 66°C. The following day, coverslips were gently removed and sections were sequentially washed at 60°C in SSC. Finally, sections were dehydrated in graded mixtures of 300 mM ammonium acetate (pH 5.5) and absolute ethanol and exposed to autoradiographic film (Eastman Kodak Company) for 1 day. Subsequently, the film was developed for five min in Kodak D‐19 developer (Eastman Kodak Company) and fixed in Kodak Maxfix for 5 minutes.
Quantification
For an estimation of the total number of PVN neurons immunoreactive (ir) for each respective neuropeptide, every 100th (6 µm thick) section throughout the PVN in rostro‐caudal direction of each subject was used for analysis. All analyses were performed on the PVN in the left half of the hypothalamus for all subjects. Estimates were made using an image analysis system (ImagePro version 4.5, Media Cybernetics, Silver Spring, MD, USA) connected to a camera (JVC KY‐F553CCD) and plain objective microscope (Zeiss Axioskop with Plan‐NEOFLUAR Zeiss objectives, Carl Zeiss GmbH, Jena, Germany). Analysis consisted of two steps: (i) area selection of the PVN and determining the number of ir neurons with a visible nucleolus, serving as a unique marker for individual neurons; and (ii) determination of the number of neuropeptide‐ir neurons. Area selection and sampling were performed at 2.5 objective and the image was loaded into the image analysis system and displayed on the monitor. Position and scanning stage using x and y coordinates were stored. In this image, the area covered by the PVN was manually outlined and over this outlined area a grid was superimposed. From the respective grid fields, x and y coordinates were stored and all individual images were retrieved at 40× objective on the image analysis monitor. In these images, the manually outlined borders of the PVN area were visible and within these borders each neuropeptide‐ir neuron containing a nucleolus was counted. The number of neurons per section was multiplied by the sampling frequency to obtain an estimation of the total number of ir neurons in the PVN. This method has been described before 16, 37. The number of neurons was taken to reflect peptide contents, as, for example, the number of ir hypothalamic neurons decreases with peptide contents measured by radioimmunoassay (26). The mean (±SD) number of sections quantified were as follows (HD patients and control subjects, respectively): CRH 10 ± 2 and 9 ± 1; AVP 12 ± 2 and 10 ± 2; OXT 14 ± 2 and 11 ± 2; CART 11 ± 2 and 11 ± 2.
Gray values of individual autoradiograms for CRH and TRH were related to existing standard curves for each neuropeptide. The outcome was multiplied by the area covered by the respective neuropeptide signal and subsequently by the sample frequency to obtain an estimate for the total amount of CRH‐ and TRH‐mRNA in the PVN in arbitrary units (AU). These procedures have been described elsewhere (25). Densitysignal / Densitybackground ratio has been shown to be on average 2 in previous studies from our institute, and likewise in the present study, and these ratios were independent of confounding factors such as fixation time, post‐mortem delay and storage time, indicating compatibility of routinely processed paraffin tissue with signal quantification (25). The mean (±SD) number of sections quantified were as follows (HD patients and control subjects, respectively): CRH 6 ± 2 and 7 ± 2; TRH 6 ± 2 and 8 ± 3. The number of sections used for ISH analyses were different from those used for the immunocytochemical analyses as the latter technique is relatively more accurate in detecting small numbers of neurons in a given section. As it was possible to discern even a single neuron on a given section with immunocytochemistry techniques in both the beginning and the end of the PVN, as opposed to the ISH technique, fewer positive sections from the rostral and caudal ends of the PVN were required for the ISH analyses.
All analyses for all neuropeptides were conducted by two observers independently of each other and blinded for the groups. For inter‐rater reliability, Cronbach's alpha was used as a measure and was 0.960–0.974 for all analyses. The results in this study represent the mean of their observations.
Statistical analysis
All data are presented as mean ± SEM unless otherwise specified. Differences between groups were statistically evaluated by the nonparametric Mann–Whitney U‐test (two‐tailed). Intergroup differences in clock time and month of death were evaluated using the Mardia–Watson test. Spearman's ρ was used to assess all correlations. P < 0.05 was considered to be significant. All statistical analyses were performed using SPSS Statistics 17.0 (SPSS Inc., Chicago, IL, USA).
RESULTS
Patient characteristics
Control subjects did not differ from HD patients for any of the putative confounders, including sex (P = 1.00), age (P = 0.73), clock time and month of death (P = 0.88 and P = 0.71, respectively), post‐mortem delay (P = 0.08), and fixation time (P = 0.14) (Table 1).
Immunocytochemistry
Representative immunocytochemical stainings for all analyses are provided in Figure 1. The number of CRH‐ir neurons in the PVN of HD patients (14678 ± 1790; n = 9) was not different with control subjects (17340 ± 2617; n = 9) (P = 0.51) (Figure 2). There were trends toward a negative correlation between disease duration in HD patients and the number of CRH‐ir neurons (ρ = −0.63, P = 0.07) and between L‐histidine decarboxylase mRNA levels in the tuberomamillary nucleus (34) and the number of CRH‐ir neurons (ρ = −0.67, P = 0.07). No correlation was observed between mutant HTT CAG repeat number and the number of CRH‐ir neurons (P = 0.84).
Figure 1.
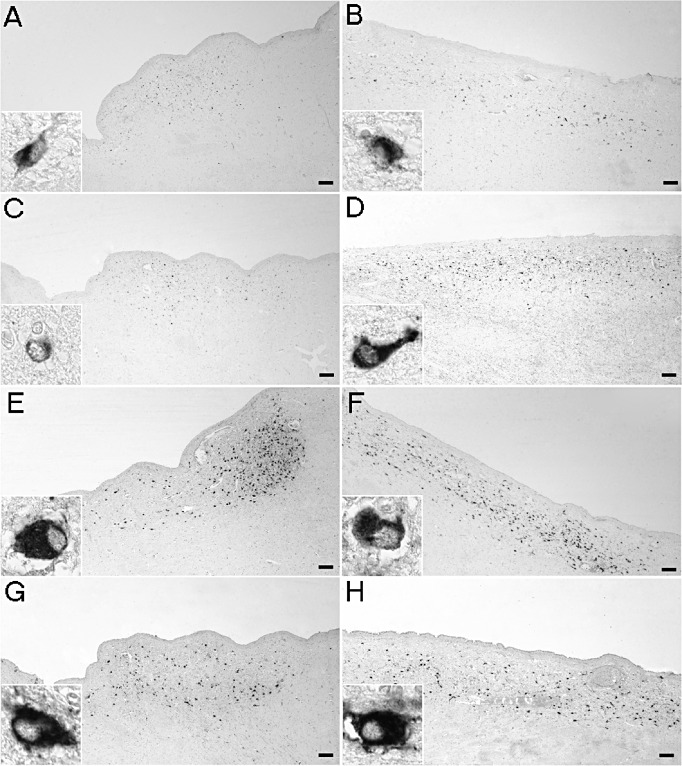
Representative immunocytochemical stainings in the paraventricular nucleus. In Huntington's disease (HD) patients (A), the number of corticotropin‐releasing hormone (CRH)‐immunoreactive (ir) neurons was not different compared with matched control subjects (B). The number of cocaine‐ and amphetamine‐regulated transcript‐ir neurons tended to be lower in HD patients (C) compared with controls (D) (P = 0.08). The numbers of arginine vasopressin‐ir [HD patients (E), control subjects (F)] and oxytocin‐ir neurons [HD patients (G), control subjects (H)] were unchanged (P ≥ 0.10). Bars represent 250 µm.
Figure 2.
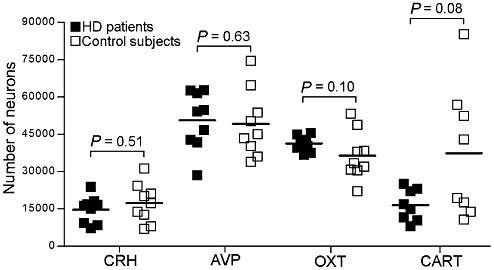
Total numbers of corticotropin‐releasing hormone (CRH), cocaine‐ and amphetamine‐regulated transcript (CART), arginine vasopressin (AVP) and oxytocin (OXT) immunoreactive (ir) neurons in the paraventricular nucleus. The number of CRH‐, AVP‐ and OXT‐ir in Huntington's disease (HD) patients (n = 9) did not differ from that in control subjects (n = 9) (P ≥ 0.10). The number of cocaine‐ and amphetamine‐ regulated transcript (CART)‐ir neurons tended to be lower in HD patients (P = 0.08) (n = 8 and 8, respectively). Bars represent the mean.
The number of AVP‐ir neurons was similar in HD patients (50657 ± 3874; n = 9) and control subjects (49148 ± 4477; n = 9) (P = 0.63) (Figure 2). A negative correlation between the number of AVP‐ir neurons and L‐histidine decarboxylase mRNA levels in the tuberomamillary nucleus (34) was observed in HD patients (ρ = −0.68, P = 0.042) and a negative trend between the number of AVP‐ir neurons and age at onset of disease (ρ = −0.63, P = 0.07). CAG repeat length in HD patients and the number of AVP‐ir neurons were not correlated (ρ = 0.46, P = 0.26).
The number of OXT‐ir neurons in HD patients (41259 ± 996; n = 9) was also not different compared with control subjects (36394 ± 3217; n = 9) (P = 0.10) (Figure 2). In control subjects, the numbers of AVP and OXT expressing neurons correlated significantly (ρ = 0.70, P = 0.036). However, this association was absent in HD patients (ρ = 0.08, P = 0.83). In HD patients, no significant correlations existed between either age at onset or CAG repeat length and the number of OXT neurons (P ≥ 0.43).
Because of the lack of sufficient amounts of tissue, one HD patient (NBB 00‐109) and her matched control (NBB 00‐022), who were used in all other analyses, had to be excluded from the analysis for CART. In HD patients (17428 ± 2183; n = 8) the number of CART‐ir neurons was lower than in control subjects (38255 ± 8303; n = 8), yet this difference did not reach statistical significance (P = 0.08) (Figure 2). In HD patients, the number of CART‐ir neurons did not correlate with either disease duration or mutant HTT CAG repeat length (P = 0.58 and P = 0.12, respectively).
In situ hybridization
Representative autoradiograms for CRH and TRH are provided in Figure 3. Due to lack of sufficient tissue amounts of tissue one HD patient (NBB 03‐047) and her matched control subject (NBB 97‐127) had to be excluded from analysis. CRH mRNA levels were 68% higher in HD patients (10.89 ± 1.45) (n = 8) compared with control subjects (6.51 ± 1.38) (n = 8) (P = 0.046) (Figure 4). TRH mRNA levels, on the other hand, were similar in both groups (11.76 ± 3.11 and 12.36 ± 1.69, respectively) (n = 8 and 8, respectively) (P = 0.23) (Figure 4). There was a significant negative correlation between TRH mRNA levels and disease duration in HD patients (ρ = −0.76, P = 0.03), but not between CRH mRNA levels and disease duration (P = 0.79). CRH or TRH mRNA levels were not associated with mutant HTT CAG repeat length (P ≥ 0.50).
Figure 3.
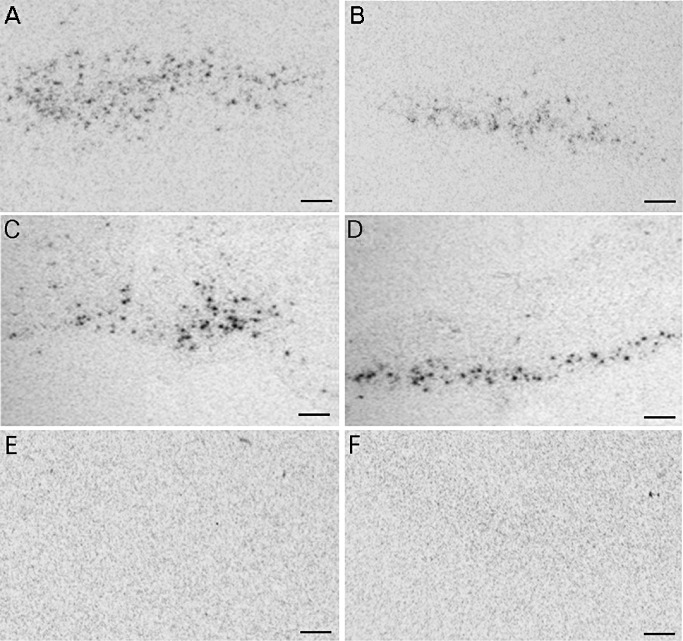
Representative in situ hybridization autoradiograms in the paraventricular nucleus. Corticotropin‐releasing hormone (CRH) mRNA levels in Huntington's disease (HD) patients (A) were increased compared with control subjects (B) (P = 0.046). mRNA levels of thyrotropin‐releasing hormone (TRH), however, were unchanged (P = 0.23) [HD patient (C), control subject (D)]. Autoradiograms of sections incubated with either a CRH (E) or TRH (F) sense probe did not produce hybridization signal. Bars represent 250 µm.
Figure 4.
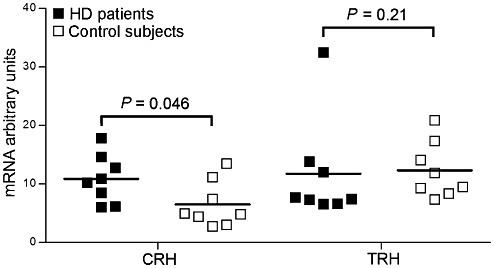
mRNA expression levels of corticotropin‐releasing hormone (CRH) and thyrotropin‐releasing hormone (TRH) in the paraventricular nucleus. In Huntington's disease (HD) patients (n = 8), TRH mRNA levels were unchanged compared with matched control subjects (n = 8) (P = 0.23). CRH mRNA levels, on the other hand, were significantly increased in HD patients (P = 0.046) (n = 8 and 8, respectively). Bars represent the mean.
None of the immunocytochemistry or ISH results were significantly correlated to post‐mortem delay or fixation duration in neither HD patients (P ≥ 0.41) nor control subjects (P ≥ 0.15). This was also true for cerebrospinal fluid pH in HD patients (P ≥ 0.18).
It had been observed in a previous study on eight HD patients in the present cohort (except NBB 08‐044) that in the PVN of five of these patients, cytoplasmic inclusions of mutant huntingtin were present in dystrophic neuritis. In none of the patients were intranuclear inclusion present in PVN neurons (4). No differences in the number of neurons expressing the studied neuropeptides were discerned between patients with and without these inclusions (P ≥ 0.12).
DISCUSSION
To our knowledge, this report represents the first detailed study specifically addressing the expression of major neuropeptide populations in the PVN of HD patients compared with matched control subjects. The number of CRH neurons did not differ between HD patients and control subjects, whereas CRH mRNA levels were significantly increased in the former. These findings are suggestive for a posttranscriptional defect in CRH synthesis. In HD patients, the number of CART neurons tended to be lower than in control subjects. Furthermore, no changes were observed in TRH mRNA levels or the number of AVP and OXT neurons. However, disease duration and TRH expression levels in the PVN were significantly associated in HD patients.
In contrast to our findings concerning CRH, in the R6/2 transgenic mouse model of HD a 62% decrease in hypothalamic CRH mRNA levels was found. Moreover, changes in the adrenal cortex fitting with ACTH‐overexpression were observed (8), suggesting that CRH is not the driving factor behind ACTH production in the R6/2 mice. Instead, ACTH overproduction may be due to a confirmed reduction in D2‐receptors in the pituitary in these mice, as dopamine is known to repress ACTH expression (8). In HD patients, data on ACTH levels are inconsistent, yet the evidence so far mainly suggests unchanged levels 20, 29. This, together with the observed stable expression of CRH in the PVN, suggests dysfunction of hypothalamic nuclei, other than the PVN, which are involved in the modulation of HPA activity and might account for increased cortisol levels in HD patients 20, 23, 24, 29. For example, in rodents the suprachiasmatic nucleus is capable of light‐induced, circadian inhibition of cortisol levels through a polysynaptic suprachiasmatic nucleus‐adrenal pathway, independent of ACTH (9). In humans, too, sympathetic innervation from the suprachiasmatic nucleus to the adrenal cortex seems to modulate adrenal responsiveness to ACTH (13). Therefore, pathology of the suprachiasmatic nucleus in HD patients (3) might account for a change in adrenal responsiveness to ACTH, resulting in an increase of cortisol secretion and disruption of its circadian rhythmicity. The observed discrepancy between CRH mRNA and protein levels in HD patients may be due to a decrease in prohormone convertase which is abundantly expressed in the rodent PVN and colocalizes with CRH expressing neurons (12). Although other reasons for a discrepancy between protein and mRNA levels could still be considered, including, for example, an increased amount of protein per remaining neuron, we have recently gathered additional data supporting the view that the discrepancy between the amount of CRH mRNA expression and the number of CRH neurons may indeed be due to a posttranscriptional defect. These data indicate a significant decrease in the protein levels of prohormone convertase 2 in the PVN of HD patients (van Wamelen et al, in preparation), which is crucially involved in the conversion of proCRH to CRH (12).
The unchanged expression of TRH in HD patients described in the present study contradicts findings in human huntingtin exon 1 transgenic mice in which a decrease in prepro‐TRH was observed (22). Our data, however, confirm previous findings in early‐ to midstage HD patients in whom there were no significant changes in free T4 (fT4) levels (29). On the other hand, T3 and T4 thyroid hormones have been found to be significantly increased in early‐stage HD patients, suggesting that in these patients the HPT‐axis may be mildly hyperactive (6). This would support our finding of a negative correlation between disease duration and TRH mRNA levels, in that the activity of the HPT‐axis in HD patients may change with disease progression. Whether the activity of the HPT‐axis changes during the course of the disease and at what stage have so far not been established in clinical studies. It has, however, been shown that HPT‐axis activity was negatively associated with motor impairment and functional capacity in early‐stage HD patients 6, 29. No correlation has so far been shown between TRH mRNA expression in the PVN and ante‐mortem thyroid hormone (T3/T4) levels. Our findings may, however, partly explain the unintended weight loss which has frequently been observed in HD patients (3). Possibly, CART expressed in the PVN, which tended to be lower in HD patients, may also play a role as it is involved in the “fine tuning” of TSH release in the pituitary (14). Further evidence for a role of CART at the level of the pituitary comes from the observation that lactotropic axis regulation in HD patients is disturbed (6) as CART is also believed to inhibit prolactin release in the pituitary (14). Alternatively, a decrease in neuropeptide Y expression in the hypothalamic infundibular nucleus (van Wamelen et al, submitted) may bear a part as neuropeptide Y is known to be involved in providing a set point for the thyroid axis through extensive projections onto the TRH/CART expressing neuronal population (27).
Several PVN neuronal populations, including the CRH, AVP and OXT expressing neurons, have projections to autonomic nuclei in the brainstem and spinal cord, including the ventrolateral medulla, nucleus of the solitary tract, dorsal motor nucleus of the vagus, intermediolateral cell column and sacral preganglionic parasympathetic nucleus 10, 18, 19. These projections have been implicated in, among others, cardiovascular control. Stimulation of the PVN in rats causes an increase in blood pressure, heart rate and renal sympathetic nerve activity (10). Indeed, in HD patients, impaired modulation of cardiovagal activity and other autonomic cardiovascular abnormalities have been reported 2, 5. Considering the pivotal role of the AVP and OXT expressing neuronal populations of the PVN in ANS functioning (31), an alteration in the interaction between these two neuropeptides, suggested by the absence of a correlation between the number of neurons expressing these neuropeptides in HD patients, could partly explain ANS dysfunction in HD patients. As we did not observe any changes in the actual numbers of AVP and OXT expressing neurons in the PVN, pathology of other ANS structures located in the brainstem and other brain areas most likely also contribute to ANS dysfunction in HD patients 2, 5. Pathology of the peripheral nervous system, on the other hand, appears very unlikely as a potential explanation for ANS dysfunction 2, 21, 30.
In conclusion, our findings suggest a posttranscriptional defect in CRH synthesis in HD patients as CRH mRNA levels were increased without a change in the number of CRH immunoreactive neurons in the PVN. TRH mRNA levels, as well as CART, AVP and OXT expression, were not different in HD patients compared with control subjects. These findings suggest that the PVN in HD patients is largely functionally intact.
ACKNOWLEDGMENTS
The authors are greatly indebted to the Netherlands Brain Bank and the following persons for their invaluable support: A. Alkemade, R. Balesar, A. van den Berg, B. Fisser, J.J. van Heerikhuize, W. Kamphuis, M. Kooreman, M.L.C. Maat‐Schieman, W.Verweij and U. Unmehopa. This work was supported by the Cure Huntington's Disease Initiative (CHDI) Foundation, Inc. (project ID A‐2376). The authors declare that they have no conflict of interest.
REFERENCES
- 1. Alkemade A, Unmehopa UA, Wiersinga WM, Swaab DF, Fliers E (2005) Glucocorticoids decrease thyrotropin‐releasing hormone messenger ribonucleic acid expression in the paraventricular nucleus of the human hypothalamus. J Clin Endocrinol Metab 90:323–327. [DOI] [PubMed] [Google Scholar]
- 2. Andrich J, Schmitz T, Saft C, Postert T, Kraus P, Epplen JT et al (2002) Autonomic nervous system function in Huntington's disease. J Neurol Neurosurg Psychiatry 72:726–731. [DOI] [PMC free article] [PubMed] [Google Scholar]
- 3. Aziz NA, Swaab DF, Pijl H, Roos RA (2007) Hypothalamic dysfunction and neuroendocrine and metabolic alterations in Huntington's disease: clinical consequences and therapeutic implications. Rev Neurosci 18:223–251. [DOI] [PubMed] [Google Scholar]
- 4. Aziz A, Fronczek R, Maat‐Schieman M, Unmehopa U, Roelandse F, Overeem S et al (2008) Hypocretin and melanin‐concentrating hormone in patients with Huntington disease. Brain Pathol 18:474–483. [DOI] [PMC free article] [PubMed] [Google Scholar]
- 5. Aziz NA, Anguelova GV, Marinus J, van Dijk JG, Roos RA (2010) Autonomic symptoms in patients and pre‐manifest mutation carriers of Huntington's disease. Eur J Neurol 17:1068–1074. [DOI] [PubMed] [Google Scholar]
- 6. Aziz NA, Pijl H, Frölich M, Roelfsema F, Roos RA (2011) Altered thyrotropic and lactotropic axes regulation in Huntington's disease. Clin Endocrinol (Oxf) 73:540–545. [DOI] [PubMed] [Google Scholar]
- 7. Bao AM, Swaab DF (2007) Gender difference in age‐related number of corticotropin‐releasing hormone‐expressing neurons in the human hypothalamic paraventricular nucleus and the role of sex hormones. Neuroendocrinology 85:27–36. [DOI] [PubMed] [Google Scholar]
- 8. Björkqvist M, Petersén A, Bacos K, Isaacs J, Norlén P, Gil J et al (2006) Progressive alterations in the hypothalamic‐pituitary‐adrenal axis in the R6/2 transgenic mouse model of Huntington's disease. Hum Mol Genet 15:1713–1721. [DOI] [PubMed] [Google Scholar]
- 9. Buijs RM, Wortel J, van Heerikhuize JJ, Feenstra MG, Ter Horst GJ, Romijn HJ, Kalsbeek A (1999) Anatomical and functional demonstration of a multisynaptic suprachiasmatic nucleus adrenal (cortex) pathway. Eur J Neurosci 11:1535–1544. [DOI] [PubMed] [Google Scholar]
- 10. Coote JH, Yang Z, Pyner S, Deering J (1998) Control of sympathetic outflows by the hypothalamic paraventricular nucleus. Clin Exp Pharmacol Physiol 25:461–463. [DOI] [PubMed] [Google Scholar]
- 11. Den Heijer JC, Bollen WL, Reulen JP, van Dijk JG, Kramer CG, Roos RA, Buruma OJ (1988) Autonomic nervous function in Huntington's disease. Arch Neurol 45:309–312. [DOI] [PubMed] [Google Scholar]
- 12. Dong W, Seidel B, Marcinkiewicz M, Chrétien M, Seidah NG, Day R (1997) Cellular localization of the prohormone convertases in the hypothalamic paraventricular and supraoptic nuclei: selective regulation of PC1 in corticotrophin‐releasing hormone parvocellular neurons mediated by glucocorticoids. J Neurosci 17:563–575. [DOI] [PMC free article] [PubMed] [Google Scholar]
- 13. Engeland WC, Arnhold MM (2005) Neural circuitry in the regulation of adrenal corticosterone rhythmicity. Endocrine 28:325–332. [DOI] [PubMed] [Google Scholar]
- 14. Fekete C, Lechan RM (2006) Neuroendocrine implications for the association between cocaine‐ and amphetamine regulated transcript (CART) and hypophysiotropic thyrotropin‐releasing hormone (TRH). Peptides 27:2012–2018. [DOI] [PubMed] [Google Scholar]
- 15. Gabery S, Murphy K, Schultz K, Loy CT, McCusker E, Kirik D et al (2010) Changes in key hypothalamic neuropeptide populations in Huntington disease revealed by neuropathological analyses. Acta Neuropathol 120:777–788. [DOI] [PubMed] [Google Scholar]
- 16. Goldstone AP, Unmehopa UA, Swaab DF (2003) Hypothalamic growth hormone‐releasing hormone (GHRH) cell number is increased in human illness, but is not reduced in Prader‐Willi syndrome or obesity. Clin Endocrinol (Oxf) 58:743–755. [DOI] [PubMed] [Google Scholar]
- 17. Goncharuk VD, Van Heerikhuize J, Swaab DF, Buijs RM (2002) Paraventricular nucleus of the human hypothalamus in primary hypertension: activation of corticotropin‐releasing hormone neurons. J Comp Neurol 443:321–331. [DOI] [PubMed] [Google Scholar]
- 18. Goncharuk VD, Buijs RM, Swaab DF (2007) Corticotropin‐releasing hormone neurons in hypertensive patients are activated in the hypothalamus but not in the brainstem. J Comp Neurol 503:148–168. [DOI] [PubMed] [Google Scholar]
- 19. Goncharuk VD, Buijs RM, Jhamandas JH, Swaab DF (2011) Vasopressin (VP) and neuropeptide FF (NPFF) systems in the normal and hypertensive human brainstem. J Comp Neurol 519:93–124. [DOI] [PubMed] [Google Scholar]
- 20. Heuser IJ, Chase TN, Mouradian MM (1991) The limbic‐hypothalamic‐pituitary‐adrenal axis in Huntington's disease. Biol Psychiatry 30:943–952. [DOI] [PubMed] [Google Scholar]
- 21. Kobal J, Meglic B, Mesec A, Peterlin B (2004) Early sympathetic hyperactivity in Huntington's disease. Eur J Neurol 11:842–848. [DOI] [PubMed] [Google Scholar]
- 22. Kotliarova S, Jana NR, Sakamoto N, Kurosawa M, Miyazaki H, Nekooki M et al (2005) Decreased expression of hypothalamic neuropeptides in Huntington disease transgenic mice with expanded polyglutamine‐EGFP fluorescent aggregates. J Neurochem 93:641–653. [DOI] [PubMed] [Google Scholar]
- 23. Kurlan R, Caine E, Rubin A, Nemeroff CB, Bissette G, Zaczek R et al (1988) Cerebrospinal fluid correlates of depression in Huntington's disease. Arch Neurol 45:881–883. [DOI] [PubMed] [Google Scholar]
- 24. Leblhuber F, Peichl M, Neubauer C, Reisecker F, Steinparz FX, Windhager E, Maschek W (1995) Serum dehydroepiandrosterone and cortisol measurements in Huntington's chorea. J Neurol Sci 132:76–79. [DOI] [PubMed] [Google Scholar]
- 25. Liu CQ, Shan L, Balesar R, Luchetti S, van Heerikhuize JJ, Luo JH et al (2010) A quantitative in situ hybridization protocol for formalin‐fixed paraffin‐embedded archival post‐mortem human brain tissue. Methods 52:359–366. [DOI] [PubMed] [Google Scholar]
- 26. Liu X, Jin Y, Zheng H, Chen G, Tan B, Wu B (2000) Arginine vasopressin gene expression in supraoptic nucleus and paraventricular nucleus of hypothalamous following cerebral ischemia and reperfusion. Chin Med Sci J 15:157–161. [PubMed] [Google Scholar]
- 27. Nillni EA (2010) Regulation of the hypothalamic thyrotropin releasing hormone (TRH) neuron by neuronal and peripheral inputs. Front Neuroendocrinol 31:134–156. [DOI] [PMC free article] [PubMed] [Google Scholar]
- 28. Purba JS, Hoogendijk WJ, Hofman MA, Swaab DF (1996) Increased number of vasopressin‐ and oxytocin‐expressing neurons in the paraventricular nucleus of the hypothalamus in depression. Arch Gen Psychiatry 53:137–143. [DOI] [PubMed] [Google Scholar]
- 29. Saleh N, Moutereau S, Durr A, Krystkowiak P, Azulay JP, Tranchant C et al (2009) Neuroendocrine disturbances in Huntington's disease. PLoS ONE 4:e4962. [DOI] [PMC free article] [PubMed] [Google Scholar]
- 30. Sharma KR, Romano JG, Ayyar DR, Rotta FT, Facca A, Sanchez‐Ramos J (1999) Sympathetic skin response and heart rate variability in patients with Huntington disease. Arch Neurol 56:1248–1252. [DOI] [PubMed] [Google Scholar]
- 31. Swaab DF (2003) The human hypothalamus: basic and clinical aspects, part I: nuclei of the human hypothalamus. In: Handbook of Clinical Neurology. Aminoff MJ, Boller F, Swaab DF (eds), pp. 1–476. Elsevier: Amsterdam. [Google Scholar]
- 32. van der Sluis PJ, Pool CW, Sluiter AA (1987) Press‐blotting on gelatin‐coated nitrocellulose membranes. A method for sensitive quantitative immunodetection of peptides after gel isoelectric focusing. J Immunol Methods 104:65–71. [DOI] [PubMed] [Google Scholar]
- 33. van Duijn E, Kingma EM, Timman R, Zitman FG, Tibben A, Roos RA, van der Mast RC (2008) Cross‐sectional study on prevalences of psychiatric disorders in mutation carriers of Huntington's disease compared with mutation‐negative first‐degree relatives. J Clin Psychiatry 69:1804–1810. [DOI] [PubMed] [Google Scholar]
- 34. van Oers JW, Tilders JH, Berkenbosch F (1989) Characterization and biological activity of a rat monoclonal antibody to rat/human corticotropin‐releasing factor. Endocrinology 124:1239–1246. [DOI] [PubMed] [Google Scholar]
- 35. van Wamelen DJ, Shan L, Aziz NA, Anink JJ, Bao AM, Roos RA, Swaab DF (2011) Functional increase of brain histaminergic signaling in Huntington's disease. Brain Pathol 21:419–427. [DOI] [PMC free article] [PubMed] [Google Scholar]
- 36. Vonsattel JP, Myers RH, Stevens TJ, Ferrante RJ, Bird ED, Richardson EP Jr (1985) Neuropathological classification of Huntington's disease. J Neuropathol Exp Neurol 44:559–577. [DOI] [PubMed] [Google Scholar]
- 37. Zhou JN, Hofman MA, Swaab DF (1996) Morphometric analysis of vasopressin and vasoactive intestinal polypeptide neurons in the human suprachiasmatic nucleus: influence of microwave treatment. Brain Res 742:334–338. [DOI] [PubMed] [Google Scholar]
- 38. Zhou JN, Riemersma RF, Unmehopa UA, Hoogendijk WJ, van Heerikhuize JJ, Hofman MA, Swaab DF (2001) Alterations in arginine vasopressin neurons in the suprachiasmatic nucleus in depression. Arch Gen Psychiatry 58:655–662. [DOI] [PubMed] [Google Scholar]