

Abstract
Loss of synapses is associated with cognitive impairment in Alzheimer's disease (AD). However, the molecular mechanism underlying this synaptic impairment is not well understood. EphA4 is a substrate of γ‐secretase, and the γ‐secretase‐cleaved EphA4 intracellular domain (EICD) is known to enhance the formation of dendritic spines via activation of the Rac signaling pathway. Here, we show that the amount of Rac1 is significantly reduced, and correlated with the level of EICD in the frontal lobes of AD patients. Biochemical analyses revealed that the amount of membrane‐associated EICD was decreased and strongly correlated with the level of membrane‐associated Rac1, which is considered to be active Rac1. The synaptic scaffolding protein, postsynaptic density (PSD)‐95, was specifically decreased in AD, and the amount of PSD‐95 correlated with the level of Rac1. Moreover, the amounts of Rac1 and PSD‐95 were negatively correlated with the extent of tau phosphorylation, which is crucial for neurofibrillary tangle formation. These results suggest that attenuation of the EICD‐mediated Rac signaling pathway is involved in the synaptic pathogenesis of AD.
Keywords: Alzheimer's disease, dendritic spine, EphA4, Rac, γ‐secretase
INTRODUCTION
Alzheimer's disease (AD) is an age‐dependent, progressive form of dementia, which is clinically characterized by impaired memory, cognition and behavior. It is known that the massive loss of synapses is a major hallmark of AD (22). Brain imaging studies have suggested that hippocampus‐dependent memory impairment, which occurs at the early clinical stage of AD, is caused by synaptic dysfunction (28). Moreover, the extent of synaptic loss is known to correlate with the severity of cognitive impairment (22). These findings suggest that synapse dysfunction plays a central role in the development of AD. Dendritic spines, which receive excitatory inputs from nerve terminals, are thought to be the synaptic elements that are initially affected in AD (21). Dendritic spines are actin‐rich protrusions that are formed along dendrites, and their structures change dynamically in response to various extracellular factors such as neurotransmitters and neurotrophic factors 11, 25. The morphology of dendritic spines is known to correlate with the strength of their synaptic activity (10). Dendritic spines are thus associated with neuronal plasticity (11), and impairment of the morphogenesis of dendritic spines is thought to be involved in the synaptic pathogenesis of AD.
Ephrins and Ephs are cell‐surface proteins that are known to be involved in various neuronal events, such as axonal guidance, synapse formation and synaptic plasticity (14). The Eph family is subdivided into nine EphAs and five EphBs. EphAs bind to ephrinAs, which are tethered to the membrane by a glycosylphosphatidylinositol moiety; and EphBs bind to ephrinBs, which are transmembrane proteins (9). Among the Eph family members, EphA4 is known to be a critical regulator of dendritic spine morphogenesis (13). Activation of EphA4 by ephrinAs retracts the dendritic spines. Following ephrinA treatment, EphA4 inactivates Rac (7), which is a Rho family small G protein and a critical regulator of dendritic spine morphogenesis (26). The Rac signaling pathway has been reported to be down‐regulated in the hippocampus of AD patients (27). Recently, it was shown that EphA4 is cleaved by γ‐secretase, and that the cleaved EphA4 intracellular domain (EICD) has the ability to enhance the formation of dendritic spines through activation of the Rac signaling pathway (6). Moreover, the cleavage of EphA4 by γ‐secretase is impaired by a familial AD‐linked mutation in presenilin. These findings suggest that dysregulation of the EphA4 signaling pathway plays a critical role in the pathogenesis of AD.
To elucidate the molecular mechanism underlying the synaptic pathogenesis of AD, we examined changes in γ‐secretase‐mediated EphA4 signaling in AD brain. In this study, we report the relationship between the EICD signaling pathway and pathogenesis of AD.
MATERIALS AND METHODS
Human AD brain samples
Frozen brain tissues (frontal lobe: Brodmann area 9; occipital lobe: Brodmann area 19) from AD patients and age‐matched controls were homogenized in homogenization buffer (10.955% sucrose, 1 mM NaHCO3, 1 mM MgCl2, 0.5 mM CaCl2) containing a protease inhibitor cocktail (Nacalai Tesque, Kyoto, Japan) and a phosphatase inhibitor cocktail (Nacalai Tesque). The resultant homogenates were used for Western blotting.
Antibodies
The following antibodies were used: rabbit polyclonal anti‐EphA4 (Millipore, Billerica, MA, USA), rabbit polyclonal anti‐PAK1 (Santa Cruz Biotechnology, Inc., Santa Cruz, CA, USA), rabbit polyclonal anti‐GluR1 (Millipore), rabbit polyclonal anti‐phosphoTau Ser422 (Sigma, St Louis, MO, USA), mouse monoclonal anti‐Rac1 (Thermo Fisher Scientific, Waltham, MA, USA), mouse monoclonal anti‐neuron specific enolase (NSE; Millipore), mouse monoclonal anti‐NMDA receptor 1 (NR1) (BD, Franklin Lakes, NJ, USA), mouse monoclonal anti‐N‐cadherin (BD), mouse monoclonal anti‐postsynaptic density (PSD)‐95 (Thermo Fisher Scientific), mouse monoclonal anti‐SAP97 (Stressgen/Enzo Life Sciences, Farmingdale, NY, USA), mouse monoclonal anti‐GRIP (BD), mouse monoclonal anti‐Amyloidβ (82E1; IBL, Hamburg Germany), rabbit polyclonal anti‐presenilin 1 (Merck, Darmstadt, Germany), mouse monoclonal anti‐synaptophysin (Millipore) and mouse monoclonal anti‐actin (Millipore) antibodies.
Subcellular fractionation
Tissues were homogenized in homogenization buffer (10.955% sucrose, 1 mM NaHCO3, 1 mM MgCl2, 0.5 mM CaCl2) containing a protease inhibitor cocktail (Nacalai Tesque) and a phosphatase inhibitor cocktail (Nacalai Tesque). The resultant homogenates were centrifuged at 190 × g for 10 minutes. The supernatants were further centrifuged at 20 000 × g for 15 minutes and fractionated into cytosol (supernatant) and membrane (pellet) fractions. The pellets were resuspended in the homogenization buffer. The membrane fractions were treated with 0.5% Triton X‐100, followed by centrifugation at 20 000 × g for 15 minutes. The pellets (PSD fraction) were resuspended in SDS‐PAGE buffer. The same amounts of proteins from each fraction were analyzed by Western blotting.
Quantitative analysis
Proteins from homogenates of human brain samples were separated by SDS‐PAGE and subjected to Western blotting. The band images were acquired using a Canoscan8800F (Canon, Tokyo, Japan) and the intensities were assessed using Photoshop software (Adobe, San Jose, CA, USA). For quantitation of the amount of EICD, the band intensities of EICD were quantitated as a ratio of the full‐length EphA4. For quantitation of other proteins, the band intensities were quantitated as a ratio of NSE. Two sample replicates were averaged and then analyzed. For analyses of subcellular distribution, band intensities were quantitated as a ratio of actin. The data were normalized to the average amount of each protein.
Statistical analysis
Statistical analysis was performed using GraphPad Prism (GraphPad Software, La Jolla, CA, USA). Statistical significance between two groups was determined by Student's t‐test. Pearson's correlation analysis was used to evaluate the relationship between EICD signaling components. Linear regression curves were generated using GraphPad Prism.
RESULTS
Reduction of the EICD signaling pathway in the frontal lobes of AD patients
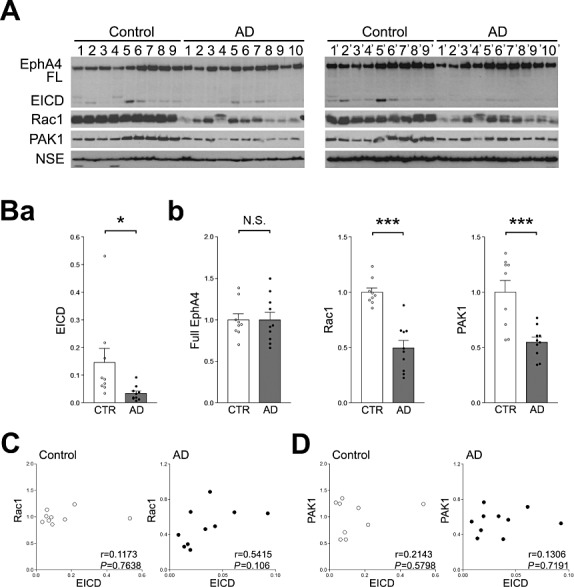
Recently, it was reported that synaptic activity stimulates γ‐secretase‐mediated cleavage of EphA4, and that the cleaved EICD enhances the formation of dendritic spines via activation of the Rac signaling pathway (6). To examine whether the EICD signaling pathway is involved in the pathogenesis of AD, changes in EICD signaling components in AD brains were analyzed. Following ectodomain cleavage by matrix metalloproteinase, EphA4 is cleaved by γ‐secretase in the transmembrane region, which generates EICD (Figure 1A). To detect EICD, an antibody (Ab) that recognizes the cytoplasmic region of EphA4 was used. The Ab detected NMDA‐induced EICD in rat hippocampal neurons (Figure 1B). In human brain, the Ab detected a ∼45 kD fragment, which is the same size as the EICD band in NMDA‐treated neurons (Figure 1B). Using this Ab, the change in the amount of EICD in the frontal lobes of 10 AD patients and nine age‐matched controls was analyzed (Table 1). To reduce the variation in sampling, two samples from one frozen tissue were analyzed (control 1–9 and 1′–9′; AD 1–10 and 1′‐10′). We first examined the changes in Rac1 in AD patients. Western blotting analyses revealed that the average amount of Rac1 in the AD patients was significantly decreased compared with age‐matched controls (Figure 1C and Da). Moreover, the amount of PAK1, which is one of the downstream targets of Rac1, was also reduced in AD patients. A similar tendency was observed in EICD, but the reduction did not reach statistical significance (Figure 1Db). The amount of full‐length EphA4 was unchanged (Figure 1Da). To examine the relationship between EICD and the Rac1 signaling pathway, we performed a correlation analysis. It was found that the level of EICD correlated well with the levels of Rac1 and PAK1 in AD, although this correlation was not observed in age‐matched controls (Figure 1E and F). These results indicate that the Rac signaling pathway is reduced in the frontal lobes of AD patients and EICD might be involved in this reduction.
Figure 1.
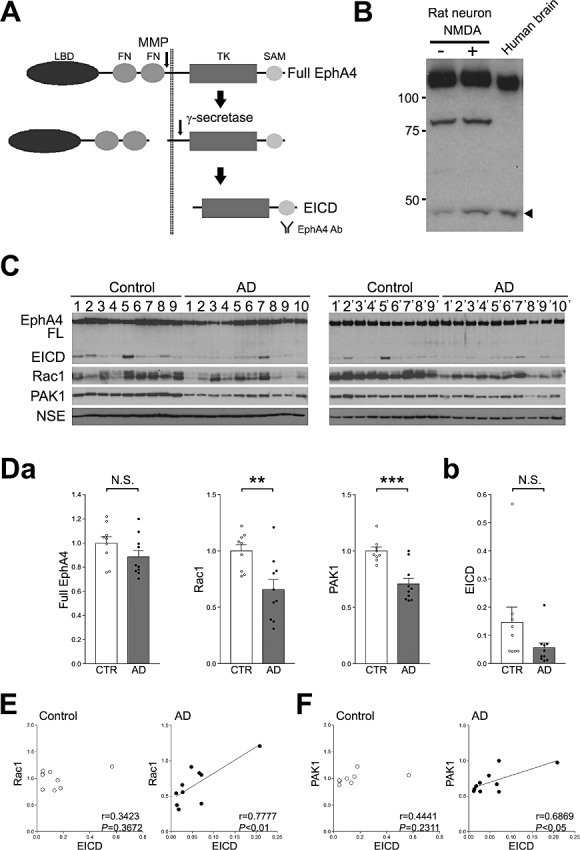
Analysis of the amount of EICD in the frontal lobes of AD patients. A. Schematic diagram of the processing of EphA4. LBD, ligand‐binding domain; FN, fibronectin domain; TK, tyrosine kinase domain; SAM, SAM domain; EICD, EphA4 intracellular domain. B. Detection of EICD in the human brain. As a control, rat hippocampal neurons were treated with 50 µM NMDA. The EICD bands from the hippocampal cell lysate and human brain homogenate were analyzed by Western blotting. The arrow head indicates the cleaved EICD. C. Western blotting analyses of EphA4, Rac1, PAK1 and NSE. Homogenates of the frontal lobes of AD patients and age‐matched controls were analyzed by Western blotting using the indicated Abs. D. (a) Quantitation of the amount of the full‐length of EphA4, Rac1 and PAK1. Band intensities were quantitated as a ratio of NSE, and normalized to the average amount of each protein. (b) Quantitation of the amount of EICD. Band intensities were quantitated as a ratio of the full‐length EphA4. Data are expressed as means ± SEM. **P < 0.01; ***P < 0.001; NS, no significance. E. Correlations between the amounts of EICD and Rac1. The level of Rac1 was plotted against the level of EICD. F. Correlations between the amounts of EICD and PAK1. The level of PAK1 was plotted against the level of EICD. A linear regression line is shown when the correlation reached statistical significance.
Table 1.
Age at death, sex and neuropathological data of control and AD brains used in this study.
| Case no. | Gender | Age (year) | NFT stage | β‐amyloid stage |
|---|---|---|---|---|
| Controls | ||||
| CTR1 (1′) | M | 75 | I | 0 |
| CTR2 (2′) | M | 71 | II | A |
| CTR3 (3′) | F | 79 | 0 | B |
| CTR4 (4′) | M | 82 | III | 0 |
| CTR5 (5′) | M | 77 | II | A |
| CTR6 (6′) | F | 75 | 0 | 0 |
| CTR7 (7′) | M | 80 | II | A |
| CTR8 (8′) | M | 72 | I | B |
| CTR9 (9′) | F | 82 | 0 | A |
| Alzheimer's disease cases | ||||
| AD1 (1′) | F | 87 | V | C |
| AD2 (2′) | F | 86 | VI | C |
| AD3 (3′) | F | 91 | V | C |
| AD4 (4′) | F | 81 | VI | C |
| AD5 (5′) | M | 79 | V | C |
| AD6 (6′) | F | 100 | VI | C |
| AD7 (7′) | M | 89 | V | C |
| AD8 (8′) | M | 78 | V | C |
| AD9 (9′) | F | 104 | VI | C |
| AD10 (10′) | M | 73 | V | C |
To further analyze the relationship between EICD and the Rac signaling pathway, we examined changes in subcellular distribution of the components of the EICD signaling pathway in the frontal lobe of AD patients and age‐matched controls. Consistent with previous studies 5, 6, NR1, but not synaptophysin, was concentrated in the Triton X‐100 insoluble membrane fraction that contains PSD, which is a postsynaptic cytoskeletal structure (Figure 2A). Under the experimental conditions, full‐length EphA4, EICD, Rac1 and presenilin‐1 were relatively concentrated in the Triton X‐100 soluble membrane fraction (Figure 2A). In contrast to EphA4 and presenilin‐1, Rac1 was concentrated in the cytosol fraction (Figure 2A). We first examined changes in the components of the EICD signaling pathway in the membrane fraction. Western blotting analyses revealed that the amounts of EICD and Rac1 were significantly reduced in AD, although Rac1 in the cytosol fraction was unchanged (Figure 2B, C and E). Moreover, the level of EICD strongly correlated with the level of Rac1 in the membrane fraction in both AD and age‐matched controls (Figure 2F). It has been demonstrated that Rac1 translocates from the cytosol to the membrane following activation by Rac activators 12, 19. Therefore, these results indicate that the amount of EICD in the membrane fraction might correlate with the level of Rac1 activity. Similar to the membrane fraction, the amounts of EICD in the cytosol and PSD fraction were significantly reduced in AD (Figure 2C–E). Correlation analyses revealed that the level of EICD in the cytosol fraction correlated with the level of Rac1 in the membrane fraction in AD brains, although this correlation was not observed in age‐matched controls (Figure 2G). In contrast, the relationship between the amount of EICD in the PSD fraction and Rac1 in the membrane fraction was observed in age‐matched controls, but not AD patients (Figure 2H). These results indicate that changes in the subcellular localization of EICD might be involved in the reduction of the Rac1 signaling pathway in AD brain.
Figure 2.
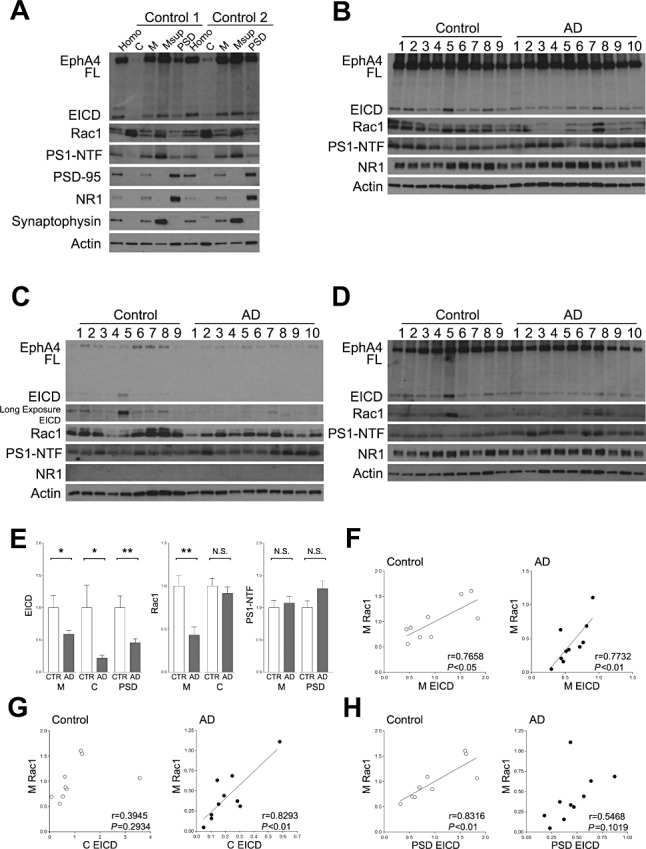
Subcellular distribution of the components of the EICD signaling pathway. A. Subcellular distribution. Homogenates of the frontal lobes were subjected to subcellular fractionation. Each fraction was analyzed by Western blotting using the indicated Abs. Homo, homogenate; C, cytosol fraction; M, membrane fraction; Msup, Triton X‐100 soluble membrane fraction; PSD, PSD fraction; PS1, presenilin1; NTF, N‐terminal fragment. B. Analyses of the membrane fraction. The membrane fractions were analyzed by Western blotting using the indicated Abs. C. Analyses of the cytosol fraction. The cytosol fractions were analyzed by Western blotting using the indicated Abs. D. Analyses of the PSD fraction. The PSD fractions were analyzed by Western blotting using the indicated Abs. E. Quantitation of the amounts of EICD, Rac1 and presenilin1. Band intensities were quantitated as a ratio of actin, and normalized to the average amount of each protein. Data are expressed as means ± SEM. *P < 0.05; **P < 0.01; NS, no significance. F. Correlation between the level of EICD and Rac1 in the membrane fraction. The level of Rac1 in the membrane fraction was plotted against the level of EICD in the membrane fraction. G. Correlation between the level of EICD in the cytosol fraction and Rac1 in the membrane fraction. The level of Rac1 in the membrane fraction was plotted against the level of EICD in the cytosol fraction. H. Correlation between the level of EICD in the PSD fraction and Rac1 in the membrane fraction. The level of Rac1 in the membrane fraction was plotted against the level of EICD in the PSD fraction. A linear regression line is shown when the correlation reached statistical significance.
Relationship between EICD signaling pathway and synapse proteins in the frontal lobes of AD patients
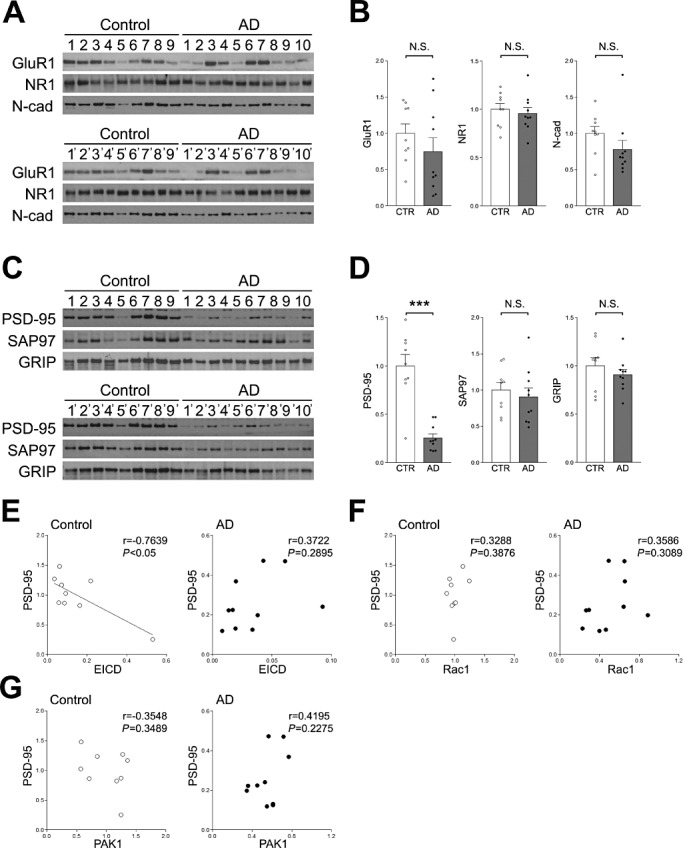
It is known that the number of synapses is decreased in the frontal lobes of AD patients (3). Recently, it was shown that the number of dendritic spines in hippocampal neurons is reduced by inhibition of γ‐secretase, and that this reduction was rescued by overexpression of EICD (6). To examine the relationship between the EICD signaling pathway and synapses, we analyzed the expression of various synapse proteins, including the AMPA receptor subunit, glutamate receptor 1 (GluR1), NR1 and the synaptic cell adhesion molecule, N‐cadherin, in the frontal lobes of AD patients. Western blotting analyses revealed that none of these proteins were changed in the frontal lobes of AD patients (Figure 3A and B). Next, the amounts of PSD‐95, SAP‐97 and GRIP were analyzed. These are well‐known synaptic scaffolding molecules that regulate the function of glutamate receptors (8). It was found that the amount of PSD‐95, but not GRIP and SAP97, was markedly reduced in the frontal lobes of AD patients (Figure 3C and D). To examine the relationship between PSD‐95 and the EICD signaling pathway, we performed correlation analyses between the levels of PSD‐95 and EICD, Rac1 or PAK1. It was found that the levels of Rac1 and PAK1 significantly correlated with the level of PSD‐95 in the frontal lobes of AD patients, while this correlation was not observed in age‐matched controls (Figure 3E and F). A similar correlation was observed between EICD and PSD‐95, but the correlation did not reach statistical significance (Figure 3G).
Figure 3.
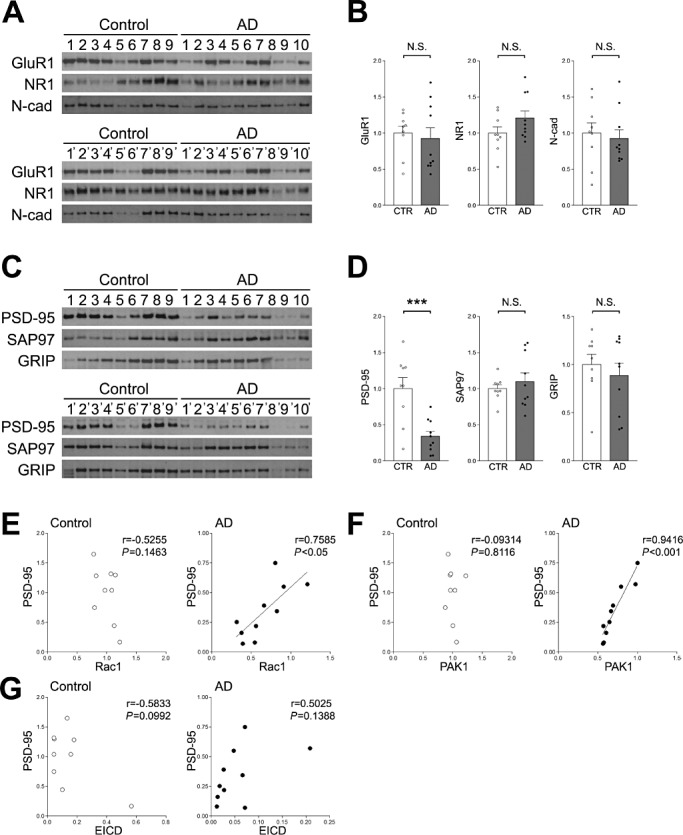
Analyses of various synapse proteins in the frontal lobe. A. Western blotting analyses of GluR1, NR1 and N‐cadherin. Homogenates of the frontal lobes of AD patients and age‐matched controls were analyzed by Western blotting using the indicated Abs. B. Quantitation of the amounts of GluR1, NR1 and N‐cadherin. Band intensities were quantitated as a ratio of NSE, and normalized to the average amount of each protein. Data are expressed as means ± SEM. NS, no significance. C. Western blotting analyses of PSD‐95, SAP97 and GRIP. Homogenates of the frontal lobes of AD patients and age‐matched controls were analyzed by Western blotting using the indicated Abs. D. Quantitation of the amounts of PSD‐95, SAP97 and GRIP. Band intensities were quantitated as a ratio of NSE and normalized to the average amount of each protein. Data are expressed as means ± SEM. ***P < 0.001; NS, no significance. E. Correlations between the amounts of PSD‐95 and Rac1. The level of PSD‐95 was plotted against the level of Rac1. F. Correlations between the amounts of PSD‐95 and PAK1. The level of PSD‐95 was plotted against the level of PAK1. G. Correlations between the amounts of PSD‐95 and EICD. The level of PSD‐95 was plotted against the level of EICD. A linear regression line is shown when the correlation reached statistical significance.
The extent of tau phosphorylation, which is associated with neurofibrillary tangle formation, is known to be associated with the severity of cognitive impairment in AD patients (18). Phosphorylated tau was specifically detected in the frontal lobes of AD patients, and the extent of the phosphorylation negatively correlated with PSD‐95 and NR1 (Figure 4A and B). We then examined the relationship between the amount of components of the EICD signaling pathway and tau phosphorylation. Similar to PSD‐95, the amounts of Rac1 and PAK1 were negatively correlated with the extent of tau phosphorylation (Figure 4C). A similar correlation was observed between EICD and tau phosphorylation, but the correlation did not reach statistical significance (Figure 4C). It has been shown that Aβ affects the function of EphB2, which is another Eph family member expressed in the brain (2). To examine the relationship between Aβ and the EICD signaling pathway, we analyzed the changes in Aβ levels in AD brain and found that the amount of Aβ was increased in the frontal lobe of AD patients (Figure 4D and E). We next performed correlation analysis between Aβ and EICD. It was found that the level of EICD did not correlate with the level of Aβ (Figure 4F). Moreover, the level of Aβ also did not correlate with the level of Rac1 (Figure 4F). These results suggest that Aβ does not directly affect the EICD signaling pathway in AD brain.
Figure 4.
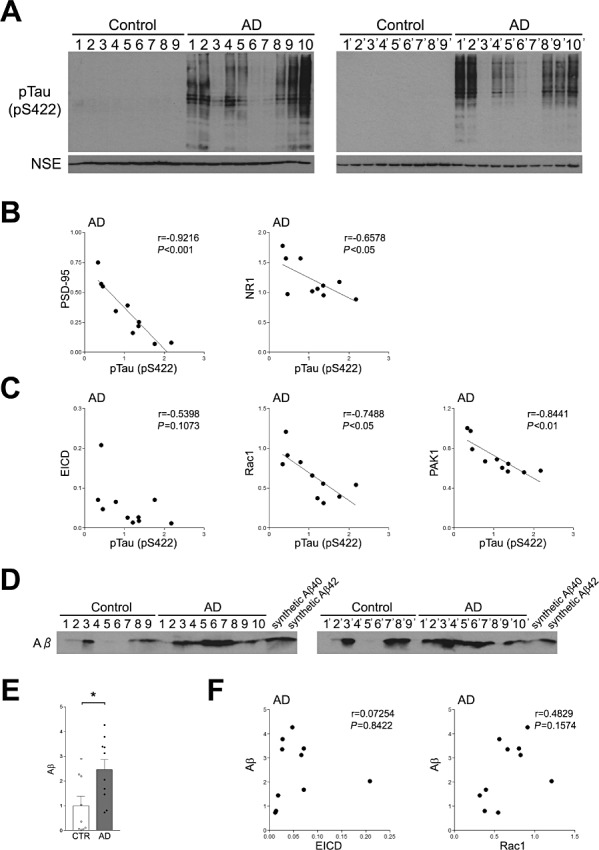
Relationship between EICD signaling and tau phosphorylation. A. Western blotting analysis of phosphorylated tau. Homogenates of the frontal lobes of AD patients and age‐matched controls were analyzed by Western blotting using the anti‐phosphorylated tau Ab. B. Correlations between the amounts of phosphorylated tau and PSD‐95 or NR1 in AD individuals. The levels of PSD‐95 and NR1 were plotted against the level of phosphorylated tau. C. Correlations between the amounts of phosphorylated tau and EICD, Rac1 or PAK1 in AD individuals. The levels of EICD, Rac1 and PAK1 were plotted against the levels of phosphorylated tau. A linear regression line is shown when the correlation reached statistical significance. D. Western blotting analysis of Aβ. Homogenates of the frontal lobes of AD patients and age‐matched controls were analyzed by Western blotting using the anti‐Aβ Ab. Synthetic Aβ40 and Aβ42 were used as positive controls. E. Quantitation of the amounts of Aβ. Band intensities were quantitated as a ratio of NSE and normalized to the average amount of each protein. Data are expressed as means ± SEM. *P < 0.05. F. Correlations between the amounts of Aβ and EICD or Rac1 in AD individuals. The level of Aβ was plotted against the levels of EICD or Rac1.
Reduction of the EICD signaling pathway in the occipital lobes of AD patients
To investigate whether the EICD signaling pathway is involved in other cortical areas of AD patients, the occipital lobes of AD patients were analyzed. Samples were prepared from the occipital lobes of the same AD patients and age‐matched controls, from which frontal lobe samples were prepared. It was found that the amount of EICD in the occipital lobes of AD patients was markedly decreased compared with the age‐matched controls (Figure 5A and Ba). In addition, the amounts of Rac1 and PAK1 were also reduced (Figure 5A and Bb). Most notably, the extent of reduction of EICD, Rac1 and PAK1 in the occipital lobes of AD patients (Figure 5A and B) was greater than the reduction found in the frontal lobes of AD patients, as shown in Figure 1C,D. Next, the correlations between the amounts of EICD and Rac1, and PAK1 were examined. It was found that the amount of EICD did not correlate with the levels of Rac1 and PAK1 (Figure 5C and D).
Figure 5.
Analysis of the amount of EICD in the occipital lobes of AD patients. A. Western blotting analyses of EphA4, Rac1, PAK1 and NSE in the occipital lobes of AD patients. Homogenates of the occipital lobes of AD patients and age‐matched controls were analyzed by Western blotting using the indicated Abs. B. (a) Quantitation of the amount of EICD. Band intensities were quantitated as a ratio of full‐length EphA4. (b) Quantitation of the amounts of full‐length EphA4, Rac1 and PAK1. Band intensities were quantitated as a ratio of NSE and normalized to the average amount of each protein. Data are expressed as means ± SEM. *P < 0.05; ***P < 0.001; NS, no significance. C. Correlations between the amounts of EICD and Rac1. The level of Rac1 was plotted against the level of EICD. D. Correlations between the amounts of EICD and PAK1. The level of PAK1 was plotted against the level of EICD.
The levels of various synapse proteins in the occipital lobes of AD patients were examined. Similar to the frontal lobe, the amount of PSD‐95 was markedly decreased in the occipital lobes of AD patients, although the levels of GluR1, NR1, N‐cadherin, SAP‐97 and GRIP were unchanged (Figure 6A–D). To examine the relationships between the amounts of PSD‐95 and EICD, Rac1 or PAK1, correlation analyses were performed. It was found that the level of PSD‐95 did not correlate with the level of EICD, Rac1 or PAK1 (Figure 6E–G). Of note, the level of EICD negatively correlated with PSD‐95 in age‐matched controls, although this correlation was not observed in AD patients (Figure 6E). These results indicate that EICD is markedly reduced in AD patients, but the reduction of EICD is not directly involved in the reduction of Rac1 or PSD‐95 in the occipital lobe.
Figure 6.
Analyses of various synapse proteins in the occipital lobe. A. Western blotting analyses of GluR1, NR1 and N‐cadherin. Homogenates of the occipital lobes of AD patients and age‐matched controls were analyzed by Western blotting using the indicated Abs. B. Quantitation of the amounts of GluR1, NR1 and N‐cadherin. Band intensities were quantitated as a ratio of NSE and normalized to the average amount of each protein. Data are expressed as means ± SEM. NS, no significance. C. Western blotting analyses of PSD‐95, SAP97 and GRIP. Homogenates of the occipital lobes of AD patients and age‐matched controls were analyzed by Western blotting using the indicated Abs. D. Quantitation of the amounts of PSD‐95, SAP97 and GRIP. Band intensities were quantitated as a ratio of NSE, and normalized to the average amount of each protein. Data are expressed as means ± SEM. ***P < 0.001; NS, no significance. E. Correlation between the amount of PSD‐95 and EICD. The level of PSD‐95 was plotted against the level of EICD. F. Correlation between the level of PSD‐95 and Rac1. The level of PSD‐95 was plotted against the level of Rac1. G. Correlation between the amount of PSD‐95 and PAK1. The level of PSD‐95 was plotted against the level of PAK1. A linear regression line is shown when the correlation reached statistical significance.
DISCUSSION
It has become evident that various neurological disorders such as AD, schizophrenia and mental retardation are accompanied by alterations in the morphology of dendritic spines (16). Several studies have shown that impairment of the Rac signaling pathway is involved in these neurological disorders (16). Indeed, we found that the amounts of Rac1 and its downstream target, PAK1, were decreased in the frontal lobes and occipital lobes of AD patients. Recently, it was reported that EICD activates the Rac signaling pathway (6). In this study, we showed that the level of EICD correlated with the levels of Rac1 and PAK1 in the frontal lobe of AD patients. Moreover, the amount of membrane‐associated EICD was significantly decreased in AD and strongly correlated with the level of membrane‐associated Rac1, which is considered to be active Rac1. Of note, the correlation between EICD and Rac1 or PAK1 found in AD brain homogenate samples was not observed in age‐matched controls, although the correlation between membrane‐associated EICD and Rac1 was observed. These data suggest that EICD regulates the activity of Rac1, but not protein amount in brain. The mechanism of the localization and function of EICD is currently unknown. However, it was reported that the membrane‐associated mutant of EICD could activate the Rac signaling pathway (6). These findings lead us to speculate that downstream targets of EICD might be membrane proteins or membrane‐associated proteins. Several modulators of the Rac signaling pathway have been reported to be associated with PSD, that is a specialized synaptic membrane structure, and regulate the morphogenesis of dendritic spines (15). Some of these regulators are known to be involved in the pathogenesis of various neurological disorders (16). The mechanism underlying the EICD‐induced activation of the Rac signaling pathway has not been elucidated. However, considering that the overexpression of EICD enhances the formation of dendritic spines through activation of the Rac signaling pathway (6), it is likely that EICD is involved in the regulation of Rac modulators. Our biochemical studies indicated that the amount of EICD in the PSD fraction was decreased in AD and correlated with that of membrane‐associated Rac1, although the correlation was not observed in AD. These results indicate that PSD‐associated Rac modulators might be involved in the EICD‐mediated Rac1 signaling pathway, and suggest that impairment of this regulation system might contribute to the synaptic pathogenesis of AD. Identification of the modulators of Rac is therefore important for understanding the molecular mechanism underlying the reduced Rac signaling in AD brain. Recently, it was reported that Aβ binds to another Eph family member, EphB2, and affects the downstream signaling of EphB2, which results in impairment of memory formation (2). However, in this study, we showed that the level of Aβ did not correlate with the levels of EICD and Rac1. These results imply that unlike EphB2, Aβ does not directly affect the EICD signaling pathway.
It is known that the number of synapses is decreased in AD brain 3, 21. In addition, it has been reported that the amount of PSD‐95 was reduced in AD patients 17, 24. Consistent with these findings, the amount of PSD‐95 was markedly decreased in the frontal lobes and occipital lobes of AD patients, although the levels of GluR1, NR1, N‐cadherin, SAP97 and GRIP were unchanged. Moreover, the level of PSD‐95 correlated with the level of Rac1. Recently, it was reported that the level of synaptic PSD‐95 was decreased in Rac1 conditional knockout mice (4). This observation and our results suggest that the reduced Rac signaling might be involved in the reduction of PSD‐95.
In this study, we demonstrated that the level of Rac1 and PAK1 correlated well with the level of PSD‐95 or tau phosphorylation. However, the correlation between EICD and PSD‐95 or tau phosphorylation was not found, although the level of EICD correlated well with the levels of Rac1 and PAK1. Moreover, the level of membrane‐associated EICD strongly correlated with the level of membrane‐associated Rac1, which is considered to be active Rac1. Therefore, it is thought that EICD is implicated in the changes in PSD‐95 and tau phosphorylation via the Rac signaling pathway. Of note, the correlation between the amounts of EICD and Rac1, or between Rac1 and PSD‐95, which is found in the frontal lobe of AD patients, was not observed in the occipital lobe, although the average amounts of EICD, Rac1 and PSD‐95 were markedly reduced compared to the frontal lobe. It is known that the occipital lobe is not severely degenerated even at the late stage of AD (1). In the early stage of neurodegeneration, healthy neurons are known to compensate for damaged neurons to recover the reduced neuronal activity via up‐regulation of synapse modulators 20, 23. Therefore, it is thought that the lack of correlation between EICD, Rac1 or PSD‐95 in the occipital lobe might be caused by the compensation mechanism.
In conclusion, EICD is known to enhance the formation of dendritic spines through activation of the Rac signaling pathway (6). In the present study, we found that the amount of membrane‐associated EICD was reduced in AD brain, and that the level of EICD strongly correlated with the level of membrane‐associated Rac1, which is considered to be active Rac1, in the frontal lobe. Moreover, the amount of Rac1 correlated with the level of PSD‐95. These findings suggest that the EICD‐mediated Rac signaling pathway is involved in the synaptic pathogenesis of AD. However, the precise mechanism underlying the changes in the EICD signaling pathway in AD brain remains unknown. Therefore, further analysis of the mechanism of the EICD signaling pathway is required for a better understanding of the synaptic pathogenesis of AD.
REFERENCES
- 1. Braak H, Braak E (1997) Frequency of stages of Alzheimer‐related lesions in different age categories. Neurobiol Aging 18:351–357. [DOI] [PubMed] [Google Scholar]
- 2. Cissé M, Halabisky B, Harris J, Devidze N, Dubal DB, Sun B et al (2011) Reversing EphB2 depletion rescues cognitive functions in Alzheimer model. Nature 469:47–52. [DOI] [PMC free article] [PubMed] [Google Scholar]
- 3. DeKosky ST, Scheff SW (1990) Synapse loss in frontal cortex biopsies in Alzheimer's disease: correlation with cognitive severity. Ann Neurol 27:457–464. [DOI] [PubMed] [Google Scholar]
- 4. Haditsch U, Leone DP, Farinelli M, Chrostek‐Grashoff A, Brakebusch C, Mansuy IM et al (2009) A central role for the small GTPase Rac1 in hippocampal plasticity and spatial learning and memory. Mol Cell Neurosci 41:409–419. [DOI] [PMC free article] [PubMed] [Google Scholar]
- 5. Inoue E, Mochida S, Takagi H, Higa S, Deguchi‐Tawarada M, Takao‐Rikitsu E et al (2006) SAD: a presynaptic kinase associated with synaptic vesicles and the active zone cytomatrix that regulates neurotransmitter release. Neuron 50:261–275. [DOI] [PubMed] [Google Scholar]
- 6. Inoue E, Deguchi‐Tawarada M, Togawa A, Matsui C, Arita K, Katahira‐Tayama S et al (2009) Synaptic activity prompts γ‐secretase‐mediated cleavage of EphA4 and dendritic spine formation. J Cell Biol 185:551–564. [DOI] [PMC free article] [PubMed] [Google Scholar]
- 7. Iwasato T, Katoh H, Nishimaru H, Ishikawa Y, Inoue H, Saito YM et al (2007) Rac‐GAP alpha‐chimerin regulates motor‐circuit formation as a key mediator of EphrinB3/EphA4 forward signaling. Cell 130:742–753. [DOI] [PubMed] [Google Scholar]
- 8. Kim E, Sheng M (2004) PDZ domain proteins of synapses. Nat Rev Neurosci 5:771–781. [DOI] [PubMed] [Google Scholar]
- 9. Klein R (2009) Bidirectional modulation of synaptic functions by Eph/ephrin signaling. Nat Neurosci 12:15–20. [DOI] [PubMed] [Google Scholar]
- 10. Matsuzaki M, Ellis‐Davies GC, Nemoto T, Miyashita Y, Iino M, Kasai H (2001) Dendritic spine geometry is critical for AMPA receptor expression in hippocampal CA1 pyramidal neurons. Nat Neurosci 4:1086–1092. [DOI] [PMC free article] [PubMed] [Google Scholar]
- 11. Matsuzaki M, Honkura N, Ellis‐Davies GC, Kasai H (2004) Structural basis of long‐term potentiation in single dendritic spines. Nature 429:761–766. [DOI] [PMC free article] [PubMed] [Google Scholar]
- 12. Moissoglu K, Slepchenko BM, Meller N, Horwitz AF, Schwartz MA (2006) In vivo dynamics of Rac‐membrane interactions. Mol Biol Cell 17:2770–2779. [DOI] [PMC free article] [PubMed] [Google Scholar]
- 13. Murai KK, Nguyen LN, Irie F, Yamaguchi Y, Pasquale EB (2003) Control of hippocampal dendritic spine morphology through ephrin‐A3/EphA4 signaling. Nat Neurosci 6:153–160. [DOI] [PubMed] [Google Scholar]
- 14. Pasquale EB (2008) Eph‐ephrin bidirectional signaling in physiology and disease. Cell 133:38–52. [DOI] [PubMed] [Google Scholar]
- 15. Penzes P, Cahill ME, Jones KA, Srivastava DP (2008) Convergent CaMK and RacGEF signals control dendritic structure and function. Trends Cell Biol 18:405–413. [DOI] [PubMed] [Google Scholar]
- 16. Penzes P, Cahill ME, Jones KA, Vanleeuwen JE, Woolfrey KM (2011) Dendritic spine pathology in neuropsychiatric disorders. Nat Neurosci 14:285–293. [DOI] [PMC free article] [PubMed] [Google Scholar]
- 17. Pham E, Crews L, Ubhi K, Hansen L, Adame A, Cartier A et al (2010) Progressive accumulation of amyloid‐beta oligomers in Alzheimer's disease and in amyloid precursor protein transgenic mice is accompanied by selective alterations in synaptic scaffold proteins. FEBS J 277:3051–3067. [DOI] [PMC free article] [PubMed] [Google Scholar]
- 18. Riley KP, Snowdon DA, Markesbery WR (2002) Alzheimer's neurofibrillary pathology and the spectrum of cognitive function: findings from the Nun Study. Ann Neurol 51:567–577. [DOI] [PubMed] [Google Scholar]
- 19. Robbe K, Otto‐Bruc A, Chardin P, Antonny B (2003) Dissociation of GDP dissociation inhibitor and membrane translocation are required for efficient activation of Rac by the Dbl homology‐pleckstrin homology region of Tiam. J Biol Chem 278:4756–4762. [DOI] [PubMed] [Google Scholar]
- 20. Savioz A, Leuba G, Vallet PG, Walzer C (2009) Contribution of neural networks to Alzheimer disease's progression. Brain Res Bull 80:309–314. [DOI] [PubMed] [Google Scholar]
- 21. Scheff SW, Price DA (2003) Synaptic pathology in Alzheimer's disease: a review of ultrastructural studies. Neurobiol Aging 24:1029–1046. [DOI] [PubMed] [Google Scholar]
- 22. Scheff SW, Price DA, Schmitt FA, DeKosky ST, Mufson EJ (2007) Synaptic alterations in CA1 in mild Alzheimer disease and mild cognitive impairment. Neurology 68:1501–1508. [DOI] [PubMed] [Google Scholar]
- 23. Small DH (2008) Network dysfunction in Alzheimer's disease: does synaptic scaling drive disease progression? Trends Mol Med 14:103–108. [DOI] [PubMed] [Google Scholar]
- 24. Sultana R, Banks WA, Butterfield DA (2010) Decreased levels of PSD95 and two associated proteins and increased levels of BCl2 and caspase 3 in hippocampus from subjects with amnestic mild cognitive impairment: insights into their potential roles for loss of synapses and memory, accumulation of Aβ, and neurodegeneration in a prodromal stage of Alzheimer's disease. J Neurosci Res 88:469–477. [DOI] [PMC free article] [PubMed] [Google Scholar]
- 25. Tanaka J, Horiike Y, Matsuzaki M, Miyazaki T, Ellis‐Davies GC, Kasai H (2008) Protein synthesis and neurotrophin‐dependent structural plasticity of single dendritic spines. Science 319:1683–1687. [DOI] [PMC free article] [PubMed] [Google Scholar]
- 26. Tashiro A, Yuste R (2004) Regulation of dendritic spine motility and stability by Rac1 and Rho kinase: evidence for two forms of spine motility. Mol Cell Neurosci 26:429–440. [DOI] [PubMed] [Google Scholar]
- 27. Zhao L, Ma QL, Calon F, Harris‐White ME, Yang F, Lim GP et al (2006) Role of p21‐activated kinase pathway defects in the cognitive deficits of Alzheimer disease. Nat Neurosci 9:234–242. [DOI] [PubMed] [Google Scholar]
- 28. Zhou Y, Dougherty JH Jr, Hubner KF, Bai B, Cannon RL, Hutson RK (2008) Abnormal connectivity in the posterior cingulate and hippocampus in early Alzheimer's disease and mild cognitive impairment. Alzheimers Dement 4:265–270. [DOI] [PubMed] [Google Scholar]