

Abstract
Ependymomas are primary brain tumors found throughout the central nervous system (CNS) in children and adults. Currently, many treatment protocols stratify grade I and II ependymomas as low‐risk tumors, whereas grade III anaplastic ependymomas are considered high‐risk tumors. The prognostic significance of World Health Organization (WHO) grade II or III, however, remains debated, and it is furthermore increasingly recognized that the pathologic differentiation between grades II and III is arbitrary in daily practice, thus resulting in imprecise risk stratification. Therefore, prognostic markers enabling more precise stratification to guide treatment decisions are urgently needed. An analysis of n = 379 tumor samples revealed that protein expression of nestin, a marker for neural stem and progenitor cells established as a routine staining in most neuropathology centers, is associated with poor outcome in intracranial ependymomas. Most importantly, nestin‐positive grade II ependymomas have the same prognosis as grade III ependymomas. Multivariable analysis demonstrates that nestin positivity is an independent marker for poor progression‐free survival (PFS) and overall survival (OS). Gene expression analysis for transcriptionally co‐regulated genes revealed a strong association of developmental and epigenetic processes with nestin. In summary, our data implicate nestin as a useful novel marker for intracranial ependymoma risk stratification easily implementable in routine diagnostics.
Keywords: ependymoma, nestin, risk stratification, WHO grade
INTRODUCTION
Ependymoma is a primary central nervous system (CNS) tumor commonly found in pediatric and, to a lesser extent, in adult patients. The World Health Organization (WHO) 2007 classification groups ependymal tumors into grade I (subependymoma, myxopapillary ependymoma), II (ependymoma) and III (anaplastic ependymoma) (23). WHO grade is an important variable in clinical assessment, as grade III has been shown to be a poor prognostic factor for both progression‐free survival (PFS) and/or overall survival (OS) 14, 20, 38, 46. However, the reliance solely on grading for the neuropathological stratification of patients is problematic, as grading is subject to significant interobserver variability even in the hands of the most experienced neuropathologists 9, 46. Therefore, the addition of markers that are already widely established in neuropathology routine diagnostics and which complementarily identify prognostic subgroups would allow for fast translation into the clinic. To address this clinically challenging problem, we have previously proposed improved stratification models, enabling stratification of ependymomas into cytogenetic risk groups 1–3 (21) (with cytogenetic group 3 having the poorest prognosis), and posterior fossa ependymomas into groups A and B (PFA and PFB) (50) (with PFA having the poorest prognosis). These stratification models use a combination of fluorescence in situ hybridiziation (FISH) (21) and immunohistochemistry (IHC) (50), and are waiting to be implemented on a larger scale. Until then, histopathological grading remains the most widely used stratification factor.
Nestin is an intermediate class VI filament and a robust marker of neural 11, 22 and other stem cells 2, 17, 45. Most importantly, it is expressed by radial glia cells, a subset of neural stem cells (25), which are the putative cells of origin of ependymoma 16, 44. We have reported strong nestin expression in a high‐risk cancer stem cell model of anaplastic ependymoma (DKFZ‐EP1NS) (28), as have other groups on their cell lines nEPN1 and nEPN2 (15), and D528 EP‐X and D612 EP‐X (26).
Through its ability to mark stem and progenitor cells, nestin has garnered high interest as a marker of lack of differentiation and prognosis in tumors of neural as well as nonneural origin: high nestin protein expression has been correlated with tumor grade in nonbrain tumors such as gastrointestinal stromal tumor and angiosarcoma (53), and has been reported to be a predictor of poor prognosis in patients with NSCLC (34), and melanoma 30, 43. In primary brain tumors, nestin protein expression has been described in ganglioglioma, pilocytic and anaplastic astrocytoma, medulloblastoma, glioblastoma, and ependymoma 1, 6, 7, 36, 47. Nestin protein expression correlates with tumor grading in glioma 6, 8, 24, and in combination with the stem cell marker CD133, nestin protein expression is a marker of poor prognosis in high‐grade glioma (55). Analyses of nestin expression in larger cohorts of ependymoma and correlation with clinical course, however, have not yet been conducted. Expression patterns characteristic for stem cells have been implied as prognostic or predictive factors in cancer subtypes including glioblastoma 12, 52, breast cancer (37), colorectal cancer (27) and leukemias (10). We therefore hypothesized that nestin expression in ependymoma indicates a neural stem cell program associated with poor prognosis. As staining for nestin is already established in most neuropathology centers, it might serve as a readily available marker to improve the identification of ependymoma patients with poor outcome.
MATERIALS AND METHODS
Patients
Paraffin‐embedded samples of intracranial ependymoma WHO II and anaplastic ependymoma WHO III were collected at diagnosis between 1993 and 2003 at the Department of Neuropathology, Burdenko Neurosurgical Institute (Moscow, Russia), as described previously (21). Diagnoses were confirmed through assessment by at least two neuropathologists including a central pathology review. Approval to link laboratory data to clinical and pathological data was obtained from the Institutional Review Board. For description of treatment modalities, see Korshunov et al (21). Briefly, patients with grade 2 tumors and complete resection received no adjuvant therapy. Patients 4 years of age or older with grade 3 tumors or incompletely resected grade 2 tumors received radiotherapy (total radiation doses: 55 to 64 Gy). All patients younger than 4 years with grade 3 tumors or incompletely resected grade 2 tumors received chemotherapy with vincristine, lomustine and cisplatin (21). The median length of follow‐up was 53 months (lower 95% confidence interval: 43 months, upper 95% confidence interval: 63 months); maximum follow‐up was 192 months. For data of patients from the tissue microarray (TMA), see Table 1. For data of patients from the gene expression analyses, see Witt et al (50).
Table 1.
Characteristics of patients included in the ependymoma TMA. Abbreviations: TMA = tissue microarray; WHO = World Health Organization.
| All patients | Pediatric patients only | Adult patients only | ||||
|---|---|---|---|---|---|---|
| Variable | n | % (total) | n | % (total) | n | % (total) |
| Patients | 379 | 100.0 | 193 | 50.9 | 186 | 49.1 |
| Variable | n | % (group) | n | % (group) | n | % (group) |
| Age (years) | ||||||
| <4 | 53 | 14.0 | 53 | 27.5 | — | — |
| 4–18 | 140 | 36.9 | 140 | 72.5 | — | — |
| >18 | 186 | 49.1 | — | — | 186 | 100.0 |
| Gender | ||||||
| Female | 167 | 44.1 | 71 | 36.8 | 96 | 51.6 |
| Male | 212 | 55.9 | 122 | 63.2 | 90 | 48.4 |
| Location | ||||||
| Supratentorial | 110 | 29.0 | 67 | 34.7 | 43 | 23.1 |
| Infratentorial | 269 | 71.0 | 126 | 65.3 | 143 | 76.9 |
| WHO histologic grade | ||||||
| II | 137 | 36.1 | 44 | 22.8 | 93 | 50.0 |
| III | 242 | 63.9 | 149 | 77.2 | 93 | 50.0 |
| Cytogenetic group | ||||||
| 1 | 118 | 31.1 | 32 | 16.6 | 86 | 46.2 |
| 2 | 82 | 21.6 | 64 | 33.2 | 18 | 9.7 |
| 3 | 40 | 10.6 | 26 | 13.5 | 14 | 7.5 |
| n/a | 139 | 36.7 | 71 | 36.8 | 68 | 36.6 |
| Posterior fossa group | ||||||
| PFA | 81 | 21.4 | 75 | 38.9 | 6 | 3.2 |
| PFB | 134 | 35.4 | 24 | 12.4 | 110 | 59.1 |
| n/a | 164 | 43.3 | 94 | 48.7 | 70 | 37.6 |
| Level of resection | ||||||
| Gross total resection | 210 | 55.4 | 91 | 47.2 | 119 | 64.0 |
| Subtotal resection | 169 | 44.6 | 102 | 52.8 | 67 | 36.0 |
| Radiotherapy | ||||||
| Yes | 245 | 64.6 | 76 | 39.4 | 128 | 68.8 |
| No | 134 | 35.4 | 117 | 60.6 | 58 | 31.2 |
| Recurrence | ||||||
| Yes | 138 | 36.4 | 87 | 45.1 | 51 | 27.4 |
| No | 241 | 63.6 | 106 | 54.9 | 135 | 72.6 |
| Metastasis | ||||||
| Yes | 46 | 12.1 | 37 | 19.2 | 9 | 4.8 |
| No | 333 | 87.9 | 156 | 80.8 | 177 | 95.2 |
| Death | ||||||
| Yes | 62 | 16.4 | 43 | 22.3 | 19 | 10.2 |
| No | 317 | 83.6 | 150 | 77.7 | 167 | 89.8 |
TMA and IHC
For preparation of the TMA, see Witt et al (50). All IHC stainings were performed on 5‐µm thick sections of formalin‐fixed, paraffin‐embedded microdissected specimens. For detection of nestin, the antibody No. MAB5326 (Millipore, Billerica, MA, USA) was used. IHC was performed with an automated stainer (Benchmark XT, Ventana, Strasbourg, France) following the protocols of the manufacturer. In brief, sections were stained by incubation with the primary antibody at 1:200 dilution, for 32 minutes at 37°C. No blocking step was required for nestin staining. Binding of the primary antibody was detected using DAB (Ultra View DAB Detection Kit v3, Ventana) followed by counterstaining with hematoxilin (Nexes Hematoxilin, Ventana) for 4 minutes and by a blueing step (Nexes blueing reagent, Ventana) for 4 minutes.
The scoring of the IHC was performed by two investigators (AK and HW), who were both blinded to the clinical information. Any detectable staining for nestin was considered “positive.”
Gene expression analysis
For data of patients and procedures on analysis of the Heidelberg (GSE27287) and Toronto (GSE27287) ependymoma datasets, see Witt et al (50). The database analysis tool R2 (http://r2.amc.nl) was used to investigate nestin mRNA expression in brain tumors and normal brain tissues using publicly available datasets (GEO accession numbers: ependymoma: GSE16155 and GSE21687; medulloblastoma: GSE10327; glioma: GSE4290; pediatric high‐grade glioma: GSE19578; normal brain: GSE11882; prefrontal cortex: GSE13564; embryogenesis: GSE15744; neural tissue: GSE9770; normal cerebellum: GSE3526).
The following analyses were carried out with R/Bioconductor (32), based on log2‐transformed mRNA expression data. Pearson's correlation coefficient with nestin (NES) expression was calculated for all available transcripts on the Heidelberg and Toronto dataset. Transcripts were ranked according to strength of correlation. Transcripts with an absolute correlation exceeding 0.5 were defined as nestin co‐regulated transcripts.
Overrepresentation of Gene Ontology (GO) terms and KEGG pathways within co‐regulated transcripts was assessed based on hypergeometric tests. Geneset enrichment analysis (GSEA) (41) ranking all transcripts according to their absolute correlation with nestin expression was performed as implemented by Wang et al (49). P‐values were adjusted for multiple testing using Benjamini–Hochberg correction.
Statistics
Statistical analysis was performed using “GraphPad Prism” version 3.03 for Windows (GraphPad Software, La Jolla, CA, USA) and R version 2.14 (32). “GraphPad Prism”: Fisher's exact t‐test and logrank‐test for survival analysis (IHC). The following analyses were carried out with R using add‐on packages rms and pec: Median follow‐up time was calculated using the reverse Kaplan–Meier method approach, that is, time to censoring (35). Prognostic value of nestin IHC was analyzed in univariable and multivariable Cox PH regression models. Cox PH model for WHO stage and nestin was compared with the model for WHO stage alone using the likelihood‐ratio test (LRT). Prediction accuracy of prognostic models was assessed with prediction error curves based on the Brier score (13) using .632+ bootstrap estimates. Explained variation was determined based on the integrated Brier scores (IBS) after 5 years. IBS of prognostic models were compared with a multisplit test approach (48). Logrank‐test was used for survival analysis (mRNA), including determination of optimal cutpoints and correction for multiple testing. All P‐values were two sided. P‐values below 0.05 were considered significant.
RESULTS
Nestin is differentially expressed in normal brain tissue and brain tumors
In order to investigate differential nestin expression in common brain tumors, normal embryonic and adult brain tissues, we searched publicly available datasets in the R2‐database for nestin mRNA expression. Nestin mRNA was expressed at higher levels in ependymoma, various low and high‐grade gliomas, and embryonal tissues, and at lower levels in medulloblastoma and adult brain tissues from various regions (Supporting Information Figure S1). IHC for nestin protein on ependymoma sections showed typical cytoplasmic staining and revealed distinct expression patterns of nestin on the protein level in different patients, in both children and adults (Figure 1). Of note, IHC for nestin was very strong in positive and virtually absent in negative cases. In summary, nestin is expressed in ependymoma on the mRNA and protein levels, and a strong difference in staining intensity can be seen between positive and negative cases.
Figure 1.
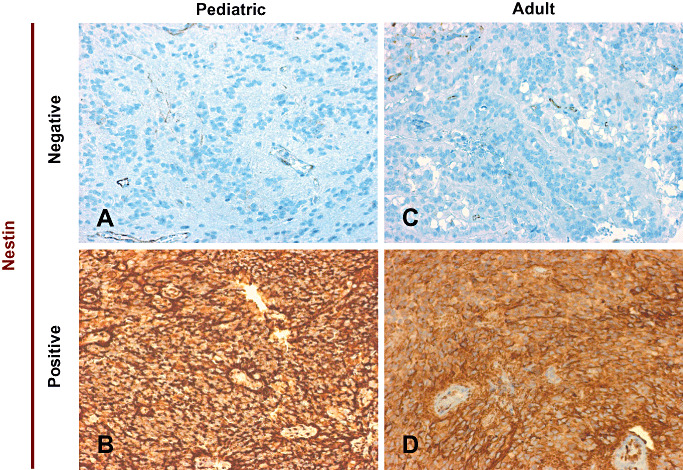
Immunohistochemistry reveals differential expression of nestin in pediatric and adult ependymoma. A–D. Nestin protein is differentially expressed in pediatric and adult ependymoma. Four different representative cases are depicted: one negative and one positive pediatric case each (A and B), and one negative and one positive adult case each (C and D).
Nestin protein expression is significantly correlated with survival in pediatric and adult intracranial ependymoma patients and is an independent prognostic factor
The differential expression of nestin prompted us to investigate the prognostic relevance of nestin IHC in primary intracranial ependymomas by staining a TMA of n = 379 pediatric and adult intracranial ependymomas (Table 1). Patients were grouped in a blinded fashion into “nestin positive” or “nestin negative” and analyzed in combination (all) or separately (pediatric or adult) together with the clinical parameters gender, location, grade and extent of resection (Supporting Information Figure S2), as well as for PFS and OS (Figure 2A). A significantly higher percentage of nestin‐positive tumors was detected in supratentorial and WHO III ependymoma (Supporting Information Figure S2). When analyzed separately in children (≤18 years) or adults (>18 years), a significantly higher percentage of nestin‐positive tumors was detected in pediatric supratentorial ependymomas, and adult WHO III ependymomas (Supporting Information Figure S2).
Figure 2.
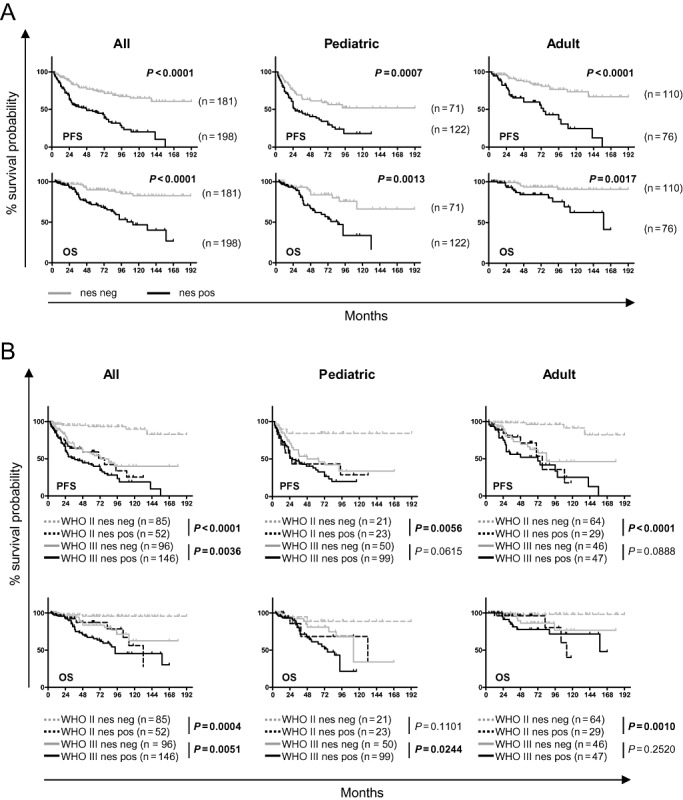
Nestin positivity is a marker of poor prognosis in primary ependymoma and discriminates WHO II ependymoma with poor survival. The n = 379 primary ependymoma samples on a tissue microarray (TMA) were stained for nestin and scored for negativity or positivity. Progression‐free survival (PFS; top row) and overall survival (OS; bottom row) of all (left), pediatric only (middle) and adult only (right) patients. A. Nestin seprates the cohorts (all, pediatric only or adult only) into two distinct groups with statistically significant different PFS or OS probabilities (logrank‐test). B. WHO II nestin‐postive tumors have the same poor prognosis as WHO III nestin‐negative tumors: in all analyses (PFS or OS for all, pediatric or adult), no significant differences could be detected between WHO II nestin‐positive tumors and WHO III nestin‐negative tumors (logrank‐test). WHO II tumors positive for nestin have a significantly inferior PFS in all, pediatric and adult patients, and a significantly inferior OS in all and adult patients (logrank‐test).
Survival analysis revealed that nestin separates the patients into two distinct groups with statistically significant differences in survival (PFS and OS), which holds true for both pediatric and adult patients when analyzed separately (Figure 2A). A univariable and multivariable Cox regression model was used to assess the prognostic effect of nestin adjusted for clinical parameters. It revealed nestin positivity to be an independent marker for poor PFS in all, pediatric or adult patients, and for OS in all, or adult patients, respectively (Supporting Information Table S1 and Table 2). When the variables' molecular markers (cytogenetic group only, or cytogenetic group and posterior fossa group) were included, nestin proved to be an independent marker for poor PFS and OS for all patients (Table 3).
Table 2.
Cox proportional hazards model for progression‐free (PFS) and overall survival (OS) estimation—multivariable analysis. Abbreviations: GTR = gross total resection; HR = hazard ratio; CI = confidence interval; RT = radiotherapy; STR = subtotal resection; WHO = World Health Organization.
| n = 379 patients | n = 193 patients | n = 186 patients | ||||||||||
|---|---|---|---|---|---|---|---|---|---|---|---|---|
| PFS | ||||||||||||
| Variable | All patients | Pediatric only | Adult only | |||||||||
| HR | Lower CI | Upper CI | P | HR | Lower CI | Upper CI | P | HR | Lower CI | Upper CI | P | |
| Gender (male vs. female) | 1.2 | 0.8 | 1.6 | 0.3827 | 0.9 | 0.6 | 1.4 | 0.7229 | 1.5 | 0.9 | 2.7 | 0.1552 |
| Age, years (≥4 vs. <4) | 0.4 | 0.2 | 0.8 | 0.0135 | 0.6 | 0.3 | 1.1 | 0.1032 | — | — | — | — |
| Location (supratentorial vs. infratentorial) | 1.6 | 1.1 | 2.4 | 0.0082 | 1.3 | 0.8 | 2.1 | 0.2620 | 2.6 | 1.4 | 4.7 | 0.0017 |
| WHO histologic grade (III vs. II) | 2.3 | 1.4 | 3.9 | 0.0012 | 1.5 | 0.8 | 2.8 | 0.1819 | 2.3 | 0.9 | 5.9 | 0.0820 |
| Level of resection (STR vs. GTR) | 1.7 | 1.2 | 2.5 | 0.0031 | 2.0 | 1.2 | 3.1 | 0.0042 | 1.4 | 0.7 | 2.8 | 0.3273 |
| Irradiation (RT vs. no RT) | 1.1 | 0.6 | 1.9 | 0.8636 | 1.0 | 0.5 | 1.9 | 0.9295 | 1.5 | 0.4 | 5.3 | 0.4986 |
| Nestin protein expression (positive vs. negative) | 2.4 | 1.6 | 3.4 | 0.0000 | 1.8 | 1.1 | 3.0 | 0.0241 | 3.2 | 1.8 | 5.9 | 0.0002 |
| OS | ||||||||||||
|---|---|---|---|---|---|---|---|---|---|---|---|---|
| Variable | All patients | Pediatric only | Adult only | |||||||||
| HR | Lower CI | Upper CI | P | HR | Lower CI | Upper CI | P | HR | Lower CI | Upper CI | P | |
| Gender (male vs. female) | 1.2 | 0.7 | 2.0 | 0.5061 | 0.8 | 0.4 | 1.5 | 0.4779 | 2.6 | 1.0 | 6.8 | 0.0637 |
| Age, years (≥4 vs. <4) | 0.6 | 0.2 | 1.5 | 0.2491 | 0.6 | 0.2 | 1.7 | 0.3264 | — | — | — | — |
| Location (supratentorial vs. infratentorial) | 1.5 | 0.9 | 2.5 | 0.1721 | 1.6 | 0.8 | 3.1 | 0.1972 | 1.2 | 0.4 | 3.3 | 0.7686 |
| WHO histologic grade (III vs. II) | 3.0 | 1.3 | 6.8 | 0.0101 | 2.5 | 0.9 | 7.0 | 0.0869 | 4.9 | 1.0 | 25.7 | 0.0581 |
| Level of resection (STR vs. GTR) | 1.9 | 1.1 | 3.2 | 0.0241 | 1.4 | 0.8 | 2.6 | 0.2910 | 3.5 | 1.1 | 10.6 | 0.0294 |
| Irradiation (RT vs. no RT) | 0.6 | 0.3 | 1.6 | 0.3539 | 0.7 | 0.3 | 2.0 | 0.5177 | 0.3 | 0.0 | 2.3 | 0.2464 |
| Nestin protein expression (positive vs. negative) | 2.7 | 1.5 | 4.9 | 0.0010 | 2.1 | 1.0 | 4.4 | 0.0616 | 3.1 | 1.1 | 8.7 | 0.0307 |
All boldface are HR and P‐value of statistically significant parameters.
Table 3.
Cox proportional hazards model for progression‐free (PFS) and overall survival (OS) estimation—multivariable analysis including “cytogenetic group” and/or “posterior fossa group”. Abbreviations: GTR = gross total resection; HR = hazard ratio; CI = confidence interval; RT = radiotherapy; STR = subtotal resection; WHO = World Health Organization.
| Variable “cytogenetic group” included | ||||
|---|---|---|---|---|
| n = 240 patients | ||||
| PFS | ||||
| Variable | All patients | |||
| HR | Lower CI | Upper CI | P | |
| Gender (male vs. female) | 0.9 | 0.6 | 1.3 | 0.4533 |
| Age, years (≥4 vs. <4) | 0.8 | 0.4 | 1.5 | 0.4045 |
| Location (supratentorial vs. infratentorial) | 0.9 | 0.6 | 1.5 | 0.7623 |
| WHO histologic grade (III vs. II) | 1.9 | 1.1 | 3.4 | 0.0298 |
| Cytogenetic group (2 vs. 1) | 5.0 | 2.8 | 9.1 | <0.0001 |
| Cytogenetic group (3 vs. 1) | 12.5 | 6.7 | 23.9 | <0.0001 |
| Level of resection (STR vs. GTR) | 1.5 | 1.0 | 2.2 | 0.0621 |
| Irradiation (RT vs. no RT) | 0.9 | 0.5 | 1.7 | 0.7603 |
| Nestin protein expression (positive vs. negative) | 2.3 | 1.5 | 3.7 | 0.0001 |
| OS | ||||
|---|---|---|---|---|
| Variable | All patients | |||
| HR | Lower CI | Upper CI | P | |
| Gender (male vs. female) | 0.7 | 0.4 | 1.2 | 0.1820 |
| Age, years (≥4 vs. <4) | 1.5 | 0.6 | 4.3 | 0.3580 |
| Location (supratentorial vs. infratentorial) | 0.6 | 0.3 | 1.1 | 0.0798 |
| WHO histologic grade (III vs. II) | 3.2 | 1.4 | 8.3 | 0.0062 |
| Cytogenetic group (2 vs. 1) | 26.6 | 8.2 | 135.7 | <0.0001 |
| Cytogenetic group (3 vs. 1) | 87.8 | 26.0 | 457.9 | <0.0001 |
| Level of resection (STR vs. GTR) | 1.5 | 0.8 | 2.6 | 0.1964 |
| Irradiation (RT vs. no RT) | 0.3 | 0.1 | 0.9 | 0.0207 |
| Nestin protein expression (positive vs. negative) | 2.2 | 1.2 | 4.3 | 0.0106 |
| Variable “cytogenetic group” and “posterior fossa group” included | ||||
|---|---|---|---|---|
| n = 144 patients | ||||
| PFS | ||||
| Variable | All patients | |||
| HR | Lower CI | Upper CI | P | |
| Gender (male vs. female) | 0.7 | 0.4 | 1.4 | 0.2902 |
| Age, years (≥4 vs. <4) | 1.6 | 0.7 | 3.7 | 0.2472 |
| WHO histologic grade (III vs. II) | 1.0 | 0.5 | 2.1 | 0.9098 |
| Cytogenetic group (2 vs. 1) | 3.5 | 0.9 | 12.3 | 0.0611 |
| Cytogenetic group (3 vs. 1) | 6.9 | 1.8 | 26.0 | 0.0047 |
| Posterior fossa group (PFA vs. PFB) | 5.1 | 1.6 | 19.5 | 0.0057 |
| Level of resection (STR vs. GTR) | 1.9 | 1.0 | 3.5 | 0.0384 |
| Irradiation (RT vs. no RT) | 0.8 | 0.4 | 1.8 | 0.5520 |
| Nestin protein expression (positive vs. negative) | 2.5 | 1.4 | 4.9 | 0.0033 |
| OS | ||||
|---|---|---|---|---|
| Variable | All patients | |||
| HR | Lower CI | Upper CI | P | |
| Gender (male vs. female) | 1.2 | 0.4 | 3.3 | 0.7814 |
| Age, years (≥4 vs. <4) | 3.2 | 1.1 | 10.9 | 0.0400 |
| WHO histologic grade (III vs. II) | 2.0 | 0.7 | 6.1 | 0.1996 |
| Cytogenetic group (2 vs. 1) | 16.7 | 1.7 | 223.8 | 0.0145 |
| Cytogenetic group (3 vs. 1) | 31.3 | 3.0 | 448.2 | 0.0023 |
| Posterior fossa group (PFA vs. PFB) | 6.3 | 1.0 | 104.4 | 0.0544 |
| Level of resection (STR vs. GTR) | 1.4 | 0.6 | 3.4 | 0.4019 |
| Irradiation (RT vs. no RT) | 0.2 | 0.1 | 0.8 | 0.0207 |
| Nestin protein expression (positive vs. negative) | 2.7 | 1.2 | 7.1 | 0.0187 |
All boldface are HR and P‐value of statistically significant parameters.
As grading of ependymoma is currently the most important neuropathological criterium for risk stratification but prone to interobserver variability, we sought to elucidate whether nestin could improve the current practice. Indeed, combined survival analysis of both categories, grade and nestin expression, revealed that patients with WHO II nestin‐negative ependymoma have the best and patients with WHO III nestin‐positive tumors have the poorest PFS and OS, for all, pediatric or adult cases (Figure 2B; Supporting Information Table S2). Most importantly, patients with WHO II, nestin‐positive ependymoma show a similar PFS or OS compared with patients with WHO III nestin‐negative ependymoma (all, pediatric or adult) (Figure 2B), and patients with WHO II nestin‐negative tumors show significantly better PFS (all, pediatric or adult) and OS (all, or adult) compared with patients with WHO II nestin‐positive tumors (Figure 2B).
The prognostic information improved significantly by addition of the variable nestin to the current practice of grading for both PFS and OS (Figure 3; LRT: P < 0.0001). Comparison of prediction error curves for both models showed that the prediction accuracy for PFS (P = 0.02) as well as OS (P = 0.03) was significantly improved by the addition of nestin, as indicated by a lower Brier score (Figure 3). The explained variation, indicating to which extent prognostic factors are able to describe differences in survival increased for both PFS (from 15% to 21%) and OS (from 10% to 14%) when adding nestin to grading.
Figure 3.
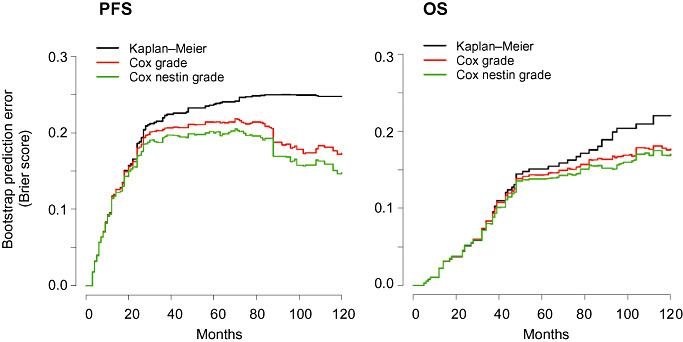
The addition of nestin to grading significantly improves prediction error rates. Comparison of the estimated prediction error for PFS (left) and OS (right) based on histopathological grading only (red) or grading and nestin (green) compared with the Kaplan–Meier benchmark (black) indicates a significant decrease of prediction error by the addition of nestin to grading. OS = overall survival; PFS = progression‐free survival.
In summary, high expression of nestin protein is an independent marker for PFS and OS in ependymoma. Importantly, high protein expression of nestin discriminates a group of patients with WHO II ependymoma with the same (poor) clinical outcome as WHO III ependymoma, and the addition of nestin to grading significantly improves prediction error rates.
Nestin identifies patients with poor survival in anatomical subgroups
In order to investigate if nestin protein is able to discriminate patients with poor survival in anatomical subgroups, we compared the survival of patients with nestin‐negative and ‐positive tumors in supra‐ and infratentorial ependymoma. When comparing tumors from the same location (infratentorial or supratentorial), nestin consistently separated the patients into two groups with distinct survival probabilites in infratentorial tumors (Figure 4). Infratentorial nestin‐negative ependymoma always showed the best PFS and OS, and supratentorial nestin‐positive tumors the worst PFS and OS (Figure 4; Supporting Information Table S2). We conclude that positive IHC for nestin identifies patients with poor survival in anatomical subgroups.
Figure 4.
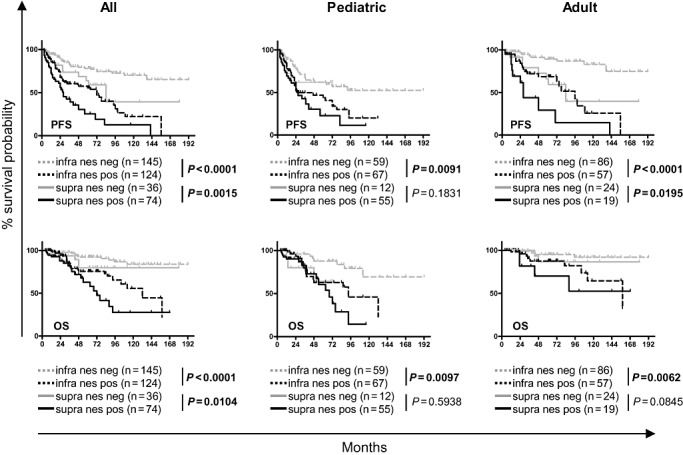
Nestin positivity is a marker of poor prognosis in infratentorial ependymoma. The n = 379 primary ependymoma samples on a tissue microarray (TMA) were stained for nestin and scored for negativity or positivity. Progression‐free survival (PFS; top row) and overall survival (OS; bottom row) of all (left), pediatric only (middle) and adult only (right) patients are depicted separated by location (infratentorial and supratentorial). Nestin separates infratentorial ependymomas into two distinct groups with statistically significant differences in PFS and OS probabilities in all, pediatric or adult patients. Supratentorial ependymoma only differs significantly for PFS in adults (logrank‐test).
Gene expression profiling reveals co‐regulated genes associated with neural development and epigenetic processes
As our data showed nestin protein expression to be closely linked to clinical outcome, we investigated gene expression profiles from two sets of n = 75 and n = 102 ependymomas, respectively [Heidelberg and Toronto dataset (50)]. Nestin mRNA expression separated the patients of the Heidelberg dataset into two groups with significantly different OS, with patients with high mRNA expression showing poorer survival than patients with low nestin mRNA expression (Figure 5). For PFS, patients with high nestin mRNA expression also showed an inferior survival, but without statistical significance (Figure 5). No survival data were available for the Toronto dataset.
Figure 5.
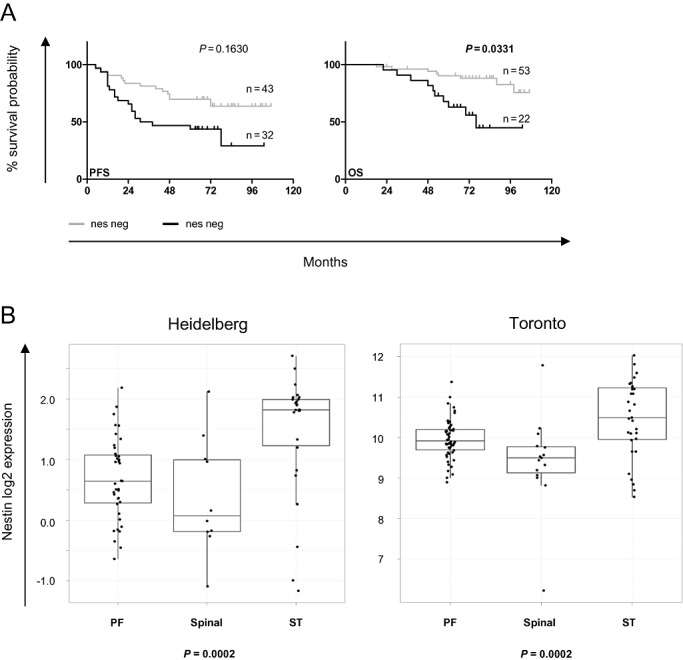
Nestin mRNA expression is associated with distinct overall survival (OS) probabilities and anatomical location. A. Nestin mRNA separates ependymomas into two distinct groups with statistically significant differences in OS probability, with tumors with high nestin mRNA having a significantly inferior OS [Heidelberg dataset; nestin high and low grouped according to optimal cutoff for each progression‐free survival (PFS) or OS; logrank‐test, including correction for multiple testing]. B. Nestin mRNA correlates significantly with anatomical location in both gene expression datasets (Heidelberg and Toronto), with the highest mRNA expression in the surpatentorial location (Kruskall–Wallis test). PF = posterior fossa; spinal = spinal cord; ST = supratentorial.
In order to elucidate the molecular background of ependymoma with differential expression of nestin, we analyzed expression datasets for genes transcriptionally co‐regulated with nestin. We found n = 345 (Heidelberg) and n = 513 (Toronto) genes co‐regulated with nestin (r‐value >0.5) (Supporting Information Tables S3 and S4), of which n = 296 (85.8%) and n = 499 genes (97.3%) were positively and n = 49 (14.2%) and n = 14 (2.7%) were negatively co‐regulated (Heidelberg and Toronto datasets, respectively). The n = 104 genes from both datasets overlapped, n = 90 positively and n = 14 negatively co‐regulated, and EPHB2 was the gene most strongly co‐regulated with nestin in the overlapping set (Supporting Information Table S5).
Applying KEGG and GO annotations to both datasets separately, we determined gene sets showing both overrepresentation within the co‐regulated genes and enrichment according to nestin correlation by means of hypergeometric tests and GSEA. The gene sets found were associated with neural development (nervous system development, axon guidance), chromatin modification and transcription factor processes (NuRD complex, DNA‐dependent regulation of transcription, metal ion binding, zinc ion binding, DNA binding), the nuclear compartment (nucleus, nucleoplasm), and Ras protein signal transduction (Table 4 and Supporting Information Table S6).
Table 4.
Gene sets in the Heidelberg or Toronto dataset with significant adjusted P‐value in both hypergeometric test and gene set enrichment analysis (GSEA).
| Dataset | Gene set name | Gene set ID | Hypergeometric test P‐value | GSEA P‐value |
|---|---|---|---|---|
| Heidelberg | Nervous system development | GO:0007399 | 0.0000 | 0.0000 |
| NuRD complex | GO:0016581 | 0.0416 | 0.0000 | |
| Axon guidance | GO:0007411 | 0.0429 | 0.0000 | |
| Nucleoplasm | GO:0005654 | 0.0429 | 0.0000 | |
| Ras protein signal transduction | GO:0007265 | 0.0471 | 0.0000 | |
| Toronto | Nucleus | GO:0005634 | 0.0000 | 0.0000 |
| Metal ion binding | GO:0046872 | 0.0015 | 0.0000 | |
| Regulation of transcription, DNA dependent | GO:0006355 | 0.0039 | 0.0000 | |
| Zinc ion binding | GO:0008270 | 0.0042 | 0.0000 | |
| DNA binding | GO:0003677 | 0.0158 | 0.0000 | |
| Axon guidance | hsa04360 | 0.0158 | 0.0403 | |
| Nervous system development | GO:0007399 | 0.0415 | 0.0000 | |
| Chromatin modification | GO:0016568 | 0.0415 | 0.0000 | |
| Intracellular | GO:0005622 | 0.0415 | 0.0000 |
In summary, high nestin mRNA expression is associated with poor survival and supratentorial location, and pathway analysis indicates a co‐regulation of developmental and epigenetic processes with nestin.
DISCUSSION
We here show for the first time that nestin, a well‐established marker of neural stem and progenitor cells, is an independent marker of prognosis in intracranial ependymoma. This complements the finding that supratentorial ependymomas with a more differentiated phenotype, as defined by neurofilament light polypeptide 70 (NEFL) positivity, have a favorable prognosis (3). Our data furthermore indicate that nestin protein expression distinguishes patients with WHO II ependymoma with poor prognosis. Finally, our analysis of gene expression data indicates that nestin co‐regulated genes are involved in developmental and epigenetic processes.
The practice of histopathological grading has been controversially discussed, as differing conclusions can be reached by experienced neuropathologists when assessing the same cohort of tumors (9). Hence, the use of grading as the only neuropathologic marker used for stratification of patients is prone to incorrect classification. Although strong molecular markers for risk stratification based on chromosomal aberrations have been proposed by us and others 4, 19, 21, 29, 50, molecular analysis using FISH is not available in every neuropathology center. Most importantly, most neuropathology centers already have established staining protocols for nestin. We propose nestin as a novel biomarker detectable in paraffin‐embedded sections, using already established protocols in most centers. If our findings can be confirmed in an independent prospective setting, this would allow for improved risk stratification, possibly guiding clinical decision making in the future, for example, choice of radiation intensity during therapy, or frequency of follow‐up visits.
In summary, we suggest, that all ependymoma patients should be risk stratified using FISH as previously proposed (21) where available, and IHC for grade and nestin, as well as additional IHC for LAMA2 and NELL2 in case of posterior fossa tumors (50).
As nestin is a marker of neural stem and progenitor cells, co‐regulated pathways are likely to contain programs conferring stem cell properties to the tumor. Indeed, our analysis of genes co‐regulated with nestin mRNA showed pathways annotated with developmental and epigenetic functions. Hence it is conceivable that these pathways could contribute to an undifferentiated and more aggressive ependymoma phenotype.
Strikingly, the gene found to be most strongly co‐regulated in both datasets was EPHB2 (Supporting Information Table S5). EPHB2 has previously been shown to act as an ependymoma oncogene in murine Ink4a/Arf(–/–) neural stem cells, leading to deregulation of neural differentiation pathways (16). Indicating similar transcriptomes, we found nervous system development and axon guidance gene sets significantly co‐regulated with nestin mRNA abundance in our datasets. It is therefore possible that nestin protein expression marks EPHB2‐driven ependymomas.
Gene set analysis revealed that neural development and epigenetic regulation processes were among the most significantly co‐regulated gene sets. Furthermore, Ras signal transduction was revealed to be among the most significantly co‐regulated pathways, which has been identified as one of the pathways defining PFA ependymoma (50), possibly indicating common pathways contributing to poor prognosis in nestin positive and PFA ependymoma. As PFA tumors exhibit a largely balanced genomic profile (50) but are associated with poorer clinical outcome, mechanisms other than genetic events have to contribute to the poor clinical phenotype. It is conceivable that the chromatin remodeling and stem cell‐related processes co‐regulated with nestin contribute to the aggressive PFA behavior.
A striking number of genes involved in epigenetic processes and/or chromatin remodeling were found to be co‐regulated, such as the histone deacetylase HDAC4 and members of the nucleosome remodeling and histone deacetylase (NuRD) complex (MTA1, MTA2, RBBP4), histone methyltransferases (EZH2, EHMT2, SETDB1, WHSC1), the demethylase JMJD2A, the DNA‐methyltransferase DNMT3A, members of the nucleosome remodeling and deacetylase complex with helicase activity (CHD4, CHD5), and finally histone proteins (H1F10, H2AFY) (Supporting Information Table S6), suggesting an important role of epigenetic activity in the propagation of the aggressive nestin‐positive phenotype. It is therefore tempting to speculate that therapies including epigenetic drugs, such as HDAC inhibitors and/or demethylating agents, could be of benefit in this particular subset of patients. The use of histone deacetylase inhibitors (HDACi) in preclinical ependymoma models has shown antitumor effects 28, 33, also affecting stem cell properties in ependymoma cells (28). The NuRD complex contains HDAC1 and HDAC2 activity, and is involved in epigenetic control of maintenance of pluripotency and control of differentiation in embryonic stem cells (ESCs) 18, 56 and hematopoietic stem cells (54). As HDAC4 as well as parts of the NuRD complex are significantly co‐regulated with nestin mRNA, the use of HDACi with an inhibitory profile containing HDAC1,2 and 4 (such as vorinostat or panobinostat) (51) could possibly target specific stem cell properties in ependymoma.
In accordance with the hypothesis that activation of the Notch pathway is important for ependymoma pathogenesis (31), we were able to identify members of the Notch pathway (NOTCH1, HES4) to be co‐regulated with nestin mRNA (Supporting Information Table S6). Therefore, activation of the Notch pathway also seems to be important in nestin‐positive ependymomas. Finally, apart from components of developmental and stem cell pathways such as Notch (NOTCH1, HES4) and sonic hedgeheog (GLI2), the neural stem cell markers NR2E1/TLX and MSI1 were significantly co‐regulated with nestin mRNA (Supporting Information Table S6), indicating a stem cell phenotype of the co‐regulated transcriptome.
The cancer stem cell hypothesis postulates that cancer stem cells (CSCs) are a subpopulation of the tumor with the ability to self‐renew and drive tumor growth (5). CSCs have been described in many solid tumors including pediatric medulloblastoma, supratentorial PNET, glioblastoma and ependymoma 15, 39, 40, 44, and nestin has indeed been used to identify the CSC population (44) and the cell of origin (16) in ependymoma. Our finding that the neural stem cell marker nestin is an independent marker of poor prognosis is well in accordance with the growing evidence that application of the CSC model can indeed lead to the identification of stem cell signatures with clinical significance, as has been shown for glioblastoma 12, 52, breast cancer (37), colorectal cancer (27) and acute myeloid leukemia (10).
In summary, we have shown that (i) nestin protein expression is an independent prognostic marker for poor survival; (ii) nestin distinguishes a subset of WHO II ependymoma with poor outcome similar to the outcome of WHO III ependymoma; and (iii) nestin co‐regulated genes indicate an activation of developmental and epigenetic pathways, possibly contributing to a high‐risk stem cell‐like phenotype.
Supporting information
Figure S1. Nestin mRNA is differentially expressed in brain tumors and normal brain tissue. The database R2 was searched for nestin expression using publicly available datasets. Nestin is highly expressed in ependymoma (red) and astrocytomas and gliomas (astrocytoma, oligodendroglioma, anaplastic astrocytoma, anaplastic oligoastrocytoma, glioblastoma; blue), but not in medulloblastomas (blue). Normal adult tissue of varying brain regions (green) show low expression, while embryonal tissue shows high expression of nestin (green). Numbers following an underscore indicate the total numbers of samples in each dataset; in the second ependymoma dataset, letters following “83:” indicate the molecular subgroup; in the medulloblastoma, dataset letters following “120:” indicate the subgroup; in the embryogenesis, dataset numbers following “18:” indicate the week of human embryonic development; lca = large cell anaplastic; nd = not determined.
Figure S2. Nestin protein is differentially expressed in ependymoma of differing location and grade. While no differences in nestin‐positive and ‐negative ependymoma were found regarding gender or resection status, a significantly higher proportion of nestin‐positive ependymoma was found in all supratentorial and WHO III ependymoma. When separated by age groups, a significantly higher proportion of pediatric supratentorial, and adult WHO III ependymoma were found to be nestin positive. infra = infratentorial; supra = supratentorial; STR = subtotal resection; GTR = gross total resection; nes = nestin; pos = positive; neg = negative; n.s. = not significant; *P < 0.05, **P < 0.005, ***P < 0.0001 (Fisher's exact t‐test).
Table S1. Cox proportional hazards model for progression‐free (PFS) and overall survival (OS) estimation—univariable analysis. HR = hazard ration; CI = confidence interval.
Table S2. Five‐year progression‐free (PFS) and overall survival (OS). infra = infratentorial; supra = supratentorial; neg = negative; pos = positive; infra = infratentorial; supra = supratentorial; PFA = posterior fossa group A; PFB = posterior fossa group B.
Table S3. Genes co‐regulated (correlation coefficient >0.5) with nestin from the Heidelberg dataset, ranked by correlation coefficient.
Table S4. Genes significantly co‐regulated (correlation coefficient >0.5) with nestin from the Toronto dataset, ranked by correlation coefficient.
Table S5. Genes co‐regulated with nestin found in both datasets (Heidelberg and Toronto), ranked by correlation coefficient for each dataset and displayed according to average rank.
Table S6. Gene sets in the Heidelberg or Toronto dataset with significant adjusted P‐value in both hypergeometric test and gene set enrichtment analysis (GSEA), with genes from the respective dataset (Supporting Table S3 or S4) in alphabetical order.
Supporting info item
Supporting info item
Supporting info item
Supporting info item
Supporting info item
Supporting info item
Supporting info item
ACKNOWLEDGMENTS
We thank Diana Rieker and Andrea Wittmann for their excellent technical assistance. This study was supported by a grant from the Wilhelm Sander Foundation to TM and SMP.
Conflict of interest: The authors declare no conflict of interest.
REFERENCES
- 1. Almqvist PM, Mah R, Lendahl U, Jacobsson B, Hendson G (2002) Immunohistochemical detection of nestin in pediatric brain tumors. J Histochem Cytochem 50:147–158. [DOI] [PubMed] [Google Scholar]
- 2. Amoh Y, Li L, Campillo R, Kawahara K, Katsuoka K, Penman S, Hoffman RM (2005) Implanted hair follicle stem cells form Schwann cells that support repair of severed peripheral nerves. Proc Natl Acad Sci U S A 102:17734–17738. [DOI] [PMC free article] [PubMed] [Google Scholar]
- 3. Andreiuolo F, Puget S, Peyre M, Dantas‐Barbosa C, Boddaert N, Philippe C et al (2010) Neuronal differentiation distinguishes supratentorial and infratentorial childhood ependymomas. Neuro Oncol 12:1126–1134. [DOI] [PMC free article] [PubMed] [Google Scholar]
- 4. Carter M, Nicholson J, Ross F, Crolla J, Allibone R, Balaji V et al (2002) Genetic abnormalities detected in ependymomas by comparative genomic hybridisation. Br J Cancer 86:929–939. [DOI] [PMC free article] [PubMed] [Google Scholar]
- 5. Clarke MF, Dick JE, Dirks PB, Eaves CJ, Jamieson CH, Jones DL et al (2006) Cancer stem cells—perspectives on current status and future directions: AACR workshop on cancer stem cells. Cancer Res 66:9339–9344. [DOI] [PubMed] [Google Scholar]
- 6. Dahlstrand J, Collins VP, Lendahl U (1992) Expression of the class VI intermediate filament nestin in human central nervous system tumors. Cancer Res 52:5334–5341. [PubMed] [Google Scholar]
- 7. Duggal N, Hammond RR (2002) Nestin expression in ganglioglioma. Exp Neurol 174:89–95. [DOI] [PubMed] [Google Scholar]
- 8. Ehrmann J, Kolar Z, Mokry J (2005) Nestin as a diagnostic and prognostic marker: immunohistochemical analysis of its expression in different tumours. J Clin Pathol 58:222–223. [DOI] [PMC free article] [PubMed] [Google Scholar]
- 9. Ellison DW, Kocak M, Figarella‐Branger D, Felice G, Catherine G, Pietsch T et al (2011) Histopathological grading of pediatric ependymoma: reproducibility and clinical relevance in European trial cohorts. J Negat Results Biomed 10:7. [DOI] [PMC free article] [PubMed] [Google Scholar]
- 10. Eppert K, Takenaka K, Lechman ER, Waldron L, Nilsson B, van Galen P et al (2011) Stem cell gene expression programs influence clinical outcome in human leukemia. Nat Med 17:1086–1093. [DOI] [PubMed] [Google Scholar]
- 11. Frederiksen K, McKay RD (1988) Proliferation and differentiation of rat neuroepithelial precursor cells in vivo . J Neurosci 8:1144–1151. [DOI] [PMC free article] [PubMed] [Google Scholar]
- 12. Gaspar N, Marshall L, Perryman L, Bax DA, Little SE, Viana‐Pereira M et al (2010) MGMT‐independent temozolomide resistance in pediatric glioblastoma cells associated with a PI3‐kinase‐mediated HOX/stem cell gene signature. Cancer Res 70:9243–9252. [DOI] [PMC free article] [PubMed] [Google Scholar]
- 13. Graf E, Schmoor C, Sauerbrei W, Schumacher M (1999) Assessment and comparison of prognostic classification schemes for survival data. Stat Med 18:2529–2545. [DOI] [PubMed] [Google Scholar]
- 14. Horn B, Heideman R, Geyer R, Pollack I, Packer R, Goldwein J et al (1999) A multi‐institutional retrospective study of intracranial ependymoma in children: identification of risk factors. J Pediatr Hematol Oncol 21:203–211. [DOI] [PubMed] [Google Scholar]
- 15. Hussein D, Punjaruk W, Storer LC, Shaw L, Ottoman R, Peet A et al (2011) Pediatric brain tumor cancer stem cells: cell cycle dynamics, DNA repair, and etoposide extrusion. Neuro Oncol 13:70–83. [DOI] [PMC free article] [PubMed] [Google Scholar]
- 16. Johnson RA, Wright KD, Poppleton H, Mohankumar KM, Finkelstein D, Pounds SB et al (2010) Cross‐species genomics matches driver mutations and cell compartments to model ependymoma. Nature 466:632–636. [DOI] [PMC free article] [PubMed] [Google Scholar]
- 17. Kachinsky AM, Dominov JA, Miller JB (1994) Myogenesis and the intermediate filament protein, nestin. Dev Biol 165:216–228. [DOI] [PubMed] [Google Scholar]
- 18. Kaji K, Caballero IM, MacLeod R, Nichols J, Wilson VA, Hendrich B (2006) The NuRD component Mbd3 is required for pluripotency of embryonic stem cells. Nat Cell Biol 8:285–292. [DOI] [PubMed] [Google Scholar]
- 19. Kilday JP, Mitra B, Domerg C, Ward J, Andreiuolo F, Osteso‐Ibanez T et al (2012) Copy number gain of 1q25 predicts poor progression‐free survival for pediatric intracranial ependymomas and enables patient risk stratification: a prospective European clinical trial cohort analysis on behalf of the Children's Cancer Leukaemia Group (CCLG), Societe Francaise d'Oncologie Pediatrique (SFOP), and International Society for Pediatric Oncology (SIOP). Clin Cancer Res 18:2001–2011. [DOI] [PubMed] [Google Scholar]
- 20. Korshunov A, Golanov A, Sycheva R, Timirgaz V (2004) The histologic grade is a main prognostic factor for patients with intracranial ependymomas treated in the microneurosurgical era: an analysis of 258 patients. Cancer 100:1230–1237. [DOI] [PubMed] [Google Scholar]
- 21. Korshunov A, Witt H, Hielscher T, Benner A, Remke M, Ryzhova M et al (2010) Molecular staging of intracranial ependymoma in children and adults. J Clin Oncol 28:3182–3190. [DOI] [PubMed] [Google Scholar]
- 22. Lendahl U, Zimmerman LB, McKay RD (1990) CNS stem cells express a new class of intermediate filament protein. Cell 60:585–595. [DOI] [PubMed] [Google Scholar]
- 23. Louis DN, Ohgaki H, Wiestler OD, Cavenee WK, Burger PC, Jouvet A et al (2007) The 2007 WHO classification of tumours of the central nervous system. Acta Neuropathol 114:97–109. [DOI] [PMC free article] [PubMed] [Google Scholar]
- 24. Ma YH, Mentlein R, Knerlich F, Kruse ML, Mehdorn HM, Held‐Feindt J (2008) Expression of stem cell markers in human astrocytomas of different WHO grades. J Neurooncol 86:31–45. [DOI] [PubMed] [Google Scholar]
- 25. Malatesta P, Hartfuss E, Gotz M (2000) Isolation of radial glial cells by fluorescent‐activated cell sorting reveals a neuronal lineage. Development 127:5253–5263. [DOI] [PubMed] [Google Scholar]
- 26. McLendon RE, Fung KM, Bentley RC, Ahmed Rasheed BK, Trojanowski JQ, Bigner SH et al (1996) Production and characterization of two ependymoma xenografts. J Neuropathol Exp Neurol 55:540–548. [DOI] [PubMed] [Google Scholar]
- 27. Merlos‐Suarez A, Barriga FM, Jung P, Iglesias M, Cespedes MV, Rossell D et al (2011) The intestinal stem cell signature identifies colorectal cancer stem cells and predicts disease relapse. Cell Stem Cell 8:511–524. [DOI] [PubMed] [Google Scholar]
- 28. Milde T, Kleber S, Korshunov A, Witt H, Hielscher T, Koch P et al (2011) A novel human high‐risk ependymoma stem cell model reveals the differentiation‐inducing potential of the histone deacetylase inhibitor Vorinostat. Acta Neuropathol 122:637–650. [DOI] [PMC free article] [PubMed] [Google Scholar]
- 29. Monoranu CM, Huang B, Zangen IL, Rutkowski S, Vince GH, Gerber NU et al (2008) Correlation between 6q25.3 deletion status and survival in pediatric intracranial ependymomas. Cancer Genet Cytogenet 182:18–26. [DOI] [PubMed] [Google Scholar]
- 30. Piras F, Perra MT, Murtas D, Minerba L, Floris C, Maxia C et al (2010) The stem cell marker nestin predicts poor prognosis in human melanoma. Oncol Rep 23:17–24. [PubMed] [Google Scholar]
- 31. Puget S, Grill J, Valent A, Bieche I, Dantas‐Barbosa C, Kauffmann A et al (2009) Candidate genes on chromosome 9q33‐34 involved in the progression of childhood ependymomas. J Clin Oncol 27:1884–1892. [DOI] [PubMed] [Google Scholar]
- 32. R Development Core Team (2011) R: A Language and Environment for Statistical Computing. R Foundation for Statistical Computing: Vienna, Austria. [Google Scholar]
- 33. Rahman R, Osteso‐Ibanez T, Hirst RA, Levesley J, Kilday JP, Quinn S et al (2010) Histone deacetylase inhibition attenuates cell growth with associated telomerase inhibition in high‐grade childhood brain tumor cells. Mol Cancer Ther 9:2568–2581. [DOI] [PubMed] [Google Scholar]
- 34. Ryuge S, Sato Y, Wang GQ, Matsumoto T, Jiang SX, Katono K et al (2011) Prognostic significance of nestin expression in resected non‐small cell lung cancer. Chest 139:862–869. [DOI] [PubMed] [Google Scholar]
- 35. Schemper M, Smith TL (1996) A note on quantifying follow‐up in studies of failure time. Control Clin Trials 17:343–346. [DOI] [PubMed] [Google Scholar]
- 36. Schiffer D, Manazza A, Tamagno I (2006) Nestin expression in neuroepithelial tumors. Neurosci Lett 400:80–85. [DOI] [PubMed] [Google Scholar]
- 37. Shats I, Gatza ML, Chang JT, Mori S, Wang J, Rich JN, Nevins J (2011) Using a stem cell‐based signature to guide therapeutic selection in cancer. Cancer Res 71:1772–1780. [DOI] [PMC free article] [PubMed] [Google Scholar]
- 38. Shu HK, Sall WF, Maity A, Tochner ZA, Janss AJ, Belasco JB et al (2007) Childhood intracranial ependymoma: twenty‐year experience from a single institution. Cancer 110:432–441. [DOI] [PubMed] [Google Scholar]
- 39. Singh SK, Clarke ID, Terasaki M, Bonn VE, Hawkins C, Squire J, Dirks PB (2003) Identification of a cancer stem cell in human brain tumors. Cancer Res 63:5821–5828. [PubMed] [Google Scholar]
- 40. Singh SK, Hawkins C, Clarke ID, Squire JA, Bayani J, Hide T et al (2004) Identification of human brain tumour initiating cells. Nature 432:396–401. [DOI] [PubMed] [Google Scholar]
- 41. Subramanian A, Tamayo P, Mootha VK, Mukherjee S, Ebert BL, Gillette MA et al (2005) Gene set enrichment analysis: a knowledge‐based approach for interpreting genome‐wide expression profiles. Proc Natl Acad Sci U S A 102:15545–15550. [DOI] [PMC free article] [PubMed] [Google Scholar]
- 42. Suzuki R, Shimodaira H (2006) Pvclust: an R package for assessing the uncertainty in hierarchical clustering. Bioinformatics 22:1540–1542. [DOI] [PubMed] [Google Scholar]
- 43. Tanabe K, Amoh Y, Kanoh M, Takasu H, Sakai N, Sato Y, Katsuoka K (2010) Prognostic significance of the hair follicle stem cell marker nestin in patients with malignant melanoma. Eur J Dermatol 20:283–288. [DOI] [PubMed] [Google Scholar]
- 44. Taylor MD, Poppleton H, Fuller C, Su X, Liu Y, Jensen P et al (2005) Radial glia cells are candidate stem cells of ependymoma. Cancer Cell 8:323–335. [DOI] [PubMed] [Google Scholar]
- 45. Terling C, Rass A, Mitsiadis TA, Fried K, Lendahl U, Wroblewski J (1995) Expression of the intermediate filament nestin during rodent tooth development. Int J Dev Biol 39:947–956. [PubMed] [Google Scholar]
- 46. Tihan T, Zhou T, Holmes E, Burger PC, Ozuysal S, Rushing EJ (2008) The prognostic value of histological grading of posterior fossa ependymomas in children: a Children's Oncology Group study and a review of prognostic factors. Mod Pathol 21:165–177. [DOI] [PubMed] [Google Scholar]
- 47. Tohyama T, Lee VM, Rorke LB, Marvin M, McKay RD, Trojanowski JQ (1992) Nestin expression in embryonic human neuroepithelium and in human neuroepithelial tumor cells. Lab Invest 66:303–313. [PubMed] [Google Scholar]
- 48. van de Wiel MA, Berkhof J, van Wieringen WN (2009) Testing the prediction error difference between 2 predictors. Biostatistics 10:550–560. [DOI] [PubMed] [Google Scholar]
- 49. Wang X, Terfve C, Rose JC, Markowetz F (2011) HTSanalyzeR: an R/Bioconductor package for integrated network analysis of high‐throughput screens. Bioinformatics 27:879–880. [DOI] [PMC free article] [PubMed] [Google Scholar]
- 50. Witt H, Mack SC, Ryzhova M, Bender S, Sill M, Isserlin R et al (2011) Delineation of two clinically and molecularly distinct subgroups of posterior fossa ependymoma. Cancer Cell 20:143–157. [DOI] [PMC free article] [PubMed] [Google Scholar]
- 51. Witt O, Deubzer HE, Milde T, Oehme I (2009) HDAC family: what are the cancer relevant targets? Cancer Lett 277:8–21. [DOI] [PubMed] [Google Scholar]
- 52. Yan X, Ma L, Yi D, Yoon JG, Diercks A, Foltz G et al (2011) A CD133‐related gene expression signature identifies an aggressive glioblastoma subtype with excessive mutations. Proc Natl Acad Sci U S A 108:1591–1596. [DOI] [PMC free article] [PubMed] [Google Scholar]
- 53. Yang XH, Wu QL, Yu XB, Xu CX, Ma BF, Zhang XM et al (2008) Nestin expression in different tumours and its relevance to malignant grade. J Clin Pathol 61:467–473. [DOI] [PubMed] [Google Scholar]
- 54. Yoshida T, Hazan I, Zhang J, Ng SY, Naito T, Snippert HJ et al (2008) The role of the chromatin remodeler Mi‐2beta in hematopoietic stem cell self‐renewal and multilineage differentiation. Genes Dev 22:1174–1189. [DOI] [PMC free article] [PubMed] [Google Scholar]
- 55. Zhang M, Song T, Yang L, Chen R, Wu L, Yang Z, Fang J (2008) Nestin and CD133: valuable stem cell‐specific markers for determining clinical outcome of glioma patients. J Exp Clin Cancer Res 27:85. [DOI] [PMC free article] [PubMed] [Google Scholar]
- 56. Zhu D, Fang J, Li Y, Zhang J (2009) Mbd3, a component of NuRD/Mi‐2 complex, helps maintain pluripotency of mouse embryonic stem cells by repressing trophectoderm differentiation. PLoS ONE 4:e7684. [DOI] [PMC free article] [PubMed] [Google Scholar]
Associated Data
This section collects any data citations, data availability statements, or supplementary materials included in this article.
Supplementary Materials
Figure S1. Nestin mRNA is differentially expressed in brain tumors and normal brain tissue. The database R2 was searched for nestin expression using publicly available datasets. Nestin is highly expressed in ependymoma (red) and astrocytomas and gliomas (astrocytoma, oligodendroglioma, anaplastic astrocytoma, anaplastic oligoastrocytoma, glioblastoma; blue), but not in medulloblastomas (blue). Normal adult tissue of varying brain regions (green) show low expression, while embryonal tissue shows high expression of nestin (green). Numbers following an underscore indicate the total numbers of samples in each dataset; in the second ependymoma dataset, letters following “83:” indicate the molecular subgroup; in the medulloblastoma, dataset letters following “120:” indicate the subgroup; in the embryogenesis, dataset numbers following “18:” indicate the week of human embryonic development; lca = large cell anaplastic; nd = not determined.
Figure S2. Nestin protein is differentially expressed in ependymoma of differing location and grade. While no differences in nestin‐positive and ‐negative ependymoma were found regarding gender or resection status, a significantly higher proportion of nestin‐positive ependymoma was found in all supratentorial and WHO III ependymoma. When separated by age groups, a significantly higher proportion of pediatric supratentorial, and adult WHO III ependymoma were found to be nestin positive. infra = infratentorial; supra = supratentorial; STR = subtotal resection; GTR = gross total resection; nes = nestin; pos = positive; neg = negative; n.s. = not significant; *P < 0.05, **P < 0.005, ***P < 0.0001 (Fisher's exact t‐test).
Table S1. Cox proportional hazards model for progression‐free (PFS) and overall survival (OS) estimation—univariable analysis. HR = hazard ration; CI = confidence interval.
Table S2. Five‐year progression‐free (PFS) and overall survival (OS). infra = infratentorial; supra = supratentorial; neg = negative; pos = positive; infra = infratentorial; supra = supratentorial; PFA = posterior fossa group A; PFB = posterior fossa group B.
Table S3. Genes co‐regulated (correlation coefficient >0.5) with nestin from the Heidelberg dataset, ranked by correlation coefficient.
Table S4. Genes significantly co‐regulated (correlation coefficient >0.5) with nestin from the Toronto dataset, ranked by correlation coefficient.
Table S5. Genes co‐regulated with nestin found in both datasets (Heidelberg and Toronto), ranked by correlation coefficient for each dataset and displayed according to average rank.
Table S6. Gene sets in the Heidelberg or Toronto dataset with significant adjusted P‐value in both hypergeometric test and gene set enrichtment analysis (GSEA), with genes from the respective dataset (Supporting Table S3 or S4) in alphabetical order.
Supporting info item
Supporting info item
Supporting info item
Supporting info item
Supporting info item
Supporting info item
Supporting info item