

Abstract
Double‐transgenic amyloid precursor protein/presenilin 1 (APP/PS1) mice express a chimeric mouse/human APP bearing the Swedish mutation (Mo/HuAPP695swe) and a mutant human PS1‐dE9 both causative of familial Alzheimer's disease (FAD). Transgenic mice show impaired memory and learning performance from the age of 6 months onwards. Double‐transgenic APP/PS1 mice express altered APP and PS1 mRNAs and proteins, reduced β‐secretase 1 (BACE1) mRNA and normal BACE1 protein, all of which suggest a particular mechanism of amyloidogenesis when compared with sporadic AD. The first β‐amyloid plaques in APP/PS1 mice appear at 3 months, and they increase in number and distribution with disease progression in parallel with increased levels of brain soluble β‐amyloid 1–42 and 1–40, but also with reduced 1–42/1–40 ratio with age. Amyloid deposition in plaques is accompanied by altered mitochondria and increased oxidative damage, post‐translational modifications and accumulation of altered proteins at the dystrophic neurites surrounding plaques. Degradation pathways are also modified with disease progression including activation of the immunoproteasome together with variable alterations of the different protease activities of the ubiquitin‐proteasome system. Present observations show modifications in the production of β‐amyloid and activation and malfunction of the subcellular degradation pathways that have general implications in the pathogenesis of AD and more particularly in specificities of FAD amyloidogenesis.
Keywords: Alzheimer's disease, APP/PS1 transgenic mice, mitochondria, oxidative stress, synapses, tau phosphorylation, ubiquitin‐proteasome system, α‐synuclein, β‐amyloid
INTRODUCTION
Alzheimer's disease (AD) is an age‐related neurodegenerative disorder characterized by gradual onset and progression of memory loss combined with deficits in executive functioning, language, visuospatial abilities, personality and behavior. The progression of the disease has been related to the succession of certain morphological and molecular alterations in particular brain areas (6). The two pathological hallmarks of AD are β‐amyloid deposits in the brain parenchyma in the form of β‐amyloid plaques and in blood vessels as β‐amyloid angiopathy, and intraneuronal deposition of hyper‐phosphorylated tau comprising neurofibrillary tangles, neuropil threads and components of dystrophic neurites surrounding β‐amyloid deposits in plaques (25). β‐amyloid originates in the proteolysis of the amyloid precursor protein (APP) by the sequential enzymatic actions of β‐ and γ‐secretases in which presenilin 1 (PS1) at its catalytic core plays a pivotal role (56). β‐amyloid spontaneously self‐aggregates into multiple forms including oligomers, fibrils and insoluble fibers (65). The majority of cases with AD are sporadic (SAD), and they manifest neurological impairment in old age. However, 1%–6% are familial and clinical manifestations that appear earlier. Mutations in APP and PS1 are causative of early onset familial AD (FAD) (2).
Several transgenic mice expressing human APP and PS1 mutations have been generated to increase mechanistic understanding of AD (68). Double‐transgenic APP/PS1 mice express a chimeric mouse/human APP (Mo/HuAPP695swe: APP Swedish mutation) and a mutant human PS1‐dE9, both directed to central nervous system neurons (4). The included Swedish mutation (K595N/M596L) elevates the amount of β‐amyloid, and the mutant PS1 allele accelerates the β‐amyloid deposition rate as well as exacerbating pathological severity. APP/PS1 mice develop β‐amyloid deposits throughout the brain and exhibit memory impairment earlier than single APP transgenic littermates (54).
FAD is not a common disorder and examination of the brain of afflicted persons at preclinical and early clinical stages of the disease is not easy because of the limited number of cases in brain banks. The sequential study of particular parameters in APP/PS1 transgenic mice is an invaluable tool, at present, to unveil mechanistic aspects of disease progression in FAD.
The present study is geared to provide evidence about the coexistence and convergence of several alterations that appear with disease progression in APP/PS1 transgenic mice. Particular attention has been paid to analyzing changes with age: (i) in the expression of APP, PS1 and β‐secretase (BACE) mRNAs and proteins as key players of amyloid production, as well as modifications with time in the ratio of β‐amyloid species; (ii) in the mitochondrial alterations in neuronal processes associated with amyloid deposition in amyloid plaques; (iii) in the expression and abnormal deposition of proteins mainly associated with dystrophic neurites; and (iv) in the study of the characteristics and functions of the ubiquitin‐proteasome system (UPS) as a crucial mechanism for removing altered proteins.
Present findings support the idea that several alterations are common to AD and APP/PS1 transgenic mice, whereas others are not. Among the first, there are progressive accumulation of β‐amyloid plaques with age, altered mitochondria and accumulation of abnormal proteins mainly in dystrophic neurites surrounding β‐amyloid plaques. Among the latter, differences are not only related to the lack of neurofibrillary tangles in mice but also to the differing modulation of amyloidogenesis.
MATERIALS AND METHODS
Animals
The experiments were carried out on APP/PS1 mice and wild‐type (WT) littermates. The generation of mice expressing the human mutated forms APPswe and PS1dE9 has already been described (4). Briefly, APP/PS1 mice were developed by co‐injection of the two transgene constructs [Mo/Hu “humanized” chimeric APP695 harboring the Swedish (K594M/N595L) mutation and exon‐9‐deleted PS1] delivered by mouse prion promoter into pronuclei with a single genomic insertion site, resulting in the two transgenes being transmitted as a single mendelian locus. In order to homogenize the genetic background of mice, the first heterozygous generation was bred for at least 15 generations on a C57BL6J background, with selection for the double mutant transgenes at each generation. After the 15th generation of backcross, heterozygote/WT mating produced WT and double‐transgenic APP/PS1 littermates for subsequent experiments. In the present study, identification of transgenic mice was carried out as follows: genomic DNA was isolated from 1‐cm tail clips and genotyped by polymerase chain reaction (PCR) technique using the PCR conditions proposed by Jackson Laboratory. Animals were maintained under standard animal housing conditions in a 12‐h dark–light cycle with free access to food and water. Animal procedures were conducted according to ethical guidelines (European Communities Council Directive 86/609/EEC) and approved by the local ethics committee [University of Barcelona‐Institut d'Investigació Biomèdica de Bellvitge (IDIBELL)].
Cognitive performance
Memory: two‐object recognition test
The two‐object recognition tests consisted in placing the animal in a V‐maze (Panlab, Barcelona, Spain) containing two identical objects at the end of the arms and allowing the mouse to freely explore the apparatus for 9 minutes. Then, 24 h after the training session, the animal was again placed in the V‐maze where one of the two familiar objects had been replaced by a novel object. The time that the animal spent exploring the two objects was recorded and an object recognition index was calculated by comparing the exploration time of the familiar and the novel objects during the test. Animals exhibiting memory impairments revealed a decreased object recognition index.
Learning: active avoidance procedure
Mice were trained to avoid an aversive stimulus associated with the presentation of a conditioned stimulus (CS) in a two‐way shuttle box apparatus (Panlab). The apparatus consists of a box with two compartments (20 × 10 cm) connected by a 3 × 3‐cm door. A light (10 W) switched on in the compartment in which the mouse was placed was used as a CS. The CS is received 5 s before the onset of the unconditioned stimulus (US) and overlaps it for 25 s. In this procedure, the light was presented in the compartment for 30 s (5 s alone and 25 s together with the US). At the end of the 30‐s period, both CS and US were automatically turned off. The US was an electric shock (0.2 mA) continuously applied to the grid of the floor. A conditioned response was recorded when the animal avoided the US by changing from the compartment where the animal received the CS into the opposite compartment within 5 s after the onset of the CS. If animals failed to avoid the shock, they could escape it by crossing during the US (25 s), and this was recorded as unconditioned response. Between each trial session, there was an inter‐trial interval of 30 s. The ratio of conditioned responses with respect to the total number of changes of compartment during the whole session was determined. Animals were subjected to five daily 100‐trial active avoidance sessions. Each day, the mice were placed in the shuttle box for 10 minutes before the start of each session to allow them to explore the box and to become accustomed to the apparatus. Both tests were performed in animals aged 3, 6, 9 and 12/14 months. At least six animals were used per group.
Statistical analysis
The memory and learning performance data were analyzed by two‐way analysis of variance (ANOVA) with genotype and age as between factors, followed by one‐way ANOVA and Tukey's post hoc or Student's t‐test when required. In all the experiments, the significance level was set at P < 0.05.
APP, PS1 and BACE mRNA expression
RNA purification
APP/PS1 and WT male mice aged 3 and 12 months (n = 5 per time point) were used in the study. The purification of RNA from mouse neocortex was carried out with RNeasy Lipid Tissue Mini Kit (Qiagen GmbH, Hilden, Germany) following the protocol provided by the manufacturer. The concentration of each sample was obtained from A260 measurements with Nanodrop 1000 (Thermo Scientific, Wilmington, DE, USA). RNA integrity was tested using the Agilent 2100 BioAnalyzer (Agilent Technologies, Palo Alto, CA, USA).
Retrotranscription reaction
The retrotranscriptase reaction was carried out using the High‐Capacity cDNA Archive kit (Applied Biosystems, Foster City, CA, USA) following the protocol provided by the supplier. Parallel reactions for each RNA sample were run in the absence of MultiScribe Reverse Transcriptase (Applied Biosystems) to assess the degree of contaminating genomic DNA.
TaqMan PCR
TaqMan PCR assays for every gene were performed in duplicate on cDNA samples in 384‐well optical plates using an ABI Prism 7900 Sequence Detection system (Applied Biosystems). For each 20 µL TaqMan reaction, 9 µL cDNA was mixed with 1 µL 20x TaqMan Gene Expression Assays and 10 µL of 2x TaqMan Universal PCR Master Mix (Applied Biosystems). Parallel assays for each sample were carried out using primers and probe for β‐glucuronidase (GUSB) for normalization. The reactions were carried out using the following parameters: 50°C for 2 minutes, 95°C for 10 minutes and 40 cycles of 95°C for 15 s and 60°C for 1 minute. Finally, all TaqMan PCR data were captured using the Sequence Detection Software (SDS version 1.9, Applied Biosystems). The identification numbers for BACE, APP and PS1 TaqMan probes were Mm00478664_m1, Mm01344172_m1 and Mm00501184, respectively (Applied Biosystems).
Samples were analyzed with the double delta cycle threshold (ΔΔCT) method. ΔCT values represent normalized target gene levels with respect to the internal control (GUSB). ΔΔCT values were calculated as the ΔCT of each test sample minus the mean ΔCT of the calibrator samples (WT aged 3 months) for each target gene. The fold change was calculated using the equation 2(−ΔΔCT). Results were analyzed by two‐way ANOVA with genotype and age as between factors, followed by Student's t‐test when required. Differences between mean values were considered statistically significant at P < 0.05.
Neuropathological studies
Immunohistochemistry
WT and APP/PS1 mice aged 3, 6, 9, 12/14 and 18 months (n = 4–5 per time point) were deeply anaesthetized by intraperitoneal (i.p.) injection (0.2 mL/10 g body weight) with a mixture of ketamine (100 mg/kg) and xylazine (20 mg/kg) prior to intracardiac perfusion of 4% paraformaldehyde delivered with a peristaltic pump at 19 mL/minute for 5 minutes. Brains were removed and post‐fixed overnight at 4°C in the same fixative solution. Tissue samples were embedded in paraffin and coronal sections (4 µm) were cut with a microtome. De‐waxed sections were boiled in citrate buffer (20 minutes) to enhance antigenicity. Sections for β‐amyloid immunohistochemistry were additionally incubated with 98% formic acid (3 minutes). Then, the endogenous peroxidases were blocked by incubation in 10% methanol to 1% H2O2 solution (15 minutes). Sections were blocked with 3% normal horse serum solution and then incubated at 4°C overnight with the primary antibodies against β‐amyloid (Clone 6F/3D), AT8, mitochondrial porin, superoxide dismutase 1 (SOD1), glial fibrillary acidic protein (GFAP), phospho‐specific stress activated protein kinase/cJun N‐terminal kinase (SAPK/JNK) (Thr183/Tyr185), phospho‐specific p38 (Thr180/Tr182), ubiquitin, β‐secretase 1, voltage‐dependent anion channel (VDAC) and Lycopericum esculentum lectin (see Table 1 for details).
Table 1.
Characteristics of the primary antibodies used in this study
| Primary antibody | Host | Source | Working dilution | |||
|---|---|---|---|---|---|---|
| IHC | IF | IEM | WB | |||
| 19S S1 | Rabbit polyclonal | Affinity Bioreagents (US) | 1:1000 | |||
| APP (C‐terminal) | Rabbit polyclonal | Serotec (DE) | 1:50 | 1:1000 | ||
| α‐Synuclein | Rabbit polyclonal | Chemicon (US) | 1:3000 | |||
| AT8 | Mouse monoclonal | Innogenetics (BE) | 1:50 | |||
| BACE1 | Rabbit polyclonal | Millipore (US) | 1:50 | 1:500 | ||
| GFAP | Rabbit polyclonal | Dako (DK) | 1:250 | |||
| HNE | Rabbit polyclonal | Calbiochem (DE) | 1:1000 | |||
| LMP2 | Mouse monoclonal | Enzo (US) | 1:1000 | |||
| Lycopericum esculentum lectin | Sigma (US) | 1:100 | ||||
| MECL‐1 | Rabbit polyclonal | Biomol International (GB) | 1:1000 | |||
| Mitochondrial porin | Rabbit polyclonal | Abcam (GB) | 1:2000 | 1:2000 | 1:100 | |
| Neuroketal | Goat polyclonal | Chemicon (US) | 1:200 | 1:200 | ||
| PA28α | Rabbit polyclonal | Enzo (US) | 1:1000 | |||
| Phospho‐specific α‐synuclein (Ser129) | Mouse monoclonal | Wako (JP) | 1:2000 | |||
| Phospho‐specific p38 (Thr180/Tr182) | Rabbit polyclonal | Calbiochem (DE) | 1:100 | 1:100 | ||
| Phospho‐specific SAPK/JNK (Thr183/Tyr185) | Rabbit polyclonal | Cell signaling (US) | 1:50 | |||
| PS1 | Rabbit polyclonal | Sigma (US) | 1:5000 | |||
| Rab 3a | Rabbit polyclonal | Santa Cruz (US) | 1:50 | |||
| SOD1 | Mouse monoclonal | Novocastra (GB) | 1:1000 | |||
| Ubiquitin | Rabbit polyclonal | Dako (DK) | 1:500 | |||
| UCHL‐1 | Rabbit polyclonal | Abcam (GB) | 1:1000 | |||
| VDAC | Mouse monoclonal | Calbiochem (DE) | 1:100 | 1:100 | ||
| β5 | Rabbit polyclonal | Abcam (GB) | 1:1000 | |||
| β‐Actin | Mouse monoclonal | Sigma (US) | 1:30 000 | |||
| β‐amyloid clone 6F/3D | Mouse monoclonal | Dako (DK) | 1:50 | 1:50 | 1:50 | |
IHC = Immunohistochemistry; IF = Immunofluorescence; IEM = Immunoelectronmicroscopy; WB = Western blotting.
Sections were subsequently rinsed and incubated with biotinylated secondary antibody (Dako, Glostrup, Denmark), followed by EnVision+ System Peroxidase (Dako) and finally with the chromogen diaminobenzidine or nickel and H2O2. Some sections were incubated without the primary antibodies. No immunostaining was detected in these sections. Sections were lightly counterstained with hematoxylin. After staining, the sections were dehydrated and cover‐slipped for microscopic observation. The β‐amyloid burden was quantified using the software Adobe® Photoshop® CS4 (Adobe Systems, San Jose, CA, USA).
Double‐labeling immunofluorescence and confocal microscopy
De‐waxed sections were stained with a saturated solution of Sudan Black B (Merck, Darmstadt, Germany) for 15 minutes to block the autofluorescence of lipofuscin granules present in cell bodies and then rinsed in 70% ethanol and washed in distilled water. The sections were boiled in citrate buffer to enhance antigenicity, excepting sections for hydroxinonenal (HNE) immunohistochemistry that were treated with a 0.04% borohydride solution (20 minutes) and then incubated at 4°C overnight with combinations of primary antibodies against β‐amyloid, VDAC, AT8, HNE, neuroketal, phospho‐specific p38 (Thr180/Tr182), α‐synuclein, phospho‐specific α‐synuclein (Ser129), Rab 3a and APP (C‐terminal) (see Table 1 for details). After washing, the sections were incubated with Alexa488 or Alexa546 (1:400, Molecular Probes, Eugene, OR, USA) fluorescence secondary antibodies against the corresponding host species. Nuclei were stained with DRAQ5TM (1:2000, Biostatus, Leicestershire, UK). After washing, the sections were mounted in Immuno‐Fluore Mounting Medium (ICN Biomedicals, Costa Mesa, CA, USA), sealed and dried overnight. Sections were examined with a Leica TCS‐SL (Leica Microsystems, Wetzlar, Germany) confocal microscope.
Transmission electron microscopy and immunoelectron microscopy
WT and APP/PS1 transgenic mice aged 6 and 9 months were deeply anaesthetized prior to intracardiac perfusion of 4% paraformaldehyde to 0.1% glutaraldehyde. Brains were removed, dissected and then post‐fixed by immersion in 1% osmium tetraoxide. Tissue specimens were embedded in Epon‐812 (Electron Microscopy Sciences, Fort Washington, PA, USA) and cut with an ultramicrotome. Semithin sections of the hippocampus, entorhinal cortex and neocortex were stained with toluidine blue, and selected ultrathin sections were stained with uranyl acetate and lead citrate.
For immunoelectronmicroscopy, selected ultrathin sections (70 nm) were subjected to an etching treatment (10% hydrogen peroxide for 5 minutes and 1% periodic acid for 10 minutes) to expose hidden antigenic sites. Ultrathin sections were incubated in a blocking‐ and quenching‐free aldehyde solution (0.1 M PBS, pH 7.4, containing 1% BSA and 20 mM glycine) prior to incubation with the primary antibodies against β‐amyloid or VDAC diluted in 0.1 M PBS containing 1% BSA and 20nM glycine (see Table 1 for details). After washing, the sections were incubated in gold‐conjugated secondary antibody (Agar, Monocomp, Spain) and directly visualized with a Jeol Jem 1011 (Jeol Ltd, Tokyo, Japan) electron microscope.
Quantification of soluble β‐amyloid
Frozen samples of the neocortex of APP/PS1 mice aged 3, 6 and 12 months and corresponding age‐matched controls were homogenized in tris‐buffered saline (TBS) buffer [(140 mM NaCl, 3 mM KCl, 25 mM Tris‐HCl pH 7.4 and 5 mM ethylenediaminetetraacetic acid (EDTA)] with a cocktail of protease inhibitors (Roche Molecular Systems, Pleasanton, CA, USA) and ultracentrifuged at 100 000 g for 1 h at 4°C. The protein of the supernatant was measured with bicinchoninic acid (BCA) and stored at −80°C until use. The detection and measurement of β‐amyloid 1–40 and β‐amyloid 1–42 was carried out by enzyme‐linked immunoabsorbent assay (ELISA) with the corresponding detection kits (Invitrogen, Carlsbad, CA, USA), following the instructions of the supplier and after optimizing the reaction with increasing amounts of known concentrations of β‐amyloid 1–40 and β‐amyloid 1–42. A ratio of the β‐amyloid 1–42 levels with respect to those of β‐amyloid 1–40 was calculated. Data were analyzed by one‐way ANOVA with age as between factor, followed by Tukey's post hoc test when required, and the significance level was set at P < 0.05.
Gel electrophoresis and Western blotting
For Western blot, 3‐, 6‐, 9‐ and 12‐month‐old animals (three APP/PS1 from different litters and three WT littermates) were killed by decapitation. Brains were quickly removed, dissected and stored at −80°C until use.
The neocortex was homogenized in radioimmunoprecipitation assay buffer lysis buffer (50 mM Tris/HCl buffer, pH 7.4 containing 2 mM EDTA, 0.2% Nonidet P‐40, 1 mM PMSF, protease and phosphatase inhibitor cocktails, Roche Molecular Systems, Alameda, CA, USA). The homogenates were centrifuged for 15 minutes at 13 000 rpm. Protein concentration was determined by BCA method (Thermo Scientific, US). Equal amounts of protein (20 µg) for each sample were loaded and separated by electrophoresis on sodium dodecyl sulfate polyacrylamide gel electrophoresis (SDS‐PAGE) (10%–12%) gels and transferred onto nitrocellulose membranes (Amersham, GE Healthcare, Buckinghamshire, UK). Non‐specific bindings were blocked by incubation in 5% albumin in PBS containing 0.2% Tween for 1 h at room temperature. After washing, membranes were incubated overnight at 4°C with the following antibodies in PBS containing 5% albumin and 0.2% Tween: APP C‐terminal, PS1, BACE, proteasome 20S subunit β1i LMP2, proteasome 20S subunit β2i MECL‐1, proteasome activator 11S α subunit PA28, proteasome 20S subunit β5 PSMB5, proteosome 19S subunit 1 and UCHL1 (PGP9.5) (see Table 1 for details). Protein loading was monitored using a mouse monoclonal antibody against β‐actin. Membranes were then incubated for 1 h in the appropriate HRP conjugated secondary antibodies (1:2000; Dako) and immunocomplexes were revealed by enhanced chemiluminescence reagent (ECL, Amersham).
Densitometric quantification was carried out with TotalLab v2.01 software (Pharmacia, Uppsala, Sweden). Bands were normalized to β‐actin levels. The data were analyzed by two‐way ANOVA with genotype and age as between factors, followed by one‐way ANOVA and Tukey's post hoc or Student's t‐test when required. In all the experiments, the significance level was set at P < 0.05.
Proteasome activity assays
Assays for chymotrypsin‐like activity, trypsin‐like activity and the peptidyl‐glutamyl peptide hydrolase activity (PGPH) of proteasome 26S were performed using fluorogenic Suc‐LLVY‐AMC, Boc‐LSTA‐AMC and Z‐LLG‐AMC (Sigma, Chemical Co., St. Louis, MO, USA), respectively as substrates. The samples (three WT and three APP/PS1 of 6 and 12/14 months per time point) were placed on ice and homogenized in proteolysis activity buffer [10 mM Tris/HCL, pH 7.8 containing 0.5 mM dithiothreiol (DTT), 5 mM ATP, 5 mM MgCl2]. The homogenates were centrifuged for 10 minutes at 13 000 rpm, 4°C. Protein determination was made on the supernatants with the BCA method (Thermo Scientific, Rockford, IL, USA), and the aliquots were prepared at the concentration of 200 µg of protein per 200 µL of sample. The aliquots were incubated at 37°C with 2 µL of the fluorogenic substrate. All assays were carried out in a 96‐well black assay plate with a clear bottom, and the activity was determined as the increase in fluorescence of the reaction products monitored at 360 nm excitation and 460 nm emission for 3 h (27). Data were analyzed by two‐way ANOVA with genotype and age as between factors, followed by Student's t‐test when required. In all the experiments, the significance level was set at P < 0.05.
RESULTS
Cognitive impairment in APP/PS1 mice
Exposure to the two‐object recognition test demonstrated memory impairment in APP/PS1 mice from 6 months old on (Figure 1A). Two‐way ANOVA revealed a significant genotype effect [F (1, 26) = 42.57, P < 0.001], effect of age [F (3, 26) = 6.78, P < 0.01] and interaction between these two factors [F (3, 26) = 3.63, P < 0.05]. Subsequent one‐way ANOVA revealed a significant age effect in WT [F (3, 13) = 4.23, P < 0.05] and APP/PS1 mice [F (3, 13) = 6.25, P < 0.01]. Tukey's post hoc test showed a significant reduction in the recognition index of WT at 12 months when compared with WT aged 6 months (P < 0.05) and in APP/PS1 mice at 6, 9 and 12 months when compared with APP/PS1 aged 3 months (P < 0.05), respectively. Student's t‐test indicated a reduction in the recognition index of APP/PS1 mice at 6 [t (6) = 7.09, P < 0.001], 9 [t (6) = 4.10, P < 0.01] and 12 months [t (5) = 2.91, P < 0.05] when compared with the correspondingly aged WT animals. No differences between APP/PS1 and control mice were seen at the age of 3 months.
Figure 1.
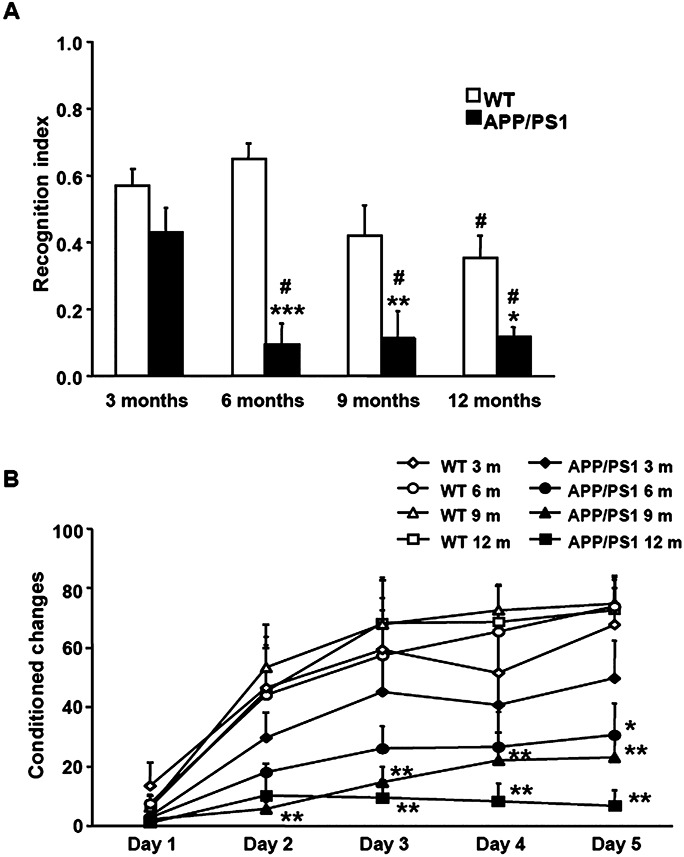
A. Memory performance in the V‐maze shows significant differences between APP/PS1 mice and corresponding WT from the age of 6 months onwards. Student's t‐test shows a reduction in the recognition index of APP/PS1 mice at 6, 9 and 12/14 months when compared with the corresponding WT littermates. B. Active avoidance test shows a decrease in the learning performance in APP/PS1 mice when compared with age‐matched WT littermates. Student's t‐test shows a reduction in the conditioned changes of APP/PS1 mice at 6, 9 and 12 months when compared with the corresponding age controls. *P < 0.05, **P < 0.01, ***P < 0.001 compared with age‐matched WT mice (Student's t‐test). #P < 0.05 compared with animals from the same genotype aged 3 months (Tukey's post hoc test).
APP/PS1 mice exhibited a decrease in learning performance when exposed to the active avoidance test (Figure 1B). Two‐way ANOVA revealed a significant genotype effect at day 1 [F (1, 28) = 4.87, P < 0.05], day 2 [F (1, 28) = 14.91, P < 0.001], day 3 [F (1, 28) = 20.52, P < 0.001], day 4 [F (1, 28) = 20.79, P < 0.001] and day 5 [F (1, 28) = 37.71, P < 0.001], but no age effect or interaction between these two factors at any of the days in the active avoidance test performance. Subsequent Student's t‐test indicated a reduction in the conditioned changes of APP/PS1 mice at 6 [day 5: t (6) = 3.10, P < 0.05], 9 [day 2: t (8) = 4.04, P < 0.01; day 3: t (8) = 3.79, P < 0.01; day 4: t (8) = 3.66, P < 0.01; day 5: t (8) = 4.32, P < 0.01] and 12/14 months [day 3: t (6) = 3.75, P < 0.01; day 4: t (6) = 4.41, P < 0.01; day 5: t (6) = 5.40, P < 0.01] when compared with the corresponding age controls.
APP, PS1 and BACE mRNA and protein expression
Expression levels of APP, PS1 and BACE mRNAs were significantly modified by age in APP/PS1 mice and were altered with respect to WT animals (Figure 2A–C). Two‐way ANOVA revealed a significant genotype effect in APP [F (1, 18) = 511.69, P < 0.001] and BACE mRNA levels [F (1, 18) = 64.44, P < 0.001], and the effect of age in APP [F (1, 18) = 215.41, P < 0.001], PS1 [F (1, 18) = 60.50, P < 0.001] and BACE mRNA levels [F (1, 18) = 31.77, P < 0.001] and interaction between these two factors in APP [F (1, 18) = 238.67, P < 0.001], PS1 [F (1, 18) = 51.20, P < 0.001] and BACE [F (1, 18) = 18.98, P < 0.001]. Subsequent Student's t‐test indicated a significant increase in APP [t (10) = −24.684, P < 0.001] and PS1 mRNA expression [t (10) = −4.62, P < 0.01], as well as a reduction in BACE mRNA levels [t (10) = 2.35, P < 0.05], in APP/PS1 mice when compared with WT at 3 months. Comparing the mRNA levels of APP, PS1 and BACE at different ages, the gene expression did not differ in WT animals. In contrast, the mRNA expression levels of APP [t (8) = 15.26, P < 0.001], PS1 [t (8) = 13.63, P < 0.001] and BACE [t (8) = 5.41, P < 0.001] decreased in APP/PS1 mice aged 12 months when compared with APP/PS1 animals aged 3 months. However, the APP mRNA expression was still higher in APP/PS1 when compared with WT at 12 months [t (8) = −6.33, P < 0.001], in contrast to the significantly lower mRNA expression of PS1 in APP/PS1 mice when compared with the corresponding control littermates [t (8) = 5.25, P < 0.001].
Figure 2.
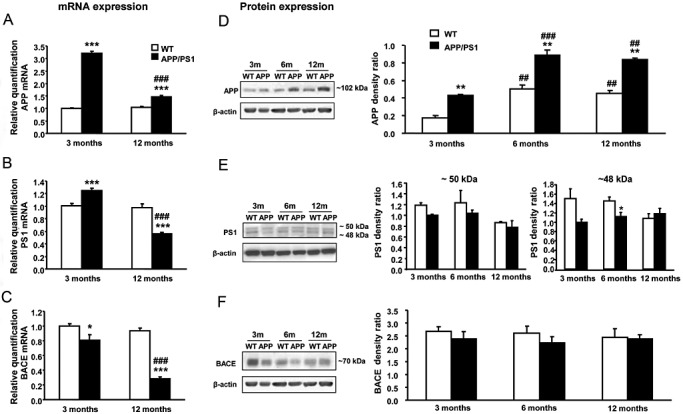
A–C. APP, PS1 and BACE mRNA expression in the neocortex of male APP/PS1 and WT mice at 3 and 12 months of age. mRNA levels of APP, PS1 and BACE are constant in WT mice aged 3 and 12 months, in contrast to the reduced mRNA levels observed in APP/PS1 mice aged 12 months. Comparing genotypes, APP/PS1 mice aged 3 months exhibit increased expression levels of APP (A) and PS1 (B) and reduced levels of BACE (C) mRNAs when compared with corresponding controls. APP mRNA levels are still higher in APP/PS1 mice aged 12 months but PS1 levels shift below control values. D. Increased APP protein levels are observed in APP/PS1 mice at 3, 6 and 12 months when compared with WT animals. In both genotypes, the APP levels increase with age. E. Two bands (48 and 50 kDa) are detected in the PS1 immunoblots. A significant reduction in 48 kDa PS1 is observed in APP/P1 aged 6 months when compared with WT mice. F. In contrast to BACE mRNA expression, no significant differences related to age or genotype are seen in BACE protein expression levels. *P < 0.05, ***P < 0.001 compared with WT mice (Student's t‐test). ##P < 0.01, ###P < 0.001 compared with APP/PS1 animals aged 3 months (Student's t‐test).
Regarding protein quantification (Figure 2D–F), APP, PS1 and BACE 1 levels did not always correlate with mRNA expression. In the case of APP levels, the genotype‐related increase observed in mRNA expression was also observed at the protein level. However, the age‐related effect was the opposite in APP protein level from mRNA expression level. Thus, two‐way ANOVA revealed a significant genotype effect [F (1, 11) = 116.30, P < 0.001] and effect of age [F (2, 11) = 60.33, P < 0.001] in APP protein levels but no interaction between these two factors. Subsequent one‐way ANOVA indicated a significant effect of age in APP protein levels in WT [F (2, 6) = 23.75, P < 0.01] and APP/PS1 mice [F (2, 5) = 40.46, P < 0.001]. Tukey's post hoc test indicated an increase in APP protein level in WT and APP/PS1 aged 6 (P < 0.01 and P < 0.001, respectively) and 12 months (P < 0.01 in both genotypes) when compared with genotype‐matched 3‐month‐old animals, in contrast with the observed effect at the mRNA level. Comparing genotypes, significant increases in APP protein levels in APP/PS1 were observed at 3 [t (4) = 7.85, P < 0.01], 6 [t (4) = 5.16, P < 0.01] and 12 months [t (3) = 9.05, P < 0.01] with respect to age‐matched WT animals. In the case of PS1 protein levels, two specific bands (50 and 48 kDa) were detected in the immunoblots, although neither of them revealed changes in the PS1 protein level in the same direction as observed in the mRNA expression. Two‐way ANOVA revealed a significant age effect [F (2, 11) = 4.50, P < 0.05] in the 50 kDa PS1 band and genotype effect [F (1, 11) = 6.20, P < 0.05] in the 48 kDa band, but lack of interaction between these two factors in any cases. However, Tukey's post hoc test did not reveal significant difference in 50 kDa PS1 because of age either in WT or in APP/PS1 mice. In contrast, a significant reduction in 48 kDa PS1 was observed at 6 months in APP/PS1 mice when compared with age‐matched WT [t (4) = 2.82, P < 0.05]. Finally, BACE 1 protein levels were not modified by age or genotype, in contrast to the differences observed in the mRNA expression level.
β‐amyloid deposition
β‐amyloid deposits and plaques
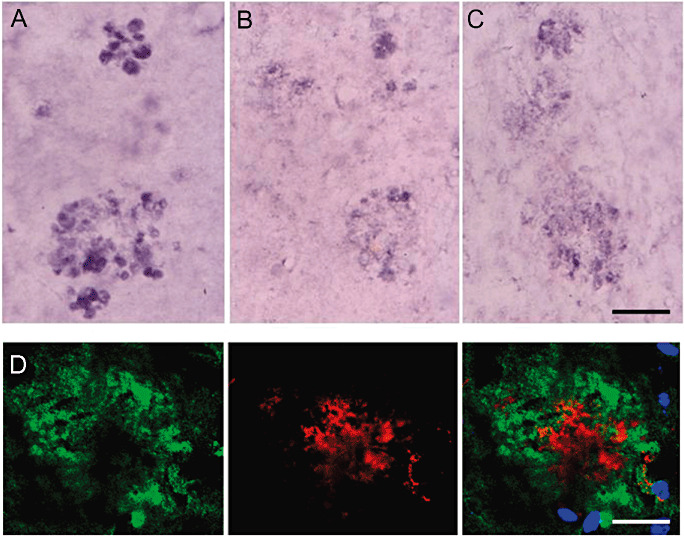
β‐amyloid deposits were characterized as loosely radiated core plaques with radiated peripheral fibers and condensed center of variable size (Figure 3A–C) that were surrounded by aberrant neuronal processes clearly distinguishable with mitochondrial porin antibody (from Abcam and Calbiochem, Figure 3D,E, respectively) and ubiquitin (Figure 3F). These findings indicated altered mitochondria and the presence of ubiquitin bound to non‐degraded molecules in aberrant neurites surrounding β‐amyloid deposits. BACE 1 expression was also increased in association with amyloid plaques (Figure 3G). Hypertrophic astrocytes (Figure 3H) and microglia (Figure 3I) were observed in the vicinity of plaques and were also increased in number in the neuropil.
Figure 3.
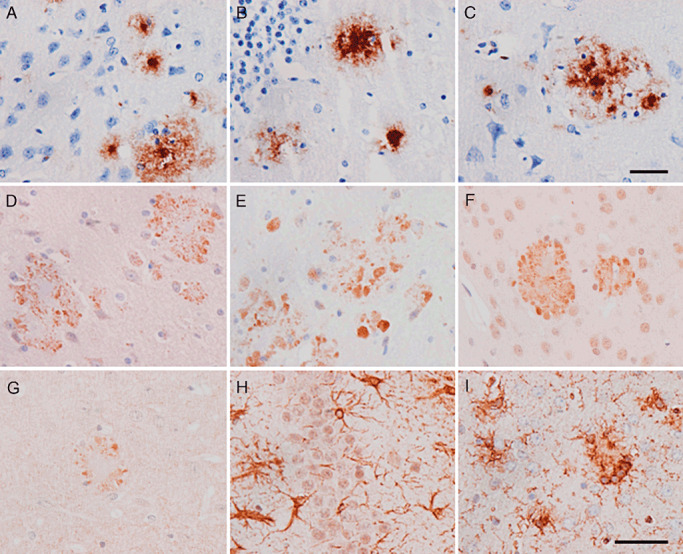
Main neuropathological findings in APP/PS1 mice aged 6 months. β‐amyloid plaques in the neocortex (A), hippocampus (B) and entorhinal cortex (C). Amyloid plaques are surrounded by dystrophic neurites immunoreactive with mitochondrial porin/voltage‐dependent anion channel (VDAC), as revealed with Abcam (D) and Calbiochem (E), antibodies and ubiquitin (F). BACE 1 is also expressed in association with β‐amyloid plaques (G). Hypertrophic astrocytes, as revealed with GFAP antibodies (H) and microglia stained with Lycopericum esculentum lectin (I), are also observed in the vicinity of plaques. Paraffin sections slightly counterstained with hematoxylin. A–G, bar in C = 25 µm; H, I, bar in I = 40 µm.
A few β‐amyloid plaques were first seen at the age of 3 months, and these then increased in number with disease progression. These plaques also showed VDAC‐ and ubiquitin‐positive dystrophic neurites (data not shown). The first β‐amyloid deposits appeared in the neocortex, followed by the entorhinal cortex, amygdala and hippocampus. Plaques were also observed in the basal ganglia from 9 months onwards and in the pons and the cerebellum from 12/14 months onwards. Interestingly, basal ganglia and cerebellar plaques are more commonly observed in PS1 FAD than in SAD cases 50, 55.
β‐amyloid deposition was also present in the meningeal and cerebral blood vessel walls, thus confirming amyloid angiopathy, which also showed increased numbers of vessels involved from the age of 6 months onwards.
β‐amyloid burden
β‐amyloid plaques increase with age (Figure 4A). β‐amyloid burden was calculated as the percentage of the amyloid deposition area with respect to the total cortex area. APP/PS1 mice showed an increase in β‐amyloid burden related with age, as revealed by one‐way ANOVA [F (2, 8) = 29.60, P < 0.001]. The amyloid burden was significantly higher in APP/PS1 mice aged 12 months than in animals aged 6 months (P < 0.01, Tukey's post hoc test). In the same line, amyloid burden was significantly higher in APP/PS1 mice aged 20 months than in animals aged 6 and 12 months (P < 0.001 and P < 0.05, respectively, with Tukey's post hoc test) (Figure 4B).
Figure 4.
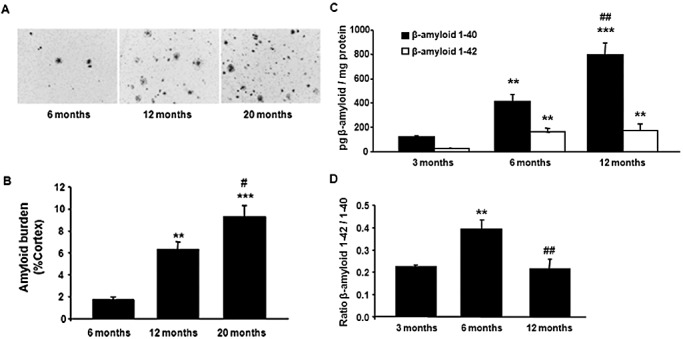
β‐amyloid plaques increase in number with disease progression. A. Representative images of β‐amyloid plaques in the cortex of APP/PS1 mice aged 6, 12 and 20 months. B.β‐amyloid burden in three cortical regions from three different sections in APP/PS1 mice aged 6, 12 and 20 months. Data are expressed as the mean values ± standard error of the mean (SEM) of three to four animals per age. **P < 0.01, ***P < 0.001 compared with 6 months (Tukey's post hoc test). #P < 0.05 compared with 12 months (Tukey's post hoc test). Data are expressed as the mean ± SEM of three to seven animals per age. **P < 0.01, ***P < 0.001 compared with animals aged 3 months (Tukey's post hoc test). ##P < 0.01 compared with animals aged 6 months (Tukey's post hoc test). C. ELISA quantification of cortical homogenates reveals increased β‐amyloid 1–40 and 1–42 soluble levels because of age in APP/PS1 mice. D. The increase in the ratio between β‐amyloid 1–42 and 1–40 and soluble forms observed in APP/PS1 at 6‐month‐old with respect to 3‐month‐old mice is not found at 12 months (B). Data are expressed as the mean ± SEM of 3–7 animals per age. **P < 0.01, ***P < 0.001 compared with animals aged 3 months (Tukey's post hoc test). ##P < 0.01 compared with animals aged 6 months (Tukey's post hoc test).
No amyloid deposition was observed in WT mice at any time point of the study.
Soluble β‐amyloid
The β‐amyloid 1–40 and 1–42 soluble levels were increased by age in cortical homogenates of APP/PS1 mice (Figure 4C), as revealed by one‐way ANOVA [β‐amyloid 1–40: F (2, 12) = 45.87, P < 0.001; β‐amyloid 1–42, F (2, 12) = 12,89 P < 0.01]. Subsequent Tukey's post hoc test revealed an increase in both soluble amyloid forms at 6 (β‐amyloid 1–40, P < 0.01; β‐amyloid 1–42, P < 0.01) and 12 months (β‐amyloid 1–40, P < 0.001; β‐amyloid 1–42, P < 0.01) when compared with 3‐month‐old animals. Moreover, soluble β‐amyloid 1–40 significantly increased at 12 months when compared with 6 months (P < 0.01), whereas the soluble β‐amyloid 1–42 levels were very similar in mice aged 6 and 12 months. Interestingly, the amount of β‐amyloid 1–40 was higher than the amount of β‐amyloid 1–42 at any age once normalized for equal amounts of total protein. No human β‐amyloid 1–40 or β‐amyloid 1–42 proteins were present in WT mice cortical homogenates at any age, as expected.
One‐way ANOVA indicated a significant effect of age in the ratio between β‐amyloid 1–42 with respect to β‐amyloid 1–40 levels [F (2, 12) = 11.75, P < 0.001]. Subsequent Tukey's post hoc test revealed an increase in the ratio at 6 months when compared with 3 months (P < 0.01) but a reduction at 12 months when compared with 6 months (P < 0.01) (Figure 4D).
Dystrophic neurites
Altered mitochondria and polymorphous inclusions
This was further confirmed with electron microscopy, showing that β‐amyloid deposits were practically surrounded by enlarged cellular processes with polymorphous inclusions and altered mitochondria (Figure 5A–D). Abnormal mitochondria were also seen in apparently normal neuronal processes in the vicinity of dystrophic neurites. Immunoelectronmicroscopy further disclosed β‐amyloid deposition in plaques (Figure 5E), whereas antibodies against VDAC decorated the mitochondrial membrane and many membrane‐bound polymorphous inclusions in dystrophic neurites of β‐amyloid plaques (Figure 5F). No β‐amyloid deposition was seen within neurons and neuronal processes.
Figure 5.
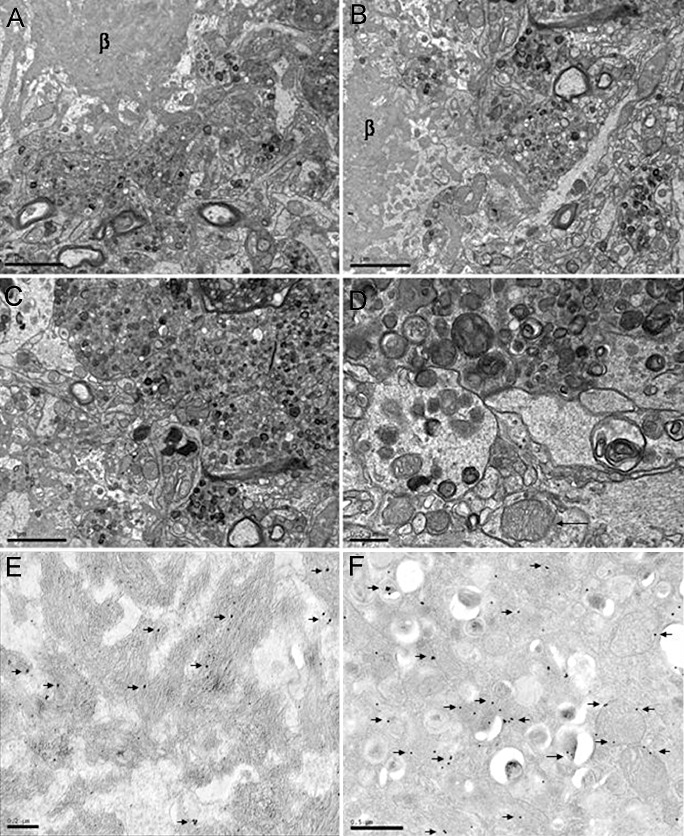
A–C. Electron microscopy of β‐amyloid plaques showing a central, radiating core of amyloid (β) surrounded by aberrant huge neurites filled with altered mitochondria, polymorphous inclusions and vesicles. APP/PS1 mice aged 12 months. A–C, bar = 2 µm; D, bar = 0.5 µm. D,F. Immunoelectronmicroscopy showing immunogold particles (arrows) decorating β‐amyloid in the core of a plaque (D) and VDAC in the membrane of mitochondria and polymorphous inclusions in aberrant neurites surrounding β‐amyloid deposits (F). APP/PS1 mice aged 6 months. E, bar = 0.2 µm; F, bar = 0.5 µm.
Active tau kinases and proteins related to anti‐oxidative stress responses and phospho‐tau
Single immunohistochemistry disclosed the presence of active SAPK/JNK phosphorylated at Thr183/Tyr185 and active p38 phosphorylated at Thr180/Tr182 in dystrophic neurites surrounding β‐amyloid plaques (Figure 6A,B). Increased SOD1 expression was also present in aberrant neurites surrounding β‐amyloid deposits (Figure 6C). Increased oxidative stress, as suggested by increased HNE (Figure 6D) and neuroketal immunoreactivity (see later), was present in association with amyloid plaques, suggesting that oxidative stress triggered the activation of stress kinases SAPK/JNK and p38, resulting in the enhancement of oxidative stress responses. In addition, small amounts of phospho‐tau, as revealed with several phospho‐specific anti‐tau antibodies, Ser199, Ser202, Ser262 and Thr181, as well as with the antibody AT8, were seen in more mature plaques. Double‐labeling immunofluorescence and confocal microscopy disclosed the presence of altered protein deposition in association with increased neuroketal immunoreactivity in plaques (Figure 7), providing further evidence of altered synaptic protein expression resulting from oxidative stress in relation with β‐amyloid deposits. All these alterations appeared at 3 months and only in association with the first plaques in the cerebral cortex, and they increased with disease progression in parallel with the number of plaques. Similar findings are also seen in Tg2576 mice bearing the APP Swedish mutation (52).
Figure 6.
(A) SAPK/JNK‐P, (B) p38‐P and (C) SOD1 immunoreactivity in cellular processes surrounding β‐amyloid plaques (unstained center) in APP/PS1 mice aged 6 months. Immunoreaction visualized with nickel. D. Confocal microscopy showing HNE immunoreactivity (red) in association with β‐amyloid (green) deposition in plaques. Nuclei are stained in blue with DRAQ5TM. A–C, bar = 25 µm; D, bar = 10 µm.
Figure 7.
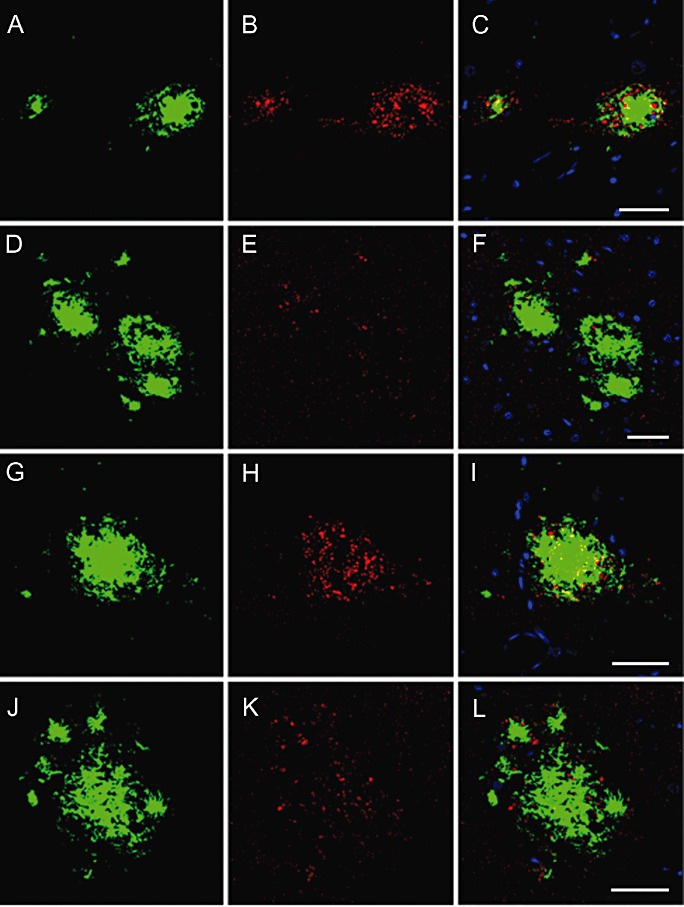
Double‐labeling immunofluorescence and confocal microscopy showing altered phospho‐tau deposition (red, B, E, H, K) in association with increased neuroketal immunoreactivity in plaques (green, A, D, G, J). C, F, I, L: merge. Nuclei are stained in blue (DRAQ5). APP/PS1 mice aged 6 and 9 months. A–F, bar = 25 µm; G–L, bar = 25 µm.
Altered expression of α‐synuclein and other proteins
α‐synuclein accumulated at the periphery of β‐amyloid plaques. No α‐synuclein was observed in APP/PS1 mice at the age of 3 and 6 months, but α‐synuclein deposits increased in mice aged 9, 12/14 and 18 months.
Double‐labeling immunofluorescence and confocal microscopy disclosed the presence of small punctate deposits of α‐synuclein in the vicinity of β‐amyloid deposits (Figure 8A–C). More importantly, part of this α‐synuclein was phosphorylated at Ser9, indicating that abnormal α‐synuclein accumulated at the neuritic processes surrounding β‐amyloid plaques (Figure 8D–F).
Figure 8.
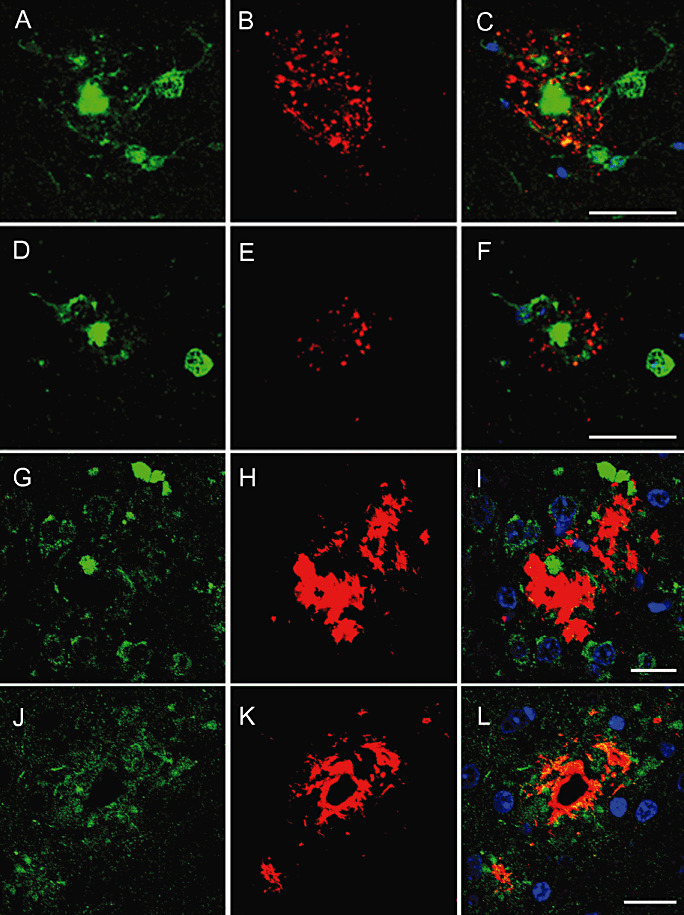
Variable amounts of α‐synuclein (B) and α‐synuclein phosphorylated at Ser129 (E, red) accumulate at the periphery of β‐amyloid plaques (A, D, green). Rab3a (G, green) is found in dystrophic neurites surrounding β‐amyloid plaques (H, red). Similarly, APP (J, green) accumulates in the vicinity of amyloid deposits (K, red). Nuclei are stained in blue (DRAQ5). APP/PS1 mice aged 12/14 months. A–F, bar = 40 µm; G–L, bar = 20 µm.
In addition to phosphorylated tau and phosphorylated α‐synuclein, other proteins were also accumulated in dystrophic neurites of β‐amyloid plaques including synaptic protein Rab3a (Figure 8G–I) and APP (Figure 8J–L), as revealed with double‐labeling immunofluorescence and confocal microscopy. The accumulation of these proteins was related to disease progression, but abnormal protein dots in association with β‐amyloid deposits were already present in the few plaques at the age of 3 months in transgenic mice, in contrast with the fine synaptic‐like pattern of Rab3a in WT mice and in areas devoid of β‐amyloid deposits in APP/PS1 transgenic mice (data not shown).
Impaired proteasome expression and activity
The total proteins extracted from neocortex of APP/PS1 and WT mice (3, 6, 12 months old) were immunoblotted for different subunits of the 19S proteasome and 20S constitutive proteasome as well as of the inducible immunoproteasome, including the 19S subunit S1 [molecular weight (m.w.) 105KDa, Figure 9A,B], the catalytic subunit β5 (m.w. 25 kDa, Figure 9C,D), which is distinctive of constitutive proteasome, the multicatalytic endopeptidase complex MECL‐1 (m.w. 28 kDa, Figure 9E,F), which is an inducible immunoproteasome subunit, the inducible catalytic β subunits LMP2 (m.w. 22 kDa, Figure 9G,H) and the proteasome activator PA28 regulatory complex (m.w. 29 kDa, Figure 9I,J). No modifications were observed in the expression levels of a 19S protesome subunit. However, two‐way ANOVA revealed a significant genotype effect in β5 subunit [F (1, 12) = 7.00, P < 0.05], latent membrane protein 2 (LMP2) [F (1, 6) = 6.09, P < 0.05] and PA28 levels [F (1, 12) = 1161.00, P < 0.001]; effect of age in β5 subunit [F (2, 12) = 5.29, P < 0.05], MECL‐1 [F (2, 12) = 10.11, P < 0.001], LMP2 [F (2, 6) = 26.36, P < 0.01] and PA28 levels [F (2, 12) = 10.94, P < 0.001]; and interaction between these two factors in β5 subunit [F (2, 12) = 6.14, P < 0.05], MECL‐1 [F (2, 12) = 14.87, P < 0.001], LMP2 [F (2, 6) = 12.92, P < 0.01] and PA28 levels [F (2, 12) = 383.10, P < 0.001]. No significant effect of age, genotype or interaction between the two factors was observed for the 19S subunit S1. Subsequent one‐way ANOVA revealed a significant effect of age in APP/PS1 mice in β5 subunit [F (2, 6) = 5.25, P < 0.05], MECL‐1 [F (2, 6) = 35.09, P < 0.01], LMP2 [F (2, 3) = 84.00, P < 0.01] and PA28 [F (2, 6) = 89.63, P < 0.01]. Tukey's post hoc test indicated a significant decrease in MECL‐1 levels (–47%, P < 0.05) in APP/PS1 mice aged 6 months when compared with 3‐month‐old animals, but an increase in MECL‐1 protein (+159%, P < 0.01) at 12 months in respect to 6‐month‐old APP/PS1 mice. LMP2 levels were increased in APP/PS1 animals aged 12 months when compared with 3‐ or 6‐month‐old littermates (+167%, P < 0.01; +81%, P < 0.01, respectively). Similarly, PA28 expression was increased in 6‐ (+33%, P < 0.01) and 12‐month‐old APP/PS1 mice (+47%, P < 0.01) in comparison with 3‐month‐old transgenic mice. One‐way ANOVA showed a significant effect of age in WT mice in β5 subunit [F (2, 6) = 6.33, P < 0.05] and PA28 levels [F (2, 6) = 367.40, P < 0.001]. Tukey's post hoc test indicated an increase in β5 expression in animals aged 12 months compared with 3‐month‐old WT (+45%, P < 0.05). Moreover, PA28 levels were decreased in 6‐ (–18%, P < 0.01) and 12‐month‐old WT animals (−40%, P < 0.001) when compared with WT aged 3 months.
Figure 9.
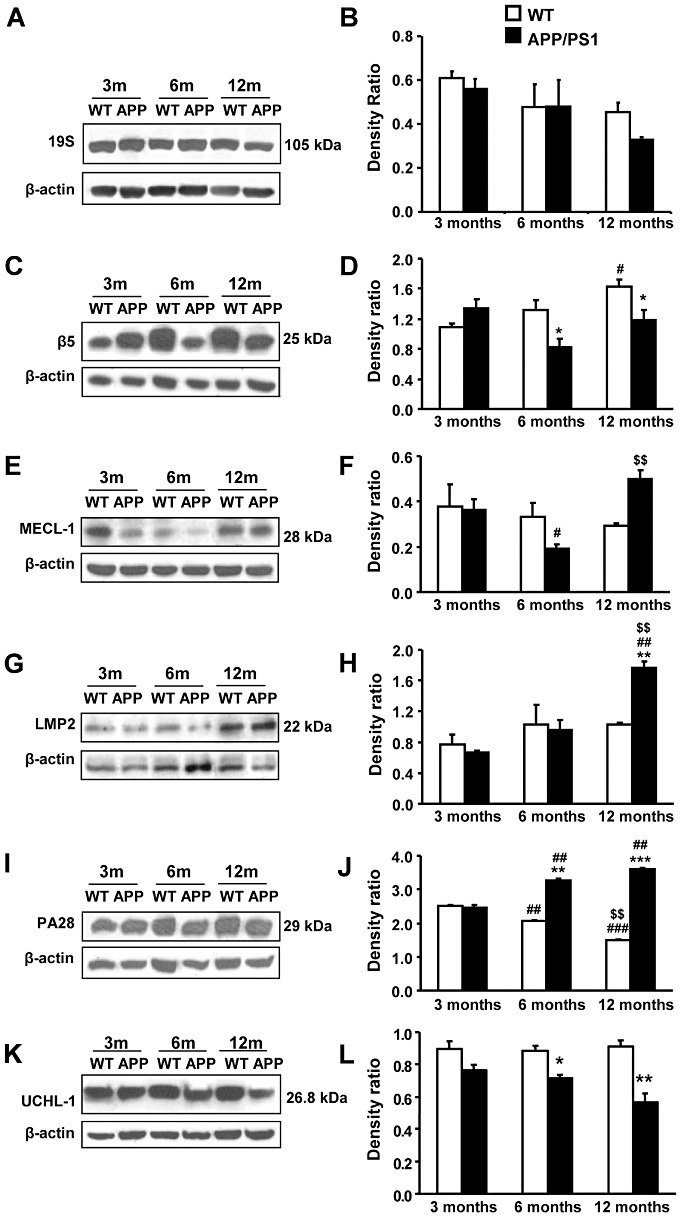
Altered expression of constitutive and inducible proteasome components. A,B. No significant difference in the levels of 19S subunit S1 because age or genotype is observed in WT or APP/PS1 mice, in spite of a tendency to decrease in 12‐month‐old APP/PS1. C,D. Decreased expression of β5 subunit in APP/PS1 mice aged 6 and 12 months when compared with WT. In contrast, β5 subunit expression is higher at 12 months than at 3 months in WT animals. E,F. Protein levels of MECL‐1 are reduced in APP/PS1 animals aged 6 months when compared with younger animals. This reduction is not maintained at 12 months. G,H. Quantification for LMP2 indicates a significant increase in APP/PS1 mice at 12 months compared with WT and APP/PS1 animals aged 3 or 6 months. I,J. The pathology progression with age is associated with an upregulation of the proteasome activator PA28 regulatory complex in APP/PS1 mice. In contrast, PA28 expression is reduced in aged WT animals. K,L. The expression of UCHL‐1 decreases in APP/PS1 mice at 6 and 12 months with respect to control littermates. A,C,E,G,I,K. Representative immunoblots for β5, MECL‐1, LMP2, PA28 and corresponding β‐actin loading control indicating the molecular weight of each protein. B,D,F,H,J,L. Densitometric quantification of β5, MECL‐1, LMP2, PA28 and UCHL‐1 levels with respect to β‐actin. Data are represented as the mean ± SEM of three animals per group. *P < 0.05, **P < 0.01, ***P < 0.001 compared with WT animals (Student's t‐test). #P < 0.05, ##P < 0.01, ###P < 0.001 compared with animals aged 3 months (Tukey's post hoc test). $$P < 0.01 compared with animals aged 6 months (Tukey's post hoc test).
Student's t‐test indicated a significant difference in the proteosome subunit expression level in APP/PS1 compared with WT animals at 6 months in β5 subunit (−37%, P < 0.05) and PA28 levels (+58%, P < 0.01) and at 12 months in β5 subunit (−26%, P < 0.05), LMP2 (+72%, P < 0.01) and PA28 levels (+140%, P < 0.001).
We also evaluated the ubiquitin carboxyl‐terminal esterase L1 (UCHL‐1; m.w 27 kDa, Figure 9K,L). Two‐way ANOVA revealed a significant effect of genotype in the UCHL‐1 protein levels [F (1, 12) = 41.97, P < 0.001] and no effect of age but significant interaction between the two factors [F (2, 12) = 4.02, P < 0.05]. Subsequent Student's t‐test indicated a reduction in the UCHL‐1 levels in APP/PS1 mice at 6 months [–20%, t (4) = 4.20, P < 0.05] and at 12 months [−38%, t (4) = 4.97, P < 0.01] when compared with WT littermates.
The assays for chymotrypsin‐like (Figure 10A), trypsin‐like (Figure 10B) and the PGPH (Figure 10C) activities showed altered proteasome 26S functionality in APP/PS1 starting at 6 months of age. Thus, two‐way ANOVA revealed a significant effect of genotype in the chymotrypsin‐like [F (1, 8) = 28.49, P < 0.001], trypsin‐like [F (1, 8) = 18.41, P < 0.01] and PGPH activities [F (1, 8) = 117.90, P < 0.001], as well as an age effect in the chymotrypsin‐like [F (1, 8) = 23.81, P < 0.01] and trypsin‐like [F (1, 8) = 15.26, P < 0.01] but not in PGPH activities. Significant interaction between genotype and age was observed in trypsin‐like [F (1, 8) = 7.98, P < 0.05] and PGPH activities [F (1, 8) = 99.26, P < 0.001]. Subsequent Student's t‐test indicated a significant decrease in the chymotrypsin‐like [–20%, t (4) = 4.07, P < 0.05] but an increase in the trypsin‐like [+24%, t (4) = 5.19, P < 0.01] and PGPH activities [+15%, t (4) = 13.96, P < 0.001] in APP/PS1 mice aged 6 months when compared with corresponding WT littermates. Similar alteration as that observed at 6 months was revealed in 12‐month‐old APP/PS1 mice for the chymotrypsin‐like activity [–13%, t (4) = 3.46, P < 0.05], but not for trypsin‐like or PGPH activities. Student's t‐test also revealed an increase in the chymotrypsin‐like activity because of age in WT [+14%, t (4) = 3.94, P < 0.05] and APP/PS1 mice [+22%, t (4) = 3.33, P < 0.05], as well as a significant decrease in the trypsin‐like activity because of age in APP/PS1 animals [–14%, t (4) = 5.01, P < 0.01].
Figure 10.
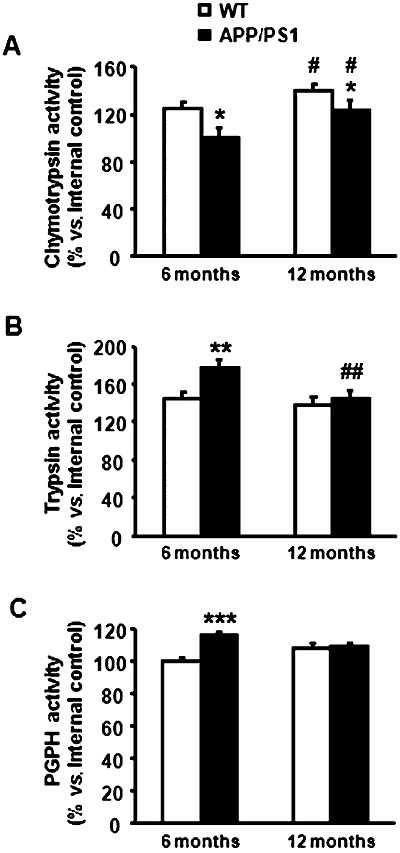
Altered proteasome 26S functionality in APP/PS1 mice. A. Chymotrypsin‐like activity is reduced in APP/PS1 at 6 and 12 months of age when compared with WT mice. However, this activity increases proportionally with age in both genotypes. B. Trypsin‐like activity is increased in APP/PS1 mice at 6 months of age although this increase is not maintained with age. C. Similarly, the increase in the PGPH activity exhibited by APP/PS1 mice at 6 months of age is not observed at 12 months. *P < 0.05, **P < 0.01, ***P < 0.001 compared with WT animals (Student's t‐test). #P < 0.05, ##P < 0.01 compared with animals aged 6 months (Student's t‐test).
DISCUSSION
APP/PS1 mice suffer from cognitive impairment accompanied by several pathological alterations such as β‐amyloid plaques and dystrophic neurites around β‐amyloid plaques, all of which increase with disease progression 3, 4, 54. These characteristics are derived from their particular genetic background reminiscent of FAD linked with mutations in APP and PS1. Yet a major difference between APP/PS1 mice and FAD is that neurons with neurofibrillary tangles and neuropil threads are never observed in transgenic mice, whereas they are the other major hallmark, together with β‐amyloid plaques, of familial (and sporadic) AD.
Memory deficits and impaired learning first occur at the age of 6 months
The present findings demonstrate memory decline and impaired learning at 6 months of age, but not at 3 months, which is the time of the first appearance of plaques in the cortex of APP/PS1 mice. The two‐object recognition test was used for evaluating the memory impairment of APP/PS1 mice because performance on this paradigm depends on hippocampal function 44, 62, which has been extensively related to the memory decline associated with AD (44). Furthermore, the active avoidance test permits evaluation of associative learning by operant conditioning, which represents a complex cognitive challenge requiring the integration of acquisition, consolidation and retention of memory processes, together with control of specific locomotor responses to stressful events. Results of these tests indicate impairment of hippocampal and corticolimbic brain structures in APP/PS1 mice from the age of 6 months onwards.
Genetic background and β‐amyloid production
Sequential analysis revealed increased mouse APP mRNA expression, at the age of 3 months and 12 months in transgenic mice when compared with age‐matched control littermates, although expression levels decrease with age in transgenic mice while remaining steady in normal littermates. Consistent with these observations, APP protein is increased in transgenic mice when compared with controls. PS1 mRNA decreases with age, which only barely correlates with decreased protein levels at 6 months but not at the age of 12 months in transgenic mice. Thus, transcription of causative genes is modified with age in APP/PS1 mice, resulting in increased APP production but in reduced PS1 expression with age.
BACE1 cleavage of APP is limiting, together with γ‐secretase, of the production of β‐amyloid 36, 61. As in SAD (71), increased BACE1 protein immunoreactivity is observed in neuronal processes surrounding senile plaques in transgenic mice. However, a major difference exists regarding BACE1 expression in SAD and transgenic mice. Several studies have shown increased BACE1 expression levels in SAD 9, 17, 23, 41, 69, and this increase has been related to β‐amyloid production (35). In contrast, the present findings show reduced BACE1 mRNA expression and non‐altered BACE1 protein levels in transgenic mice when compared with normal littermates. The discrepancy between BACE1 mRNA and protein expression levels is not explained at present; variable modulation of mRNA transcription, life duration of this specific mRNA and decreased catabolism of the protein may account for these differences. Interestingly, reduced levels of BACE1 in double PDAPP/BACE(–/–) transgenic mice are associated with reduced β‐amyloid plaque formation (40), and oral administration of a selective BACE1 inhibitor decreases β‐amyloid production in vivo (24). Following a rationale on this line, reduced BACE1 could be interpreted as a putative attempt to reduce β‐amyloid production in transgenic mice. Of course, this is merely speculative at this time, but what is more important is that β‐amyloidogenesis does not follow the same mechanism in SAD and in the APP/PS1 model of FAD. Parallel studies have shown reduced β‐amyloid levels in the cerebrospinal fluid (CSF) and brain in FAD cases because of mutations in the PS1 gene when compared with SAD (Pera M et al, unpub. obs.).
A few β‐amyloid plaques in the cerebral cortex appear at the age of 3 months in APP/PS1 mice and they increase in number and expand in their localization to the hippocampus, basal ganglia and cerebellum from this time onwards. This is associated with increased soluble β‐amyloid 1–40 and 1–42 with age, as described in other AD‐like transgenic mice (46). Yet unlike in Tg2576 mice (46), the expression levels of β‐amyloid 1–40 are higher than those of β‐amyloid 1–42, and this feature is maintained with disease progression in APP/PS1 mice. The ratio between β‐amyloid 1–40 and 1–42 is also modified with time, with higher values at 6 months. This may have consequences, as small modifications in the ratio of amyloid isoforms modulate amyloid aggregate conformations and cell damage 31, 42. Furthermore, fibrillar β‐amyloid 1–42 rather than soluble β‐amyloid 1–42 is able to upregulate BACE1 protein expression (57).
Mitochondrial abnormalities
Accumulation of β‐amyloid in plaques in transgenic APP/PS1 is accompanied by altered, huge aberrant neurites that are mainly composed of altered mitochondria and an accumulation of residual bodies (3). Mitochondrial alteration in APP/PS1 transgenic mice is further supported by the present immunohistochemical and immunoelectronmicroscopical observations showing VDAC accumulation in residual bodies of aberrant neurites in the vicinity of β‐amyloid plaques. Abnormal accumulation of mitochondria already appears in the few plaques in APP/PS1 mice aged 3 months, indicating early mitochondrial alteration in these mice.
These results are in line with previous observations showing that mitochondria are abnormal and dysfunctional in AD 20, 22, 28, 29, 38, 43, 47, 49, 58 and in other AD transgenic models 60, 70.
Altered proteins in dystrophic neurites surrounding β‐amyloid plaques
Scanty hyperphosphorylated tau deposition also occurs in dystrophic neurites in mice aged 3 and 6 months, and the amount increases with disease progression, as already reported (3). Yet the quantities of hyperphosphorylated tau are never on a par with those seen in dystrophic neurites in AD. Furthermore, neurofibrillary tangles are not produced at any age in APP/PS1 mice.
It has been reported that β‐amyloid dimers directly induce tau hyperphosphorylation and neuritic degeneration in AD (26). However, tau phosphorylation in the vicinity of β‐amyloid probably depends on multiple factors, and one of these is related with increased oxidative stress and stress responses, as visualized with oxidative stress markers and increased SOD1 expression around β‐amyloid plaques. In this line, stress kinases p38 and SAPK/JNK are activated in dystrophic neurites around β‐amyloid plaques in APP/PS1, Tg2576 mice and AD 13, 16. Studies in cortical AD homogenates have shown the capacity of SAPK/JNK‐P and p38‐P (which represent the active forms of these kinases) to phosphorylate recombinant tau in vitro (16). Therefore, the present findings further support the idea that oxidative stress may also induce tau phosphorylation by activation of SAPK/JNK and p38 in the vicinity of β‐amyloid plaques (16). However, this feature does not rule out a role for other factors in tau phosphorylation in APP/PS1 transgenic mice including other kinases (GSK‐3, cdk5, Egr‐1), phosphatases, β‐amyloid and α‐synuclein 11, 37, 51, 53, 66.
α‐synuclein is also accumulated in altered neurites surrounding β‐amyloid plaques, and deposited α‐synuclein is partly phosphorylated at Ser129. This is a major event in α‐synucleinopathies (1), but it has also been reported in synaptosomal‐enriched fractions in AD (45). Moreover, α‐synuclein and tau pathology occur in certain sporadic and familial cases of diseases with Lewy bodies 12, 30. The present observations prove that phosphorylated α‐synuclein may be a component of altered neuronal processes in APP/PS1 and that its appearance increases with disease progression.
Altered expression of synaptic proteins also occurs in aberrant neurites surrounding β‐amyloid deposits in APP/PS1 transgenic mice, as already reported in AD 7, 14. Rab3a is one of the core proteins involved in synaptic vesicle trafficking (32). Accumulation of Rab3a in dystrophic neurites is probably the result of impaired transport. APP, a transmembrane protein, which is deposited in damaged axons (8), also accumulates in dystrophic neurites. The functional implication of accumulated synaptic proteins is probably very limited as aberrant neurites do not establish synaptic contacts; rather, they are characterized by a dramatic deposition of cellular debris.
Impaired proteasome system
Accumulation of altered proteins prompted the study of mechanisms involved in protein degradation. Removal of altered proteins is carried out by several mechanisms including cytosolic proteolysis and activation of the UPS. The UPS plays a crucial role in non‐lysosomal protein degradation under certain physiological conditions. Misfolded proteins or unassembled subunits of larger protein complexes and retro‐translocated proteins from the endoplasmic reticulum are subject to rapid proteasomal degradation. The ubiquitin‐proteasome pathway is initiated by the conjugation of ubiquitin to the substrate leading to poly‐ubiquitination of the substrate. The conjugation of the target protein to a chain of ubiquitin molecules is recognized by the 26S proteasome, which is composed of the 20S proteasome and the 19S or the 11S activator, PA28αβ complex. Three catalytic β subunits of the 20S proteasome can be replaced by homologous proteins LMP2, LMP7 and MECL1, thereby forming the so‐called immunoproteasome. The 20S proteasome has three main peptidase activities: chymotrypsin‐like, trypsin‐like and peptidylglutamyl peptide hydrolyzing activities 5, 18, 21, 33, 34, 63. Ubiquitin C‐terminal hydrolase L 1 (UCHL1) is a deubiquitinating enzyme.
Several studies in AD have shown alterations in the components and function of the UPS 19, 27, 48. However, the reasons for UPS impairment in AD are unclear. It has been suggested that β‐amyloid inhibits the proteasome and enhances amyloid and tau accumulation (59). Yet other studies on isolated proteasome complexes have shown a direct effect for oxidative inactivation contributing to decline in proteasome function in AD (10). The present observations in APP/PS1 transgenic mice show altered expression levels of different subunits of the 20S proteasome, activation of the immunoproteasome and reduced expression levels of UCHL1. Moreover, variable reductions in chymotrypsin‐like activity, trypsin‐like activity and PGPH activity are small although statistically significant in the cerebral cortex in APP/PS1 mice from 6 months onwards. It is difficult to ascertain the prime reason for UPS dysfunction in APP/PS1 mice, as many integral elements are abnormally regulated, but altered composition and impaired function of the UPS appears to be a key factor associated with the accumulation of abnormal proteins.
Multiple subcellular failures in APP/PS1 mice and implications in FAD pathogenesis
Involvement of the cerebral cortex, hippocampus, entorhinal cortex, amygdala, thalamus, striatum, certain nuclei of the brain stem and cerebellum with disease progression demonstrates that the neurodegenerative process in APP/PS1 mice is a multisystemic disease of the central nervous system 3, 4, 54. Axonal degeneration in the spinal cord (67) further augments the extent of damage. Increased amyloid burden and plaques correlates with neurological deficits.
Alterations in dystrophic neurites surrounding β‐amyloid plaques are also similar in AD and APP/PS1 transgenic mice, particularly those involving altered mitochondria, increased oxidative damage and accumulation of altered proteins. These alterations may, in turn, have an impact on variegated molecular pathways including modulation of transcription and translation (64).
However, certain aspects differ in APP/PS1 mice and SAD. One of these is the expression of BACE1, which is crucial in β‐amyloid production. Differences in BACE1 favor a different mechanism of amyloidogenesis between SAD and the present FAD transgenic model, suggesting that β‐amyloid production differs in SAD and FAD.
Another important point is the activation of the immunoproteasome with disease progression APP/PS1 mice and the variable malfunction of the distinct protease‐like activities of the UPS over time, thus impeding removal of altered proteins. Although immunoprotesome activation has been reported in particular instances of AD (15), it remains to be proved that similar activation of the immunoproteasome occurs in SAD and FAD.
CONFLICT OF INTERESTS
The authors declare no conflict of interests.
ACKNOWLEDGEMENTS
This study was supported by a grant from the Spanish Ministry of Health, Instituto de Salud Carlos III (FIS PI08/0582), and a grant from the Spanish Ministry of Science and Innovation (PETRI PET2007‐0397) to IF; R + D grants from the Spanish Ministry of Education and Science (BFU2009‐11879/BFI; AGL2006‐12433), the Generalitat of Catalunya (2009SGR‐735), the Spanish Ministry of Health (PI08‐1843) and “La Caixa” Foundation to RP and MPO; SAF2007‐66148‐C02‐02 and SAF2010‐22114‐C02‐01 from Spanish Ministry of Science and Innovation to MD; and the BESAD‐P project (Carlos III Institute) to IF, RP and MPO. It was also supported by the COST B‐35 Action. We thank Dr E. Oliveira, Director of the Proteomic Platform, Barcelona Science Park, B. Torrejón‐Escribano, for his support in confocal microscopy and T. Yohannan for editorial assistance.
REFERENCES
- 1. Anderson JP, Walker DE, Goldstein JM, de Laat R, Banducci K, Caccavello RJ et al (2006) Phosphorylation of Ser‐129 is the dominant pathological modification of α‐synuclein in familial and sporadic Lewy body disease. J Biol Chem 281:29739–29752. [DOI] [PubMed] [Google Scholar]
- 2. Bettens K, Sleegers K, Van Broeckhoven C (2010) Current status of Alzheimer disease molecular genetics: from past, to present, to future. Hum Mol Genet 19:R4–R11. [DOI] [PMC free article] [PubMed] [Google Scholar]
- 3. Blanchard V, Moussaoui S, Czech C, Touchet N, Bonici B, Planche M et al (2003) Time sequence of maturation of dystrophic neurites associated with Abeta deposits in APP/PS1 transgenic mice. Exp Neurol 184:247–263. [DOI] [PubMed] [Google Scholar]
- 4. Borchelt DR, Thinakaran G, Eckman CB, Lee MK, Davenport F, Ratovitsky T et al (1996) Familial Alzheimer's disease‐linked presenilin 1 variants elevate Abeta1‐42/1‐40 ratio in vitro and in vivo. Neuron 17:1005–1013. [DOI] [PubMed] [Google Scholar]
- 5. Botchler M, Ditzel Groll M, Hartmann C, Huber R (1999) The proteasome. Annu Rev Biophys Biomol Struct 28:295–317. [DOI] [PubMed] [Google Scholar]
- 6. Braak H, Braak E (1998) Evolution of neuronal changes in the course of Alzheimer's disease. J Neural Transm 53:127–110. [DOI] [PubMed] [Google Scholar]
- 7. Brion JP, Couck AM, Bruce M, Anderton B, Flament‐Durand J (1991) Synaptophysin and chromogranin A immunoreactivities in senile plaques of Alzheimer's disease. Brain Res 539:143–150. [DOI] [PubMed] [Google Scholar]
- 8. Büttner A, Rohrmoser K, Mall G, Penning R, Weis S (2006) Widespread axonal damage in the brain of drug abusers as evidenced by accumulation of beta‐amyloid precursor protein (β‐APP): an immunohistochemical investigation. Addiction 101:1339–1346. [DOI] [PubMed] [Google Scholar]
- 9. Cai Y, Xiong K, Zhang XM, Cai H, Luo XG, Feng JC et al (2010) β‐Secretase‐1 elevation in aged monkey and Alzheimer's disease human cerebral cortex occurs around the vasculature in partnership with multisystem axon terminal pathogenesis and beta‐amyloid accumulation. Eur J Neurosci 32:1223–1238. [DOI] [PMC free article] [PubMed] [Google Scholar]
- 10. Cecarini V, Ding Q, Keller JN (2007) Oxidative inactivation of the proteasome in Alzheimer's disease. Free Radic Res 41:673–680. [DOI] [PubMed] [Google Scholar]
- 11. Dolan PJ, Johnson GV (2010) The role of tau kinases in Alzheimer's disease. Curr Opin Drug Discov Devel 13:595–603. [PMC free article] [PubMed] [Google Scholar]
- 12. Duda JE, Giasson BI, Mabon ME, Miller DC, Golbe LI, Lee VM, Trojanowski JQ (2002) Concurrence of alpha‐synuclein and tau brain pathology in the Contursi kindred. Acta Neuropathol (Berl) 104:7–11. [DOI] [PubMed] [Google Scholar]
- 13. Ferrer I (2004) Stress kinases involved in tau phosphorylation in Alzheimer's disease, tauopathies and APP transgenic mice. Neurotox Res 6:469–475. [DOI] [PubMed] [Google Scholar]
- 14. Ferrer I, Martí E, Tortosa A, Blasi J (1998) Dystrophic neurites of senile plaques are defective in proteins involved in exocytosis and neurotransmission. J Neuropathol Exp Neurol 57:218–225. [DOI] [PubMed] [Google Scholar]
- 15. Ferrer I, Boada Rovira M, Sánchez Guerra ML, Rey MJ, Costa‐Jussá F (2004) Neuropathology and pathogenesis of encephalitis following amyloid beta immunization in Alzheimer's disease. Brain Pathol 14:11–20. [DOI] [PMC free article] [PubMed] [Google Scholar]
- 16. Ferrer I, Gomez‐Isla T, Puig B, Freixes M, Ribe E, Dalfó E, Avila J (2005) Current advances on different kinases involved in tau phosphorylation, and implications in Alzheimer's disease and tauopathies. Curr Alzheimer Res 2:3–18. [DOI] [PubMed] [Google Scholar]
- 17. Fukumoto H, Rosene DL, Moss MB, Raju S, Hyman BT, Irizarry MC (2004) Beta‐secretase activity increases with aging in human, monkey, and mouse brain. Am J Pathol 164:719–125. [DOI] [PMC free article] [PubMed] [Google Scholar]
- 18. Glickman MH, Ciechanover A (2002) The ubiquitin‐proteasome proteolytic pathway: destruction for the sake of construction. Physiol Rev 82:373–428. [DOI] [PubMed] [Google Scholar]
- 19. Gong B, Leznik E (2007) The role of ubiquitin C‐terminal hydrolase L1 in neurodegenerative disorders. Drug News Perspect 20:365–370. [DOI] [PubMed] [Google Scholar]
- 20. Hauptmann S, Keil U, Scherping I, Bonert A, Eckert A, Muller WE (2006) Mitochondrial dysfunction in sporadic and genetic Alzheimer's disease. FASEB J 19:2040–2041. [DOI] [PubMed] [Google Scholar]
- 21. Herschko A, Ciechanover A (1998) The ubiquitin system. Annu Rev Biochem 67:425–479. [DOI] [PubMed] [Google Scholar]
- 22. Hirai K, Aliev G, Nunomura A, Fujioka H, Russell RL, Atwood CS et al (2001) Mitochondrial abnormalities in Alzheimer's disease. J Neurosci 21:3017–3023. [DOI] [PMC free article] [PubMed] [Google Scholar]
- 23. Holsinger RM, McLean CA, Beyreuther K, Masters CL, Evin G (2002) Increased expression of the amyloid precursor beta‐secretase in Alzheimer's disease. Ann Neurol 51:783–786. [DOI] [PubMed] [Google Scholar]
- 24. Hussain I, Hawkins J, Harrison D, Hille C, Wayne G, Cutler L et al (2007) Oral administration of a potent and selective non‐peptidic BACE‐1 inhibitor decreases beta‐cleavage of amyloid precursor protein and amyloid‐beta production in vivo. J Neurochem 100:802–809. [DOI] [PubMed] [Google Scholar]
- 25. Iqbal K, Liu F, Gong CX, Alonso Adel C, Grundke‐Iqbal I (2009) Mechanisms of tau‐induced neurodegeneration. Acta Neuropathol (Berl) 118:53–69. [DOI] [PMC free article] [PubMed] [Google Scholar]
- 26. Jin M, Shepardson N, Yang T, Chen G, Walsh D, Selkoe DJ (2011) Soluble amyloid β‐protein dimers isolated from Alzheimer cortex directly induce Tau hyperphosphorylation and neuritic degeneration. Proc Natl Acad Sci U S A 108:5819–5824. [DOI] [PMC free article] [PubMed] [Google Scholar]
- 27. Keller JN, Hanni KB, Markesbery WR (2000) Impaired proteasome function in Alzheimer's disease. J Neurochem 75:436–439. [DOI] [PubMed] [Google Scholar]
- 28. Kidd M (1964) Alzheimer's disease: an electron microscopical study. Brain 87:307–320. [DOI] [PubMed] [Google Scholar]
- 29. Kish SJ, Bergeron C, Rajput A, Dozic S, Mastrogiacomo F, Chang LJ et al (1992) Brain cytochrome oxidase in Alzheimer's disease. J Neurochem 59:776–779. [DOI] [PubMed] [Google Scholar]
- 30. Kotzbauer PT, Giasson BI, Kravitz AV, Golbe LI, Mark MH, Trojanowski JQ, Lee VM (2004) Fibrillization of α‐synuclein and tau in familial Parkinson's disease caused by the A53T α‐synuclein mutation. Exp Neurol 187:279–288. [DOI] [PubMed] [Google Scholar]
- 31. Kuperstein I, Broersen K, Benilova I, Rozenski J, Jonckheere W, Debulpaep M et al (2010) Neurotoxicity of Alzheimer's disease Aβ peptides is induced by small changes in the Aβ42 to Aβ40 ratio. EMBO J 29:3408–3420. [DOI] [PMC free article] [PubMed] [Google Scholar]
- 32. Lang T, Jahn R (2008) Core proteins of the secretory machinery. Handb Exp Pharmacol 184:107–127. [DOI] [PubMed] [Google Scholar]
- 33. Larsen CN, Price JS, Wilkinson KD (1996) Substrate binding and catalysis by ubiquitin C‐terminal hydrolases: identification of two active site residues. Biochemistry 35:6735–6744. [DOI] [PubMed] [Google Scholar]
- 34. Li J, Rechsteiner M (2001) Molecular dissection of the 11S REG (PA28) proteasome activators. Biochimie 83:373–383. [DOI] [PubMed] [Google Scholar]
- 35. Li R, Lindholm K, Yang LB, Yue X, Citron M, Yan R et al (2004) Amyloid beta peptide load is correlated with increased beta‐secretase activity in sporadic Alzheimer's disease patients. Proc Natl Acad Sci U S A 101:3632–3637. [DOI] [PMC free article] [PubMed] [Google Scholar]
- 36. Liang B, Duan BY, Zhou XP, Gong JX, Luo ZG (2010) Calpain activation promotes BACE1 expression, amyloid precursor protein processing, and amyloid plaque formation in a transgenic mouse model of Alzheimer disease. J Biol Chem 285:27737–27744. [DOI] [PMC free article] [PubMed] [Google Scholar]
- 37. Lu Y, Li T, Qureshi HY, Han D, Paudel HK (2011) Early growth response 1 (Egr‐1) regulates phosphorylation of microtubule‐associated protein tau in mammalian brain. J Biol Chem 286:20569–20581. [DOI] [PMC free article] [PubMed] [Google Scholar]
- 38. Luse SA, Smith KR Jr (1964) The ultrastructure of senile plaques. Am J Pathol 44:553–563. [PMC free article] [PubMed] [Google Scholar]
- 39. Marwarha G, Dasari B, Prabhakara JP, Schommer J, Ghribi O (2010) β‐Amyloid regulates leptin expression and tau phosphorylation through the mTORC1 signaling pathway. J Neurochem 115:373–384. [DOI] [PMC free article] [PubMed] [Google Scholar]
- 40. McConlogue L, Buttini M, Anderson JP, Brigham EF, Chen KS, Freedman SB et al (2007) Partial reduction of BACE1 has dramatic effects on Alzheimer plaque and synaptic pathology in APP transgenic mice. J Biol Chem 282:26326–26334. [DOI] [PubMed] [Google Scholar]
- 41. Miners JC, Barua N, Kehoe PG, Gill S, Love S (2011) Aβ‐degrading enzymes: potential for treatment of Alzheimer disease. J Neuropathol Exp Neurol 70:944–959. [DOI] [PubMed] [Google Scholar]
- 42. Mohamed A, Cortez L, de Chaves EP (2011) Aggregation state and neurotoxic properties of Alzheimer β‐amyloid peptide. Curr Protein Pept Sci 12:235–257. [DOI] [PubMed] [Google Scholar]
- 43. Moreira PI, Santos MS, Oliveira CR (2007) Alzheimer's disease: a lesson from mitochondrial dysfunction. Antioxid Redox Signal 9:1621–1630. [DOI] [PubMed] [Google Scholar]
- 44. Morrison JH, Hof PR (2002) Selective vulnerability of corticocortical and hippocampal circuits in aging and Alzheimer's disease. Prog Brain Res 136:467–486. [DOI] [PubMed] [Google Scholar]
- 45. Muntané G, Dalfó E, Martinez A, Ferrer I (2008) Phosphorylation of tau and alpha‐synuclein in synaptic‐enriched fractions of the frontal cortex in Alzheimer's disease, and in Parkinson's disease and related α‐synucleinopathies. Neuroscience 152:913–923. [DOI] [PubMed] [Google Scholar]
- 46. Mustafiz T, Portelius E, Gustavsson MK, Hölttä M, Zetterberg H, Blennow K et al (2011) Characterization of the brain β‐amyloid isoform pattern at different ages of Tg2576 mice. Neurodegener Dis 8:352–363. [DOI] [PubMed] [Google Scholar]
- 47. Mutisya EM, Bowling AC, Beal MF (1994) Cortical cytochrome oxidase activity is reduced in Alzheimer's disease. J Neurochem 63:2179–2184. [DOI] [PubMed] [Google Scholar]
- 48. Oddo S (2008) The ubiquitin‐proteasome system in Alzheimer's disease. J Cell Mol Med 12:363–373. [DOI] [PMC free article] [PubMed] [Google Scholar]
- 49. Pérez‐Gracia E, Torrejón‐Escribano B, Ferrer I (2008) Dystrophic neurites of senile plaques in Alzheimer's disease are deficient in cytochrome C oxidase. Acta Neuropathol (Berl) 116:261–268. [DOI] [PubMed] [Google Scholar]
- 50. Piccini A, Zanusso G, Borghi R, Noviello C, Monaco S, Russo R et al (2007) Association of a presenilin 1 S170F mutation with a novel Alzheimer disease molecular phenotype. Arch Neurol 64:738–745. [DOI] [PubMed] [Google Scholar]
- 51. Pooler AM, Hanger DP (2010) Functional implications of the association of tau with the plasma membrane. Biochem Soc Trans 38:1012–1015. [DOI] [PubMed] [Google Scholar]
- 52. Puig B, Gómez‐Isla T, Ribé E, Cuadrado M, Torrejón‐Escribano B, Dalfó E, Ferrer I (2004) Expression of stress‐activated kinases c‐Jun N‐terminal kinase (SAPK/JNK‐P) and p38 kinase (p38‐P), and tau hyperphosphorylation in neurites surrounding betaA plaques in APP Tg2576 mice. Neuropathol Appl Neurobiol 30:491–502. [DOI] [PubMed] [Google Scholar]
- 53. Rudrabhatla P, Pant HC (2011) Role of protein phosphatase 2A in Alzheimer's disease. Curr Alzheimer Res 8:623–632. [DOI] [PubMed] [Google Scholar]
- 54. Savonenko A, Xu GM, Melnikova T, Morton JL, Gonzales V, Wong MP et al (2005) Episodic‐like memory deficits in the APPswe/PS1dE9 mouse model of Alzheimer's disease: relationships to β‐amyloid deposition and neurotransmitter abnormalities. Neurobiol Dis 18:602–617. [DOI] [PubMed] [Google Scholar]
- 55. Sepulveda‐Falla D, Matschke J, Bernreuther C, Hagel C, Puig B, Villegas A et al (2011) Deposition of hyperphosphorylated tau in cerebellum of PS1 E280A Alzheimer's disease. Brain Pathol 21:452–463 [Epub ahead of print; doi:10.1111/j.1750‐3639.2010.00469.x]. [DOI] [PMC free article] [PubMed] [Google Scholar]
- 56. Steiner H (2008) The catalytic core of gamma‐secretase: presenilin revisited. Curr Alzheimer Res 5:147–157. [DOI] [PubMed] [Google Scholar]
- 57. Tamagno E, Bardini P, Guglielmotto M, Danni O, Tabaton M (2006) The various aggregation states of beta‐amyloid 1‐42 mediate different effects on oxidative stress, neurodegeneration, and BACE‐1 expression. Free Radic Biol Med 41:202–212. [DOI] [PubMed] [Google Scholar]
- 58. Terry RD, Gonatas NK, Weiss M (1964) Ultrastuctural studies in Alzheimer's presenile dementia. Am J Pathol 44:269–297. [PMC free article] [PubMed] [Google Scholar]
- 59. Tseng BP, Green KN, Chan JL, Blurton‐Jones M, LaFerla FM (2008) Aβ inhibits the proteasome and enhances amyloid and tau accumulation. Neurobiol Aging 29:1607–1618. [DOI] [PMC free article] [PubMed] [Google Scholar]
- 60. Varghese M, Zhao W, Wang J, Cheng A, Qian X, Chaudhry A et al (2011) Mitochondrial bioenergetics is defective in presymptomatic Tg2576 AD mice. Transl Neurosci 2:1–5. [DOI] [PMC free article] [PubMed] [Google Scholar]
- 61. Venugopal C, Demos CM, Rao KS, Pappolla MA, Sambamurti K (2008) β‐secretase: structure, function, and evolution. CNS Neurol Disord Drug Targets 7:278–294. [DOI] [PMC free article] [PubMed] [Google Scholar]
- 62. Vnek N, Rothblat LA (1996) The hippocampus and long‐term object memory in the rat. J Neurosci 16:2780–2787. [DOI] [PMC free article] [PubMed] [Google Scholar]
- 63. Voges D, Zwickl P, Baumeister W (1999) The 26 S proteasome: a molecular machine designed for controlled proteolysis. Annu Rev Biochem 68:1015–1068. [DOI] [PubMed] [Google Scholar]
- 64. Wallace DC, Fan W (2010) Energetics, epigenetics, mitochondrial genetics. Mitochondrion 10:12–31. [DOI] [PMC free article] [PubMed] [Google Scholar]
- 65. Walsh DM, Selkoe DJ (2007) Aβ oligomers—a decade of discovery. J Neurochem 101:1172–1184. [DOI] [PubMed] [Google Scholar]
- 66. Waxman EA, Giasson BI (2011) Induction of intracellular tau aggregation is promoted by α‐synuclein seeds and provides novel insights into the hyperphosphorylation of tau. J Neurosci 31:7604–7618. [DOI] [PMC free article] [PubMed] [Google Scholar]
- 67. Wirths O, Weis J, Szczygielski J, Multhaup G, Bayer TA (2006) Axonopathy in an APP/PS1 transgenic mouse model of Alzheimer's disease. Acta Neuropathol (Berl) 111:312–319. [DOI] [PubMed] [Google Scholar]
- 68. Woodruff‐Pak DS (2008) Animal models of Alzheimer's disease: therapeutic implications. J Alzheimers Dis 15:507–521. [DOI] [PubMed] [Google Scholar]
- 69. Yang LB, Lindholm K, Yan R, Citron M, Xia W, Yang XL et al (2003) Elevated beta‐secretase expression and enzymatic activity detected in sporadic Alzheimer disease. Nat Med 9:3–4. [DOI] [PubMed] [Google Scholar]
- 70. Yao J, Irwin RW, Zhao L, Nilsen J, Hamilton RT, Brinton RD (2009) Mitochondrial bioenergetic deficit precedes Alzheimer's pathology in female mouse model of Alzheimer's disease. Proc Natl Acad Sci U S A 106:14670–14675. [DOI] [PMC free article] [PubMed] [Google Scholar]
- 71. Zhao J, Fu Y, Yasvoina M, Shao P, Hitt B, O'Connor T et al (2007) β‐site amyloid precursor protein cleaving enzyme 1 levels become elevated in neurons around amyloid plaques: implications for Alzheimer's disease pathogenesis. J Neurosci 27:3639–3649. [DOI] [PMC free article] [PubMed] [Google Scholar]