SUMMARY
Limiting the metabolic competition in the tumor microenvironment (TME) may increase the effectiveness of immunotherapy. Because of its critical role in glucose metabolism of activated T cells, CD28 signaling has been proposed as a T-cell metabolic biosensor1. Conversely, CTLA-4 engagement has been shown to down-regulate T-cell glycolysis1. Here, we investigated the impact of CTLA-4 blockade on the metabolic fitness of intra-tumor T cells in relationship to the tumor glycolytic capacity. We found that CTLA-4 blockade promotes immune cell infiltration and metabolic fitness especially in glycolysis-low tumors. Accordingly, anti-CTLA-4 achieved better therapeutic outcomes in mice bearing glycolysis-defective tumors. Intriguingly, tumor-specific CD8+ T-cell responses correlated with phenotypic and functional destabilization of tumor-infiltrating regulatory T cells (Tregs) toward IFN-γ- and TNF-α-producing cells in glycolysis-defective tumors. By mimicking the highly and poorly glycolytic TME in vitro, we show that the effect of CTLA-4 blockade to promote Treg destabilization is dependent on Treg glycolysis and CD28 signaling. These findings indicate that decreasing tumor competition for glucose may facilitate the therapeutic activity of CTLA-4 blockade, thus supporting its combination with inhibitors of tumor glycolysis. Moreover, these results reveal a new mechanism through which anti-CTLA-4 interferes with Treg function in the presence of glucose.
Tumors glycolysis limits immune fitness
Cellular energy metabolism reprogramming is a critical hallmark of cancer2. High glucose consumption and lactate production by tumor cells restrict nutrient availability in the TME for effector T cells, which also rely on glycolysis to proliferate and function3–5. We corroborated the negative impact of tumor glucose metabolism on T-cell function using the highly glycolytic murine mammary carcinoma 4T16–8. We found that 4T1 cells, cultured either alone or with activated T cells, consume more glucose and produce more lactate than activated T-cell monocultures (Extended Data Figure 1a). In the presence of 4T1 cells, or similar non-toxic concentrations of exogenous lactate (Extended Data Figure 1b), T cells were significantly less activated and viable (Extended Data Figure 1c,d), indicating the negative impact of tumor glycolysis on T-cell function and potentially response to immunotherapy. To explore the role of tumor glycolysis in the response to immunotherapy, we correlated tumor immune infiltration and glycolysis before and after CTLA-4 blockade using RNA sequencing data from advanced melanoma patients treated with ipilimumab9,10. At baseline, expression of glucose catabolism genes was frequently negatively correlated with infiltration of major immune cell subsets (Figure 1a left, Extended Data Figure 1e), in agreement with previous observations11–13, suggesting that tumor glycolysis may contribute to a non-inflamed tumor phenotype. After treatment with ipilimumab, these negative correlations were alleviated, with some glycolysis-related genes becoming positively correlated with most immune cell subsets (Figure 1a right, Extended Data Figure 1f). However, key glycolytic genes, such as the critical enzyme subunit for lactate production, LDHA, and the lactate transporter MCT1 (SLC16A1), remained inversely correlated with immune infiltrates after ipilimumab treatment (Figure 1a right), suggesting that anti-CTLA-4 alone may not be sufficient to potentiate immune cell fitness in highly glycolytic tumors overexpressing these genes. We investigated these effects in a more controlled setting, by comparing a glycolysis-defective 4T1 variant, where LDHA was knocked down (4T1-KD), with the scramble-shRNA-transfected 4T1 control (4T1-Sc) (Extended Data Figure 2a). 4T1-KD displayed decreased glycolytic capacity and grew slightly but significantly slower than 4T1-Sc in immunocompetent mice (Extended Data Figure 2b,c), pointing to increased immune sensitivity. CTLA-4 blockade did not alter the growth of these tumors and by resecting 4T1-Sc and 4T1-KD lesions 3 days apart, we could equalize their size for downstream analyses (Extended Data Figure 2d). In this setting, positive correlations between glycolysis-related genes and immune cell subsets became particularly apparent in glycolysis-defective 4T1-KD tumors upon CTLA-4 blockade (Figure 1b,c). In these tumors, where LDHA is selectively down-regulated in tumor cells (Extended Data Figure 2a,e), we observed positive correlations between LDHA expression and the immune infiltrate, which were eventually amplified by CTLA-4 blockade, pointing to activation of glycolysis in immune cells (Figure 1c, right). This suggested that glycolysis-low tumors may be more responsive to CTLA-4 blockade, while treatment of glycolysis-high tumors may require dampening tumor glycolysis together with anti-CTLA-4.
Figure 1. Correlation between tumor glycolysis and immune cell infiltration upon CTLA-4 blockade.
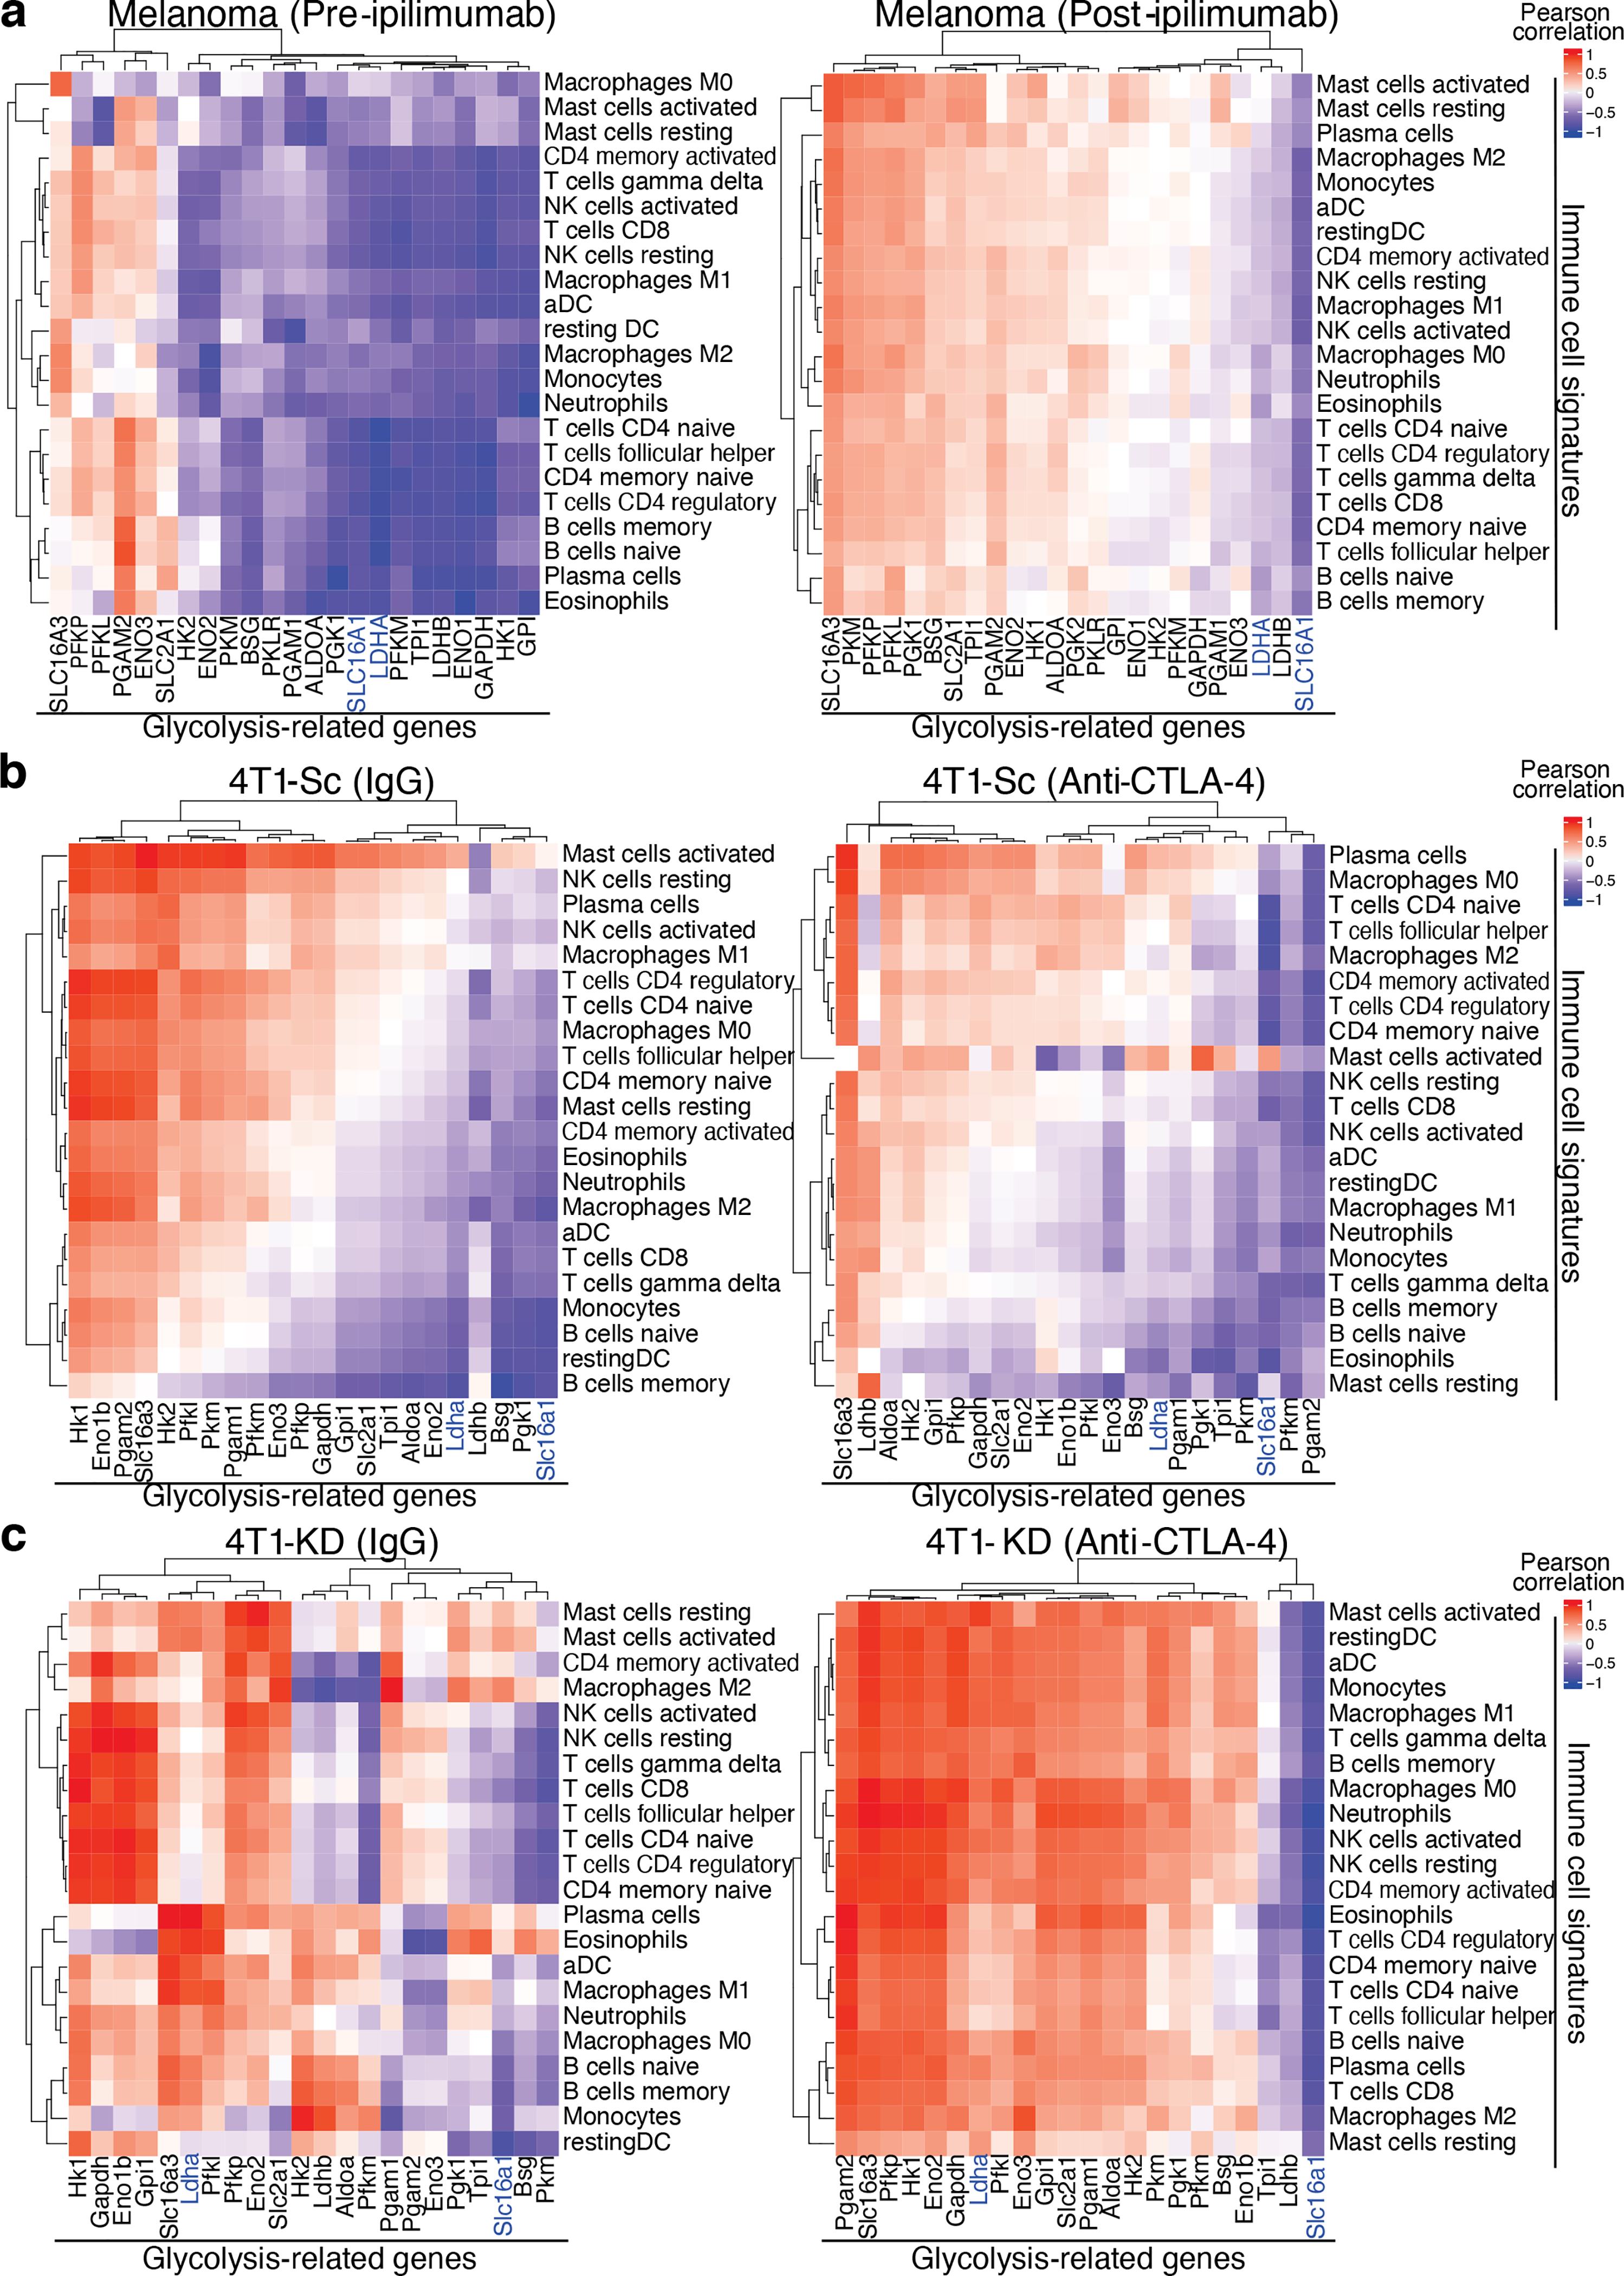
Heatmaps with identical color mapping setting showing indexes of Pearson correlation analyses between the indicated glycolysis-related genes and immune cell signatures by CIBERSORT in RNAseq data sets from (a) human melanoma samples at baseline (left) and after treatment with ipilimumab (right), and from 4T1-Sc (b) and 4T1-KD (c) tumors treated with anti-CTLA-4 (right) or the isotype control (IgG, left). (a) pre-ipilimumab, n=7; post-ipilimumab, n=15. (b) IgG, n=4; anti-CTLA-4, n=5. (c) n=5/treatment. SLC16A1 (MCT1) and LDHA are highlighted in blue.
LDHA-KD tumors better respond to anti-CTLA-4
We next investigated the impact of slowing tumor glycolysis on the efficacy of CTLA-4 blockade and the underlying mechanisms. To simulate the clinical management of breast cancer, we treated mice orthotopically implanted with 4T1-KD or 4T1-Sc cells with anti-CTLA-4 before surgical tumor resection. Again, in these experiments, we resected 4T1-KD and 4T1-Sc tumors 3 days apart to equalize tumor size on the day of surgery (Figure 2a and Extended Data Figure 2d). Importantly, LDH activity remained potently down-regulated in 4T1-KD vs. 4T1-Sc tumors up to the day of surgery (Extended Data Figure 2e). Neoadjuvant CTLA-4 blockade significantly prolonged survival in 4T1-KD- but not 4T1-Sc-bearing mice (Figure 2a). To clarify the immunologic nature of this effect, we re-implanted disease-free mice ~100 days after anti-CTLA-4 and surgical resection of 4T1-KD tumors with either 4T1-KD or the more aggressive 4T1-Sc model. The growth of both 4T1-Sc and 4T1-KD was significantly delayed in the re-implanted compared to naïve control mice (Figure 2b). Despite the high number of tumor cells re-injected (n=106), ~20–25% of these mice completely eradicated a second tumor implantation, especially with 4T1-KD (n=2/4 tumor-free upon 4T1-KD, n=0/4 tumor-free upon 4T1-Sc; Figure 2b). This response was associated with greater expansion and maturation in 4T1-KD-re-implanted mice of anti-tumor CD8+ T cells recognizing the 4T1-associated antigen AH1 (Figure 2c,d)14. In contrast, mice surviving after neoadjuvant anti-CTLA-4 and surgical resection of 4T1-Sc tumors were not able to control the growth of re-implanted 4T1-Sc tumors (Extended Data Figure 2f). This underscored the importance of limiting tumor glycolysis for the development of long-lasting memory anti-tumor responses upon anti-CTLA-4.
Figure 2. Long-lasting responses to neoadjuvant anti-CTLA-4 in LDHA-KD-tumor-bearing mice.
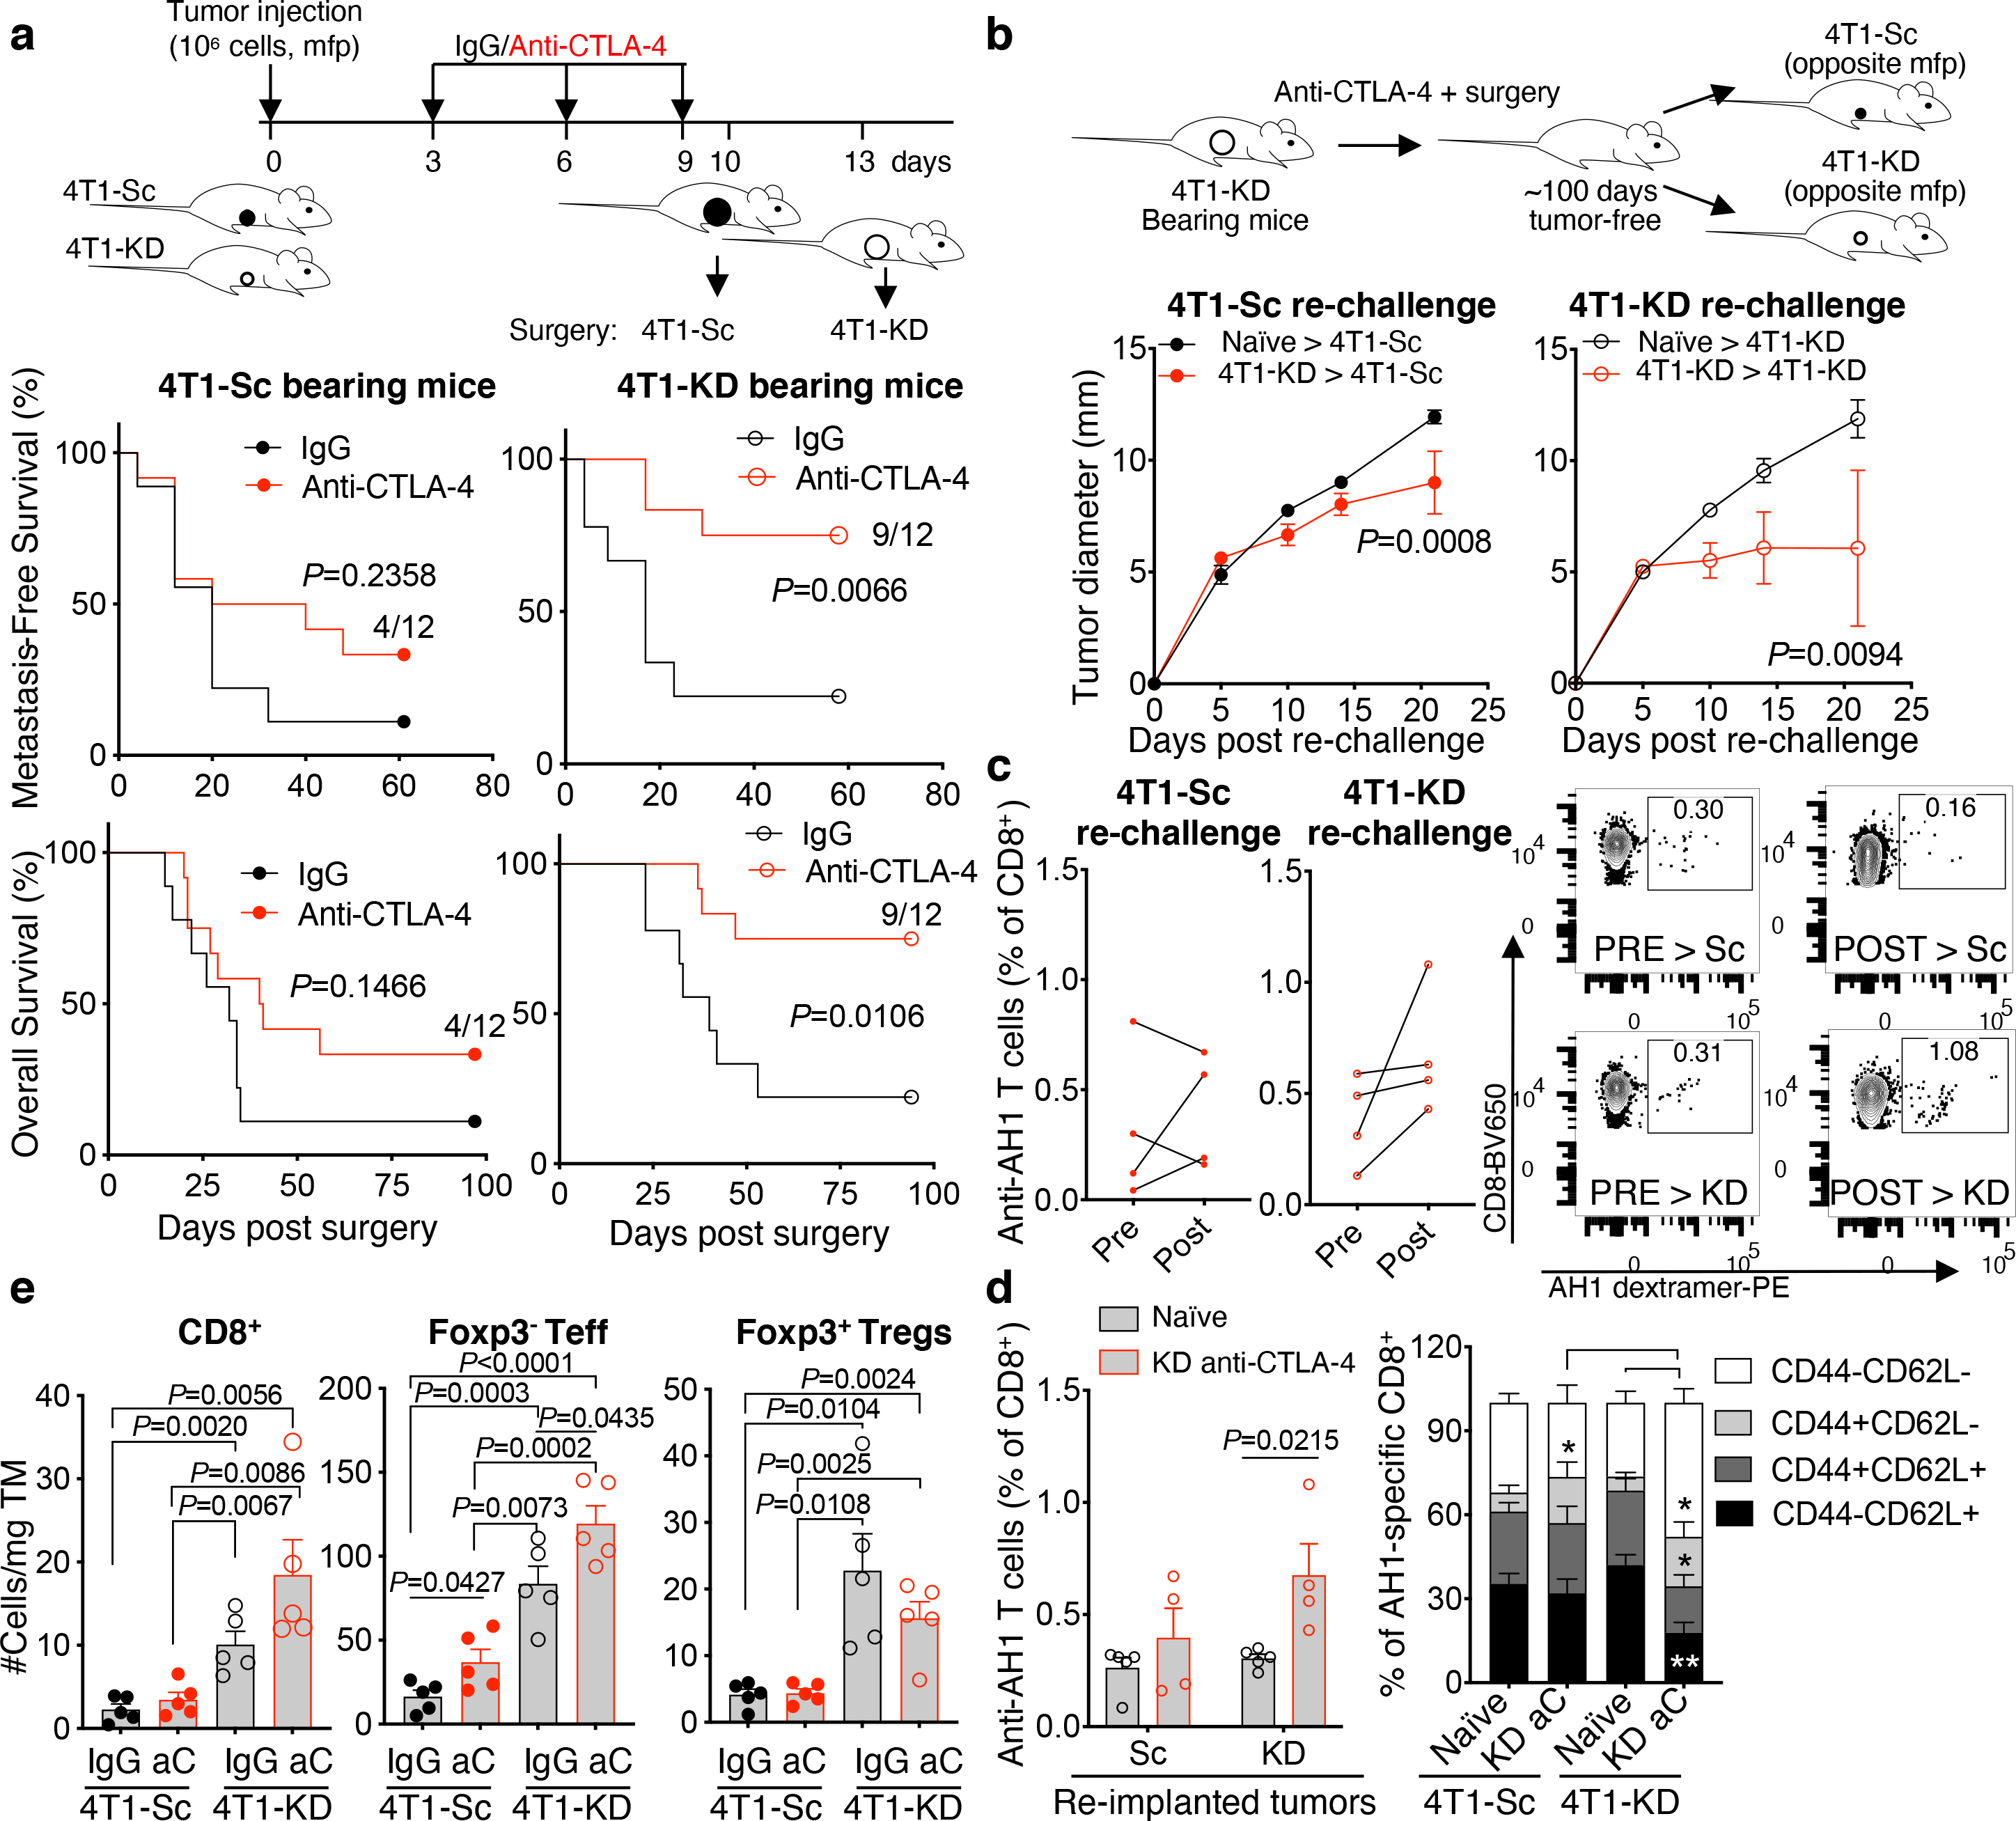
(a) Metastasis-free and overall survival in BALB/c mice implanted in the mammary fat pad (mfp) with 106 4T1-Sc or 4T1-KD cells and treated with 3 cycles of anti-CTLA-4 (9D9 IgG2b; n=12) or IgG control (n=9) before primary tumor surgical resection (1 representative of 3 independent experiments; log-rank test). (b) Tumor growth upon re-injection of 106 4T1-Sc or 4T1-KD cells in survivor mice in the anti-CTLA-4-treated 4T1-KD group ~100 days after surgery (n=4/group) in comparison with treatment-naïve mice (n=5) (mean ± SEM; 2-way ANOVA with Bonferroni’s correction). (c) Frequency and representative flow cytometry plots of circulating anti-tumor AH1-specific CD8+ T cells before (pre) and one week after (post) 4T1-Sc (left) or 4T1-KD (right) re-implantation in survivor mice upon neoadjuvant anti-CTLA-4 as in (b). (d) Frequency (left) and (right) memory phenotype (CD44 vs. CD62L expression) in circulating AH1-specific CD8+ T cells in survivor mice as in (b) (n=4/group) or treatment-naïve mice (n=5/group) one week after injection with 4T1-Sc or 4T1-KD (mean ± SEM; 2-sided unpaired t test; n=1 experiment with the IgG2b 9D9 anti-CTLA-4; similar results were obtained with the IgG2a 9D9 antibody). (e) Quantification of tumor-infiltrating T cells by flow cytometry in the indicated treatment groups (n=5 mice/groups; mean ± SEM; 2-sided unpaired t test; 1 representative of 2 independent experiments). * = P<0.05; ** = P<0.01. aC, anti-CTLA-4; TM, tumor. Teff, effector CD4+Foxp3− T cells.
We next examined for immune changes unique to 4T1-KD-bearing mice responding to neoadjuvant anti-CTLA-4. For this, we either resected or injected 4T1-Sc and 4T1-KD tumors 3 days apart, which produced similar-size tumors and similar survival outcomes (Figure 2a; Extended Data Figure 3a,b), and with the latter schedule allowing for simultaneous flow cytometry analyses. According to previous observations13,15, tumor LDHA down-regulation resulted in increased T-cell infiltration. Interestingly, this effect extended to Tregs and occurred irrespective of treatment (Figure 2e and Extended Data Figure 3c), pointing to functional modulation or changes in other immune cells in tumor or periphery as potential mechanisms underlying the enhanced activity of anti-CTLA-4 in LDHA-KD tumors. Peripheral Tregs increased after anti-CTLA-4 irrespective of tumor LDHA expression (Extended Data Figure 3c), in line with previous studies16. No specific changes in myeloid cells occurred in 4T1-KD-bearing animals treated with anti-CTLA-4 that could explain the different therapeutic outcomes (Extended Data Figure 3d). By contrast, tumor-infiltrating CD4+ T cells – especially Tregs, consistently up-regulated IFN-γ and TNF-α production in 4T1-KD-bearing mice upon anti-CTLA-4 in either schedule (Figure 3a,b; Extended Data Figure 4a–e). Observing this effect in Tregs was of particular interest to us. CTLA-4 overexpression in intratumoral Tregs may explain their preferential targeting by anti-CTLA-4 (Extended Data Figure 4f). Of note, IFN-γ production in Tregs positively correlated with IFN-γ expression in CD8+ T cells (Figure 3a,b), suggesting that Treg functional destabilization (i.e. IFN-γ production) could in turn favor activation of CD8+ tumor-infiltrating lymphocytes (TILs) in vivo. IFN-γ production by 4T1-KD-infiltrating Tregs upon anti-CTLA-4 was not associated with substantial loss of Foxp3 expression (Figure 3c) but was coupled with CD25 and/or CTLA-4 down-regulation (Figure 3d). Accordingly, CTLA-4lo Tregs, which proportionally increased after CTLA-4 blockade in 4T1-KD tumors (Figure 3d), preferentially expressed IFN-γ (Figure 3e).
Figure 3. Loss of Treg stability and CD8+ TIL activation in anti-CTLA-4-treated LDHA-KD tumors.
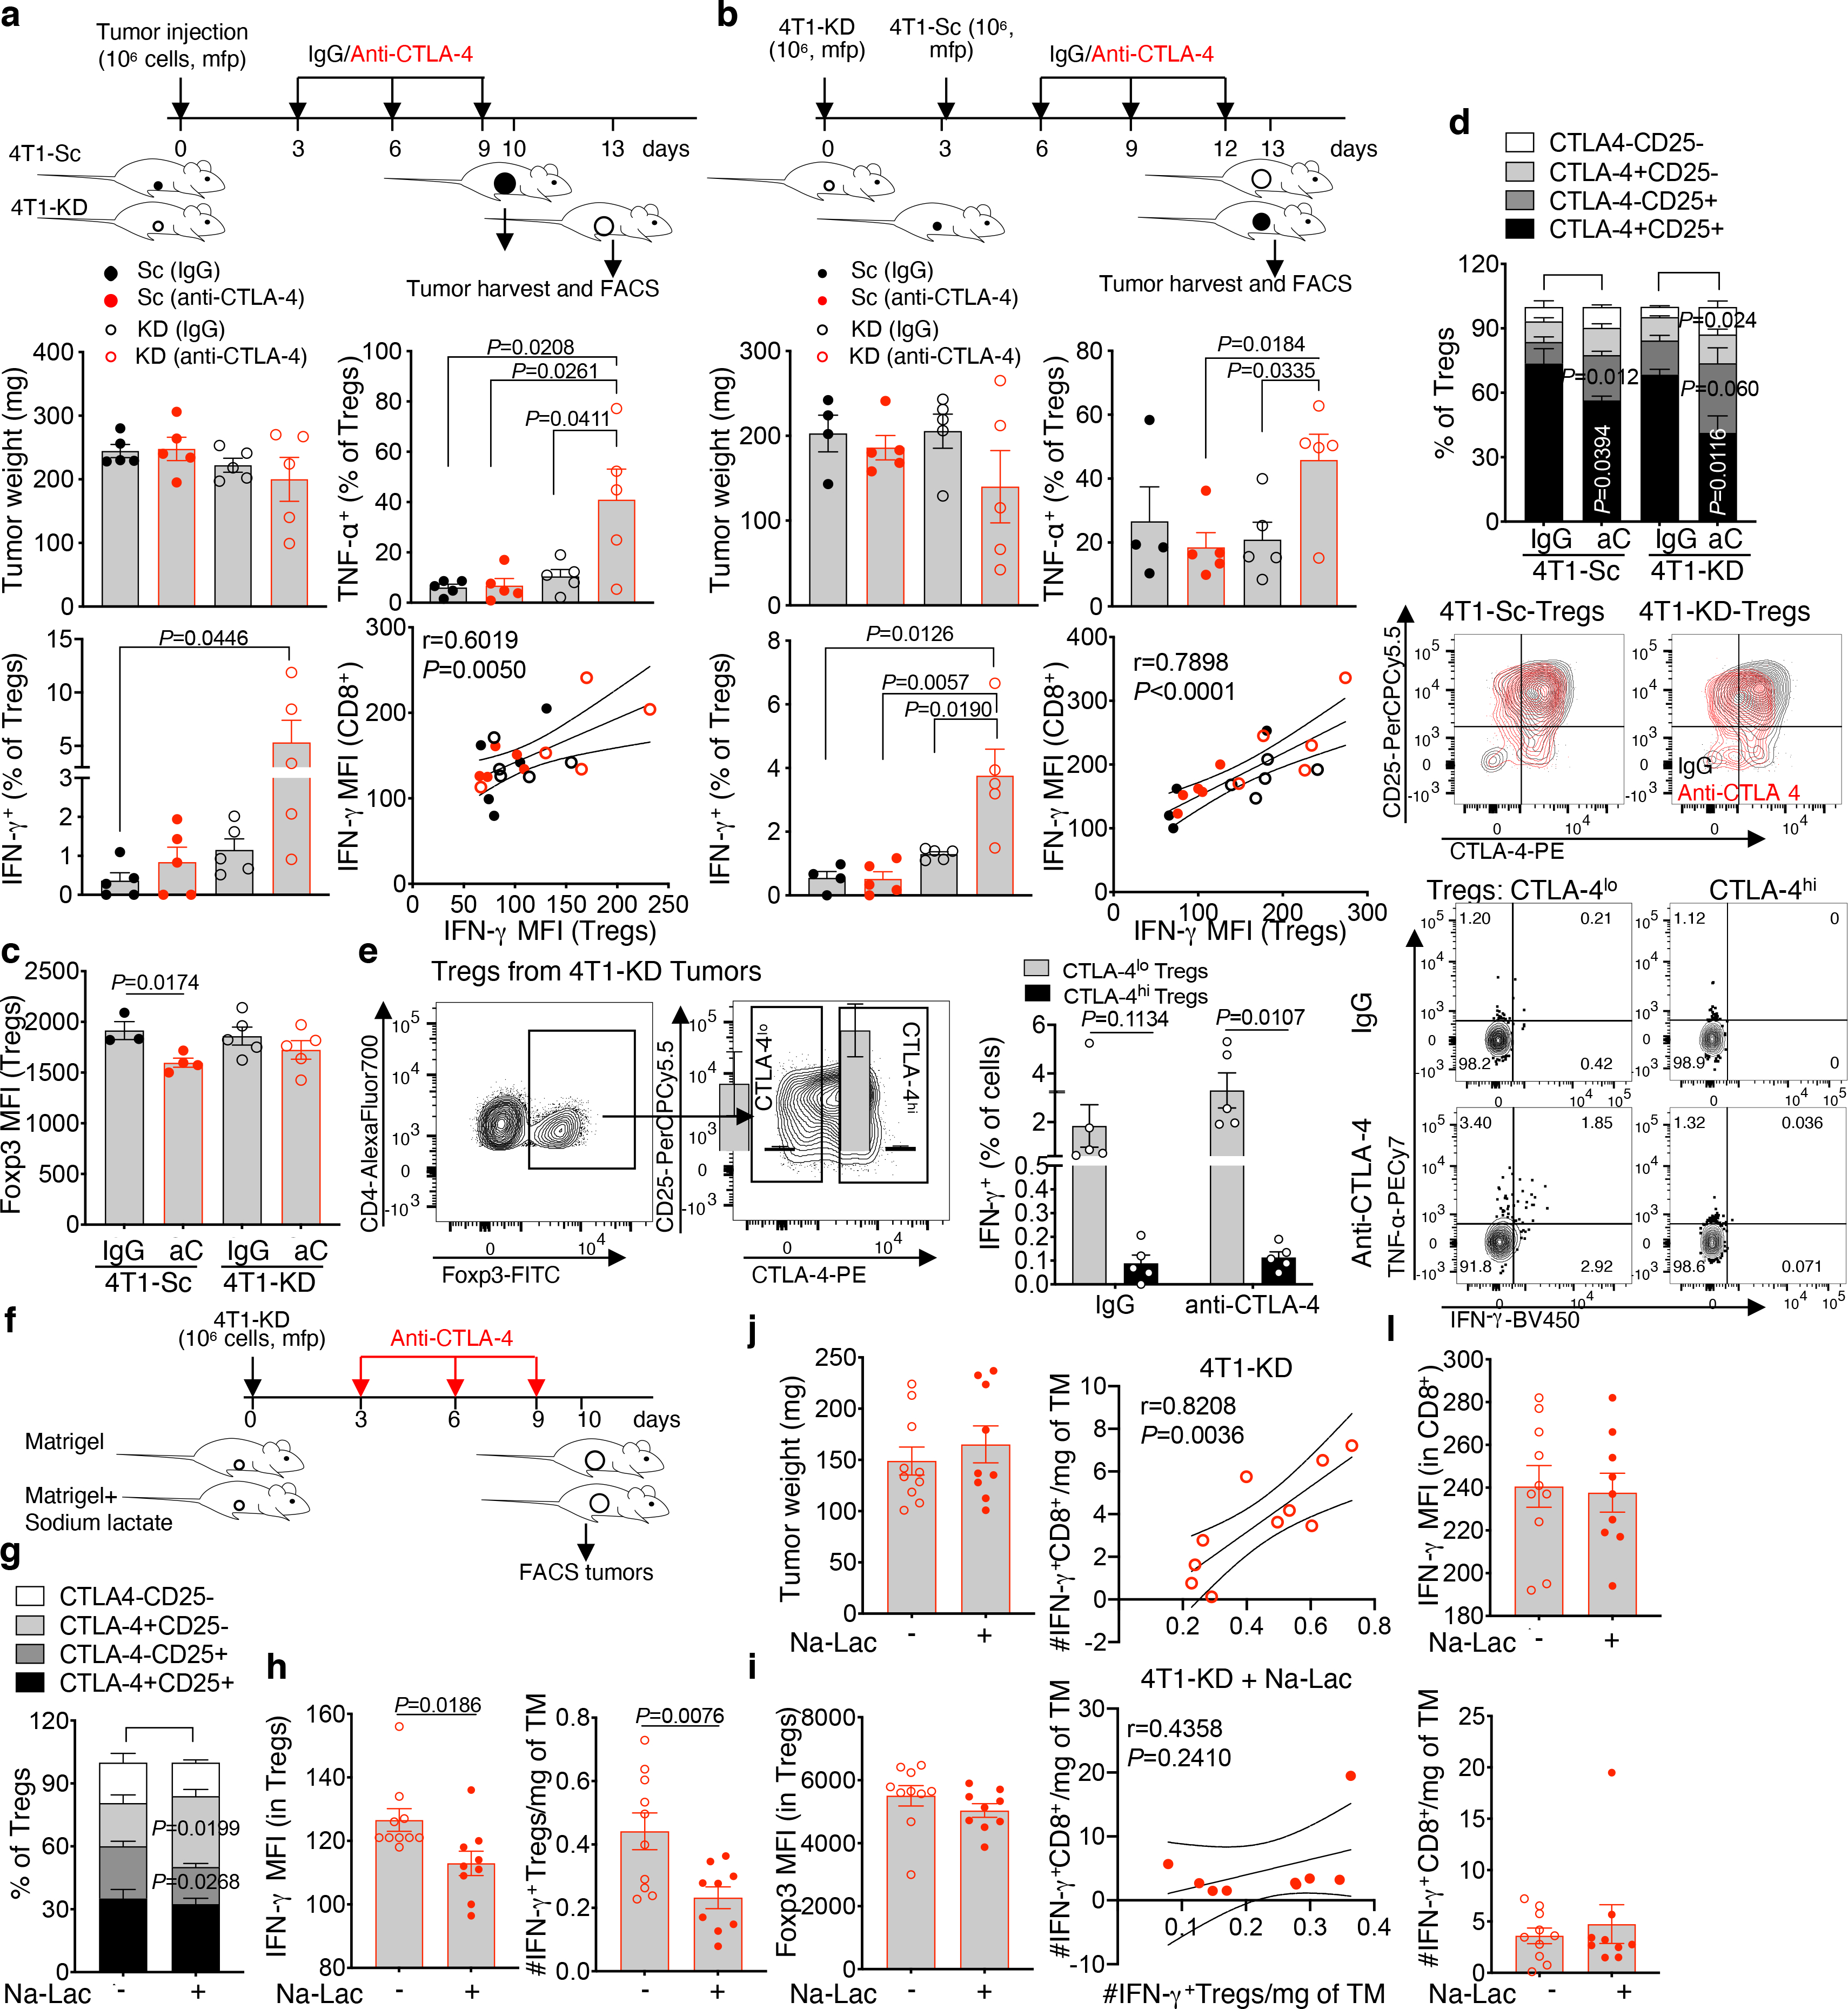
(a,b) Tumor weight, frequency of IFN-γ+ and TNF-α+ among CD45+CD4+Foxp3+ Tregs (mean ± SEM; 2-sided unpaired t test) and Pearson correlation analyses between IFN-γ expression in tumor-infiltrating Tregs and CD8+ T cells in 2 independent experiments where 4T1-Sc and 4T1-KD tumors were resected (a) or injected (b) 3 days apart to equalize tumor size (n=5 mice/group except for 4T1-Sc IgG in (b), n=4). (c,d) Flow cytometry of Foxp3 (c), CD25 and intracellular (not cross-blocked by the therapeutic antibody) CTLA-4 (d) in tumor-infiltrating Tregs in the indicated treatment groups (4T1-Sc IgG, n=3; 4T1-Sc anti-CTLA-4, n=4; 4T1-KD, n=5/group; mean ± SEM; 2-sided unpaired t test; 1 representative of 2 independent experiments). (e) Representative gating strategy for CTLA-4lo and CTLA-4hi 4T1-KD-infiltrating Tregs and quantification and representative plots of the indicated cytokines in these Treg subsets from IgG- and anti-CTLA-4-treated 4T1-KD tumors by flow cytometry (n=5 mice/group, mean ± SEM; 2-sided paired t test; 1 representative of 2 independent experiments). (f-l) BALB/c mice were implanted in mfp with 106 4T1-KD cells in Matrigel with or without 50 mM sodium lactate (Na-Lac) and treated with anti-CTLA-4 as indicated (f). Quantification of CTLA-4 and CD25 (g), IFN-γ (h) and (i) Foxp3 by flow cytometry in tumor-infiltrating Tregs, and (j) tumor weight at the end of the experiment (anti-CTLA-4, n=10; anti-CTLA-4+Na-Lac, n=9; mean ± SEM from 1 representative of 3 independent experiments; 2-sided unpaired t test). (k) Pearson correlation analyses between IFN-γ+ Tregs and IFN-γ+ CD8+ TILs normalized per gr of tumor (TM) and (l) quantification of IFN-γ by flow cytometry in CD8+ TILs from mice as in (f-i). MFI, median fluorescence intensity.
We confirmed these results in 3 additional experimental settings. First, we used the LDHA-KD 4T1 A3–8KD model generated with a different LDHA-targeting shRNA15, which we previously reported as having LDHA less down-regulated compared to the 4T1 A2–10KD cell variant used here as 4T1-KD15 corresponding to less severe impairments in glycolysis (Extended Data Figure 6c). In this setting, CTLA-4 blockade was slightly less effective and prevented metastasis formation in about 50% of the animals (Extended Data Figure 5a). In 4T1 A3–8KD similar to 4T1-KD tumors, CTLA-4 blockade led to Treg phenotypic instability (CD25/CTLA-4 down-regulation), increased IFN-γ production by Tregs and granzyme B by CD8+ TILs (Extended Data Figure 5b,c). Even in this setting, CTLA-4lo Tregs preferentially expressed IFN-γ and further up-regulated IFN-γ after anti-CTLA-4 (Extended Data Figure 5d). Accordingly, CTLA-4 expression and IFN-γ production in Tregs were inversely correlated, and IFN-γ production by CTLA-4lo Tregs positively correlated with granzyme B expression in CD8+ TILs (Extended Data Figure 5e). As a second approach, we perturbed Tregs more robustly by employing an IgG2a version of the anti-CTLA-4 clone 9D9, which binds to the mouse FcγRI more efficiently than the standard 9D9 IgG2b antibody17, better crosslinks CTLA-4 and has been reported to deplete tumor-infiltrating Tregs more efficiently in other tumor models16. In our experimental setting, neoadjuvant 9D9 IgG2a maximized metastasis protection and overall survival in mice bearing 4T1-KD, more extensively down-regulated CTLA-4+GITR+ intratumoral Tregs and more strongly up-regulated IFN-γ in the remaining tumor-infiltrating Tregs without affecting their Foxp3 expression (Extended Data Figure 5f–i). Again, we found that IFN-γ production by Tregs inversely correlated with Treg stability (CTLA-4 and GITR expression) and positively correlated with IFN-γ production in CD8+ TILs (Extended Data Figure 5j). Lastly, we investigated these effects in a different tumor model and mouse genetic background (C57BL/6J), by knocking down LDHA in the mouse melanoma B16F10 (B16-KD; Extended Data Figure 5k). B16-KD cells displayed lower LDH activity and glycolytic capacity than the scramble B16-Sc control (Extended Data Figure 5l,m). Similar to the effects in the 4T1 model, CTLA-4 blockade significantly down-regulated CTLA-4 and CD25 and increased IFN-γ expression in B16-KD- but not B16-Sc-infiltrating Tregs (Extended Data Figure 5n–p). Together, these findings suggested that inhibition of tumor glycolysis may promote the ability of CTLA-4 blockade to induce loss of Treg stability associated with the development of anti-tumor immunity.
Tumor glycolysis supports Treg stability
To clarify the link between tumor glycolysis and Treg stability in vivo, we implanted 4T1-KD in Matrigel plugs containing sodium lactate – a strategy that was shown to partially reverse the anti-tumor effect of LDHA-KD15,18 – and assessed Treg phenotypic and functional changes associated with CD8+ TIL activation after anti-CTLA-4 treatment. In this condition, intratumoral Treg stability was better retained (increased CTLA-4 and decreased IFN-γ), while Foxp3 expression and tumor burden were not substantially affected (Figure 3f–j). Furthermore, the positive correlation between IFN-γ-producing Tregs and CD8+ TILs was lost upon addition of lactate (Figure 3k). This effect appeared to be driven by IFN-γ changes in Tregs, as lactate did not directly affect IFN-γ-expressing CD8+ T cells (Figure 3l). We corroborated these results by maximizing tumor glycolysis (as opposed to exogenously supplying lactate into the TME). For this, we generated hyper-glycolytic 4T1 Rho-0 cells (4T1-EtBr) by ethidium bromide treatment in vitro to reduce mitochondrial function19 and compared and contrasted Tregs infiltrating these hyper-glycolytic tumors vs. glycolysis-defective 4T1-KD tumors. 4T1-EtBr cells tended to further up-regulate LDHA, displayed stronger LDH activity than 4T1-Sc or 4T1-KD cells and produced ATP mostly out of glycolysis, in sharp contrast with 4T1-KD cells which produced ATP mainly through mitochondria respiration (Extended Data Fig. 6a–c). 4T1-EtBr also appeared slightly more aggressive than 4T1-KD in vivo (Extended Data Fig. 6d). We found that CD4+ T cells infiltrating 4T1-EtBr vs. 4T1-KD tumors are enriched in Foxp3+ Tregs that are phenotypically and functionally more stable, expressing CTLA-4 and CD25 more broadly and producing less IFN-γ (Extended Data Fig. 6e–g). These results illustrated a direct relationship between tumor glycolysis and intratumoral Treg stability and suggested that the local glucose:lactate ratio may alter Treg susceptibility to anti-CTLA-4-mediated re-programming. In glycolysis-defective tumors, glucose may be more largely available and CTLA-4 blockade can more efficiently induce Tregs to metabolize glucose. Using a bilateral 4T1-Sc and 4T1-KD tumor system to control for nutrient input, we found that 4T1-KD cells take up glucose less efficiently and Tregs infiltrating these tumors increase glucose uptake upon anti-CTLA-4 (Extended Data Figure 6h–j). We confirmed these effects using a more precise system to detect intra-tumor Tregs for surface glucose staining with Foxp3-GFP transgenic C57BL/6J mice implanted with syngeneic B16-KD and B16-Sc tumors (Extended Data Figure 6k–m). Interestingly, increased glucose uptake in Tregs infiltrating glycolysis-defective B16-KD tumors was associated with the tendency of these Tregs to be less suppressive ex vivo (Extended Data Figure 6m,7a).
Glucose and CD28 axis limit Treg stability
We next studied in vitro the conditions leading to loss of Treg stability in glycolysis-defective tumors upon anti-CTLA-4 in vivo. 4T1-KD utilizes less glucose than 4T1-Sc in vitro as well (Figure 4a,b) and Tregs co-cultured with 4T1-KD vs. 4T1-Sc cells modestly, but significantly, up-regulated IFN-γ±TNF-α expression after anti-CTLA-4 treatment (Extended Data Figure 7c). Similarly, Tregs cultured in media conditioned by either 4T1-KD or the poorly glycolytic benign mammary gland cell line NMuMg produced more IFN-γ±TNF-α than Tregs exposed to 4T1-Sc-conditioned media, and anti-CTLA-4 enhanced this effect (Extended Data Figure 7d,e). We thus asked whether higher glucose availability in cultures with glycolysis-low tumors contributed to anti-CTLA-4-mediated Treg destabilization and whether this effect was linked to CD28 co-stimulation, which has been extensively shown to modulate T-cell glucose metabolism1,20. We found that CTLA-4 blockade directly enhances Treg glucose uptake and IFN-γ production in the presence of glucose (11 mM) and physiologic CD28 co-stimulation by irradiated B cells (Figure 4c,d) independent of mitochondrial metabolism (Extended Data Figure 8a). Conversely, blocking oxidative phosphorylation with oligomycin reduced Foxp3 expression and IL-10 production in Tregs (Extended Data Figure 8b), indicating that mitochondrial respiration is important for Treg integrity, as previously suggested21–23, and that forcing glycolysis in Tregs makes them more susceptible to losing their stability, in support of our new findings here. We then evaluated the impact of anti-CTLA-4-induced Treg glucose consumption on Treg suppression capacity in relationship to glucose loads and CD28 co-stimulation (Figure 4e). We found that anti-CTLA-4 inhibits Treg suppression and increases CD86 expression as a function of glucose concentration (Figure 4f,g and Extended Data Figure 8c,d). Importantly, this effect was lost with CD28-deficient Tregs (Extended Data Figure 8e), suggesting that anti-CTLA-4-mediated inhibition of Tregs suppression in the presence of glucose is dependent on CD28 signaling in Tregs. Direct CD28 co-stimulation using an agonist antibody fully overcame the need for glucose to counteract Treg suppression (Figure 4 h–j and Extended Data Figure 9a,b). However, despite complete Treg inhibition, CD28 agonism delayed CD8+ T-cell proliferation especially at low glucose concentrations (Extended Data Figure 9a). By titrating CD28 stimulation, we found that above a certain concentration (~0.05 μg/ml), anti-CD28 slows T-cell proliferation especially in low glucose (Extended Data Figure 9c), according to previous observations that in glucose-restricting conditions, CD28 co-stimulation triggers mitochondrial respiration in activated T cells, which less efficiently sustains proliferation20. In contrast to CTLA-4 blockade, inhibition of the other major immune checkpoint PD-1 did not affect Treg suppression, either when high glucose concentrations (11 mM) or PD-1+ Tregs were tested (Extended Data Figure 9d,e), and did not promote Treg glucose uptake in vitro or loss of Treg stability in vivo (Extended Data Figure 9f,g). Because anti-PD-1 acts downstream and requires CD28 signaling24,25, these results may be explained by high CTLA-4 expression in Tregs that prevents CD28 co-stimulation.
Figure 4. Glucose-dependent loss of Treg functional stability induced by CTLA-4 blockade.
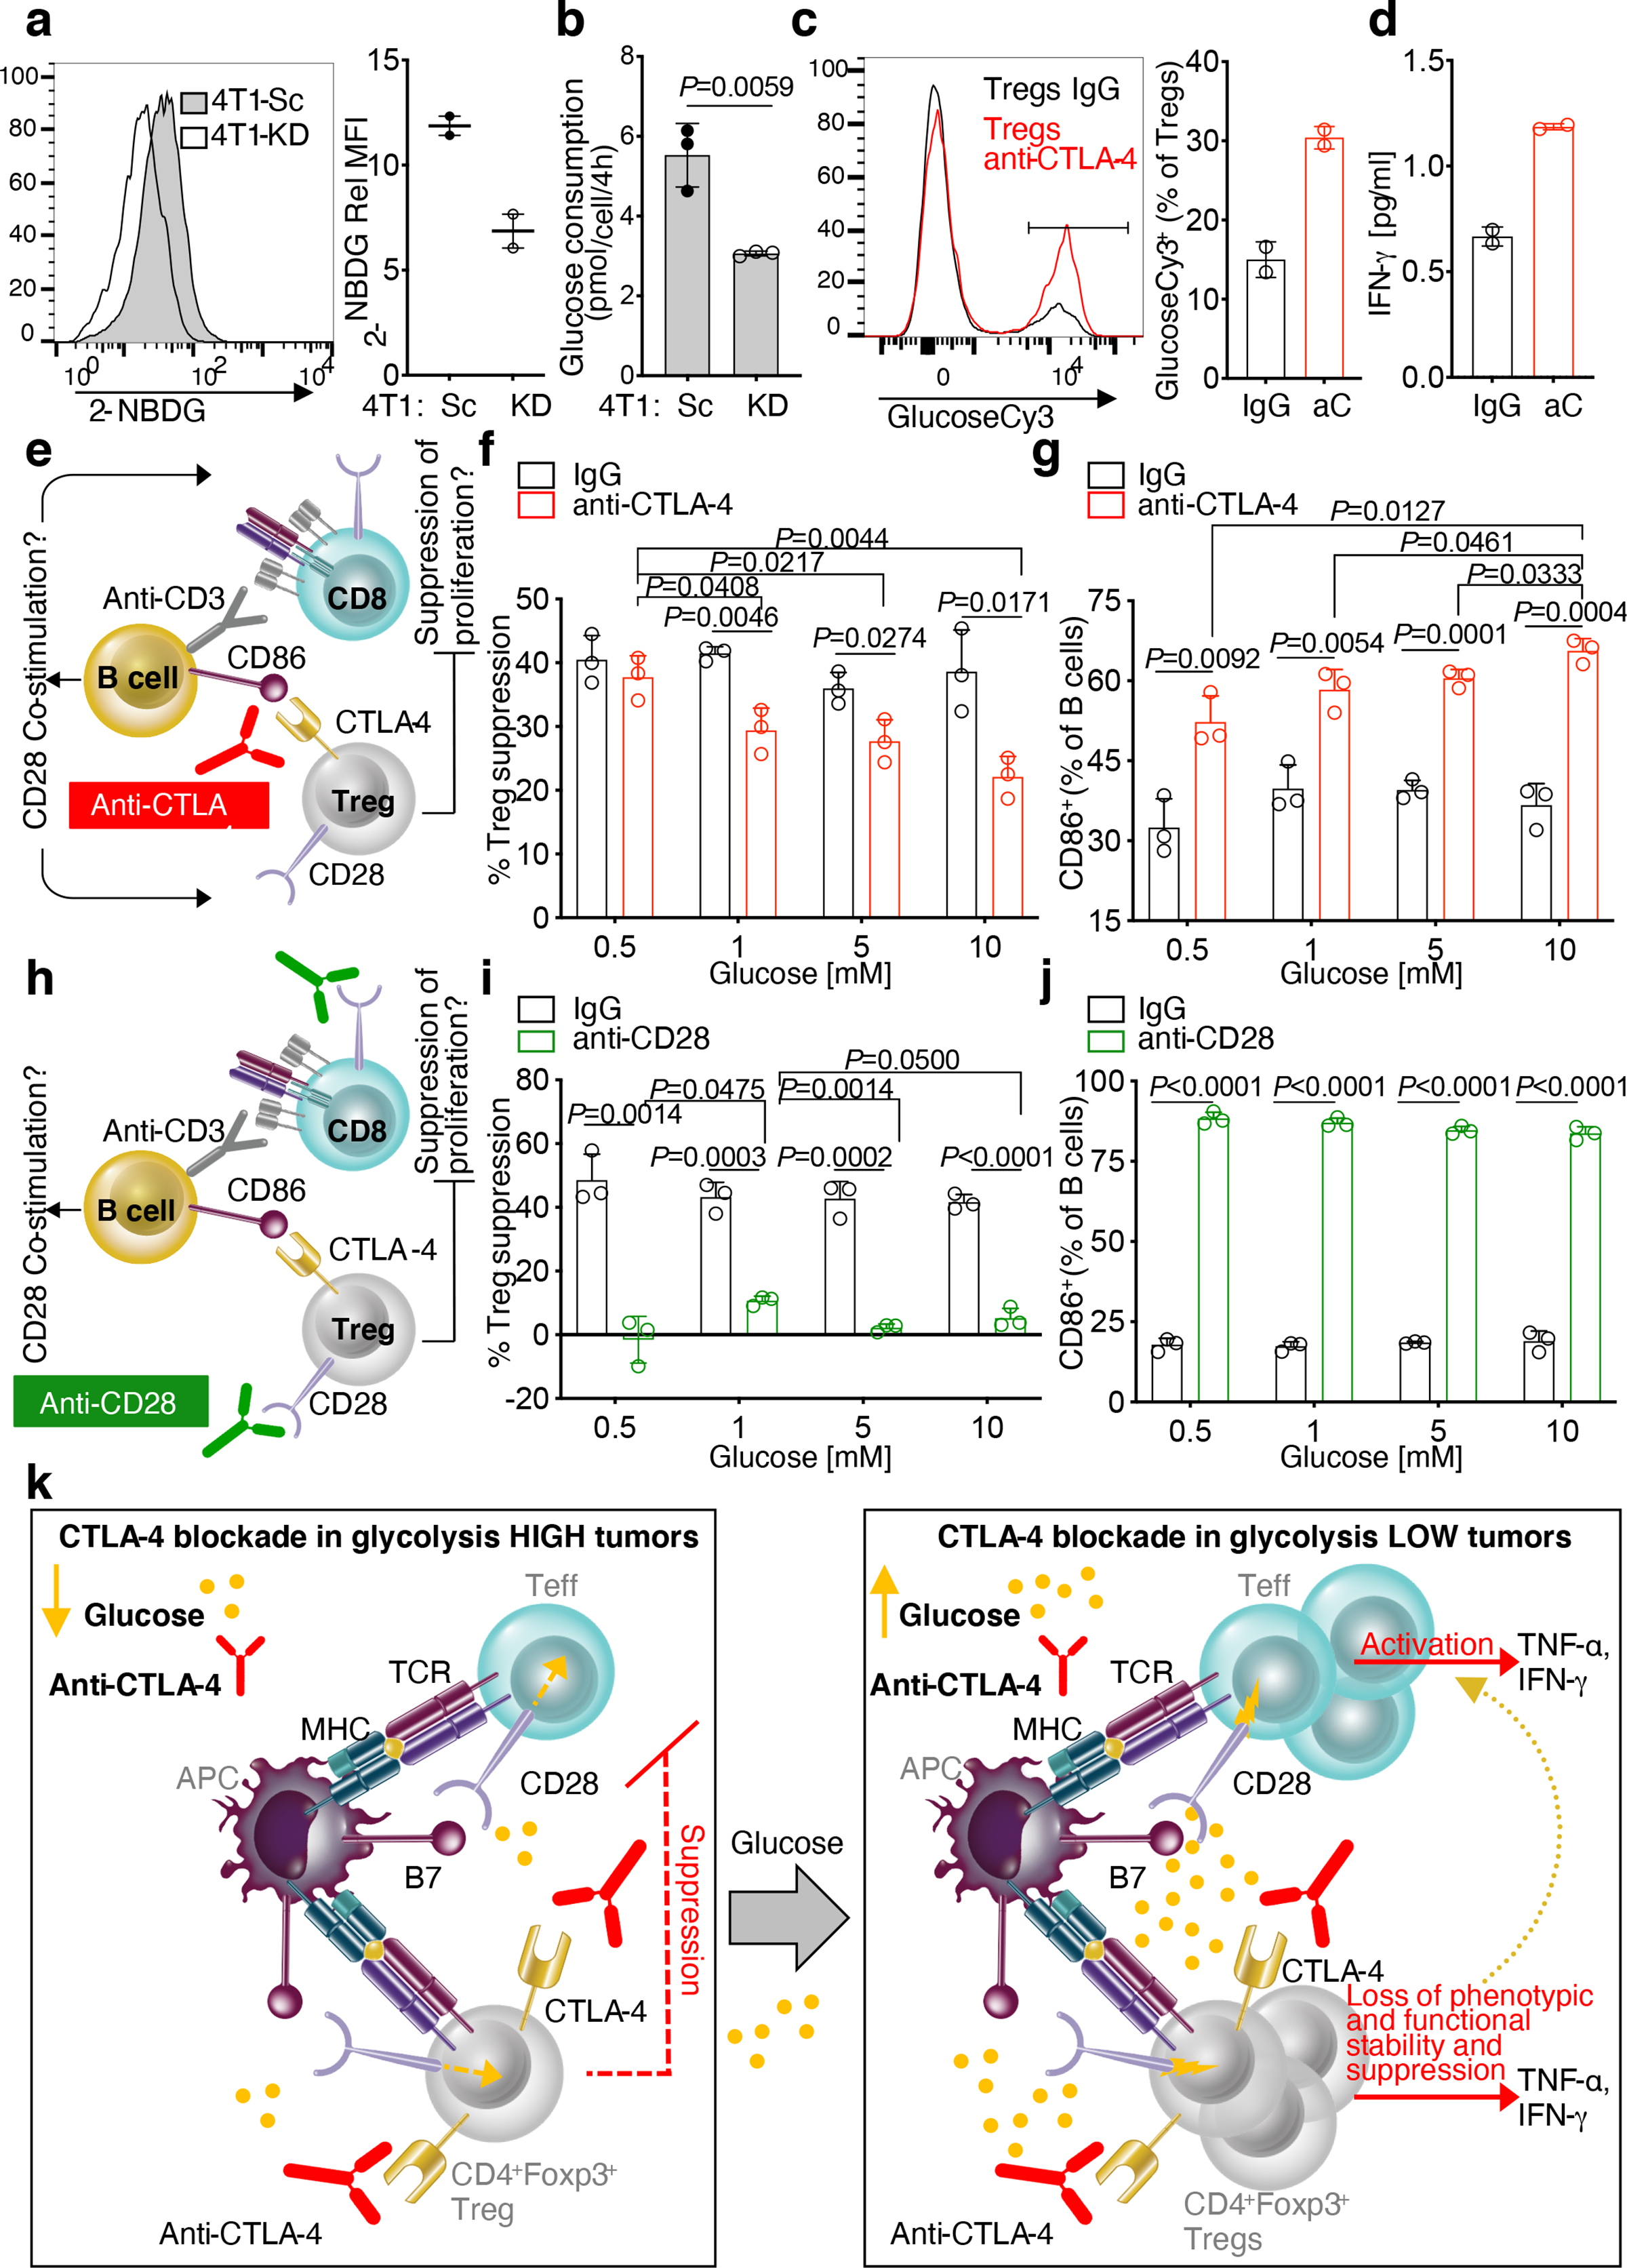
(a) Flow cytometry representative plot (left) and (right) quantification of 2-NBDG staining on 4T1-KD and 4T1-Sc cells in 2 independent experiments (Rel MFI, relative MFI: 2-NBDG MFI of stained samples relative to matched unstained control; n=2). (b) Glucose consumption by 4T1-KD vs. 4T1-Sc cells cultured in hypoxia (n=3; 1 representative of 2 independent experiments). (c) Flow cytometry representative plot (left) and (right) quantification of glucoseCy3 staining on Tregs treated with anti-CTLA-4 or IgG control in 11 mM glucose (n=2; 1 representative of 2 independent experiments). (d) Quantification of IFN-γ by Luminex-based bead immunoassay in supernatants from Treg cultures as in (c). (e-g) In vitro suppression assays with increasing glucose concentrations and anti-CTLA-4 or IgG control. (f) Percent Treg suppression of CD8+ T-cell proliferation relative to proliferation of CD8+ T cells cultured alone in the same treatment conditions (n=3; 1 representative of 3 independent experiments). (g) Percent of CD86-expressing B cells from cultures as in (f,g). (h-j) In vitro suppression assays with increasing glucose concentrations and anti-CD28 or IgG control. (i) Percent Treg suppression of CD8+ T-cell proliferation relative to proliferation of CD8+ T cells cultured alone in the same treatment conditions (n=3; 1 representative of 3 independent experiments). (j) Percent of CD86-expressing B cells from cultures as in (h,i). (a-j) Mean ± SD; 2-sided unpaired t test. (k) Model of loss of Treg functional stability according to glucose availability and CTLA-4 blockade. Under glucose restriction, such as in 4T1-Sc tumors, anti-CTLA-4 has limited activity against Treg-mediated immunosuppression of Teff (left). When competition for glucose is diminished, T cells better infiltrate the tumor and anti-CTLA-4 promotes Treg glucose metabolism via CD28 co-stimulation, leading to Treg functional destabilization and increased Teff activation (right).
Fitness opposes stability in glycolytic Tregs
To formally prove that anti-CTLA-4-mediated Treg destabilization in glycolysis-defective tumors depends on Treg glucose catabolism, we tested whether this effect is lost in mice with conditional Treg deletion of LDHA or the glucose transporter Glut1. We used B16-KD as a glycolysis-defective tumor model compatible with the genetic background of these mutant mice (C57BL/6). Upon CTLA-4 blockade, Glut1-deficient vs. control Tregs infiltrating glycolysis-defective tumors restored CTLA-4 and CD25 expression, less extensively up-regulated IFN-γ and TNF-α and were less suppressive ex vivo (Extended Data Figure 10a–e). Intriguingly, Glut1- or LDHA-deficient tumor-infiltrating Tregs displayed poor expansion and proliferation potential after treatment (Extended data Figure 10f–l). Similarly, LDHA-deficient Tregs remained less fit in culture despite high glucose concentrations (10 mM), and increasing CD28 co-stimulation further reduced their fitness to levels comparable to control Tregs activated in acute glucose restriction (0.5 mM) (Extended Data Figure 10m,n). Importantly, the prevalent Ki67-negative fraction in LDHA-deficient Tregs better retained suppressive markers upon activation (Extended Data Figure 10m,o). These observations reveal a dual implication for glycolysis in Tregs: it is needed to sustain Treg expansion, but it makes Tregs more susceptible to re-programmability, especially when CD28 can be engaged, such as upon CTLA-4 blockade. This also suggests that glucose is dispensable for active Treg suppression and that alternative sources of fuel can support this function.
Discussion
Previous studies have shown that glucose metabolism is dispensable for Treg differentiation and that Tregs utilize fatty acids as preferential metabolic substrates21,26,27. Our results indicate that Treg avoidance of glucose metabolism has functional significance and may be mediated by CTLA-4 overexpression, which by blocking CD28 signaling towards glucose utilization, can ensure Treg functional stability. We found that removal of this control with anti-CTLA-4 promotes CD28 co-stimulation and counteracts Treg suppression as a function of glucose availability both in vitro and in vivo (Figure 4k). A major outcome of CTLA-4 inactivation is CD28 ligand up-regulation on antigen presenting cells, which is associated with loss of Treg suppression28–30. However, whether this effect could result in enhanced Treg glucose metabolism was not known. Our findings point to glucose metabolism as a Treg functional vulnerability that is generally prevented by CTLA-4 overexpression. We demonstrate that CTLA-4 blockade achieves superior efficacy linked to anti-tumor immunologic memory in mice bearing tumors that can spare glucose for infiltrating immune cells and that this effect is associated with functional destabilization of Tregs toward IFN-γ-producing cells (Figure 4k). Aerobic glycolysis can enhance IFN-γ production in CD4+ T cells via 3 main mechanisms: by alleviating GAPDH-mediated inhibition of IFN-γ translation31, by increasing acetyl–coenzyme A for Ifng epigenetic modification32, and by sustaining Ca2+-NFAT signaling through phosphoenolpyruvate5. Tregs, forced to engage in glycolysis upon CTLA-4 blockade in the presence of glucose, may undergo similar mechanisms leading to IFN-γ up-regulation. Overall, these results suggest that CTLA-4 blockade can be best exploited to treat glycolysis-low tumors or in combination with inhibitors of tumor glycolysis33–36 that can increase glucose availability in the TME, thus maximizing Treg destabilization and anti-tumor immunity.
Material and Methods
Tumor cell lines
The murine mammary carcinoma 4T1 cell line was kindly provided by Dr. Fred Miller (Karmanos Cancer Institute) and the benign mammary gland NMuMg cell line by Dr. Jason Koutcher (MSK). Murine breast tissue cell lines were cultured in DMEM supplemented with 10% heat inactivated FBS, 25 mM glucose, 6 mM L-glutamine, 1 x penicillin/streptomycin, and 4 mg/L puromycin. The B16F10 mouse melanoma cell line was originally obtained from I. Fidler (M. D. Anderson Cancer Center, Houston, TX) and cultured in RPMI1640 supplemented with 10% inactivated FBS, 1× nonessential amino acids and 2 mM l-glutamine. Cell lines were authenticated by STR profiling or morphology and expression of specific antigens and were routinely tested for mycoplasma contamination. Tumor cells were transfected with SureSilencing™ LDHA-targeting shRNA plasmids (KD; A2= GTACGTCCATGATGCATATCT; A3= TGCCAACTGCAGGCTTCGATT) or scramble control plasmids (Sc= ggaatctcattcgatgcatac) (QIAGEN). Stable LDHA-KD (4T1 A2–10KD = 4T1-KD, 4T1 A3–8KD and B16-KD) and scramble control (4T1-Sc and B16-Sc) cell lines were generated as previously described15,37. Hyper-glycolytic/poorly oxidative Rho-0 cells were generated by in vitro treatment of 4T1 cells with ethidium bromide treatment (4T1-EtBr) as described19. LDHA modulation in these cell variants was confirmed at protein level by western blot, using a rabbit anti-LDHA antibody (1:1,000; Cell Signaling Technology, cat# 2012S) coupled with an HRP-conjugated anti-rabbit IgG (1:5,000; Cell Signaling Technology, cat#7074S) as secondary antibody, with vinculin (1:1,000, Santa Cruz, cat#sc-73614; revealed by an HRP-conjugated anti-mouse IgG, 1:5,000, Cell Signaling Technology, cat#7076S) or beta actin (1:5,000, Sigma, cat#A2103; revealed by Molecular Devices Evaluation Kit #R8202) as protein loading control, and at enzymatic activity level by using the Cytotoxicity Detection Kit PLUS (LDH) (Roche Diagnostics), as previously reported15. Altered glycolytic and mitochondrial metabolism capacity of these tumor cells was also confirmed by Glycolytic Proton Efflux Rate and ATP rate assays using a Seahorse XF 96 Analyzer according to the manufacturer’s instructions (Seahorse XF Glycolytic Rate Assay and Real-Time ATP Rate Assay, Agilent Technologies).
Mice
Female BALB/cAnN mice were from Charles River Laboratory, RAG2 KO BALB/c from Taconic, and WT, CD28 KO and CD45.1+ congenic C57BL/6J mice from Jackson Laboratory. Foxp3-GFP transgenic mice were generously provided by Dr. Alexander Rudensky and backcrossed to C57BL/6J at MSK. Foxp3GFP-Cre-ERT2, Foxp3GFP-Cre-ERT2;Slc2a1(Glut1)fl/fl, Foxp3YFP-Cre and Foxp3YFP-Cre;Slc2a1(Glut1)fl/+ C57BL/6J mice were kindly provided by Dr. Greg Delgoffe (University of Pittsburgh). Foxp3YFP-Cre;Ldhafl/fl mice were kindly provided by Dr. Ping-Chih Ho and bred at MSK. Same sex, same age mice were used in each experiment. All mice were bred and maintained under specific pathogen-free conditions (with a 12 h light-dark cycle at temperature of 21–23°C and humidity of 35–55%) and used at the ages of 5–10 weeks. The maximal tumor size of 20 mm in any direction was not exceeded in any experiment. All animal experiments were conducted according to protocols approved by the MSK and University of Pittsburgh Institutional Animal Care and Use Committee.
In vivo experiments
Five-to-six-week old female BALB/c mice were injected orthotopically with 106 4T1 cells in the mfp. Two days later, the tumor burden was quantified by BLI and mice were randomized in the different treatment groups to receive 3 intraperitoneal injections with 100 μg anti-CTLA-4 (clone 9D9 IgG2b, BioXcell; clone 9D9 IgG2a was kindly provided by Bristol Myers Squibb) or isotype control (clone MPC-11, BioXcell) 3 days apart. 4T1-Sc and 4T1-KD tumors were injected or resected 3 days apart to equalize tumor size before surgery. Disease free mice approximately 100 days after surgery were re-inoculated with 106 4T1-Sc or 4T1-KD cells in the opposite mfp and monitored for tumor growth to test development of anti-tumor immunologic memory. In some experiments, 4T1-KD cells (0.2–1×10⁶/mouse) were implanted in the mammary fat pad in Matrigel (Matrigel Matrix Growth Factor Reduced, Becton Dickinson) with or without 30–50 mM sodium lactate as previously reported15. Metastasis development was monitored every week by BLI upon intraperitoneal injection of 50 μl of D-Luciferin (30 mg/ml) (Gold Biotechnology). At the time of sacrifice, lungs were collected to quantify lung metastases either by ex vivo bioluminescence imaging or by hematoxylin and eosin staining of formalin fixed and paraffin embedded tissue sections. B16-Sc and B16-KD cells (250,000 cells/injection) were implanted intradermally in 5–8 weeks old wild type or Foxp3-GFP, Foxp3GFP-Cre-ERT2, Foxp3GFP-Cre-ERT2;Slc2a1(Glut1)fl/fl, Foxp3YFP-Cre and Foxp3YFP-Cre;Slc2a1(Glut1)fl/+ or Foxp3YFP-Cre;Ldhafl/fl C57BL/6J mice, which were then treated with 100 μg anti-CTLA-4 or the isotype control for 4 administrations 3 days apart. Primary tumor growth was measured twice a week by caliper. Survival was defined as time to death or time to sacrifice for those animals that had to be euthanized because sick and/or their tumors reached the size limits. All mouse procedures were performed in accordance with the Institutional Animal Care and Use Committee of MSK and the University of Pittsburgh.
RNA sequencing analyses
We interrogated RNA sequencing data for 22 human melanoma samples (n=7, before ipilimumab; n=15, after ipilimumab) from our previously published analyses9,10 and from 4T1-Sc and 4T1-KD tumors treated with anti-CTLA-4 (n=5/tumor type) or an IgG control (n=4, 4T1-Sc and n=5, 4T1-KD). For mouse samples, frozen tissue was homogenized in TRIzol Reagent (Thermo Fisher catalog # 15596018) using the QIAGEN TissueLyser at 15Hz for 2–3 minutes with a Stainless Steel Bead (QIAGEN catalog # 69989). Phase separation was induced with chloroform. RNA was precipitated with isopropanol and linear acrylamide and washed with 75% ethanol. RNA samples were resuspended in RNase-free water. After RiboGreen quantification and quality control by Agilent BioAnalyzer, 500ng of total RNA underwent polyA selection and TruSeq library preparation according to instructions provided by Illumina (TruSeq Stranded mRNA LT Kit, catalog # RS-122–2102), with 8 cycles of PCR. Samples were barcoded and run on a HiSeq 4000 in a PE50 run, using the HiSeq 3000/4000 SBS Kit (Illumina). An average of 51 million paired reads was generated per sample and the percent of mRNA bases averaged 69%. Heatmaps of expressed genes were generated using log2-transformed and standardized counts. Immune cell composition was estimated from bulk RNA sequencing data using the mean z-score approach with CIBERSORT LM22 signatures38. In this approach, values for each gene are first z-transformed across all samples. Resulting z-scores are then averaged across genes to arrive at a single signature score for each sample. Pearson correlation test was used to analyze dependency between variables. All analyses after gene count generation were conducted in the R statistical environment (R development Core Team, 2008; ISBN 3–900051-07–0) (version 3.6.3).
In vitro T cell assays
Mouse T cells were cultured in RPMI1640 supplemented with 10% heat inactivated FBS, 1× nonessential amino acids, 2 mM l-glutamine, 1 mM sodium pyruvate and 50 μM β-mercaptoethanol (complete RPMI1640).
Total T cells were immunomagnetically sorted from spleens of naïve BALB/c mice using CD5 microbeads (Miltenyi) according to the manufacturer’s instructions. T cells were labeled with carboxyfluorescein succinimidyl ester (CFSE, Invitrogen) and activated using phytohemagglutinin (PHA, 5 μg/ml, Sigma) or anti-CD3/anti-CD28 microbeads (1:1 ratio, Dynabeads™ Mouse T-Activator CD3/CD28, Gibco) in the presence of 4T1 (at 30–50:1, T-cell:4T1 ratio) or the indicated concentrations of lactic acid (Sigma) for 2–3 days in a humidified chamber with 5% CO2 at 37°C. After incubation, culture supernatants were collected for lactate and glucose quantification and T cells were processed for flow cytometry analyses.
Suppression assays were performed by incubating Tregs at 1:1 ratio with immunomagnetically purified CD45.1+CD8+ T cells (CD8 microbeads, Miltenyi Biotec) or CD45.1+CD4+ T cells (CD4 microbeads, Miltenyi Biotec), which were labeled with CellTrace Violet (CTV, Invitrogen), and immunomagnetically purified CD45.1+CD19+ B cells (CD19 microbeads, Miltenyi Biotec) as previously reported39. Cultures were stimulated with 0.5 μg/ml soluble anti-CD3 (clone 145–2C11, BD Pharmingen) in the presence of 50 μg/ml anti-CTLA-4 (clone 9D9, BioXcell), 10–50 μg/ml anti-PD-1 (clone RMP1–14, BioXcell), or 0.0125–2 μg/ml anti-CD28 (clone 37.51, BD Pharmingen) or the matched isotype controls in complete RPMI1640 containing the indicated concentrations of glucose (Sigma) for 48 h in a humidified chamber with 5% CO2 at 37°C. After incubation, cultures were processed for flow cytometry analyses of CellTrace Violet dilution (CD8+ T cell proliferation) and CD86 expression (B cell co-stimulation). Treg suppression was calculated with the following formula:
Treg suppression = [1 - % CTVlow (CD8+ T cells + Tregs)/ % CTVlow (CD8+ T cells alone)]*100.
For Treg:4T1/4T1-conditioned media assays, CD25hi Tregs were immunomagnetically purified from naïve BALB/c splenocytes (Miltenyi Biotec). Tregs were incubated with established 4T1-Sc or 4T1-KD cultures in 5 mM glucose complete RPMI1640 for 24 h in the presence of 1 μg/ml soluble anti-CD3, 2,000 U/ml IL-2 and 50 μg/ml anti-CTLA-4. Alternatively, Tregs were cultured for 48 h in 4 h tumor-conditioned media (complete RPMI1640, 11 mM glucose) with 1μg/ml plate-bound anti-CD3, 2,000 U/ml IL-2 and 50 μg/ml anti-CTLA-4 or an isotype control. Monensin (BD GolgiStop, BD Biosciences) and brefeldin A (BD GolgiPlug, BD Biosciences) were added for the last 4 h of culture before performing intracellular cytokine staining.
Activation of Treg monocultures was performed by incubating FACS-sorted Foxp3-GFP+ Tregs with 30-Gy irradiated immunomagnetically purified CD45.1+CD19+ B cells (1:1 ratio) in the presence of 0.5 μg/ml soluble anti-CD3 and 50 μg/ml anti-CTLA-4, anti-PD-1 or an IgG control for 48 h in a humidified chamber with 5% CO2 at 37°C. To block mitochondrial metabolism in this assay, 2–5 nM rotenone + antimycin A or 4 nM oligomycin were added31,40. 2,000 U/ml IL-2 were added for the last 24 h incubation.
Glucose and lactate measurements
Glucose and lactate were quantified in culture supernatants by either 1H NMR, luminescent assays (Glucose-Glo™, Promega), or by YSI meter (MSK Metabolism Core Facility).
Quantification of glucose consumption and lactate production by 1H NMR was conducted by integration of spectral line-shapes, as previously reported7. Glucose and lactate concentrations were calculated with the following formula:
Cu=Ck*(Iu/Ik)*(Nk/Nu)
Cu=concentration of the unknown (lactate or glucose)
Ck=concentration of glucose in base medium
Iu=integral area of unknown peak (lactate or glucose)
Ik=integral area of glucose in base medium
Nk=number of protons associated with glucose peak (C6-glucose=1 proton)
Nu=number of protons associated with unknown (C6-glucose = 1 proton, C3-lactate=3 protons).
The Glucose-Glo™ Assay (Promega) was used to quantify glucose consumption in supernatants from 4T1-Sc, 4T1-KD, B16-Sc and B16-KD cells. Glucose consumption was calculated with the following formula:
Glucose consumption = (glucose in base media – glucose in conditioned media)/n. of cells.
YSI-based measurements of glucose consumption and lactate production were calculated as follows:
Glucose consumption = (glucose in conditioned media - glucose in base media)/(n. of cells/106 x hours)
Lactate production = (lactate in conditioned media - lactate in base media)/(n. of cells/106 x hours)
Multiplex cytokine analysis
Cytokine concentrations in culture supernatants were quantified by using Luminex-based bead multiplex immunoassays (Millipore) and the DropArray system (Curiox BioSystems) according to the manufacturers’ instructions.
Quantitative real time PCR
Total RNA was extracted by using TRIZOL reagent (Invitrogen) and reverse-transcribed into complementary DNA (cDNA) using the High Capacity cDNA Transcription kit (Applied Biosystems). Expression of the indicated transcripts was quantified with the Fluidigm Biomark system by using the appropriate 6-fluorescein amidite (6-FAM)-minor groove binder (MGB)-conjugated TaqMan primer probes (Applied Biosystem) on target gene pre-amplification according to the manufacturer’s protocol. Gene expression was normalized relative to beta actin. Data were analyzed by applying the 2−Δ𝐶T calculation method.
Flow cytometry analyses
Tumors were dissociated after 30 min incubation with Liberase TL and DNAse I (Roche) to obtain single-cell suspensions. When tumor mass exceeded 0.1 gr, immune-cell infiltrates were enriched by Percoll (GE Healthcare) gradient centrifugation. Surface staining was performed after 10 min incubation on ice with an anti-mouse CD16/CD32 antibody (clone 2.4G2, BD Biosciences) to block Fcγ receptors, by using panels of appropriately diluted fluorochrome-conjugated antibodies (from BD Biosciences, eBioscience, Invitrogen or Biolegend) against the following mouse proteins in different combinations: CD45 (clone 30-F11; 1:250), CD45.1 (clone A20; 1:200), CD3 (clone 145–2C11; 1:200), CD4 (clone RM4–5; 1:200), CD8a (clone 5H10; 1:200), CD25 (clone PC61.5; 1:200), CD44 (clone IM7; 1:200), CD62L (clone MEL-14; 1:200), GITR (clone DTA-1; 1:200), PD-1 (clone RMP1–30; 1:200), CD86 (clone GL1; 1:200), CD11b (clone M1/70.15; 1:200), F4/80 (clone BM8; 1:200), MHC-II (clone M5/114.15.2; 1:200), Gr1 (clone RB6–8C5; 1:200) and an eFluor506 fixable viability dye. For intracellular staining, mouse cells were fixed and permeabilized (Foxp3 fixation/permeabilization buffer, eBioscience) and incubated with appropriately diluted FITC- or AF488-labeled anti-mouse Foxp3 (clone FJK-16s, eBioscience; 1:200), PE-labeled anti-CTLA-4 (clone UC10–4F10–11; 1:200) and PECy7 or PE-labeled anti-Ki67 (clone B56, BD Biosciences, 1:50; clone 16A8, Biolegend, 1:250) antibodies for 30 min on ice. CD206 was revealed following cellular permeabilization and fixation in the Cytofix and Cytoperm buffer (BD Biosciences), according to the manufacturer’s instructions, using an AlexaFluor647-conjugated anti-mouse CD206 antibody (clone C068C2, Biolegend, 1:200).
2-NBDG staining of 4T1 cells was performed by incubation with 100 μM 2-NBDG (Invitrogen) in complete DMEM in a humidified incubator at 37°C for 15 min. Cells were then extensively washed before acquisition. GlucoseCy3 staining was performed by 25 min incubation in serum-free, glucose-free RPMI1640 containing 0.4 μM glucoseCy3 (kindly provided by Dr. Greg Delgoffe, University of Pittsburgh) in a humidified incubator at 37°C.
AH1 Dextramer staining (IMMUDEX) was performed on peripheral blood after red blood cell lysis (PharmLyse, BD Pharmingen) by 10 min incubation at RT° according to the manufacturer’s instructions, followed by 20 min surface staining with anti-CD8, anti-CD44, and anti-CD62L antibodies. DAPI was added right before acquisition to exclude dead cells.
For intracellular cytokine staining, mouse tumor immune infiltrates were re-stimulated with 0.1 μg/ml PMA and 0.5–1 μg/ml ionomycin in complete RPMI1640 in a humidified chamber with 5% CO2 at 37°C. After 1 hour, 1x GolgiStop and 1x GolgiPlug (BD Biosciences) were added to the cultures and incubated for additional 4–5 hours at 37°C. Surface staining was performed after blocking Fcγ receptors by incubating cells with PerCPCy5.5-labeled anti-CD4, BV650-labeled anti-CD8, and APCCy-labeled anti-CD45 antibodies and an eFluor506-labeled fixable viability dye for 30 min on ice. Cells were then washed, fixed and permeabilized with the Foxp3 fixation/permeabilization buffer (eBioscience) and stained for 45 min with FITC- or AF488-labeled anti-Foxp3, BV450- or BV510-labeled anti-IFN-γ (clone XMG1.2, BD Biosciences or Biolegend, 1:200–250) and APC-labeled or PECy7-labeled anti-TNF-α (clone MP6-XT22, BD Biosciences or Biolegend, 1:200–250) antibodies. Samples were acquired on an LSRII or Symphony X50 flow cytometer (BD Biosciences) using BD FACSDiva software (BD Biosciences) and data analyzed with FlowJo 10.6.1 software (Tree Star Inc.).
Mouse Tregs were sorted from Foxp3-GFP, Foxp3GFP-Cre-ERT2 and Foxp3GFP-Cre-ERT2;Slc2a1(Glut1)fl/fl transgenic mice by using CD4-pre-enriched splenocytes (CD4 Microbeads, Miltenyi Biotec). Briefly, following Fcγ receptor blockade with anti-mouse CD16/CD32, samples were stained with a PECy7- or APC-labeled anti-CD4 antibody for 30 min on ice. Cells were then washed and DAPI was added immediately before acquisition. FACS sorting was conducted on a FACSAria II cell sorter (BD Biosciences).
Statistical Analyses
Two-sided Student’s t test and 2-way ANOVA (with Bonferroni’s multiple comparisons test) were used to detect statistically significant differences between groups. P values for survival analyses were calculated with log-rank (Mantel-Cox) test. Statistical analyses were performed on the Prism 9 software (GraphPad Software) version for Macintosh Pro personal computer. Detailed information of the statistical test and number of observations/replicates used in each experiment, and the definition of center and dispersion is appropriately reported in the legend of each figure. Significance was defined as follows: * = p<0.05, ** = p<0.01, *** = p<0.001, **** = p<0.0001.
Data Availability
Human melanoma RNAseq data sets investigated in this study were previously reported9,10 and have been deposited to the Gene Expression Omnibus (GEO) repository (GSE165278). The 4T1 RNAseq data sets generated for this study have been submitted to the GEO repository (GSE164051). All other relevant data supporting the findings of this study are available in the source data files.
Extended Data
Extended Data Figure 1. Tumor glycolysis and immune cell function.
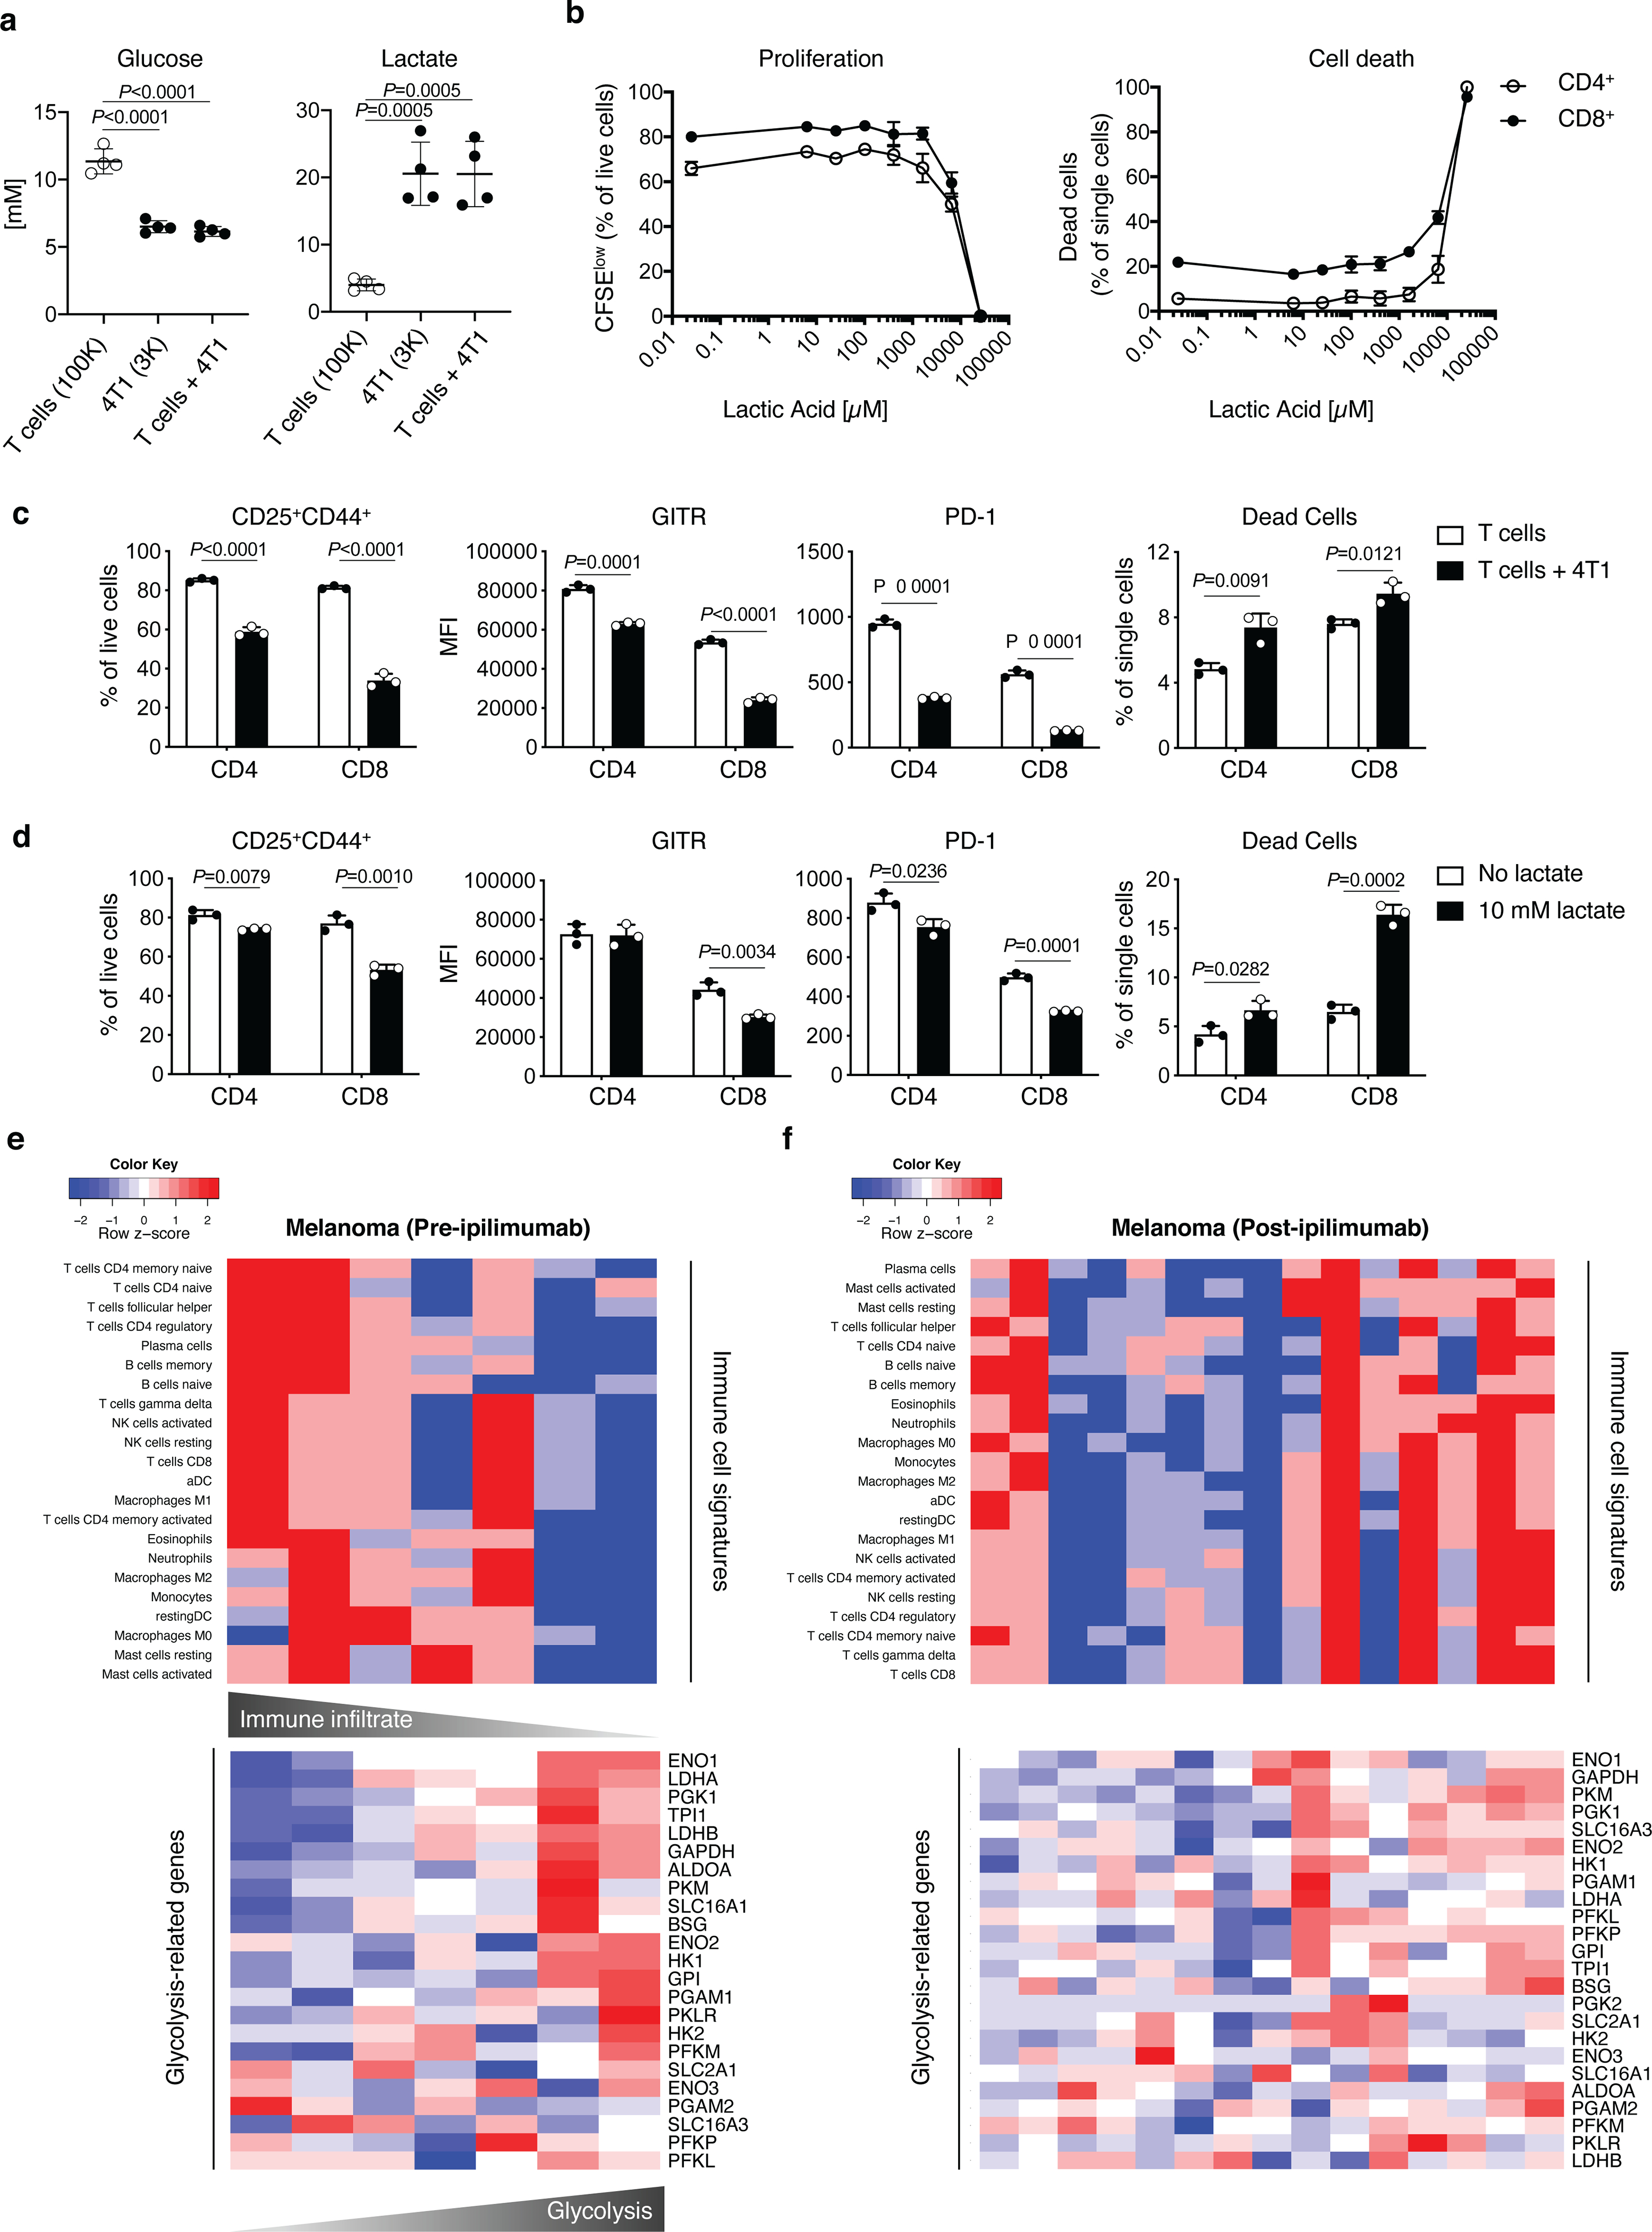
(a) Quantification of glucose and lactate by 1H NMR in supernatants from 72 h cultures of activated T cells (100K, 100,000 cells), 4T1 cells (3K, 3,000 cells) and the two cell types together. Plots show combined results from 2 independent experiments (n=2/experiment; mean ± SD; 2-sided unpaired t test). (b) Percent of proliferating (CFSElow, left) and (right) dead CD4+ or CD8+ T cells assessed by flow cytometry upon 48 h activation in the presence of the indicated concentrations of lactic acid to define the workable lactate dose range (n=3/condition, except for 0 μM lactic acid, n=2; mean ± SD). (c,d) Flow cytometry analysis of the indicated parameters in CD8+ and CD4+ T cells activated for 48 h in the presence or absence of 4T1 cells (c) or 10 mM lactate (d). Data show mean ± SD of 1 out of 2 independent experiments (n=3; mean ± SD; 2-sided unpaired t test). (e,f) Expression of immune cell signatures by CIBERSORT (top) and glycolysis-related genes (bottom) in RNAseq data sets from human melanoma samples at baseline (e, n=7) and after ipilimumab (f, n=15). Each column in the heatmaps represents an independent tumor sample. MFI, median fluorescence intensity.
Extended Data Figure 2. LDHA-deficient tumor model for neoadjuvant CTLA-4 blockade treatment.
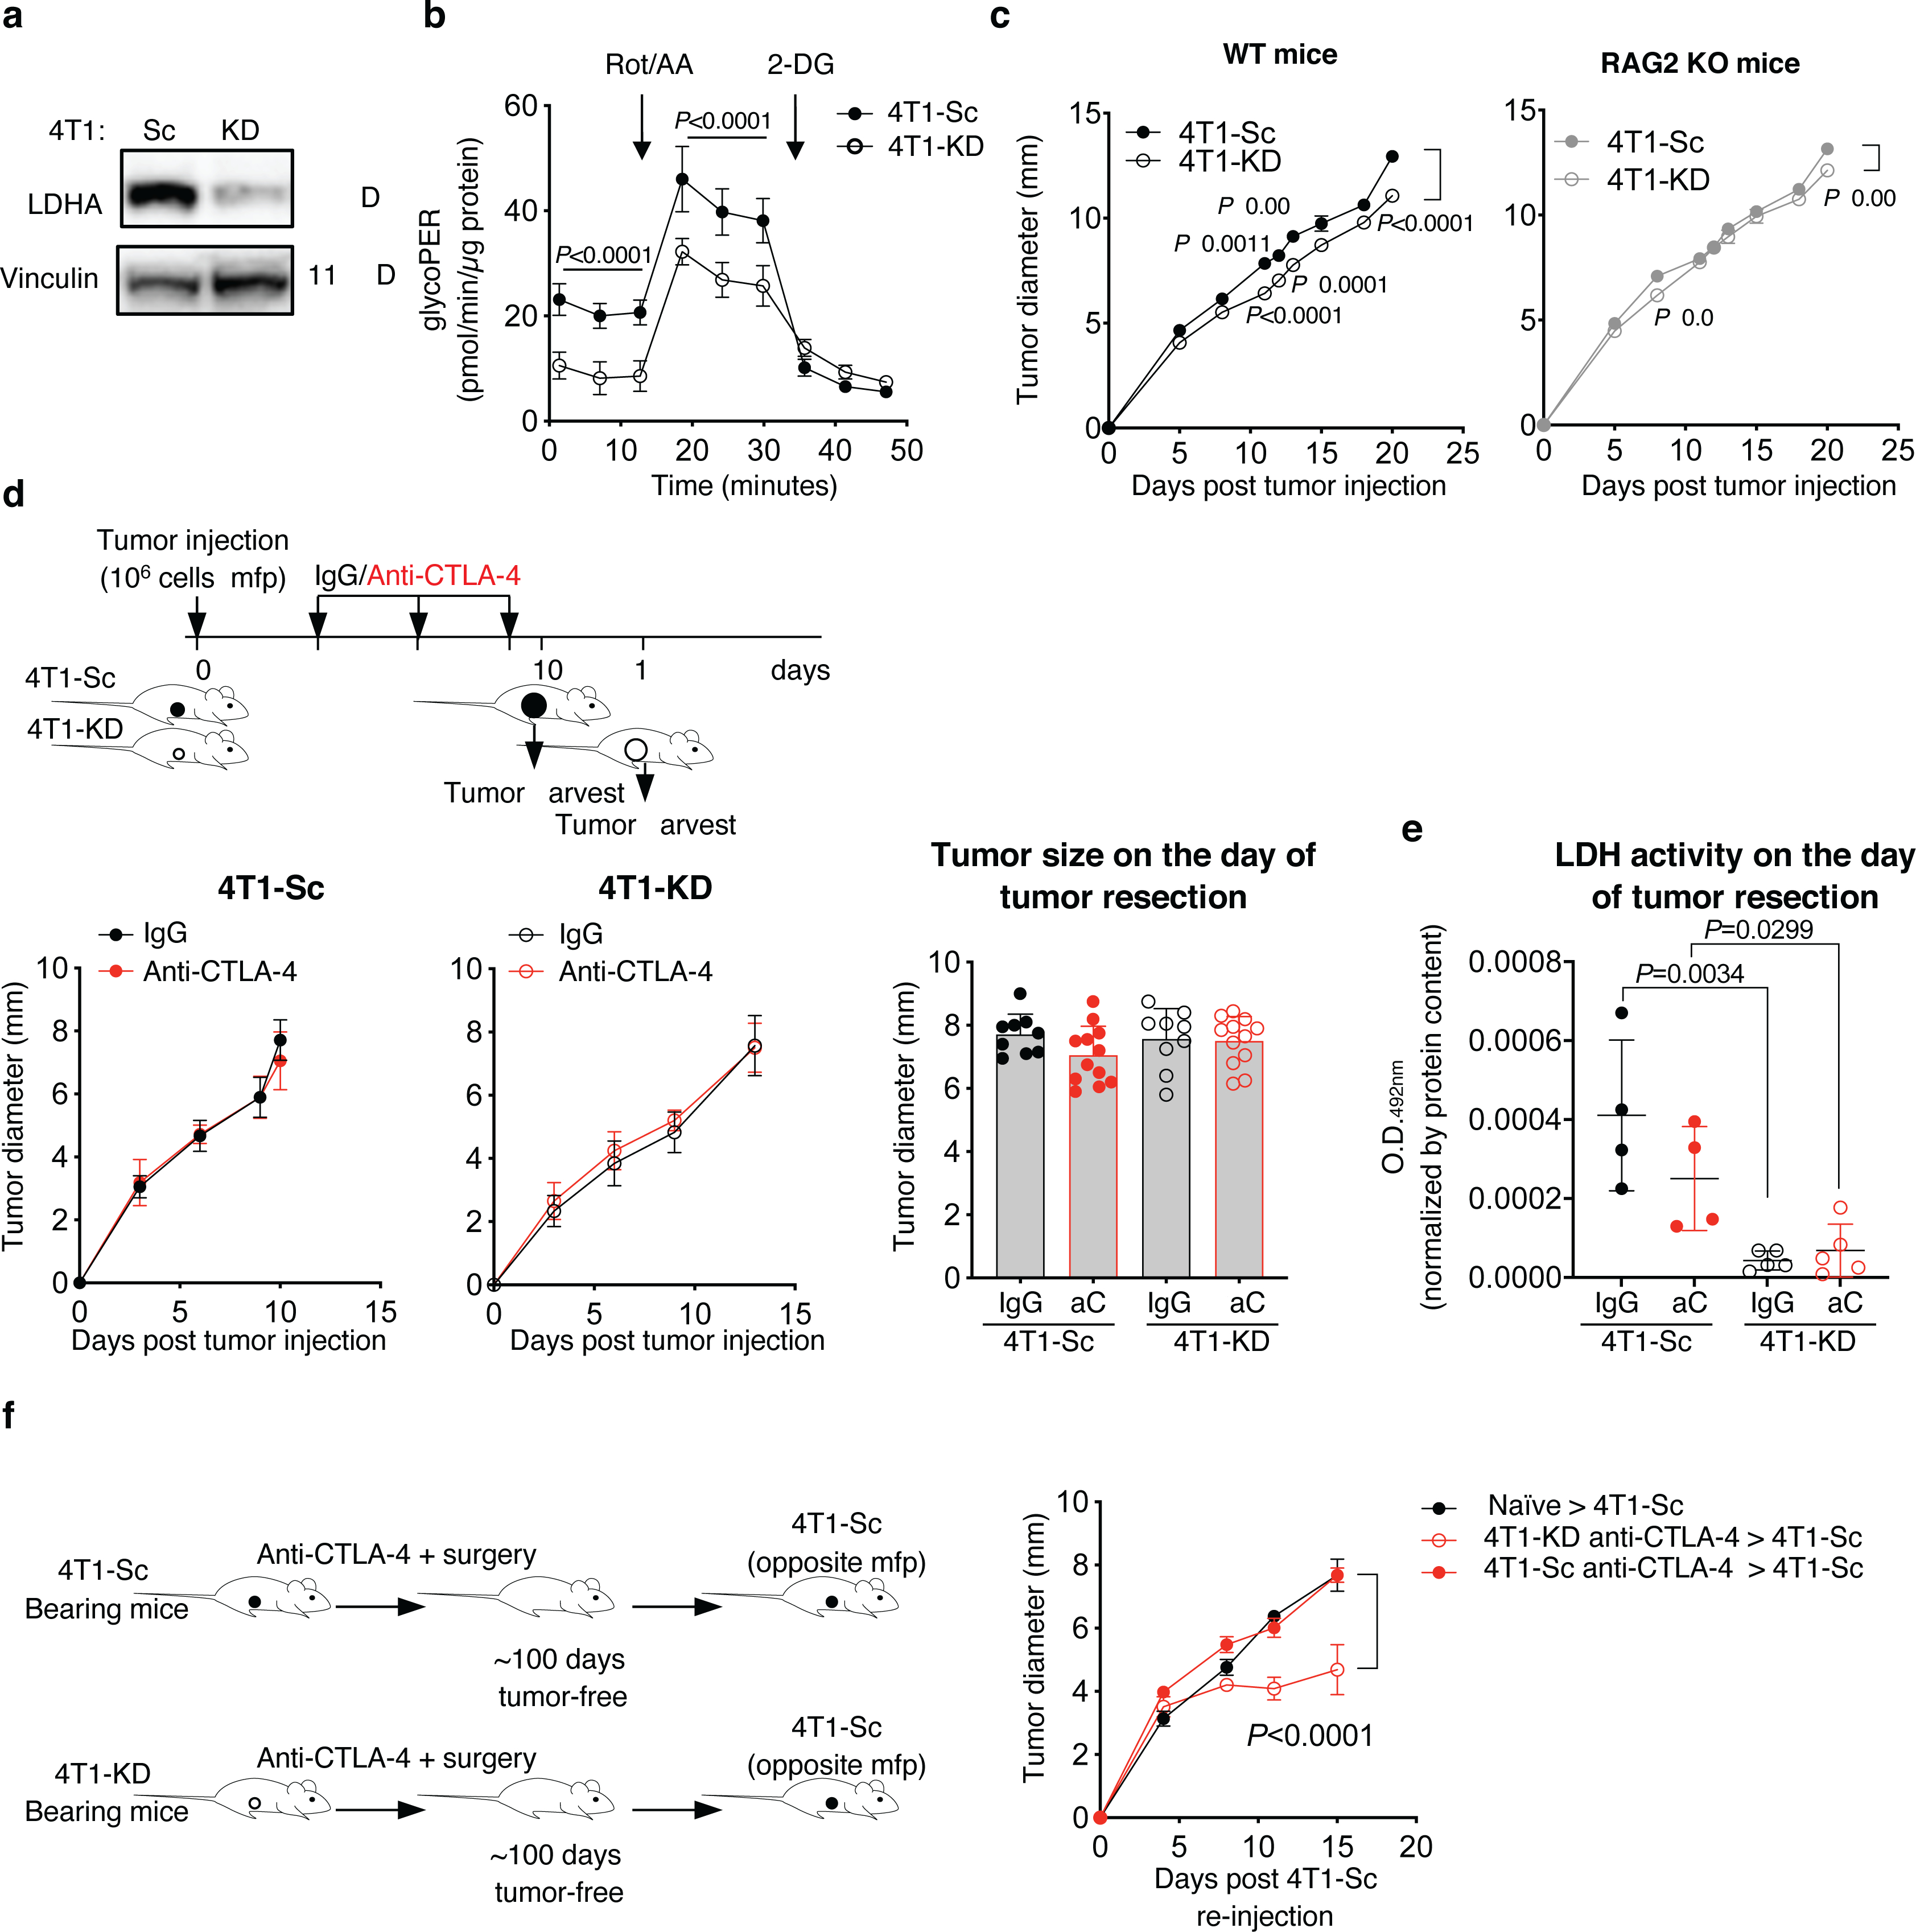
(a) Expression of LDHA and vinculin, as loading control, in 4T1-KD and 4T1-Sc whole cell protein extracts by western blot in 1 representative of 3 independent experiments. (b) Glycolytic Proton Efflux Rate (glycoPER) assessed by Seahorse XF Analyzer in 4T1-KD and 4T1-Sc cultures (n=20, mean ± SD; 2-way ANOVA with Bonferroni correction; Rot/AA, rotenone + antimycin A; 2-DG, 2-Deoxy-D-glucose). (c) In vivo growth of 4T1-KD and 4T1-Sc tumors orthotopically implanted in the mammary fat pad (mfp) of immunocompetent wild type (WT) and immunodeficient RAG2 knock out (KO) BALB/c mice (n=10 mice/group; mean ± SEM; 2-way ANOVA with Bonferroni correction; 1 representative of 2 independent experiments). (d) Growth of primary 4T1-Sc and 4T1-KD tumors in mice treated as in Figure 2a (left) and average tumor diameter on the day of tumor resection (right) (IgG, n=9; anti-CTLA-4, n=12; mean ± SEM). (e) LDHA activity in 4T1-Sc (n=4) and 4T1-KD (n=5) tumor extracts on the day of tumor resection after treatment as in (d) (mean ± SEM; 2-sided unpaired t test). (f) Tumor growth after a second injection with 4T1-Sc in 4T1-KD- and 4T1-Sc-bearing mice that survived neoadjuvant treatment with CTLA-4 blockade as in Figure 2a (n=4/group, except for naïve, n=5; mean ± SEM; 2-way ANOVA with Bonferroni correction). aC, anti-CTLA-4.
Extended Data Figure 3. Neoadjuvant anti-CTLA-4 treatment schedule for same-day 4T1-Sc- and 4T1-KD-tumor resection.
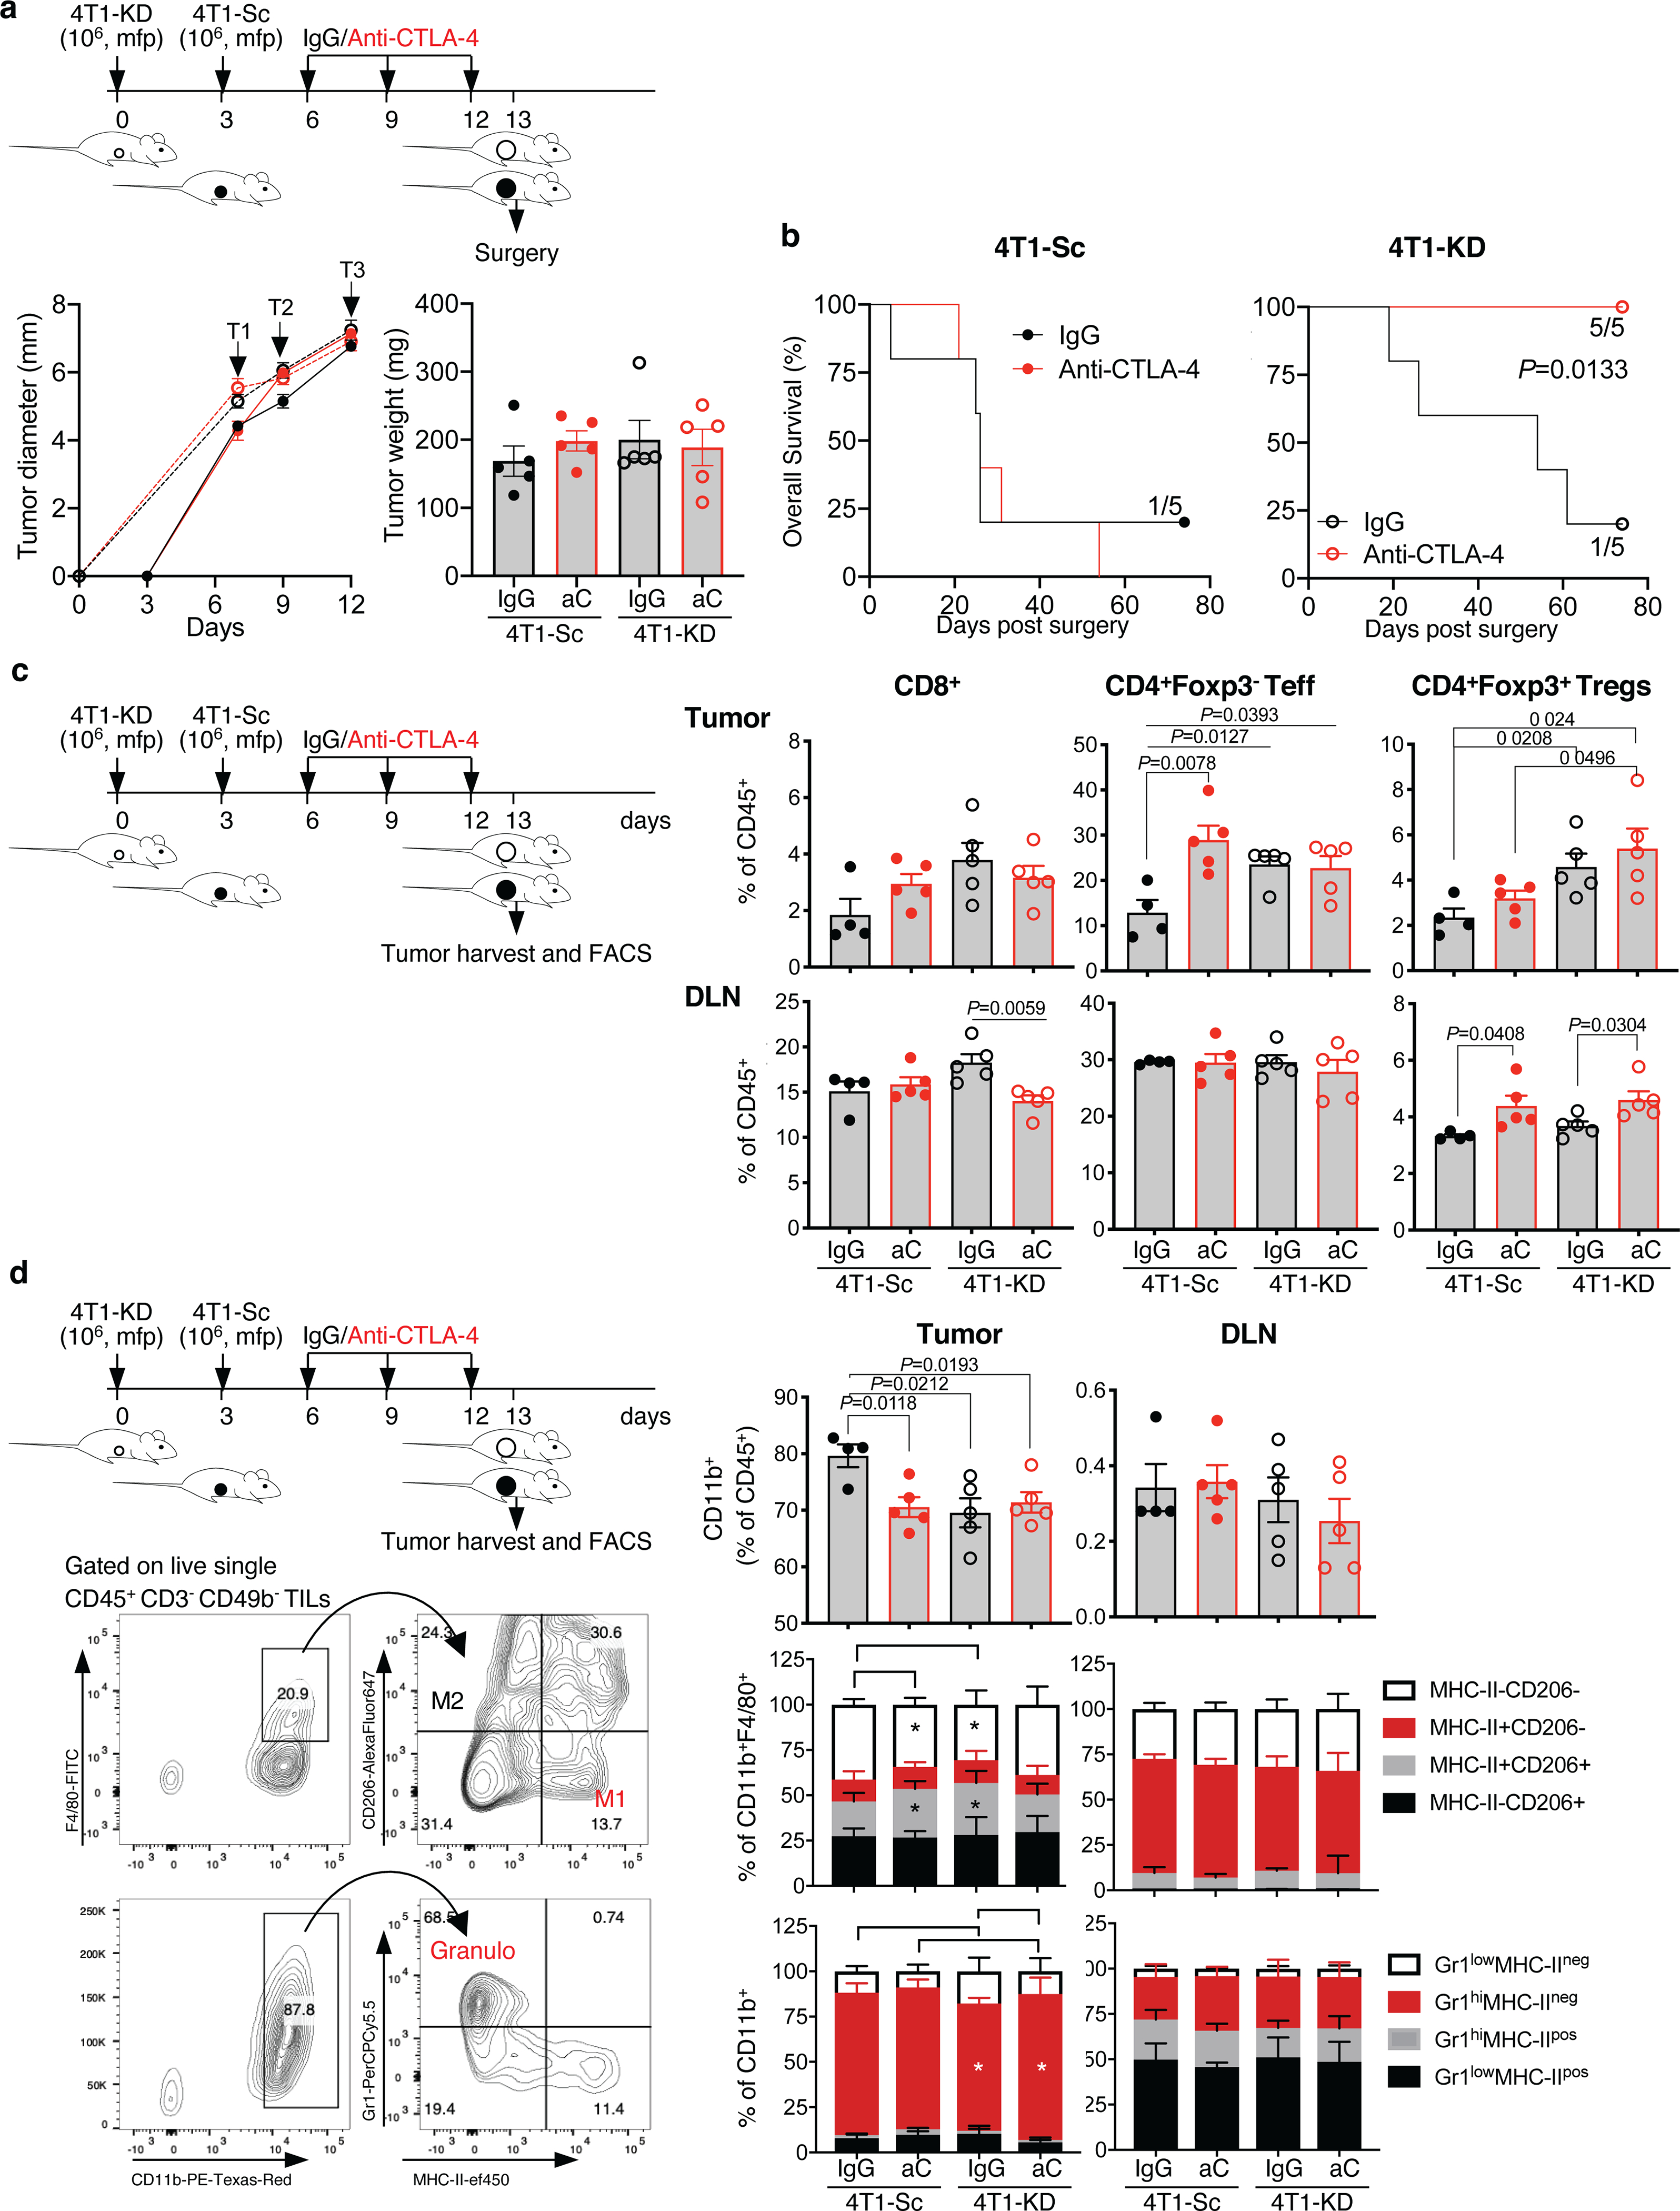
Additional treatment schedule modified to harvest 4T1-Sc and 4T1-KD tumors for flow cytometry analysis on the same day. Separate groups of BALB/c mice were injected with 106 4T1-KD and 4T1-Sc cells 3 days apart and then treated with 3 cycles of anti-CTLA-4 or the matched isotype control (IgG) every 3 days (arrows, T=treatment) before surgery and flow cytometry analysis of tumor and tumor draining lymph node (DLN) samples. (a) Primary tumor growth and tumor weight on the day of surgery, showing similar tumor size across groups during treatment and on the day of surgery (n=5 mice/group; mean ± SEM; 1 representative of 2 independent experiments). (b) Overall survival of mice treated as in (a) (n=5 mice/group; log rank test). (c) Frequency of the indicated T cell subsets among total CD45+ leukocytes in tumors and DLNs from the indicated treatment groups (n=5 mice/group except for 4T1-Sc IgG, n=4; mean ± SEM; 2-sided unpaired t test). (d) Frequency of CD11b+ myeloid cell subsets among total CD45+ leukocytes, M1 and M2 macrophages according to MHC-II and CD206 staining among total CD11b+F4/80+ macrophages, and Gr1+ granulocyte subsets among total CD11b+ myeloid cells in 4T1-Sc and 4T1-KD tumors as well as DLNs from mice treated as indicated (n=5 mice/group except for 4T1-Sc IgG, n=4; mean ± SEM; 2-sided unpaired t test). Representative plots showing the flow cytometry gating strategy for M1 and M2 macrophages and granulocytes (granulo) are reported. Data show results from 1 representative of at least 2 independent experiments. * = P<0.05.
Extended Data Figure 4. Selective loss of Treg functional stability in LDHA-deficient tumors treated with CTLA-4 blockade.
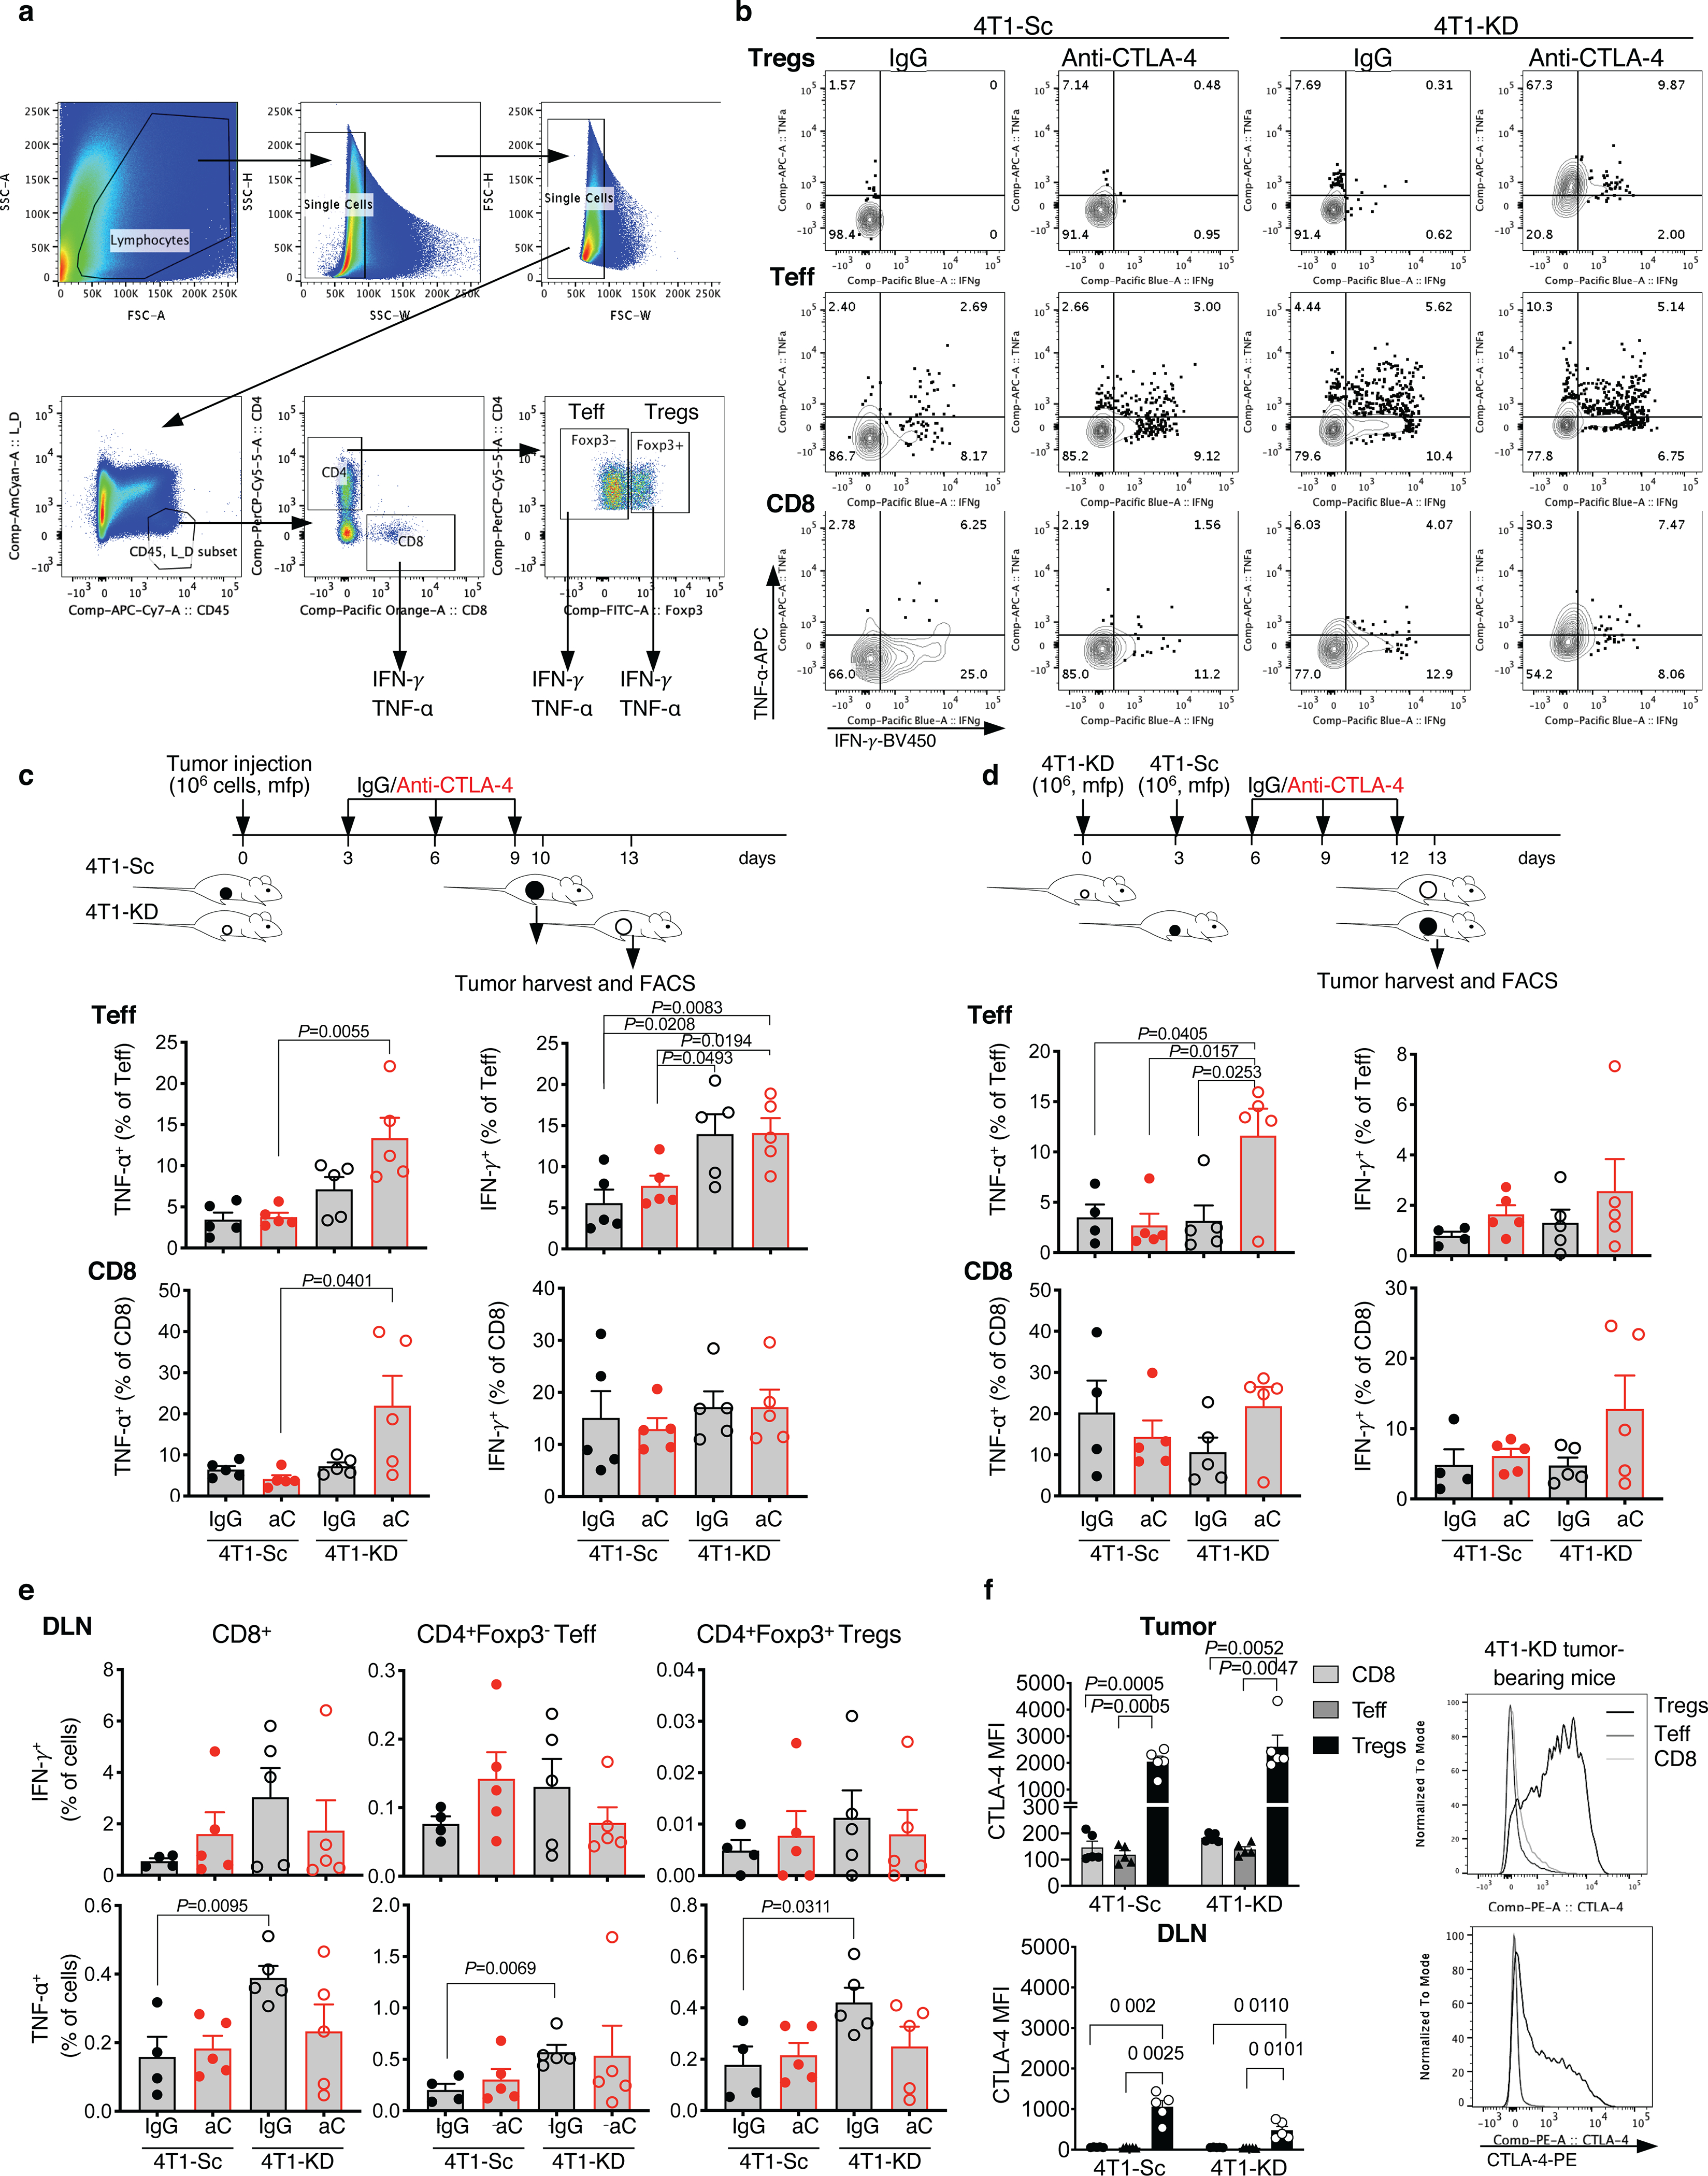
(a) Representative gating strategy for tumor-infiltrating CD8+, CD4+Foxp3− Teff and CD4+Foxp3+ Tregs, where expression of IFN-γ and TNF-α was assessed. (b) Representative flow cytometry plots showing IFN-γ and TNF-α expression in Tregs, Teff and CD8+ TILs gated as in (a) from 4T1-Sc- and 4T1-KD-bearing BALB/c mice treated as in Figure 3a. (c,d) Quantification of TNF-α and IFN-γ expression in CD4+Foxp3− Teff and CD8+ TILs from 4T1-Sc- and 4T1-KD-bearing BALB/c mice treated as in Figure 3a (c; n=5 mice/group) and 3b (d; n=5 mice/group except for 4T1-Sc IgG, n=4) (mean ± SEM; 2-sided unpaired t test). (e) Quantification of IFN-γ and TNF-α expression in CD8+ T cells, CD4+Foxp3− Teff and Tregs from DLNs of 4T1-Sc- and 4T1-KD-bearing BALB/c mice treated as in Figure 3b (n=5 mice/group except for 4T1-Sc IgG, n=4; mean ± SEM; 2-sided unpaired t test). (f) Quantification and representative plots of CTLA-4 expression by flow cytometry in CD8+ T cells, CD4+Foxp3− Teff and Tregs from tumor and DLN samples of 4T1-Sc and 4T1-KD tumor-bearing mice (n=5 mice/group, mean ± SEM; 2-sided paired t test). Data show results from 1 representative of at least 2 independent experiments.
Extended Data Figure 5. Treg destabilization and CD8+ TIL activation in additional LDHA-deficient tumor models treated with CTLA-4 blockade.
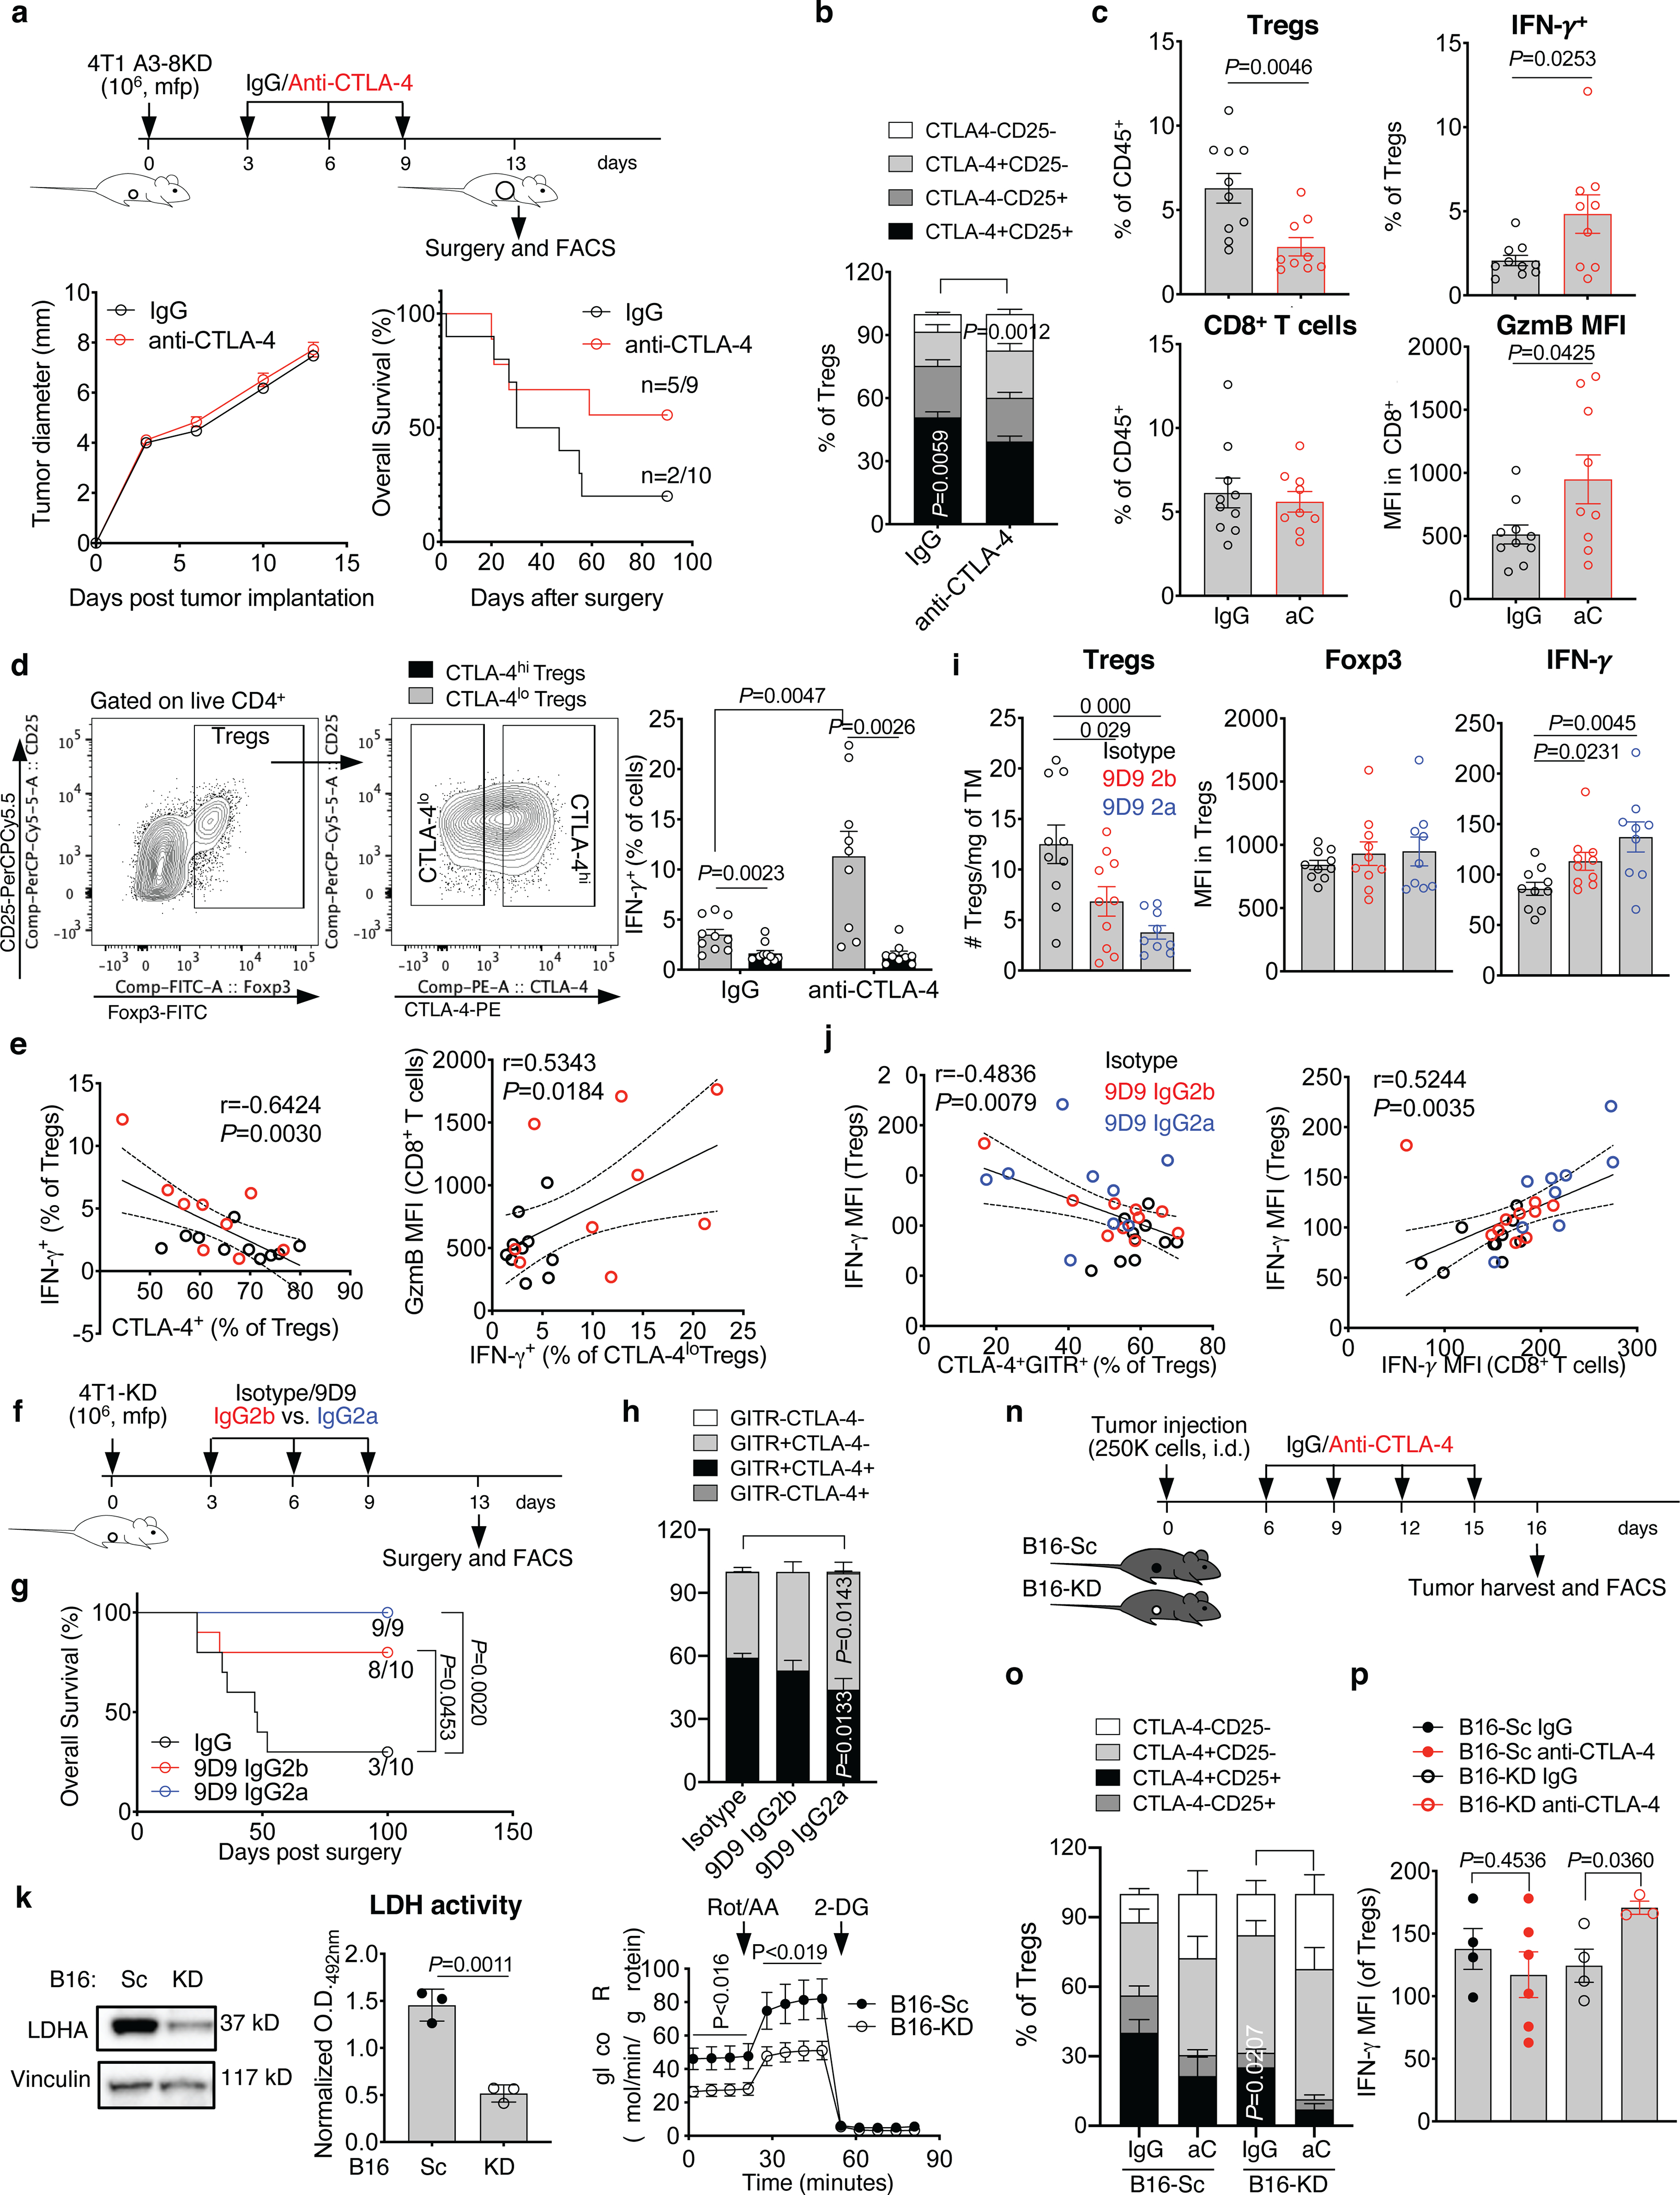
(a-e) Primary tumor growth and overall survival, reporting the number of tumor-free mice at the end of the experiment, in BALB/c mice implanted in the mfp with the LDHA-KD 4T1 A3–8KD cell line (106 cells/mouse) treated with neoadjuvant anti-CTLA-4 (n=9) or IgG control (n=10), as indicated. CTLA-4 and CD25 in tumor-infiltrating Tregs (b), quantification of Tregs and CD8+ TILs as well as expression of the indicated markers by flow cytometry (c), and (d) flow cytometry analysis of IFN-γ expression in CTLA-4lo and CTLA-4hi tumor-infiltrating Tregs from mice treated as in (a) (mean ± SEM; CTLA-4lo vs. CTLA-4hi Tregs, 2-sided paired t test; IgG vs. anti-CTLA-4 CTLA-4lo Tregs, 2-sided unpaired t test). (e) Pearson correlation analyses of indicated parameters in Tregs and CD8+ TILs from mice treated as in (a) (black, IgG; red, anti-CTLA-4). n=1 experiment with n=9–10 mice/group. (f-j) 4T1-KD-bearing BALB/c mice were treated with the standard IgG2b 9D9 anti-CTLA-4 antibody (n=10) or its IgG2a variant (n=9) or IgG control (n=10) as indicated in (f) and overall survival (log-rank test) (g), quantification of CTLA-4 and GITR expression in Tregs (h), and (i) tumor-infiltrating Tregs and their expression of Foxp3 and IFN-γ by flow cytometry are shown (mean ± SEM; 2-sided unpaired t test). (j) Pearson correlation analyses between indicated parameters in Tregs and CD8+ TILs from mice treated as in (f). n=1 experiment with 9D9 IgG2a. (k-m) LDHA protein expression by western blot (k), (l) LDH activity, and (m) glycolytic proton efflux rate (GlycoPER) by Seahorse analysis in B16-KD vs. B16-Sc cells (n=3, mean ± SD; 2-sided unpaired t test; 1 representative of 2–3 independent experiments). (n-p) C57BL/6J mice were implanted with B16-KD and B16-Sc tumors and treated with anti-CTLA-4 or IgG control as indicated in (n). Quantification of CTLA-4 and CD25 (o; n=5/group except for B16-KD IgG, n=4) and (p) IFN-γ expression in tumor-infiltrating Tregs by flow cytometry (B16-Sc IgG, n=4; B16-Sc anti-CTLA-4, n=6; B16-KD IgG, n=4; B16-KD anti-CTLA-4, n=3; mean ± SEM; 2-sided unpaired t test; 1 representative of 2 experiments). TM, tumor; GzmB, granzyme B; i.d., intradermal.
Extended Data Figure 6. In vivo Treg response to tumor glucose metabolism and CTLA-4 blockade.
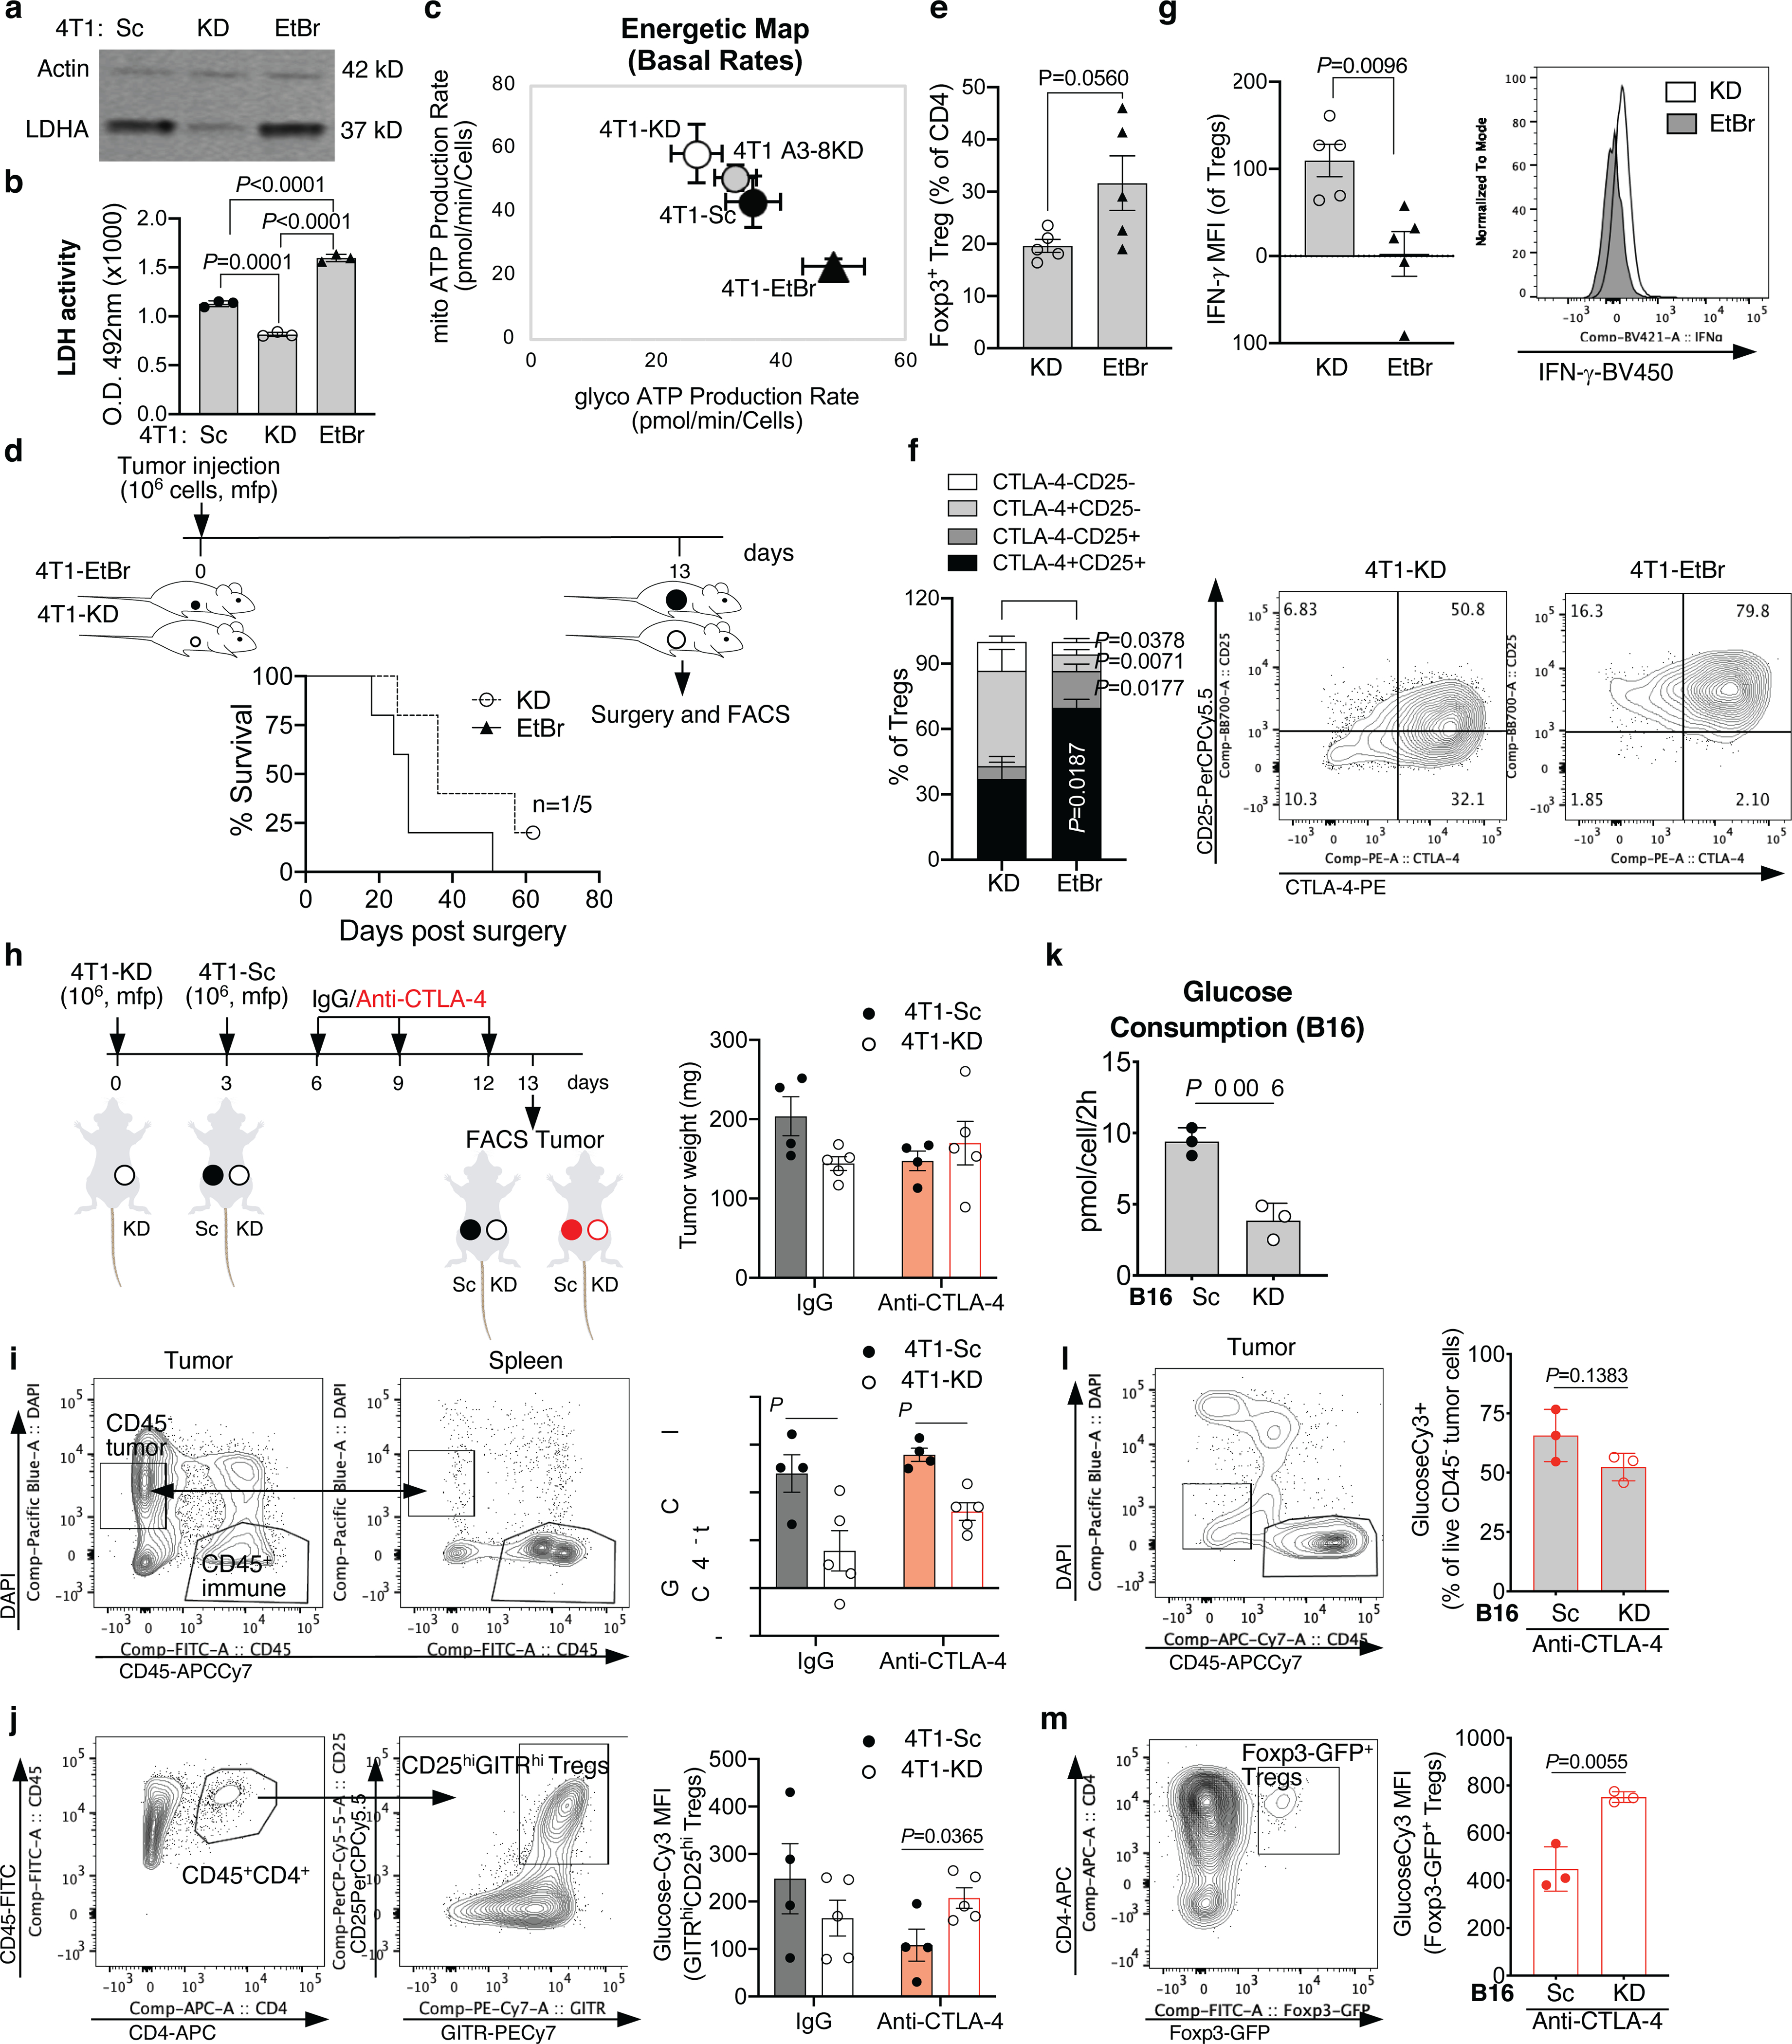
LDHA protein expression by western blot in 1 representative of 3 independent experiments (a) and (b) LDH activity in 4T1-KD vs. 4T1-EtBr cells in comparison with control 4T1-Sc cells (n=3, mean ± SD), and (c) complete cell energetic map with mitochondrial and glycolytic production rates in the indicated 4T1 cell variants using a real-time ATP rate assay by Seahorse (Sc and EtBr, n=22; KD and A3–8KD, n= 24; mean ± SD) in 1 representative of 2 independent experiments (2-sided unpaired t test). (d-g) BALB/c mice (n=5/group) were orthotopically implanted with 106 4T1-KD or 4T1-EtBr cells and tumors were surgically resected 13 days later (d). Overall survival and number of surviving mice out of total (d). Frequency of Foxp3+ Tregs among tumor-infiltrating CD4+ T cells (e), CD25 and CTLA-4 (f) and IFN-γ expression (g) in intra-tumor Tregs by flow cytometry. Mean ± SEM; 2-sided unpaired t test; 1 representative of 2 independent experiments. (h) Schematic representation of anti-CTLA-4 or control IgG treatment in BALB/c mice implanted with 4T1-Sc and 4T1-KD in opposite mfp, and tumor weight on day 13 for samples analyzed in (i,j). (i) GlucoseCy3 staining by flow cytometry in CD45− tumor cells gated as indicated to enrich in live CD45− tumor cells by comparing CD45 and DAPI staining between tumor and spleen samples from mice treated as in (h). (j) GlucoseCy3 staining by flow cytometry in Tregs gated based on surface staining of CD4, CD25 and GITR in tumor samples as in (h). (h-j) 4T1-Sc, n=4 (1 tumor sample in each treatment group was contaminated by DLN and was excluded); 4T1-KD, n=5; mean ± SEM; 2-sided unpaired t test; n=1 experiment. (k) In vitro glucose consumption by B16-Sc vs. B16-KD cells, and (I,m) ex vivo glucose uptake potential by flow cytometry analysis of glucoseCy3 staining of CD45− tumor cells (l) and intra-tumor Foxp3-GFP+ Tregs (m) from B16-Sc- and B16-KD-bearing Foxp3-GFP transgenic C57BL/6J mice treated with anti-CTLA-4 (n=3, mean ± SD; 2-sided unpaired t test; 1 representative of 2 independent experiments).
Extended Data Figure 7. Ex vivo and in vitro Treg response to tumor glucose metabolism and CTLA-4 blockade.
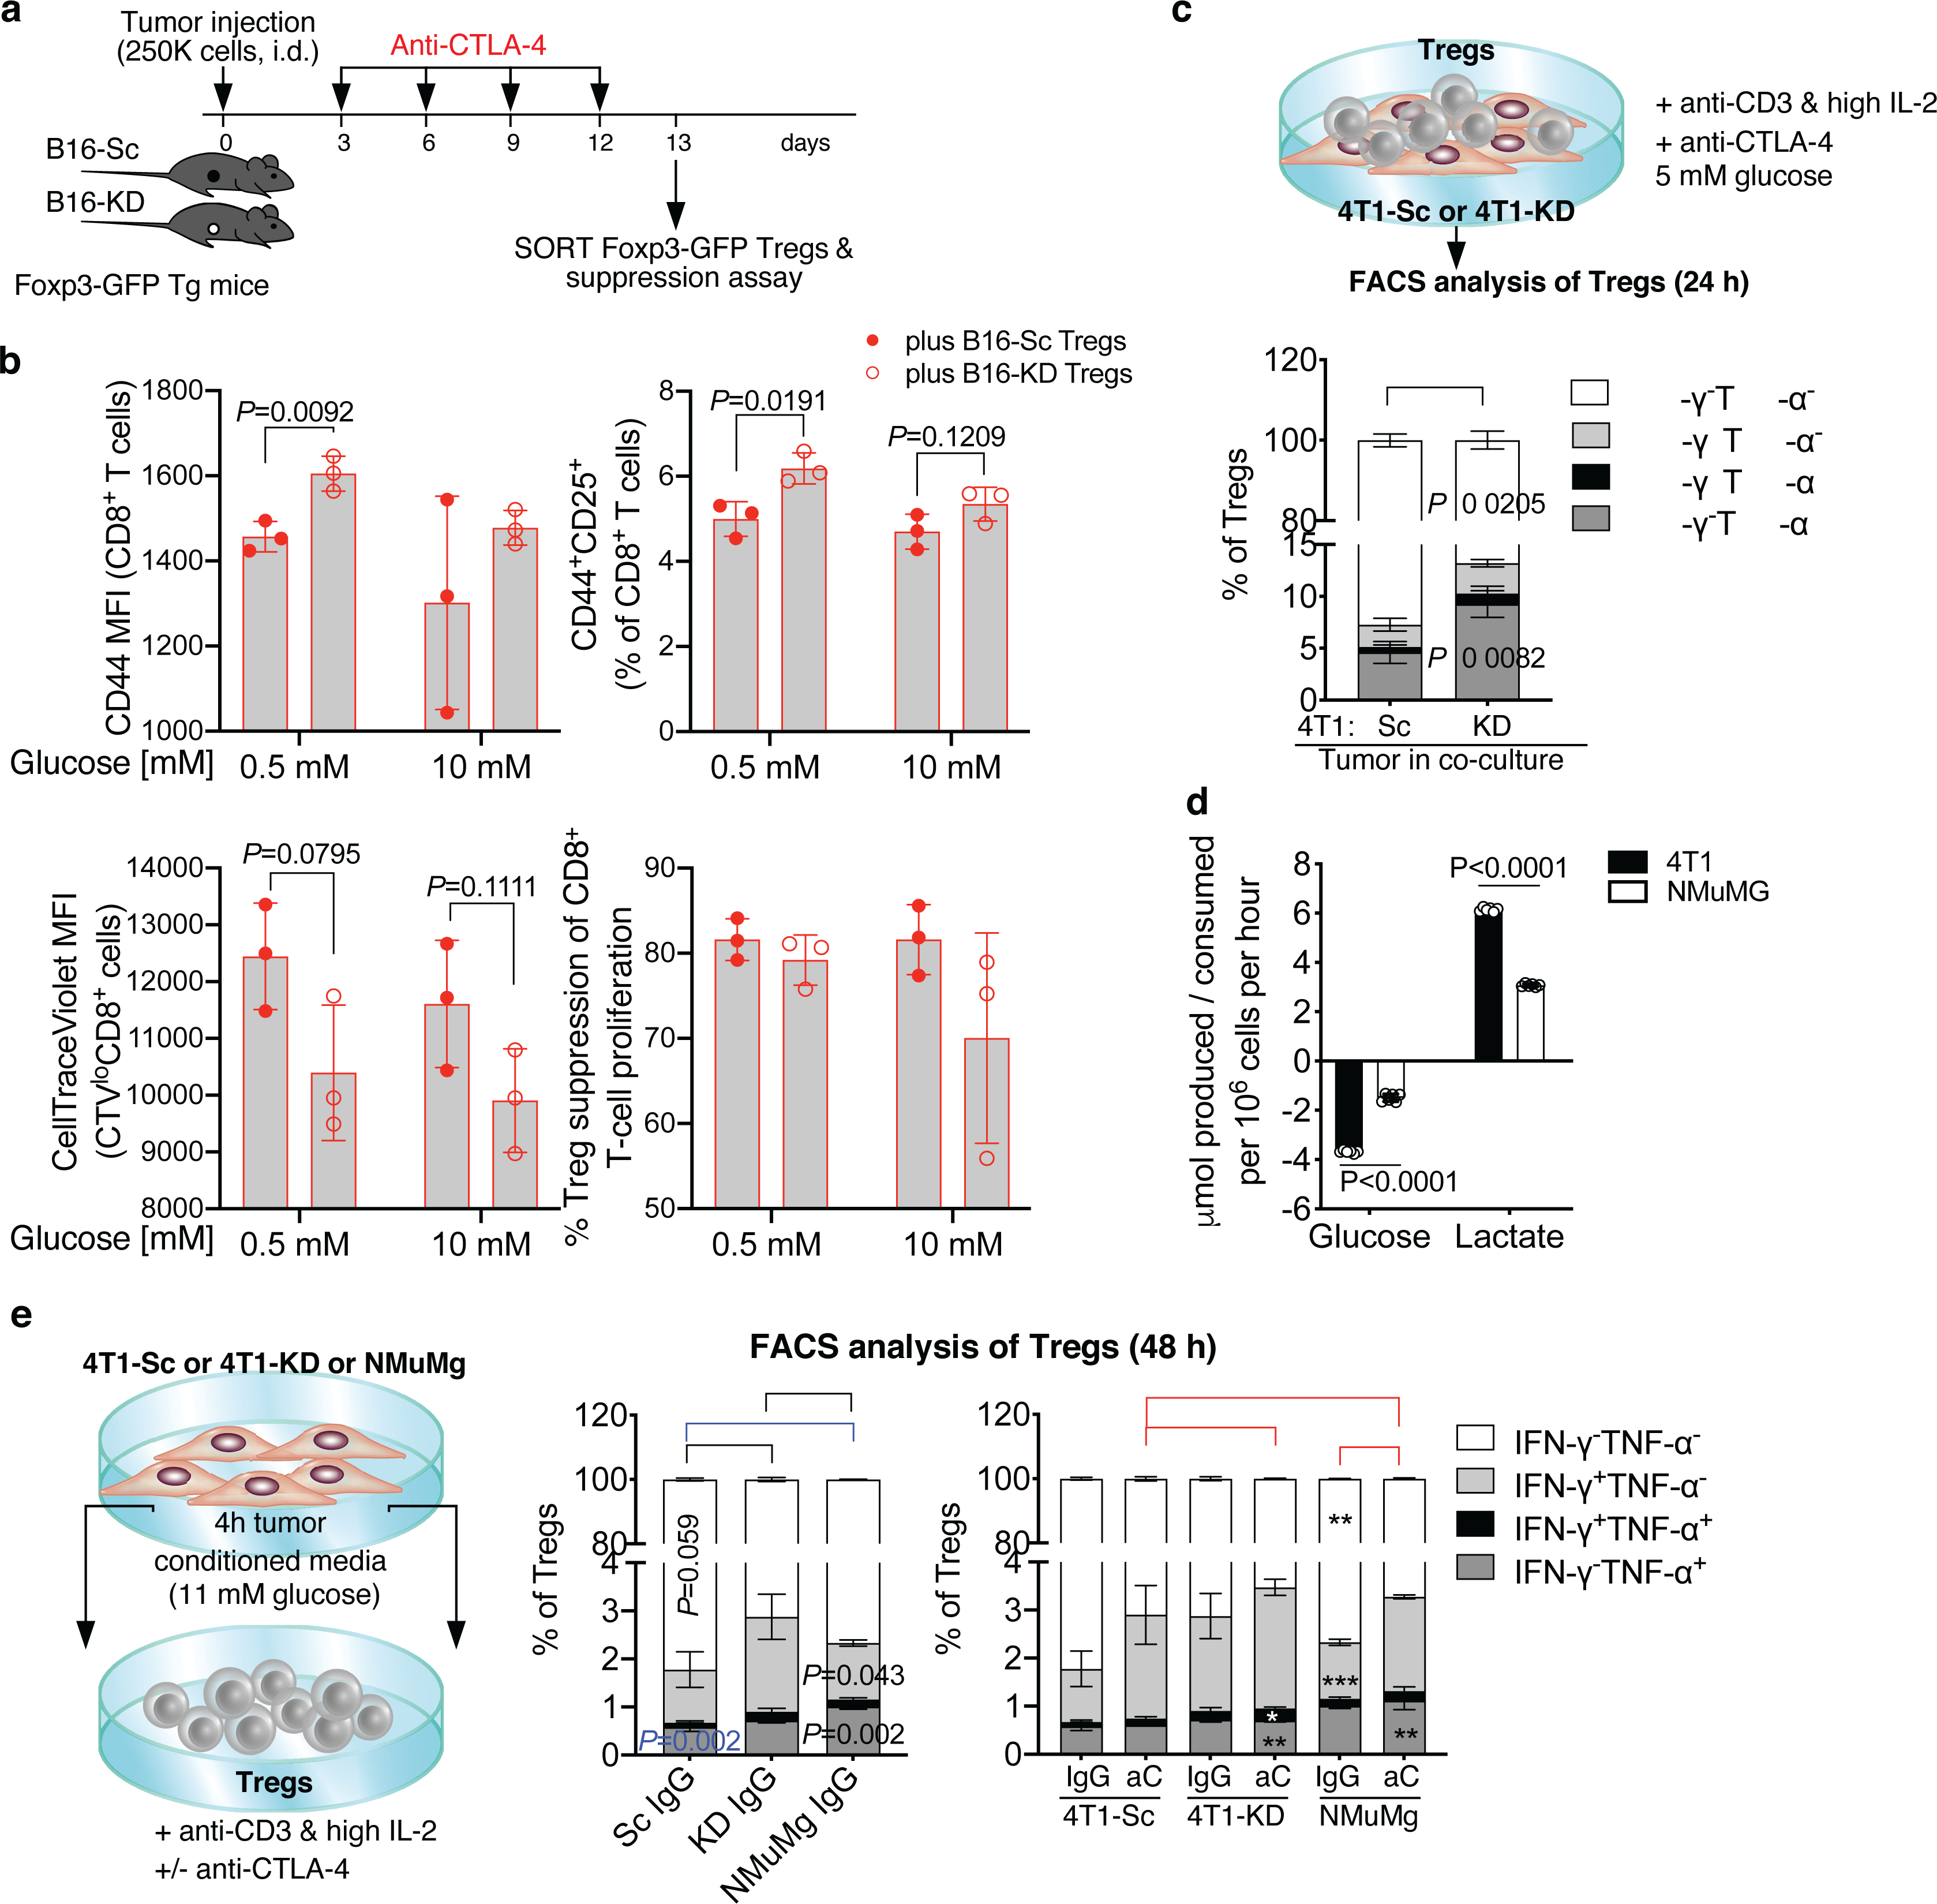
(a,b) Foxp3-GFP transgenic (Tg) mice were implanted with B16-Sc or B16-KD cells and treated with anti-CTLA-4 as indicated in (a) and tumor-infiltrating Foxp3-GFP+ Tregs were FACS-sorted and tested in ex vivo suppression assays with CellTrace Violet (CTV)-labeled CD8+ T cells activated with anti-CD3 in the presence of 0.5 or 10 mM glucose (b). (b) Flow cytometry of CD44 and CD25 expression in CD8+ T cells cultured with B16-Sc- vs. B16-KD-derived Tregs (top) and (bottom) quantification of proliferation (CTV dilution by CTV MFI) of dividing CTVlo CD8+ T cells and Treg suppression of CD8+ T-cell proliferation in the same culture conditions (n=3, mean ± SD; 2-sided unpaired t test; 1 representative of 2 independent experiments). (c) Quantification by flow cytometry of IFN-γ and TNF-α expression in Tregs co-cultured with 4T1-Sc or 4T1-KD cells in 5 mM glucose RPMI1640 for 24 h in the presence of soluble anti-CD3, IL-2 and anti-CTLA-4 (n=3, mean ± SD; 2-sided unpaired t test; n=1 experiment). (d) Glucose consumption and lactate production by NMuMg benign mammary gland cell line vs. 4T1 cells (n=6, mean ± SD; 2-sided unpaired t test; n=1 experiment with NMuMg). (e) Quantification by flow cytometry of IFN-γ and TNF-α expression in Tregs cultured for 48 h with 4T1-Sc, 4T1-KD- or NMuMg-conditioned media (11 mM glucose complete RPMI1640) in the presence of plate-bound anti-CD3, IL-2 and anti-CTLA-4 or an IgG control (n=3, mean ± SD; 2-sided unpaired t test; n=1 experiment). * = P<0.05; ** = P<0.01; *** = P<0.001.
Extended Data Figure 8. Loss of Treg functional stability induced by anti-CTLA-4 depends on Treg glycolysis and CD28 signaling.
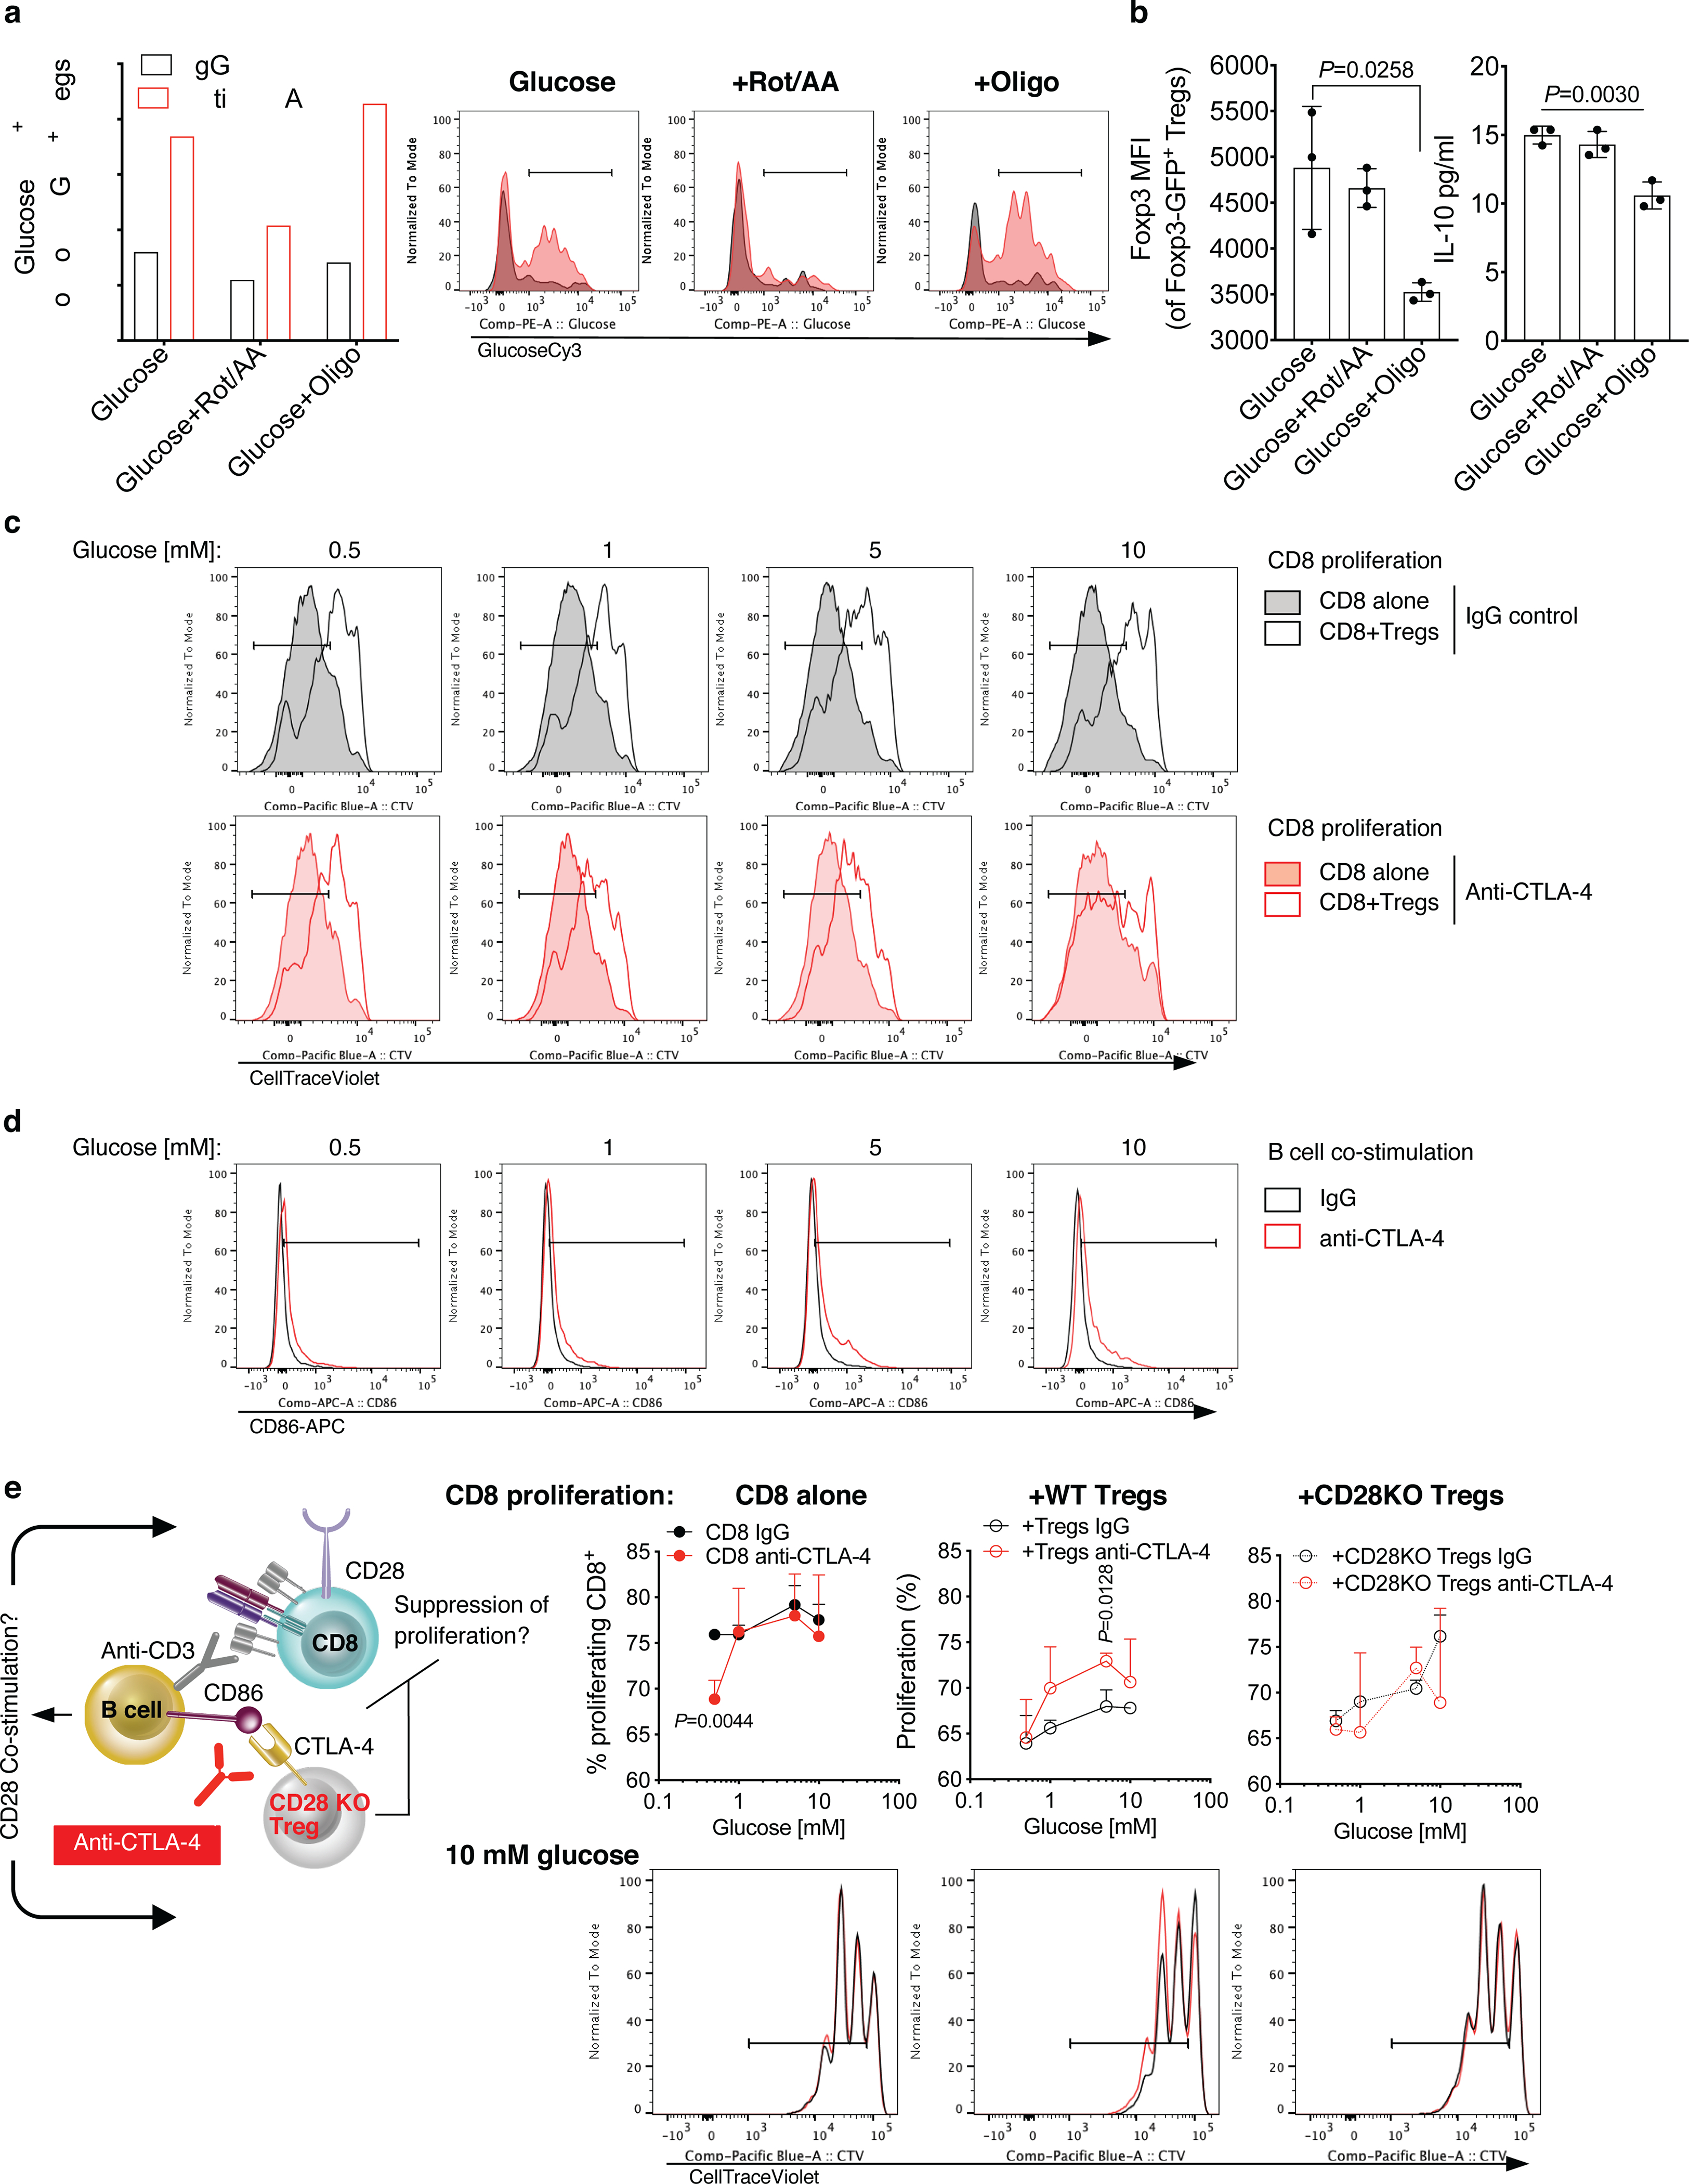
(a) Quantification and representative plots of GlucoseCy3 staining by flow cytometry of Tregs activated as in Figure 4c in the presence of 10 mM glucose ± rotenone/antimycin A (Rot/AA) or oligomycin (Oligo) and treated with anti-CTLA-4 or IgG control (average of 2 biological replicates/condition; 1 representative of 2 independent experiments). (b) Foxp3 expression by flow cytometry and IL-10 production by Luminex-based bead immunoassay in Tregs activated in the presence of 10 mM glucose ± Rot/AA or Oligo (n=3, mean ± SD; 2-sided unpaired t test; 1 representative of 3 independent experiments). (c,d) Representative plots of in vitro assays reported in Figure 4f,g. Representative proliferation (CellTraceViolet dilution) by flow cytometry of activated CD8+ T cells cultured alone or in the presence of Tregs at the indicated glucose concentrations and treated with anti-CTLA-4 or an IgG control (c). (d) Representative CD86 staining by flow cytometry on B cells from co-cultures with CD8+ T cells and Tregs treated as in (c). (e) In vitro suppression assay with CD25hi Tregs immunomagnetically purified from spleens of naïve WT or CD28 KO mice cultured for 48 h with CellTraceViolet-labeled CD8+ T cells and B cells and activated with anti-CD3 in the presence of anti-CTLA-4 or IgG control and the indicated glucose concentrations (n=3/conditions except for “+CD28 KO Tregs” at 1–10 mM glucose, n=2; mean ± SD; 2-sided unpaired t test; 1 representative of 2 independent experiments).
Extended Data Figure 9. CD28 agonism and CTLA-4 blockade, but not PD-1 blockade, drive loss of Treg functional stability.
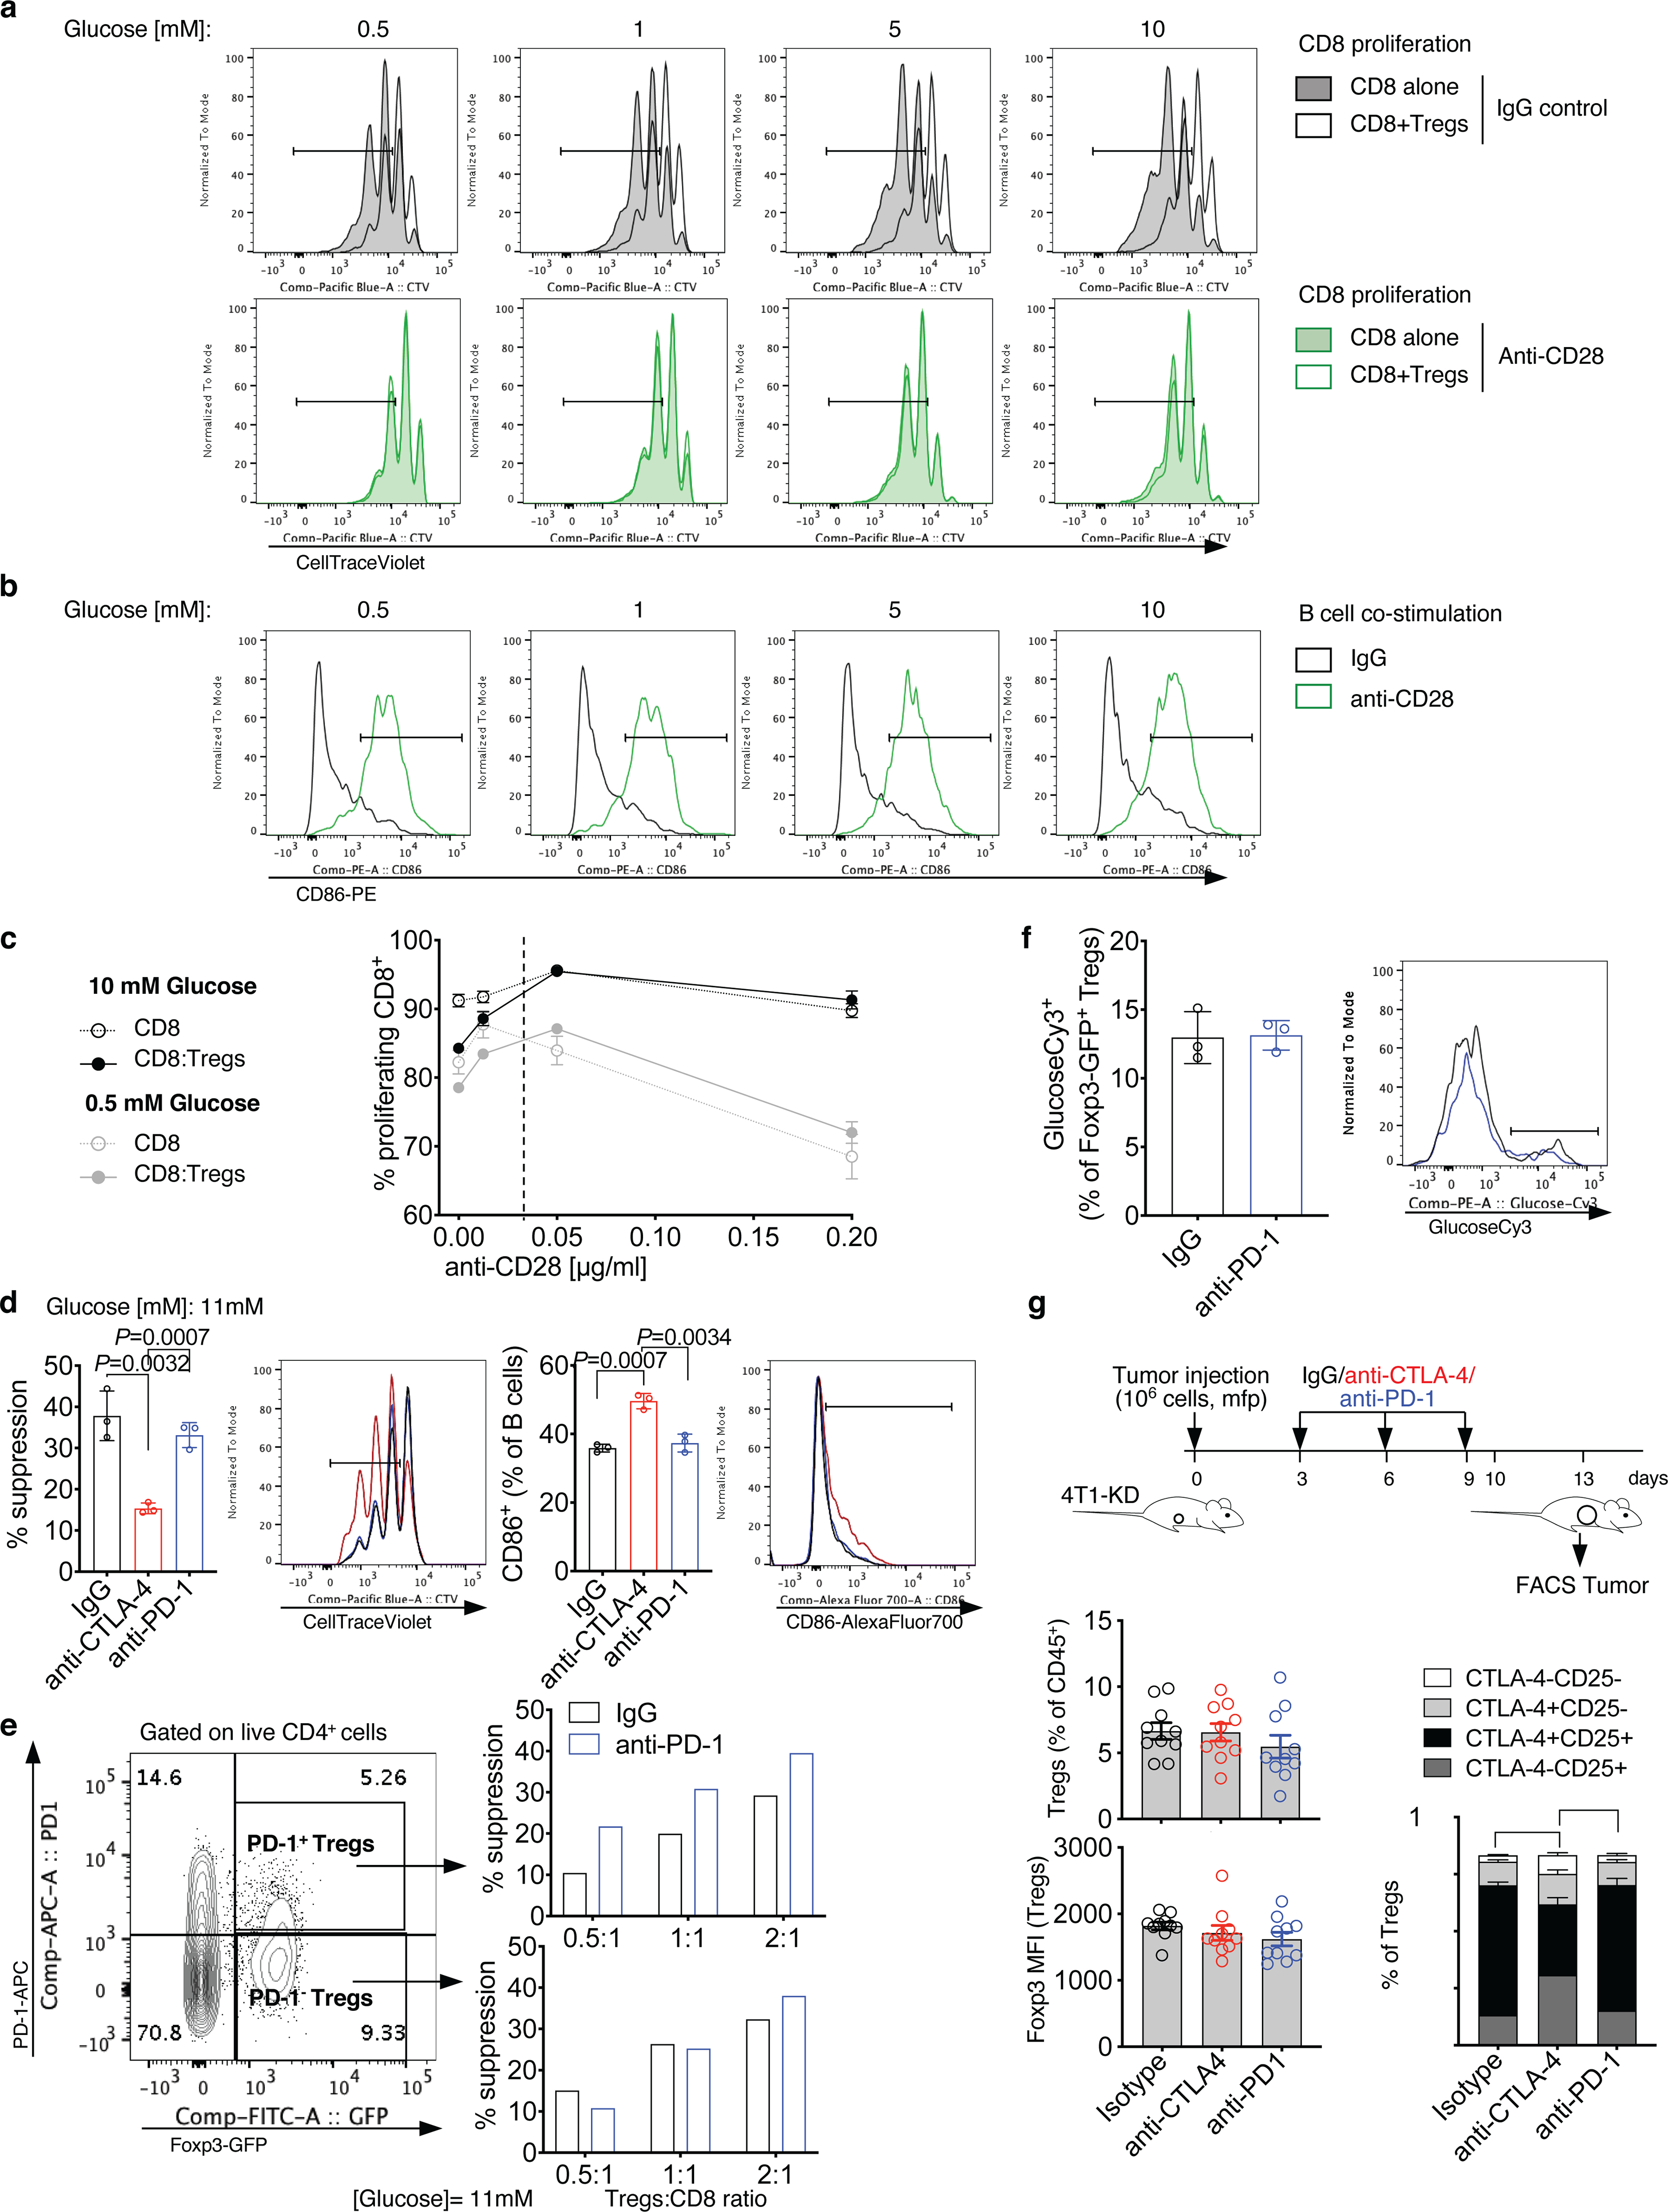
(a,b) Representative flow cytometry plots of in vitro assays reported in Figure 4i,j. Representative proliferation (CellTraceViolet dilution) by flow cytometry of activated CD8+ T cells cultured alone or in the presence of Tregs at the indicated glucose concentrations and treated with anti-CD28 (2 μg/ml) or IgG control (a). (b) Representative CD86 staining by flow cytometry on B cells from co-cultures with CD8+ T cells and Tregs treated as in (a). (c) Proliferation of CD8+ T cells cultured alone or with Tregs in 0.5 mM (gray) or 10 mM glucose (black) and activated with increasing concentrations of anti-CD28 (0–0.2 μg/ml) from 1 of 2 independent experiments (n=3, mean ± SD; 2-sided unpaired t test). (d) Quantification and representative plots showing suppression of CD4+ T-cell proliferation (left) and CD86 expression on B cells (right) by flow cytometry in culture with Tregs treated with anti-CTLA-4, anti-PD-1 or an IgG control in complete RPMI1640 containing 11 mM glucose. Percent suppression was calculated relative to proliferation of CD4+ T cells cultured alone in the same treatment conditions (n=3; mean ± SD; 2-sided unpaired t test; n=1 experiment with anti-PD-1). (e) Suppression of proliferation of CD8+ T cells cultured at the indicated ratios with Foxp3-GFP+PD-1+ Tregs (top) or Foxp3-GFP+PD-1− Tregs (bottom) FACS-sorted from spleens of naïve Foxp3-GFP mice and incubated with anti-PD-1 or IgG control for 48 h (representative results from 1 experiment conducted with CD8+ and CD4+ as target T cells with similar results). (f) Quantification and representative plots of GlucoseCy3 staining by flow cytometry in Tregs activated as in Figure 4c and treated with anti-PD-1 or IgG control (n=3, mean ± SD; 1 representative of 2 independent experiments). (g) Flow cytometry quantification and phenotypic analysis of Tregs from 4T1-KD tumors treated with anti-CTLA-4, anti-PD-1 or IgG control as indicated (n=10 mice/group, mean ± SEM; 2-sided unpaired t test; 1 representative of 2 independent experiments). ** = P<0.01; *** = P<0.001.
Extended Data Figure 10. Limiting Treg glucose metabolism prevents anti-CTLA-4-mediated Treg destabilization in glycolysis-defective tumors.
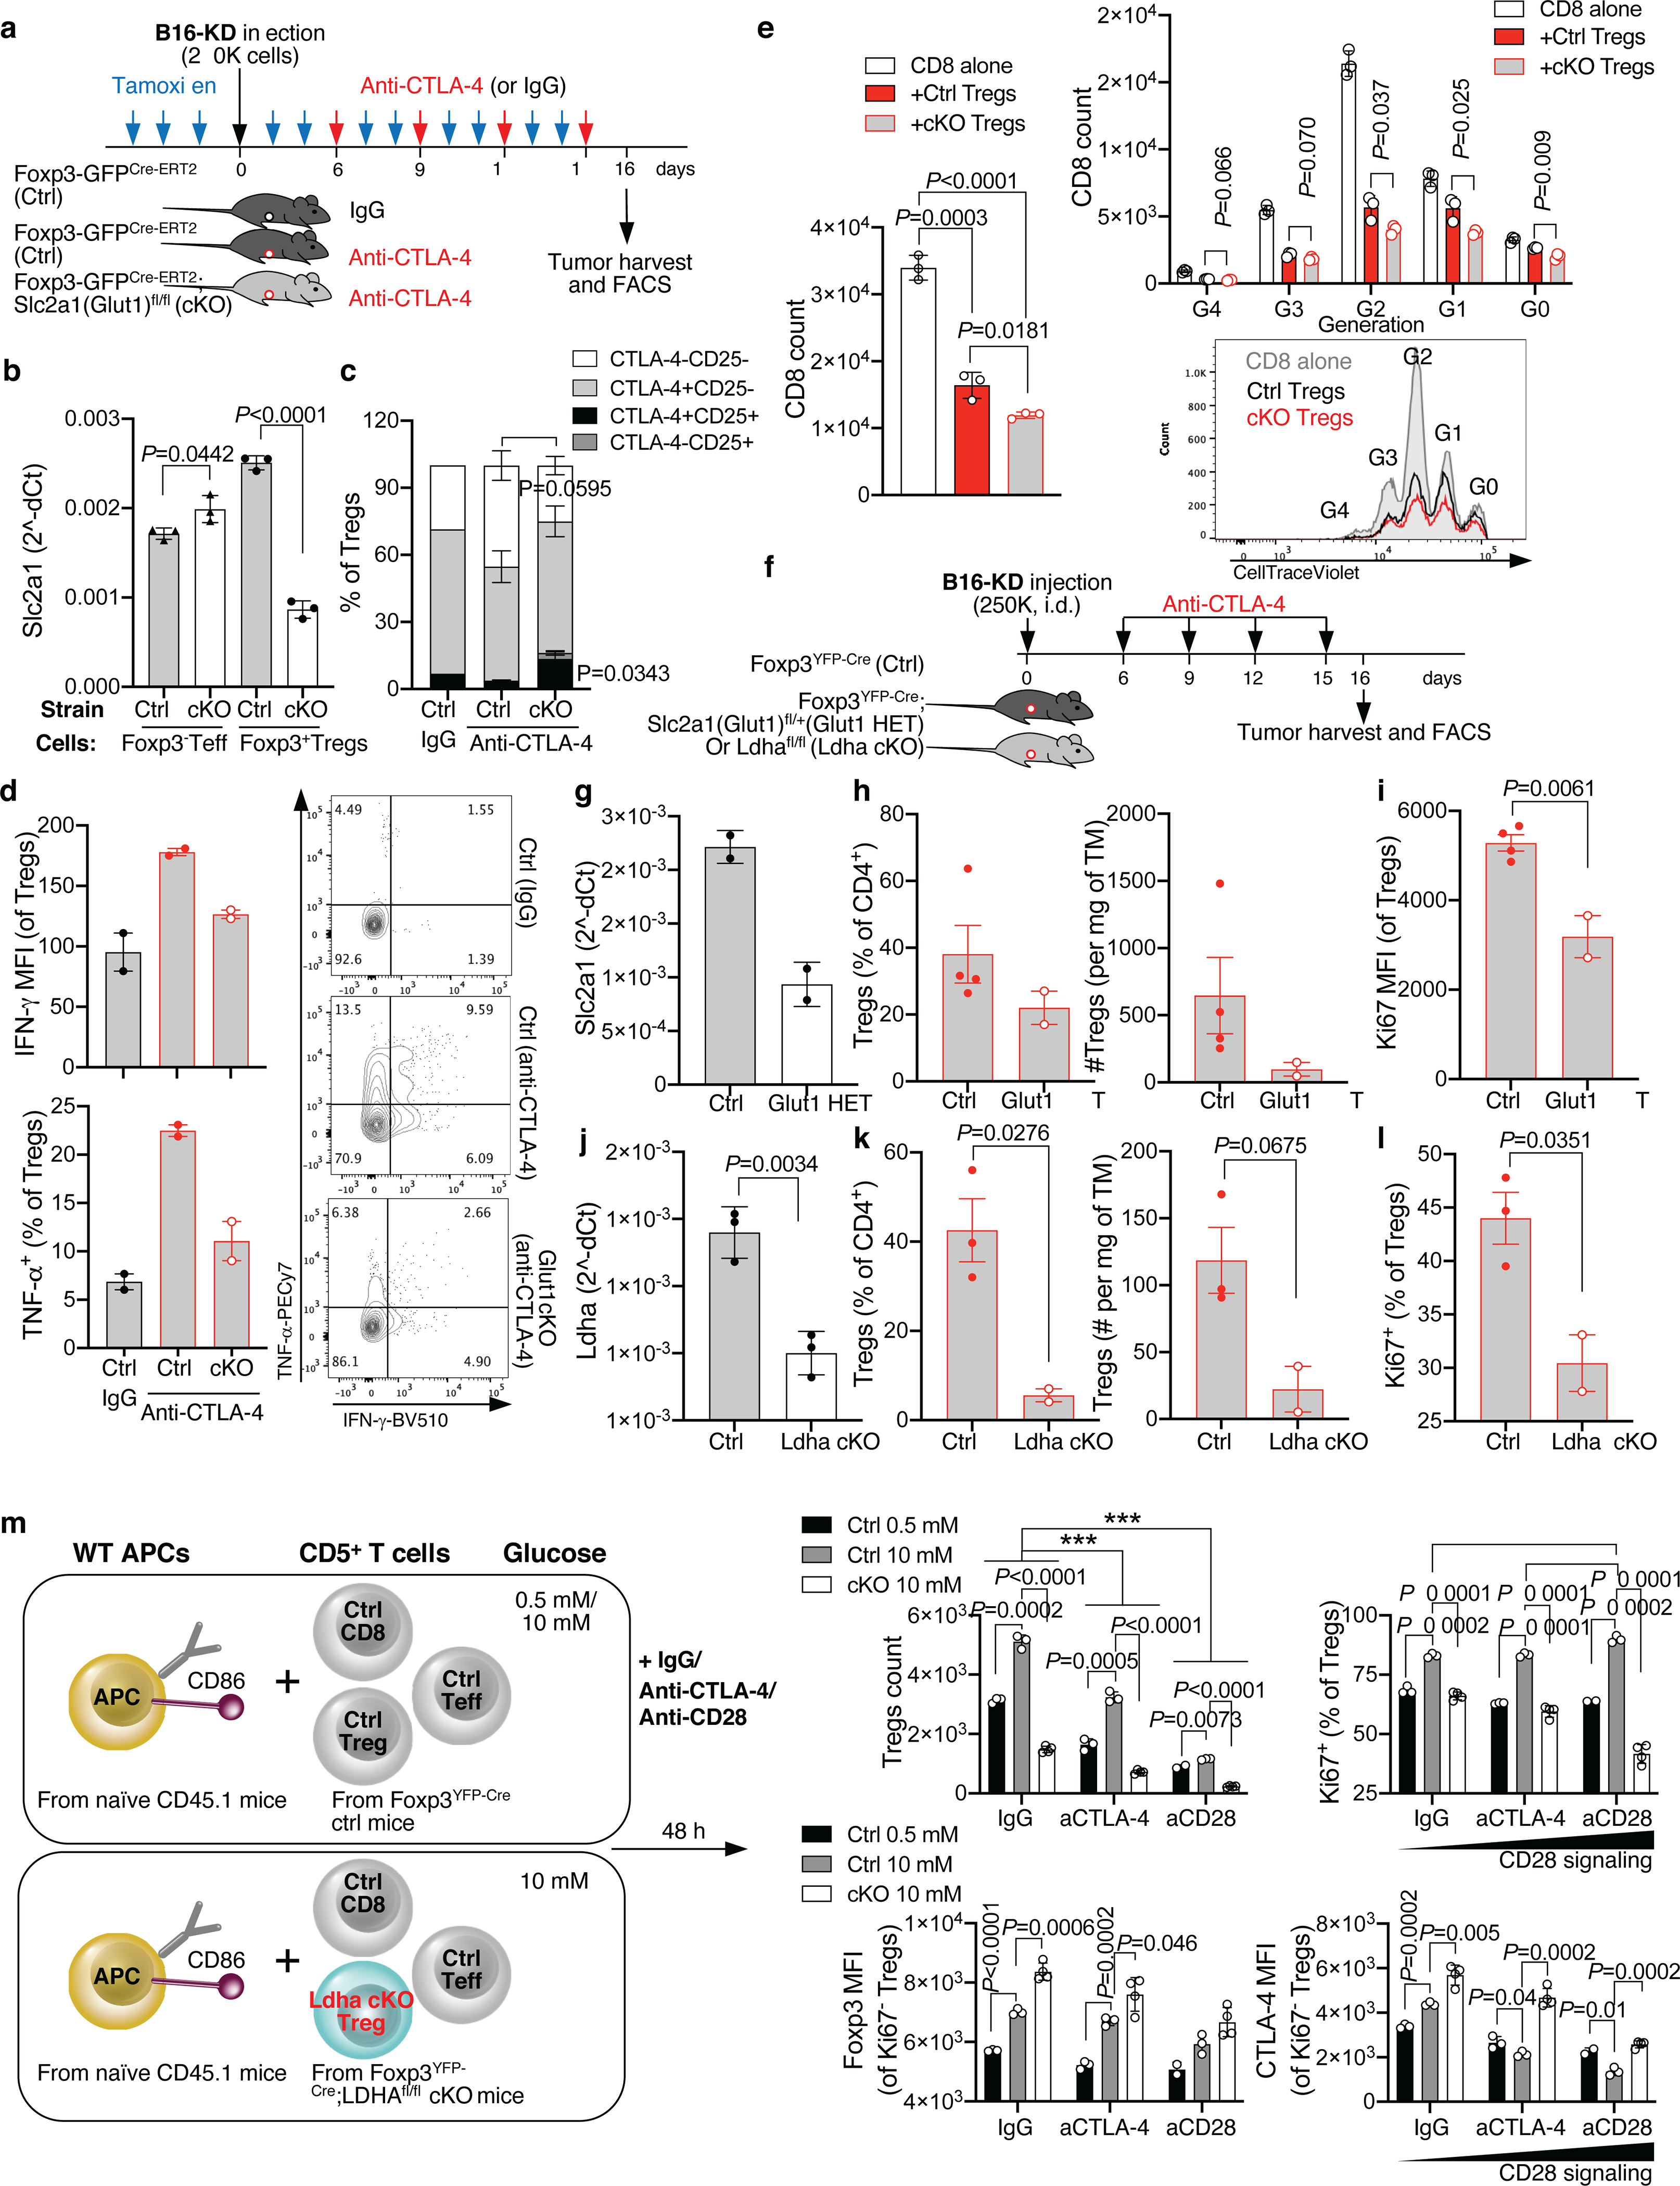
(a) Foxp3GFP-Cre-ERT2;Slc2a1(Glut1)fl/fl (cKO) and Foxp3GFP-Cre-ERT2 control mice (ctrl) were implanted with B16-KD cells and treated with anti-CTLA-4 or IgG after induction of Glut1 deletion with tamoxifen as indicated. Tamoxifen treatment was continued throughout the treatment duration. (b) Slc2a1(Glut1) mRNA quantification relative to beta actin in Foxp3-GFP− Teff and Foxp3-GFP+ Tregs from the spleens of ctrl and Glut1 cKO mice at the end of treatment as in (a) (n=3; mean ± SD, 2-sided unpaired t test). (c,d) Flow cytometry analysis of CD25 and CTLA-4 (c; n=3 except for ctrl IgG, n=1), and IFN-γ and TNF-α expression (d; n=2) in tumor-infiltrating Tregs from mice treated as in (a) (mean ± SEM; 2-sided unpaired t test; 1 representative of 2 independent experiments). (e) Ex vivo suppression assay with Tregs sorted from the spleens of ctrl and Glut1 cKO mice treated with anti-CTLA-4 as in (a). Treg suppression of CD8+ T-cell expansion after 48 h co-culture in 10 mM glucose and representative flow cytometry plot showing CTV proliferation and generation (G) overlay of CD8+ T cells cultured alone (gray) or in the presence of ctrl (black) or Glut1 cKO (red) Tregs (n=3; mean ± SD; 2-sided unpaired t test; 1 representative of 2 independent experiments). (f-l) Foxp3YFP-Cre;Slc2a1(Glu1)fl/+ (Glut1 HET) or Foxp3YFP-Cre;Ldhafl/fl (Ldha cKO) and Foxp3YFP-Cre mice (ctrl) were implanted with B16-KD cells and treated with anti-CTLA-4 (f). (g) Slc2a1(Glut1) mRNA quantification relative to beta actin in Foxp3-GFP+ Tregs from spleens of ctrl and Glut1 HET mice (n=2; mean ± SD). (h,i) Quantification by flow cytometry of intra-tumor Tregs (h) and their expression of Ki67 (i) in ctrl and Glut1 HET mice treated as in (f) (ctrl, n=4; HET, n=2; mean ± SEM; 2-sided unpaired t test; 1 representative of 2 independent experiments with mice carrying Glut1 HET or cKO Tregs). (j) Ldha mRNA quantification relative to beta actin in Foxp3-GFP+ Tregs from spleens of ctrl and Ldha cKO mice (n=3; mean ± SD; 2-sided unpaired t test). (k,l) Quantification by flow cytometry of intra-tumor Tregs (k) and their expression of Ki67 (l) in ctrl or Ldha cKO mice treated as in (f) (ctrl, n=3; Ldha cKO, n=2; mean ± SEM, 2-sided unpaired t test; 1 representative of 2 independent experiments). (m) Schematic representation of the culture conditions used in (n,o). CD5+ T cells from Ldha cKO or ctrl mice were co-cultured for 48 h with CD45.1+ congenic APCs (either B cells or T-cell depleted splenocytes) as scaffold for soluble anti-CD3 crosslinking in low (0.5 mM) or higher (10 mM) glucose concentrations as indicated. (n) Quantification by flow cytometry of Ldha cKO or ctrl Foxp3+CD4+ Tregs and their expression of Ki67 after activation as in (m). (o) Foxp3 and CTLA-4 expression by flow cytometry (MFI) in Ki67-negative Ldha cKO or ctrl Tregs from cultures as in (m). Ctrl 0.5 mM glucose, n=3 except for anti-CD28, n=2; ctrl 10 mM glucose, n=3; cKO, n=4; mean ± SD, 2-sided unpaired t test; 1 representative of 2 independent experiments. ** = P<0.01; *** = P<0.001. aCTLA-4, anti-CTLA-4; aCD28, anti-CD28.
Acknowledgements
We thank the Flow Cytometry and Integrated Genomics Operation Cores at MSK for technical assistance. We thank Dr. Alexander Rudensky for the constructive discussions for the revisions of this manuscript. This research was funded in part through the NIH/NCI R01 CA215136–01A1 and Cancer Center Support Grant P30 CA008748, the Swim Across America, Ludwig Institute for Cancer Research, Parker Institute for Cancer Immunotherapy and Breast Cancer Research Foundation. R.Z. was supported by the Parker Institute for Cancer Immunotherapy scholar and bridge scholar awards. I.S. was supported by R50 CA221810 (NIH/NCI) grant. M.J.W. was supported by T32CA082084 and F31AI149971. P.-C.H. was supported by the SNSF project grants (31003A_182470) and European Research Council Staring Grant (802773-MitoGuide). G.M.D. was supported by DP2AI136598 and R21AI135367.
Footnotes
Competing interests
R.Z. is inventor on patent applications related to work on GITR, PD-1 and CTLA-4. R.Z. is consultant for Leap Therapeutics and iTEOS Belgium SA. Y.S. is currently employed in Genentech and holds equity in Roche. P.-C.H. received research support from Roche-pRED and honorarium from Chungai and Pfizer. P.-C.H. is also a scientific advisory board member of Elixiron Immunotherapeutics and Acepodia. G.M.D. consults for and/or is on the scientific advisory board of BlueSphere Bio, Century Therapeutics, Novasenta, Pieris Pharmaceuticals, and Western Oncolytics/Kalivir; has grants from bluebird bio, Novasenta, Pfizer, Pieris Pharmaceuticals, TCR2, and Kalivir; G.M.D. owns equity in BlueSphere Bio and Novasenta. T.M. is a cofounder and holds an equity in IMVAQ Therapeutics. T.M. is a consultant of Immunos Therapeutics, Pfizer and Immunogenesis. T.M. has research support from Bristol-Myers Squibb; Surface Oncology; Kyn Therapeutics; Infinity Pharmaceuticals, Inc.; Peregrine Pharmaceuticals, Inc.; Adaptive Biotechnologies; Leap Therapeutics, Inc.; and Aprea. T.M. has patents on applications related to work on oncolytic viral therapy, alpha virus-based vaccine, neo antigen modeling, CD40, GITR, OX40, PD-1, and CTLA-4. J.D.W. is consultant for Adaptive Biotech; Amgen; Apricity; Ascentage Pharma; Astellas; AstraZeneca; Bayer; Beigene; Boehringer Ingelheim; Bristol Myers Squibb; Celgene; Chugai; Eli Lilly; Elucida; F Star; Georgiamune; Imvaq; Kyowa Hakko Kirin; Linneaus; Merck; Neon Therapeutics; Polynoma; Psioxus; Recepta; Takara Bio; Trieza; Truvax; Sellas; Serametrix; Surface Oncology; Syndax; Syntalogic, Werewolf Therapeutics. J.D.W. reports grants from Bristol Myers Squibb and Sephora. J.D.W. has equity in Tizona Pharmaceuticals; Adaptive Biotechnologies; Imvaq; Beigene; Linneaus; Apricity; Arsenal IO; Georgiamune. J.D.W. is inventor on patent applications related to work on DNA vaccines in companion animals with cancer, assays for suppressive myeloid cells in blood, oncolytic viral therapy, alphavirus-based vaccines, neo-antigen modeling, CD40, GITR, OX40, PD-1 and CTLA-4. The other authors declare no competing interests.
References
- 1.Frauwirth KA et al. The CD28 signaling pathway regulates glucose metabolism. Immunity 16, 769–777, doi: 10.1016/s1074-7613(02)00323-0 (2002). [DOI] [PubMed] [Google Scholar]
- 2.Hanahan D & Weinberg RA Hallmarks of cancer: the next generation. Cell 144, 646–674, doi: 10.1016/j.cell.2011.02.013 (2011). [DOI] [PubMed] [Google Scholar]
- 3.Buck MD, Sowell RT, Kaech SM & Pearce EL Metabolic Instruction of Immunity. Cell 169, 570–586, doi: 10.1016/j.cell.2017.04.004 (2017). [DOI] [PMC free article] [PubMed] [Google Scholar]
- 4.Chang CH et al. Metabolic Competition in the Tumor Microenvironment Is a Driver of Cancer Progression. Cell 162, 1229–1241, doi: 10.1016/j.cell.2015.08.016 (2015). [DOI] [PMC free article] [PubMed] [Google Scholar]
- 5.Ho PC et al. Phosphoenolpyruvate Is a Metabolic Checkpoint of Anti-tumor T Cell Responses. Cell 162, 1217–1228, doi: 10.1016/j.cell.2015.08.012 (2015). [DOI] [PMC free article] [PubMed] [Google Scholar]
- 6.Martinez AF et al. Metaboloptics: Visualization of the tumor functional landscape via metabolic and vascular imaging. Sci Rep 8, 4171, doi: 10.1038/s41598-018-22480-w (2018). [DOI] [PMC free article] [PubMed] [Google Scholar]
- 7.Simoes RV et al. Metabolic plasticity of metastatic breast cancer cells: adaptation to changes in the microenvironment. Neoplasia 17, 671–684, doi: 10.1016/j.neo.2015.08.005 (2015). [DOI] [PMC free article] [PubMed] [Google Scholar]
- 8.Serganova I et al. Metabolic imaging: a link between lactate dehydrogenase A, lactate, and tumor phenotype. Clin Cancer Res 17, 6250–6261, doi: 10.1158/1078-0432.CCR-11-0397 (2011). [DOI] [PMC free article] [PubMed] [Google Scholar]
- 9.Chiappinelli KB et al. Inhibiting DNA Methylation Causes an Interferon Response in Cancer via dsRNA Including Endogenous Retroviruses. Cell 162, 974–986, doi: 10.1016/j.cell.2015.07.011 (2015). [DOI] [PMC free article] [PubMed] [Google Scholar]
- 10.Nathanson T et al. Somatic Mutations and Neoepitope Homology in Melanomas Treated with CTLA-4 Blockade. Cancer immunology research 5, 84–91, doi: 10.1158/2326-6066.CIR-16-0019 (2017). [DOI] [PMC free article] [PubMed] [Google Scholar]
- 11.Singer K et al. Warburg phenotype in renal cell carcinoma: high expression of glucose-transporter 1 (GLUT-1) correlates with low CD8(+) T-cell infiltration in the tumor. Int J Cancer 128, 2085–2095, doi: 10.1002/ijc.25543 (2011). [DOI] [PubMed] [Google Scholar]
- 12.Ottensmeier CH et al. Upregulated Glucose Metabolism Correlates Inversely with CD8+ T-cell Infiltration and Survival in Squamous Cell Carcinoma. Cancer Res 76, 4136–4148, doi: 10.1158/0008-5472.CAN-15-3121 (2016). [DOI] [PubMed] [Google Scholar]
- 13.Brand A et al. LDHA-Associated Lactic Acid Production Blunts Tumor Immunosurveillance by T and NK Cells. Cell Metab 24, 657–671, doi: 10.1016/j.cmet.2016.08.011 (2016). [DOI] [PubMed] [Google Scholar]
- 14.Scrimieri F et al. Murine leukemia virus envelope gp70 is a shared biomarker for the high-sensitivity quantification of murine tumor burden. Oncoimmunology 2, e26889, doi: 10.4161/onci.26889 (2013). [DOI] [PMC free article] [PubMed] [Google Scholar]
- 15.Serganova I et al. LDH-A regulates the tumor microenvironment via HIF-signaling and modulates the immune response. PLoS One 13, e0203965, doi: 10.1371/journal.pone.0203965 (2018). [DOI] [PMC free article] [PubMed] [Google Scholar]
- 16.Selby MJ et al. Anti-CTLA-4 antibodies of IgG2a isotype enhance antitumor activity through reduction of intratumoral regulatory T cells. Cancer immunology research 1, 32–42, doi: 10.1158/2326-6066.CIR-13-0013 (2013). [DOI] [PubMed] [Google Scholar]
- 17.Bruhns P Properties of mouse and human IgG receptors and their contribution to disease models. Blood 119, 5640–5649, doi: 10.1182/blood-2012-01-380121 (2012). [DOI] [PubMed] [Google Scholar]
- 18.Sonveaux P et al. Targeting the lactate transporter MCT1 in endothelial cells inhibits lactate-induced HIF-1 activation and tumor angiogenesis. PLoS One 7, e33418, doi: 10.1371/journal.pone.0033418 (2012). [DOI] [PMC free article] [PubMed] [Google Scholar]
- 19.King MP & Attardi G Human cells lacking mtDNA: repopulation with exogenous mitochondria by complementation. Science 246, 500–503, doi: 10.1126/science.2814477 (1989). [DOI] [PubMed] [Google Scholar]
- 20.Klein Geltink RI et al. Mitochondrial Priming by CD28. Cell 171, 385–397 e311, doi: 10.1016/j.cell.2017.08.018 (2017). [DOI] [PMC free article] [PubMed] [Google Scholar]
- 21.Michalek RD et al. Cutting edge: distinct glycolytic and lipid oxidative metabolic programs are essential for effector and regulatory CD4+ T cell subsets. J Immunol 186, 3299–3303, doi: 10.4049/jimmunol.1003613 (2011). [DOI] [PMC free article] [PubMed] [Google Scholar]
- 22.He N et al. Metabolic control of regulatory T cell (Treg) survival and function by Lkb1. Proc Natl Acad Sci U S A 114, 12542–12547, doi: 10.1073/pnas.1715363114 (2017). [DOI] [PMC free article] [PubMed] [Google Scholar]
- 23.Weinberg SE et al. Mitochondrial complex III is essential for suppressive function of regulatory T cells. Nature 565, 495–499, doi: 10.1038/s41586-018-0846-z (2019). [DOI] [PMC free article] [PubMed] [Google Scholar]
- 24.Kamphorst AO et al. Rescue of exhausted CD8 T cells by PD-1-targeted therapies is CD28-dependent. Science 355, 1423–1427, doi: 10.1126/science.aaf0683 (2017). [DOI] [PMC free article] [PubMed] [Google Scholar]
- 25.Hui E et al. T cell costimulatory receptor CD28 is a primary target for PD-1-mediated inhibition. Science 355, 1428–1433, doi: 10.1126/science.aaf1292 (2017). [DOI] [PMC free article] [PubMed] [Google Scholar]
- 26.Delgoffe GM et al. The mTOR kinase differentially regulates effector and regulatory T cell lineage commitment. Immunity 30, 832–844, doi: 10.1016/j.immuni.2009.04.014 (2009). [DOI] [PMC free article] [PubMed] [Google Scholar]
- 27.Wang H et al. CD36-mediated metabolic adaptation supports regulatory T cell survival and function in tumors. Nature immunology 21, 298–308, doi: 10.1038/s41590-019-0589-5 (2020). [DOI] [PMC free article] [PubMed] [Google Scholar]
- 28.Wing K et al. CTLA-4 control over Foxp3+ regulatory T cell function. Science 322, 271–275, doi: 10.1126/science.1160062 (2008). [DOI] [PubMed] [Google Scholar]
- 29.Qureshi OS et al. Trans-endocytosis of CD80 and CD86: a molecular basis for the cell-extrinsic function of CTLA-4. Science 332, 600–603, doi: 10.1126/science.1202947 (2011). [DOI] [PMC free article] [PubMed] [Google Scholar]
- 30.Wing JB, Ise W, Kurosaki T & Sakaguchi S Regulatory T cells control antigen-specific expansion of Tfh cell number and humoral immune responses via the coreceptor CTLA-4. Immunity 41, 1013–1025, doi: 10.1016/j.immuni.2014.12.006 (2014). [DOI] [PubMed] [Google Scholar]
- 31.Chang CH et al. Posttranscriptional control of T cell effector function by aerobic glycolysis. Cell 153, 1239–1251, doi: 10.1016/j.cell.2013.05.016 (2013). [DOI] [PMC free article] [PubMed] [Google Scholar]
- 32.Peng M et al. Aerobic glycolysis promotes T helper 1 cell differentiation through an epigenetic mechanism. Science 354, 481–484, doi: 10.1126/science.aaf6284 (2016). [DOI] [PMC free article] [PubMed] [Google Scholar]
- 33.Singer K et al. Topical Diclofenac Reprograms Metabolism and Immune Cell Infiltration in Actinic Keratosis. Front Oncol 9, 605, doi: 10.3389/fonc.2019.00605 (2019). [DOI] [PMC free article] [PubMed] [Google Scholar]
- 34.Boudreau A et al. Metabolic plasticity underpins innate and acquired resistance to LDHA inhibition. Nat Chem Biol 12, 779–786, doi: 10.1038/nchembio.2143 (2016). [DOI] [PubMed] [Google Scholar]
- 35.Luengo A, Gui DY & Vander Heiden MG Targeting Metabolism for Cancer Therapy. Cell Chem Biol 24, 1161–1180, doi: 10.1016/j.chembiol.2017.08.028 (2017). [DOI] [PMC free article] [PubMed] [Google Scholar]
- 36.Yeung C et al. Targeting Glycolysis through Inhibition of Lactate Dehydrogenase Impairs Tumor Growth in Preclinical Models of Ewing Sarcoma. Cancer Res 79, 5060–5073, doi: 10.1158/0008-5472.CAN-19-0217 (2019). [DOI] [PMC free article] [PubMed] [Google Scholar]
- 37.Rizwan A et al. Relationships between LDH-A, lactate, and metastases in 4T1 breast tumors. Clin Cancer Res 19, 5158–5169, doi: 10.1158/1078-0432.CCR-12-3300 (2013). [DOI] [PMC free article] [PubMed] [Google Scholar]
- 38.Newman AM et al. Robust enumeration of cell subsets from tissue expression profiles. Nat Methods 12, 453–457, doi: 10.1038/nmeth.3337 (2015). [DOI] [PMC free article] [PubMed] [Google Scholar]
- 39.Zappasodi R et al. Non-conventional Inhibitory CD4(+)Foxp3(−)PD-1(hi) T Cells as a Biomarker of Immune Checkpoint Blockade Activity. Cancer Cell 33, 1017–1032 e1017, doi: 10.1016/j.ccell.2018.05.009 (2018). [DOI] [PMC free article] [PubMed] [Google Scholar]
- 40.Gerriets VA et al. Metabolic programming and PDHK1 control CD4+ T cell subsets and inflammation. J Clin Invest 125, 194–207, doi: 10.1172/JCI76012 (2015). [DOI] [PMC free article] [PubMed] [Google Scholar]
Associated Data
This section collects any data citations, data availability statements, or supplementary materials included in this article.
Data Availability Statement
Human melanoma RNAseq data sets investigated in this study were previously reported9,10 and have been deposited to the Gene Expression Omnibus (GEO) repository (GSE165278). The 4T1 RNAseq data sets generated for this study have been submitted to the GEO repository (GSE164051). All other relevant data supporting the findings of this study are available in the source data files.


