Abstract
In this study, integrated experimental tests and computational modeling are proposed to investigate the failure mechanisms of open-hole cross-ply carbon fiber reinforced polymer (CFRP) laminated composites. In particular, we propose two effective methods, which include width-tapered double cantilever beam (WTDCB) and fixed-ratio mixed-mode end load split (FRMMELS) tests, to obtain the experimental data more reliably. We then calibrate the traction-separation laws of cohesive zone model (CZM) used among laminas of the composites by leveraging these two methods. The experimental results of fracture energy, i.e. GIc and GTc, obtained from WTDCB and FRMMELS tests are generally insensitive to the crack length thus requiring no effort to accurately measure the crack tip. Moreover, FRMMELS sample contains a fixed mixed-mode ratio of GIIc/GTc depending on the width taper ratio. Examining comparisons between experimental results of FRMMELS tests and failure surface of B-K failure criterion predicted from a curve fitting, good agreement between the predictions and experimental data has been found, indicating that FRMMELS tests are an effective method to determine mixed-mode fracture criterion. In addition, a coupled experimental-computational modeling of WTDCB, edge notched flexure, and FRMMELS tests are adopted to calibrate and validate the interfacial strengths. Finally, failure mechanisms of open-hole cross-ply CFRP laminates under flexural loading have been studied systematically using experimental and multi-scale computational analyses based on the developed CZM model. The initiation and propagation of delamination, the failure of laminated layers as well as load-displacement curves predicted from computational analyses are in good agreement with what we have observed experimentally.
Keywords: Carbon fiber reinforced polymer laminates, Computational modeling, Open-hole, Delamination, Cohesive zone model
1. Introduction
Carbon fiber reinforced polymer (CFRP) laminated composites are widely used in structural design of automotive components because of their high specific strength, high specific stiffness, and other desirable characteristics. Although their physical and mechanical properties have made them a superior candidate in many applications, their failure/damage properties and behaviors dictate, to a large extent, their limitations in these applications. One of the most important damage mechanisms, commonly referred to as delamination, is caused by debonding of two adjacent plies of the laminate [1, 2]. Furthermore, composite structures usually experience mixed-mode delamination in the real engineering applications, for instance, a mixed normal stress- and shear stress-led delamination. Thus, good understanding of the onset and propagation of the mixed-mode delamination as well as the underlying mechanisms is critical to guide and promote the applications of CFRP laminated composites.
Most numerical and theoretical analyses on the delamination growth are based on fracture mechanics approach, which basically evaluates the energy release rate. For instance, virtual crack closure technique (VCCT), first formulated by Rybicki and Kanninen [3], is computationally simple for calculation of energy release rate in flat laminates with an embedded delamination. However, it is not an efficient method for the simulation of delamination growth because it requires complex moving mesh techniques to advance the crack front when the energy release rate reaches its critical value. Compared to VCCT, cohesive zone model (CZM) incorporates both damage and fracture mechanics theories and thus allows investigation of both the onset and propagation of delamination in the same analysis. The CZM method presents fracture as a gradual phenomenon in which separation takes place across a cohesive zone modeled interface represented by a local traction-separation relationship[4–13]. Williams et al. [14] introduced various simplified forms of traction-separation laws, and bilinear CZM has been the most often used one due to its simplicity and good accuracy in the prediction of delamination growth in laminated composites [15]. Furthermore, CZM method offers significant flexibility to consider the mixed-mode failure, especially in the delamination case [16].
The penalty stiffness, interfacial strength and fracture toughness are three parameters of mixed-mode CZM that often determine the accuracy of the computational analysis by using cohesive elements. Among these parameters, the fracture toughness of different failure modes can be obtained experimentally through standardized tests, such as the double cantilever beam (DCB, mode-I) [17], end-notched flexure (ENF, mode-II) [18], and mixed-mode bending (MMB, mixed-mode) [19]. Recently, researchers have also designed and employed innovative specimens to conduct fracture toughness tests, such as reinforced double cantilever beam [20], adhesive strip modified double cantilever beam [21], tapered double cantilever beam [22], crack lap shear [23, 24], asymmetric double cantilever beam [25], single leg bend [26, 27], and four-point bending tests [28]. However, some of the abovementioned test specimens have intrinsic shortcomings. For example, some of them produce only limited mixed-mode conditions and some need complex fixtures for loading [29]. Generally speaking, a suitable fracture toughness test specimen should have some advantages, such as simple configuration, inexpensive preparation method, ease of loading set-up, and ability of providing accurate experimental results. Compared to the fracture toughness, it is much less straightforward to determine the interfacial strengths and the penalty stiffness for accurate computational modeling, and no standard tests are available for the direct measurement of interfacial strengths and the penalty stiffness is usually a non-physical numerical parameter [30]. Meanwhile, in order to determine relative displacements at the crack tip, those above standardized fracture toughness tests require the use of external equipment such as digital image correlation (DIC) or linear voltage differential transformer (LVDT) [31–33] for monitoring the crack position throughout the test, which inevitably introduces certain degree of operator dependency and measurement errors. Experimental difficulties associated with the existing measurement methods have been reported, most often related to inaccurate results in the measurement of very small crack tip separations [33]. In summary, despite recent progress, simple and accurate methods for determining the traction-separation law of mixed-mode CZM are extremely important and urgently needed for effective design and analysis of different composite materials and structures.
Additionally, the presence of irregularities in the geometry of a composite structure, such as holes, notches, and changes in cross-section area causes stress concentrations. During the manufacturing of a laminated composite structure, open holes are usually employed, for example, for joining several elements or for access (doors, windows, vents, etc.) [34]. Due to the prominent stress concentration phenomena around the fastener hole, open hole is usually the weakest section in the laminate structure. Statistics show that approximately 70% of the failure of structures is initiated from open hole [35]. This issue is more serious to composite joints, and the stress concentration induced by holes usually results in delamination and a dramatic reduction in mechanical performance. There are two main reasons: (1) composites are generally brittle materials, showing nearly linear characteristics before failure, which means little local yielding and stress redistribution around fastener holes; (2) composites are anisotropic materials, which are susceptible to delamination and sensitive to environmental conditions. The anisotropy will lead to a high-stress concentration and low transverse strength of joints [35]. In recent years, studies have focused on the mechanical behavior of open-hole composite laminates by carrying out experimental tests [36–39]. In addition, recent studies have presented innovative ways to predict delamination damage in open-hole tension (OHT) [40–42], open-hole compression (OHC) [43, 44], and impact-damaged open-hole composite laminates [12, 45, 46]. In engineering practice of laminated composite parts, the major internal stresses are induced by bending loads [3], which may cause delamination in the laminates. Consequently, it is necessary to conduct experimental and computational research on the flexural behavior of open-hole cross-ply laminates for the acquisition of valid data to provide support for composite joints.
In the current work, with the aim to determine the accurate traction-separation law of mixed-mode CZM, an integrated method of both experimental tests and computational modeling are proposed. Specifically, first, width-tapered double cantilever beam (WTDCB) and fixed-ratio mixed-mode end load split (FRMMELS) tests are carefully designed and utilized to characterize the mode-I fracture toughness, mixed-mode fracture toughness, and Benzeggagh-Kenane (B-K) fracture criterion [47]. Second, computational modeling of WTDCB, edge notched flexure (ENF), and FRMMELS tests are carried out to calibrate the inter-laminar interfacial strengths and get validated by the experimental results. Finally, to obtain a more comprehensive understanding of the failure mechanisms in the open-hole cross-ply laminates under four-point bending load, an integrated experimental and multi-scale computational framework based on mixed-mode CZM is established. In the multi-scale computational model, open-hole cross-ply laminates are modeled by means of an elastic-plastic-damage model by combining the Liu-Huang-Stout (or LHS) yield criterion [48] and RVE-based failure criteria [13, 49]. ABAQUS VUMAT subroutine is adopted to calculate the composite properties degradation. The interface between the adjacent layers is modeled by means of mixed-mode CZM. Additionally, the corresponding damage initiation and propagation as well as load-carrying capacity of the open-hole cross-ply laminates under four-point bending load are compared and analyzed through both computational and experimental results.
2. Description of mixed-mode CZM
The initial response of the CZM is considered to be fully linear until the condition defined by the damage criterion is met. Damage initiation is based on a quadratic stress criterion applied on the interface, as described by Ye [24] and Brewer [25]. This criterion determines damage onset at the interface, and the degradation starts at a specific point. Moreover, it contains strong correlation with stress values when delamination failure starts. Such criterion states damage onset when the criterion is set to 1.
| (1) |
where the terms σn, τs, and τt are the normal and shear stresses transferred by the interface, respectively. The terms Nn, Ss, and St stand for interface strength in tension and shear, respectively. Symbol < > represents Macaulay brackets, indicating that a compressive normal stress does not contribute to the damage initiation.
Once the damage initiates, the stress transferred through the crack is reduced depending on an interface damage parameter d. The corresponding traction-separation law is expressed by:
| (2) |
where K is the interface stiffness, which should be large enough to keep a stiff connection between two neighboring sublaminates; , and are the stress components from the traction-separation law if failure has yet happened. The damage variable d is a function of the displacement jump and accounts for the reduction in the load-carrying ability of the material as a result of the damage [50].
Camanho and Davila [21] also recommended using effective displacement in order to capture the damage evolution at the interface under a combination of normal and shear strains.
| (3) |
In this case, a damage evolution variable d is introduced, and Eqn. (4) shows its value for a linear softening law, as the one showed in Fig. 1. d is defined as a relationship between the displacement jumps.
| (4) |
where and denote the damage onset and final displacement jumps at mixed-mode loading. is the maximum mixed-mode displacement jump in loading history, the threshold value of the necessary displacement jump to accumulate damage under unloading or reloading conditions. d is monotonically increase to show the damage status of material: d = 0 for elastic phase; 0 < d < 1 for softening phase; and d = 1for the completely debonded condition.
Figure 1.
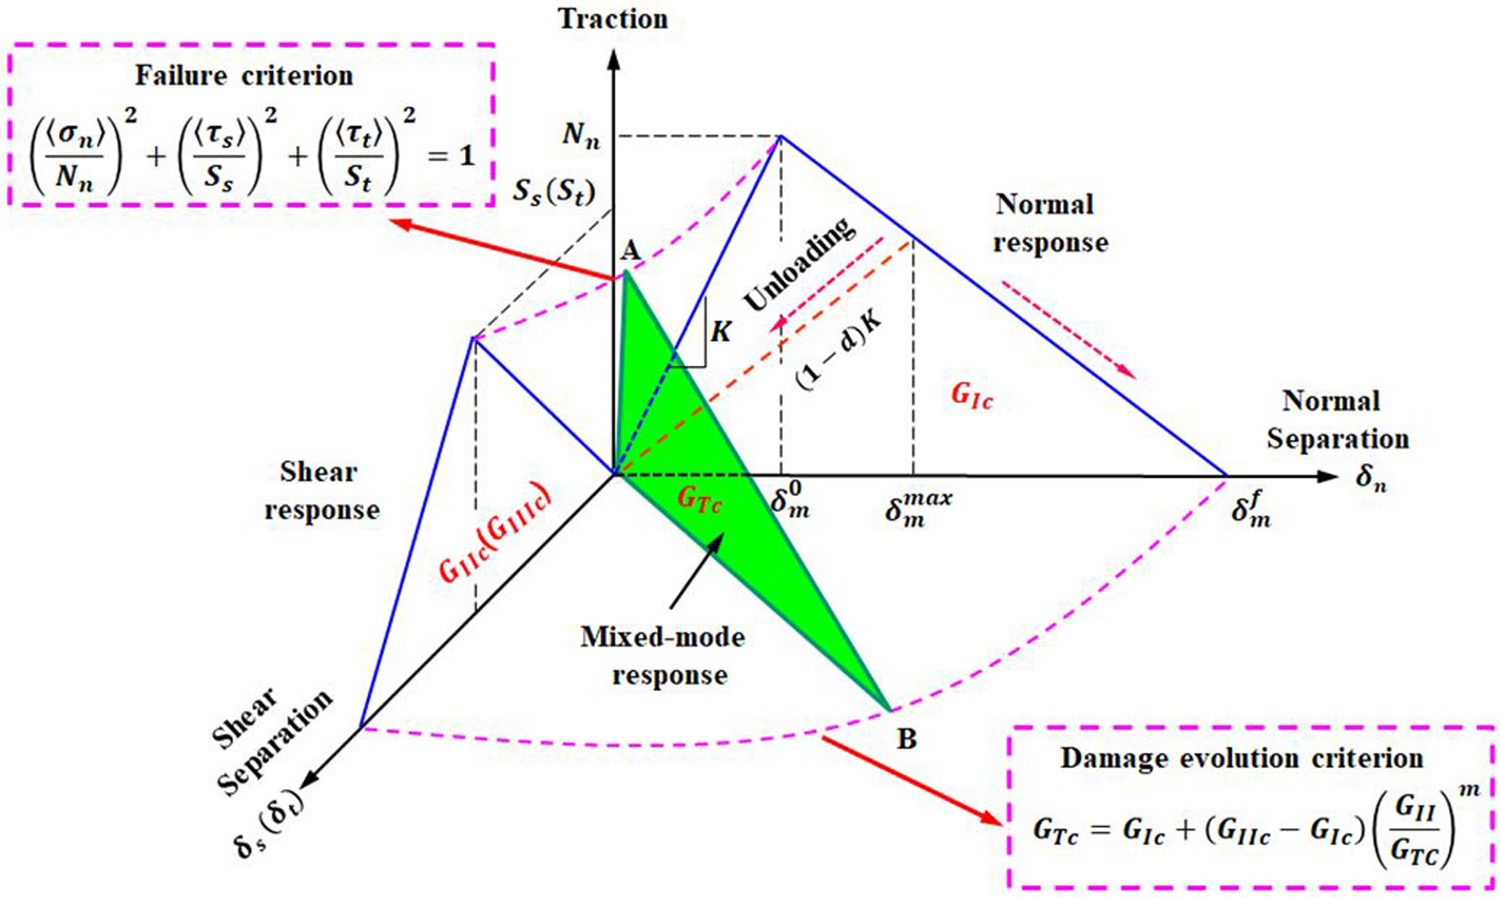
Bilinear constitutive model for mixed modes involving mode-I and shear modes.
Damage evolution in the present model is governed by the energy released throughout the whole damage process, i.e., fracture energy. This energy is represented in the area below the traction-separation curve. The relationships of such energy to the mixed mode are governed by the fracture criterion proposed by Benzeggagh and Kenane [47]
| (5) |
where GTc is the total specimen (mixed mode) strain energy release rate; GIc and GIIc are the critical fracture toughness values for pure mode I and mode II fracture, which are to be determined by experimental tests; m is the BK material parameter.
3. Determination of material parameters of CZM by experiments and computational modeling
3.1. Material
In current work, laminated samples for mode-I, mode-II and mixed-mode fracture toughness testing are molded with A42 carbon fiber and thermoset epoxy resin with a fiber volume fraction of 51.4%. Both carbon fiber and epoxy resin are supplied by Dow Chemical Company. The samples are cut from plaques, and the requisite mid-plane notch is formed by a razor-blade tapping method. Initial pre-crack formed by insertion of razor blade into mid-plane of sample, which is treated as the initial delamination. Mechanical properties of the laminated samples are listed in Table 1.
Table 1.
Mechanical properties of the laminated samples.
|
E11 (GPa) |
E22 = E33 (GPa) |
G12 = G13 (GPa) |
G23 (GPa) |
ν12 = ν13 | ν23 |
|---|---|---|---|---|---|
| 125.9 | 8.6 | 4.584 | 2.735 | 0.32 | 0.606 |
|
YT (MPa) |
YC
(MPa) |
XT
(MPa) |
XC (MPa) |
SL (MPa) |
GL (N/mm) |
GT (N/mm) |
() (MPa, MPa) |
|---|---|---|---|---|---|---|---|
| 62.75 | 185.9 | 2022 | 1098 | 81.8 | 91.6 | 0.022 | (53, 103.7) |
3.2. Inter-laminar fracture toughness measurement
3.2.1. Mode-I fracture toughness tests
3.2.1.1. Width-tapered double cantilever beam (WTDCB) tests
For mode-I fracture toughness testing, a novel WTDCB specimen geometry, as shown in Fig. 2(a), is proposed. The width taper of this specimen can be designed in such way that the change of compliance with change of crack length, dC/da, is a constant [51]. The WTDCB specimen compliance is found to be [52]:
| (6) |
Figure 2.
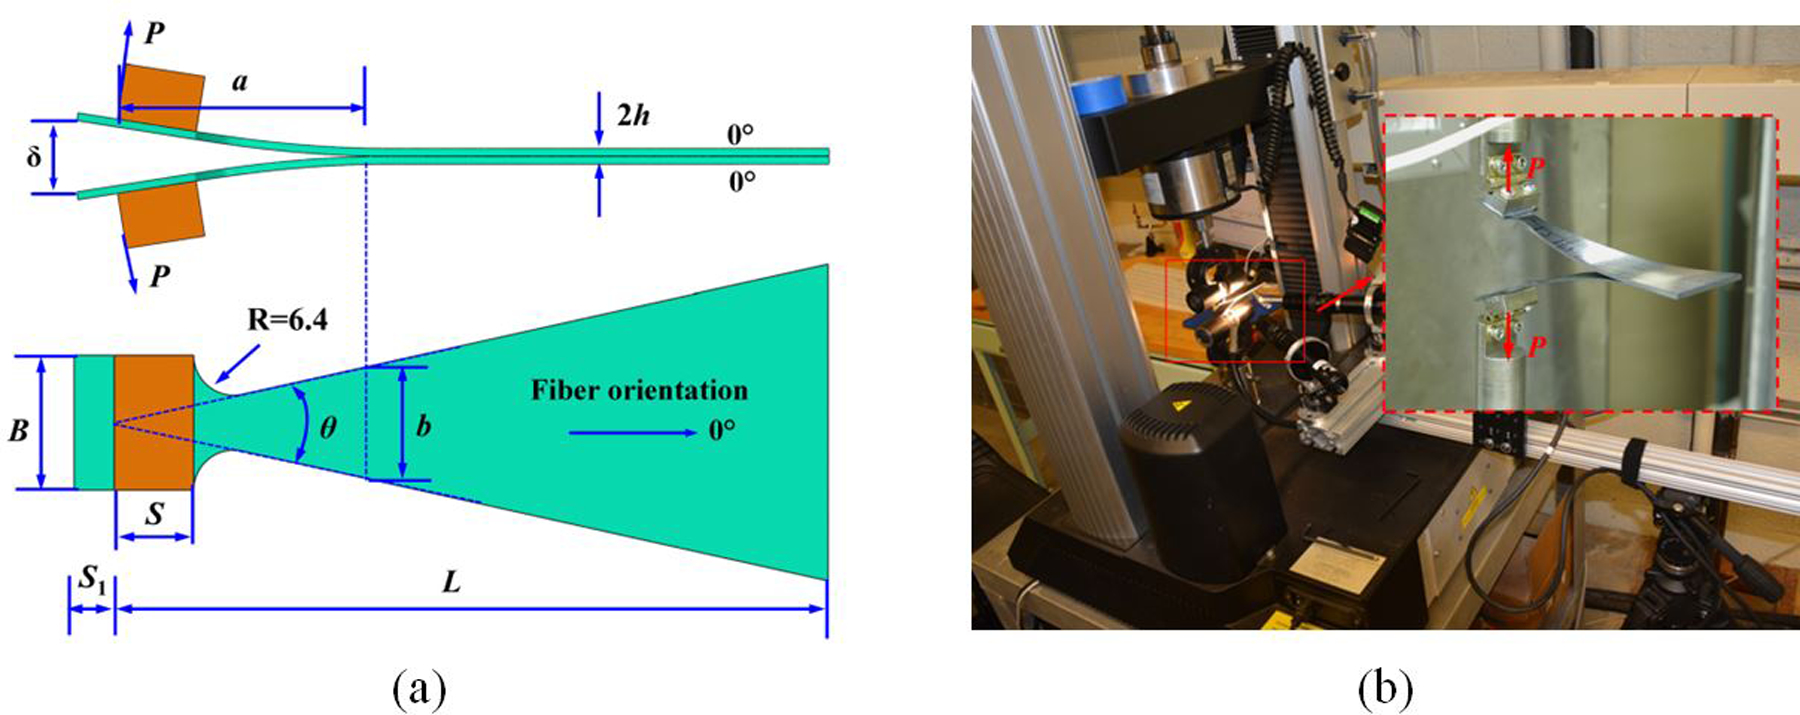
(a) WTDCB test specimen geometry and loading, and (b) experimental test setup.
Various symbols in Eqn. (6) correspond to WTDCB specimen geometry and loading as shown in Fig. 2(a). Specifically, δ is the end deflection of the specimen under applied load P; E11 is the longitudinal elastic modulus of the composite material; G13 is the shear modulus of the composite material in plane of bending; a is the crack length; S is the tab length; B is the tab width; k is the width taper ratio expressed as k = a/b = 1/2tan(θ/2), i.e., ratio of crack length (a) to specimen width (b) of the DCB specimen at the crack tip; θ is the angle of taper and 2h is the specimen thickness.
Mode I strain energy release rate (GIc) from Eqn.(6) at any given instant can be expressed as [52, 53]:
| (7) |
It is worth noting that the approximate expression for GIc in Eqn. (7) above is independent of crack length a, thus making it easier to obtain GIc value without the extra effort in requiring continuous measurement of crack length. This is further discussed in sub-section 3.2.1.3.
WTDCB specimen test setup is shown in Fig. 2(b). The tests are conducted in a servo-hydraulic tensile testing machine with continuous recording of the load-displacement response of the test specimen. Two piano hinges are mounted on the surfaces at the notched end of the specimen. The other ends of the piano hinges are clamped by a pair of loading fixtures mounted on the test machine. WTDCB specimen dimensions used in the present work have L=114 mm, B=21.6 mm, S=19.1 mm, S1=6.4 mm, initial crack length a0=20 mm, thickness 2h=2.3 mm, and width taper ratio k = 2.26.
The specimen is tested at a constant displacement rate of 0.5 mm/min. Load-displacement curves exhibit a constant load ‘plateau’ during crack extension, indicating that the crack growth occurs in a stable manner under displacement rate controlled loading, as shown in Fig. 3(a). Instantaneous GI versus displacement traces can be readily obtained from the load-displacement curves using Eqn. (7), as shown in Fig. 3(b). Because of the small-scale variation in the GI-displacement curves, it is more reliable to take a mean value from such curves (see the dashed line in Fig. 3(b)).
Figure 3.
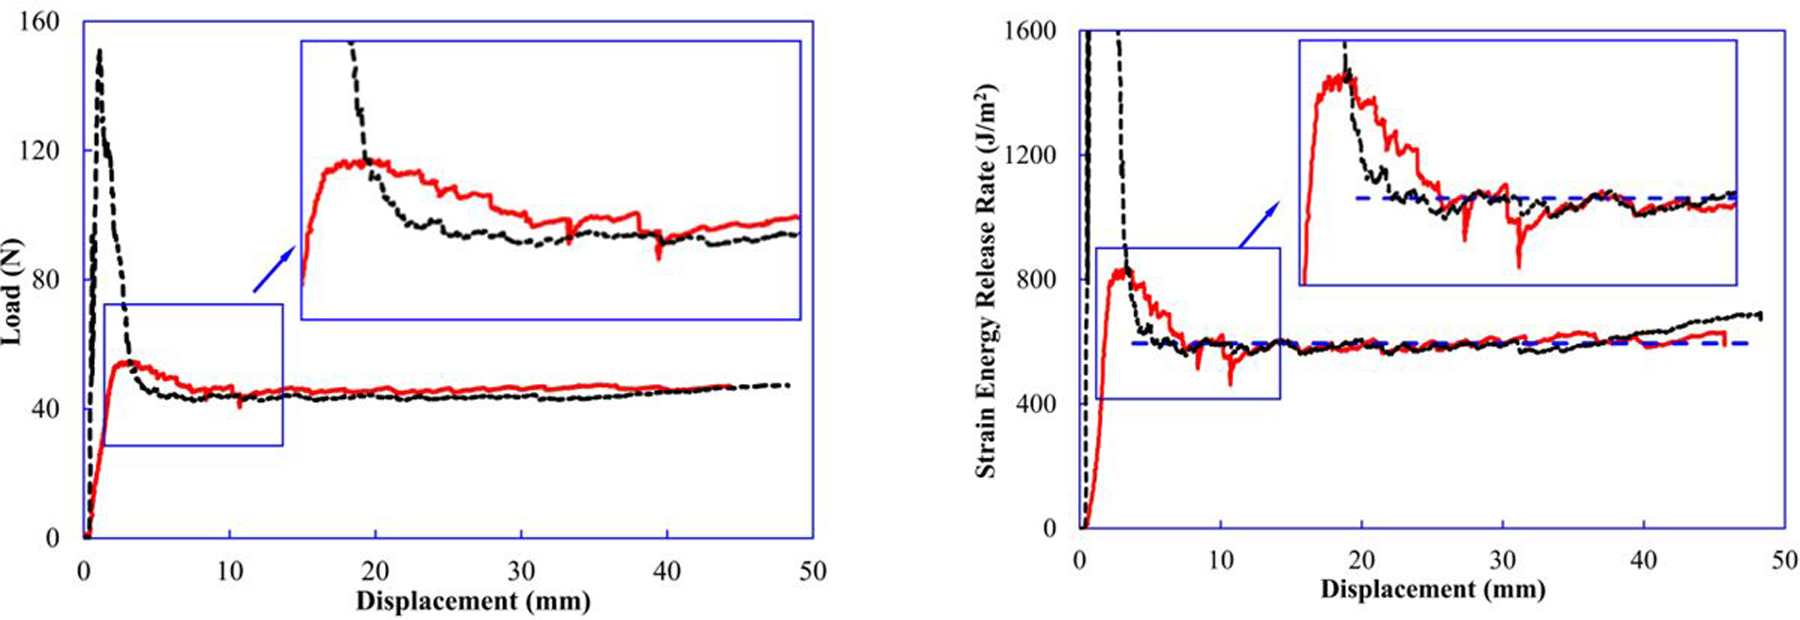
(a) Load–displacement curves and (b) corresponding values of instantaneous GI calibrated by Eqn. (7) with WTDCB load data.
However, some tests exhibit higher initial peak load (unstable crack growth) because of razor blade pre-crack length being insufficient and not extended past the fillet region of the coupon, as shown by the black trace in Fig. 3(a). Therefore, we neglect the initial unstable portion of the test to obtain reasonable and consistent values of GIc. From four WTDCB tests, the average GIc of WTDCB tests is 534 J/m2 and coefficient of variation (CoV) is 12.3%.
3.2.1.2. Fixed-width double cantilever beam (FWDCB) tests
In order to confidently claim that the WTDCB tests can be taken as an accurate method for characterizing mode-I fracture toughness GIc, a typical FWDCB test specimen made from the same CFRP composites are tested. The crack length is monitored using ARAMIS DIC technique. Note that FWDCB specimen geometry is often employed in mode I fracture toughness testing of composites due to its general simplicity of fabrication [54, 55]. In the case of the FWDCB specimen shown in Fig. 4(a), the specimen compliance C is expressed as [56]:
| (8) |
Figure 4.
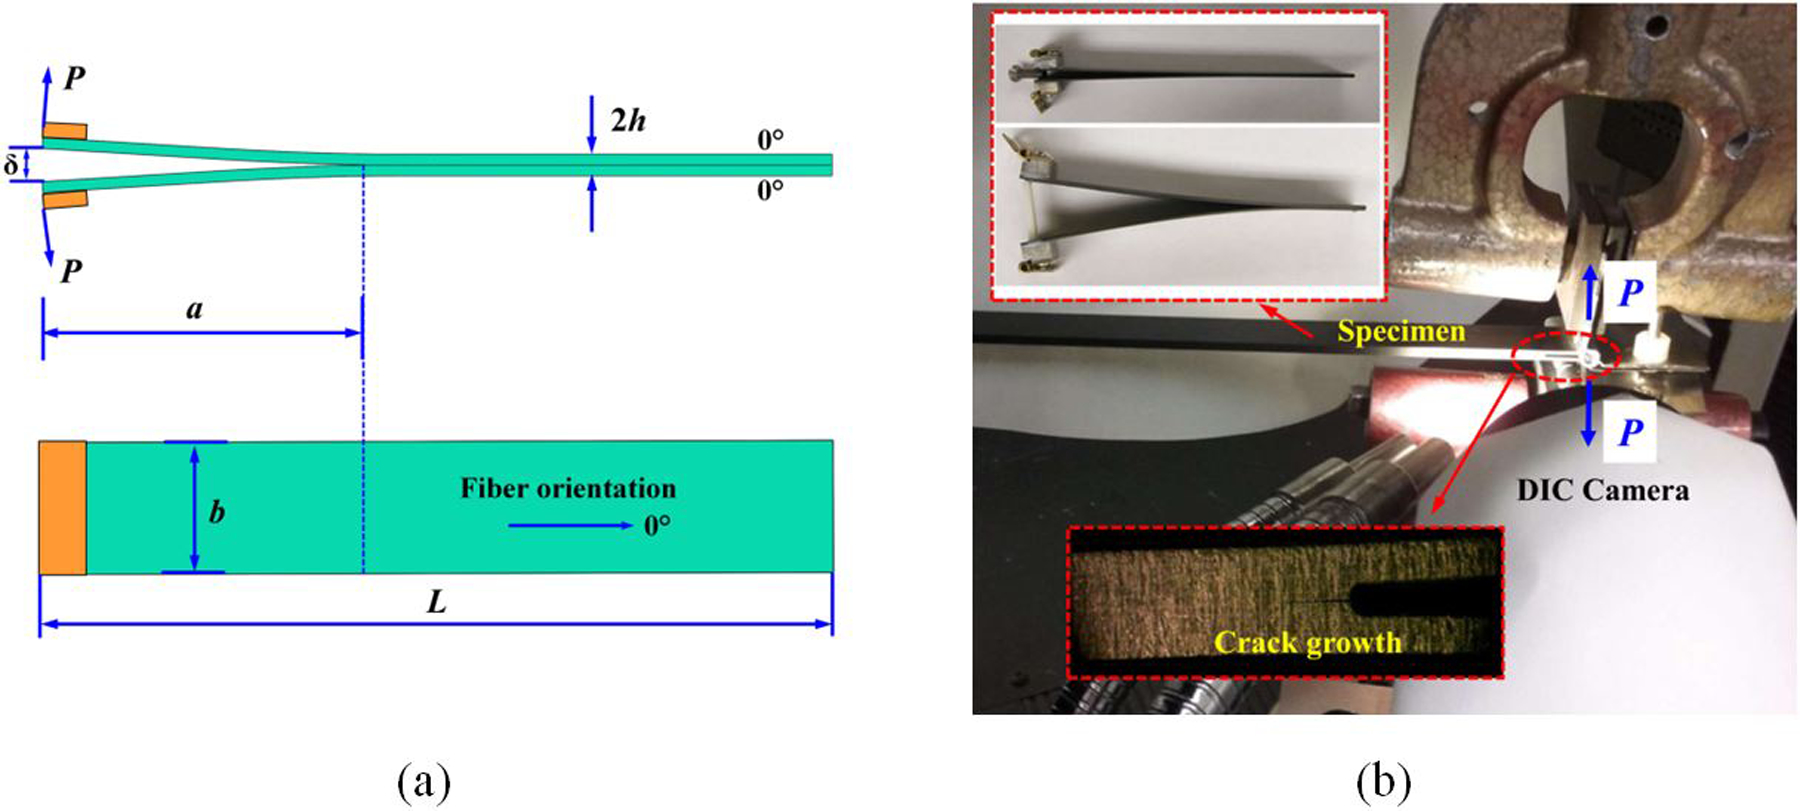
(a) FWDCB specimen geometry and loading, and (b) experimental test setup.
GIc can be expressed in terms of the specimen compliance C as:
| (9) |
where δ, P, E11, G13, a, b and h have the same nomenclature as noted earlier for the WTDCB test specimen geometry (see Fig. 4(a)).
The FWDCB specimens are prepared in accordance with ASTM D5528–94A standard [17]. The edge of the specimens is painted with a random black speckle pattern on a white background in order to monitor the crack tip displacement field by means of a DIC system. Two cameras from a DIC stereo system are used to monitor the strain field in the crack tip region as shown in Fig. 4(b). FWDCB specimen dimensions used are L=120 mm, with initial crack length a0=20 mm, b=25 mm, and 2h=2.3 mm. The specimen is loaded with a constant displacement rate of 0.5 mm/min. The corresponding applied load and displacement are measured according to the above ASTM standard.
A representative load-displacement curve obtained from the test machine is presented in Fig. 5. The load-displacement curve shows a linear loading path until pre-crack initiation occurs followed by a nonlinear softening as the crack extends. We can observe that the load-displacement is not ideally smooth after the peak load. The fluctuation in the load-displacement curve is accompanied by unstable crack growth, which introduces uncertainty in the measurement of crack length.
Figure 5.
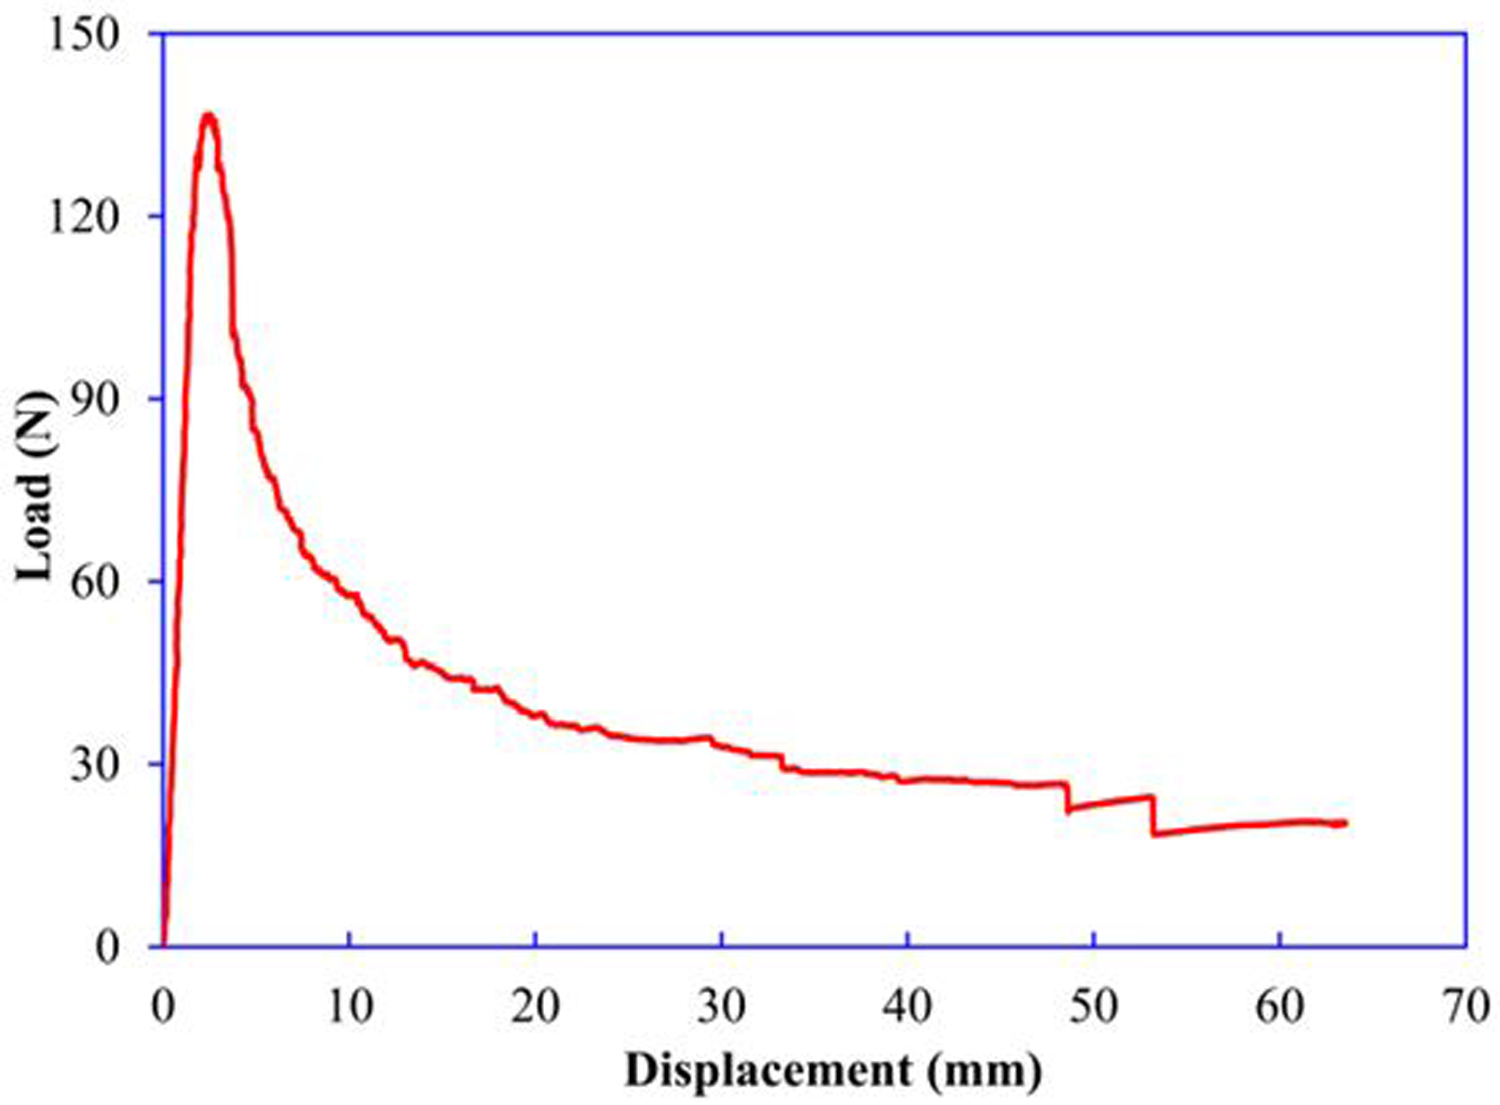
Representative load–displacement curve from FWDCB fracture toughness test specimen.
The crack tip location for FWDCB specimen is monitored using DIC technique and detailed crack growth information is presented in Fig. 6(a)–(d). In addition, instantaneous crack length is utilized to plot GI versus crack length (or R-curve), as shown in Fig. 6(e). Results of the critical strain energy release rate GIc are obtained by taking an average value (i.e., dashed line in Fig. 6(e)) from the R-curve). The instantaneous GI as a function of displacement of the material, per Eqn. (9), is shown in Fig. 6(f). From four FWDCB tests, the average experimental result of GIc for FWDCB tests is 522 J/m2 with CoV=19.7%.
Figure 6.
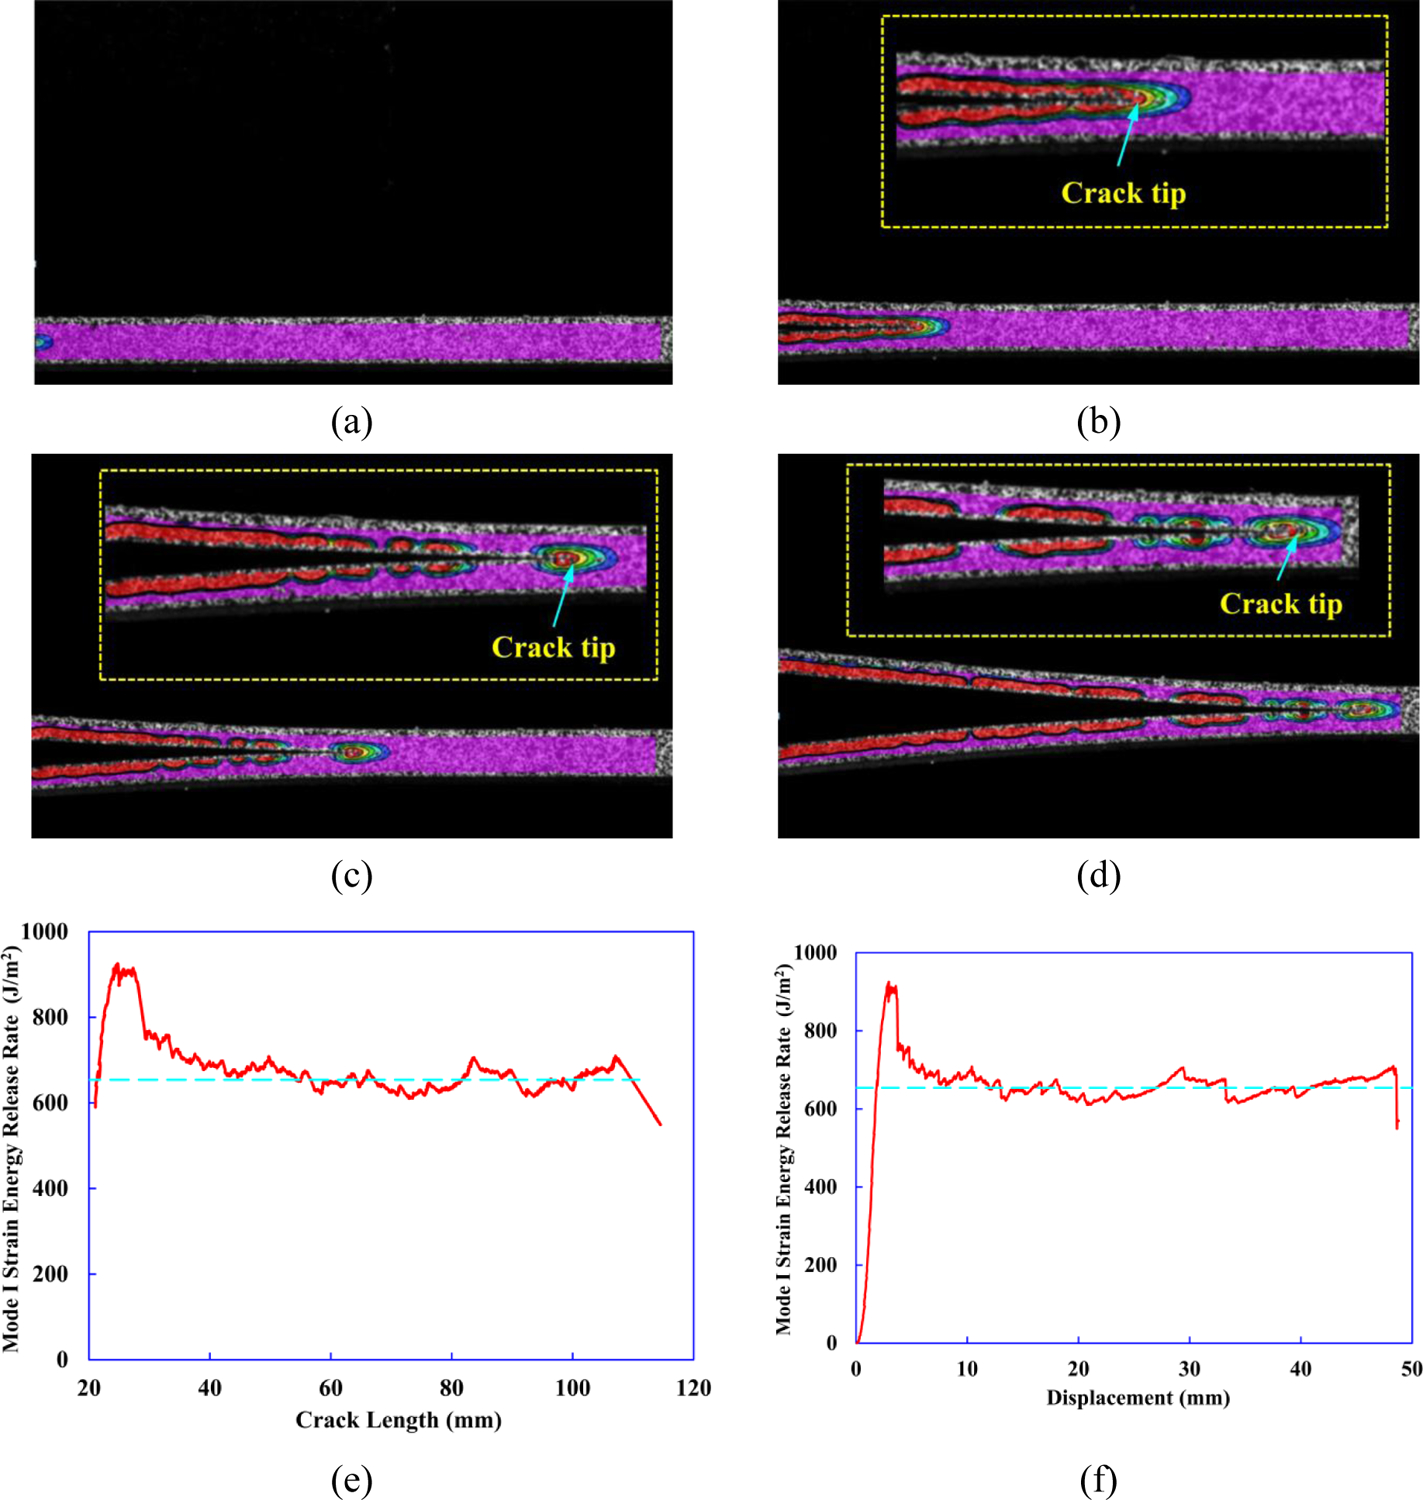
DIC images of strain contours (a)-(d) within FWDCB test specimen to calculate the crack lengths, and the cases are: (a) a=20 mm, (b) a=40 mm, (c) a=60 mm, and (d) a=110 mm. Mode I strain energy release rate GI versus (e) crack length and (f) for FWDCB.
3.2.1.3. Assessment of WTDCB tests
As discussed in Section 3.2.1.1 and 3.2.1.2, the average experimental values of GIC are similar from the two tests (534 J/m2 for WTDCB versus 522 J/m2 for FWDCB) with a much larger CoV in FWDCB tests compared to WTDCB tests (12.3% for WTDCB versus 19.7 % for FWDCB). Compared to traditional FWDCB specimen, WTDCB specimen is generally insensitive to the crack length. As a result, the calculation of GIc can be simplified by continuously recording the applied load and end displacement only. This avoids the tedious measurement of crack length at the crack tip. In general, measurement of the crack length in the traditional FWDCB tests is not always accurate. Numerous factors impede accurate measurement of the crack length, such as the difficulty in observing the crack and confirming the crack tip location, which leads to large scatters in experimental data as noted earlier. Thus, WTDCB specimen proposed in this study offers an easier and more accurate means to determine the mode I inter-laminar fracture toughness of CFRP composites.
3.2.2. Mode-II fracture toughness tests
For the mode-II tests, the commonly employed ENF specimen is utilized as there are no better candidates in terms of easy setup and accuracy. The ENF specimen geometry and test setup is shown in Fig. 7(a). The specimens are prepared in accordance with ASTM D7905/D7905M [18]. The length (2L) is 50.8 mm, width (b) is 20 mm and the thickness (2h) is 2.3 mm. An initial crack length of a =0.5L=12.7 mm is chosen to avoid the effects of stress concentrations at the rollers and to minimize the measurement errors.
Figure 7.
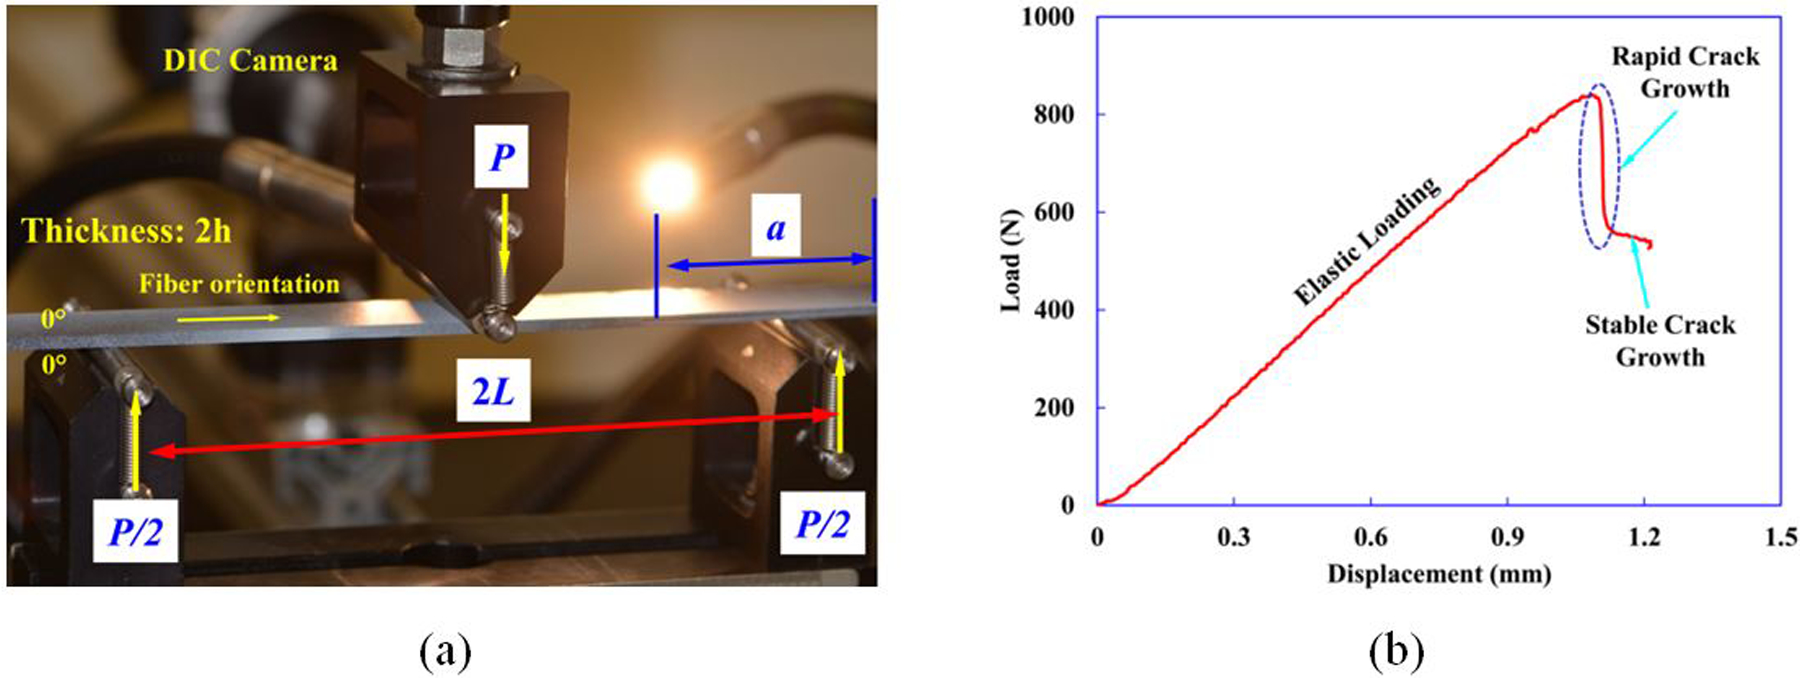
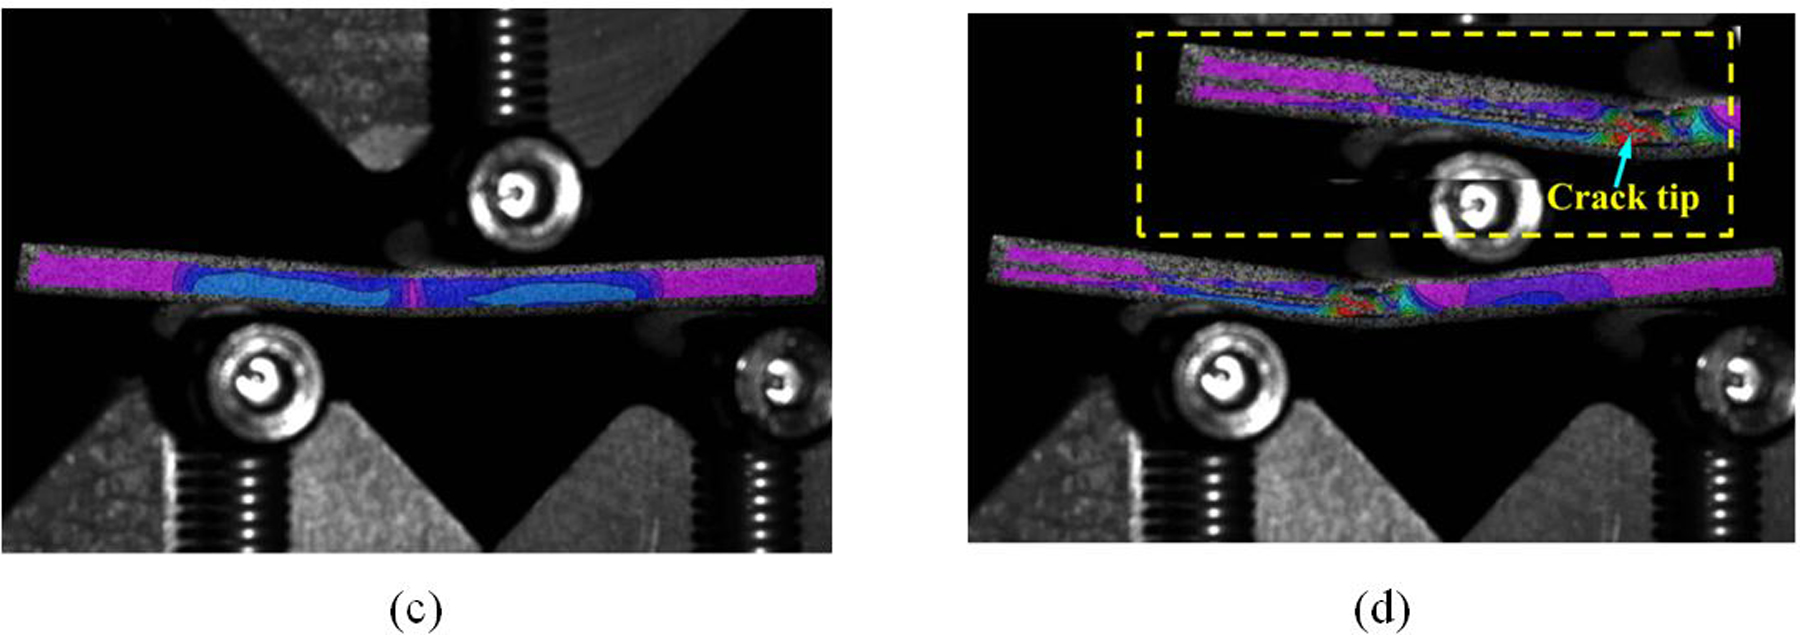
(a) Geometry and test setup of ENF test specimen. (b) A representative load-displacement curve from Mode-II ENF test on a CFRP specimen. (c)-(d) DIC images of strain contours within ENF test specimen.
The specimen compliance is expressed as [56]:
| (10) |
The compliance method is again invoked to obtain an expression for GIIc:
| (11) |
Tests are conducted in a servo-hydraulic load frame under conditions of displacement rate control with a constant speed of 0.025 mm/min. Unlike the Mode-I DCB tests, the Mode-II ENF tests generally lack a character of stable crack growth. The load-displacement curve is one shows a steep drop in load at first release, followed by a monotonically declining load as the crack is extended further, as shown in Fig.7(b). Tests generally exhibit only peak-load behavior before sudden release. Hence, only the peak load at the instant of crack propagation is used to calculate the GIIc. In addition, the ENF tests are coupled with DIC allowing measurement of the crack tip shear displacement during test, as shown in Fig. 7(c)–(d). For ENF tests, a total of six sets of tests are performed, and the average experimental result of GIIc is 913 J/m2 with CoV=17.6%.
3.2.3. Mixed-mode fracture toughness tests
3.2.3.1. Fixed-ratio mixed-mode end load split (FRMMELS) tests
Popular mixed-mode tests are crack lap shear [23, 24], asymmetric double cantilever beam [25], single leg bend [26, 27], and four-point bending tests [28], but the most universally accepted is the mixed-mode bend test [57, 58]. Due to disadvantages associated with these existing tests, none of them is considered to be an optimal mixed-mode test solution for the evaluation of flexural behavior of CFRP composites. In this study, a new FRMMELS specimen geometry is employed to measure the mixed-mode fracture toughness. This geometry is a modified version of the end load split (ELS) test [59] where the inter-laminar crack in a beam type specimen is forced to propagate under variation of mixed mode depending on the crack length. The geometry of FRMMELS specimen used here is the same as WTDCB tests in terms of tapered width, as shown in Fig. 8(a). FRMMELS specimen dimensions used here are L = 114 mm, B = 21.6 mm, S = 19.1 mm, 2h = 2.3 mm, initial crack length a0 = 20 mm, and width taper ratio k = 2.26. The FRMMELS tests are conducted under the displacement rate controlled condition with a constant speed of 0.25 mm/min. A representative load-displacement curve obtained from the test is shown in Fig. 8(b).
Figure 8.
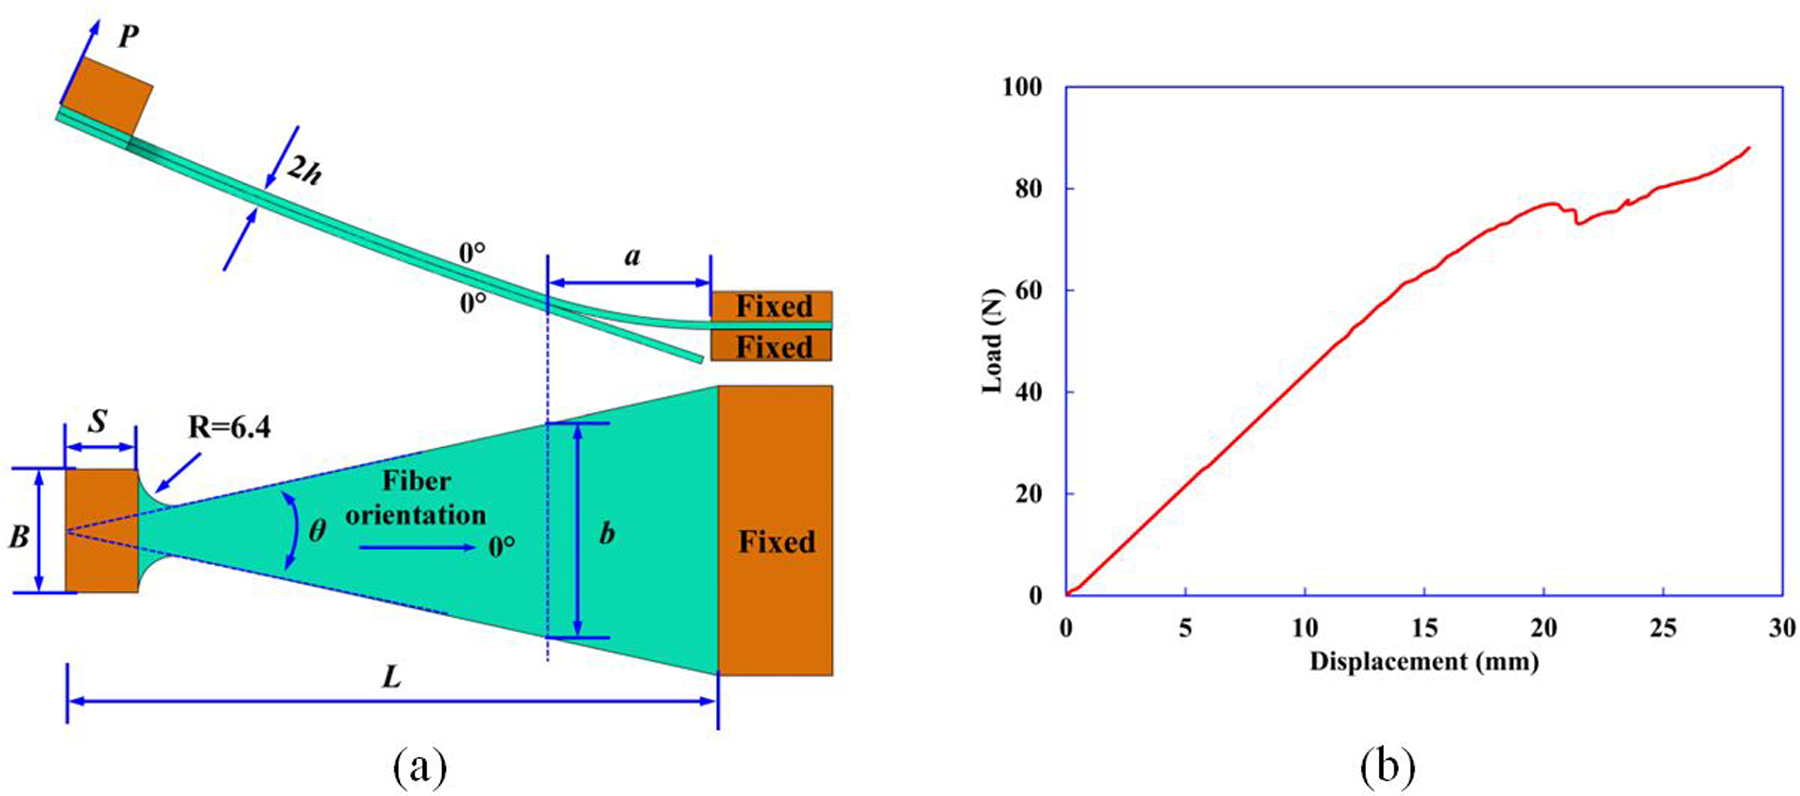
(a) Specimen geometry and dimensions of the FRMMELS test. (b) Representative FRMMELS load-displacement curves.
The compliance of the FRMMELS specimen is expressed as:
| (12) |
where the usual nomenclature δ, P, L, a, B, s and 2h stand for end deflection, applied load, span between the fixed and simple loading points, crack length, loading tab width, loading tab length, and total specimen thickness, respectively, and k is the Timoshenko shear coefficient (κ=5/6 for rectangular cross section). The elastic parameters are shear modulus G13 and longitudinal elastic modulus E11.
Applying the compliance method, one obtains the total strain energy release rate as:
| (13) |
The peak load is used to calculate GTc, and the average GTc of four FRMMELS tests is 788 J/m2 with CoV=3.0%. The FRMMELS specimen not only resembles pure mode-I WTDCB specimen, but also, with a few modifications, a mixture of mode-I and mode-II load cases. The method of imposing multiple modes is most readily understood by decomposing the end loading conditions into two more obvious cases of pure mode-I and pure mode-II behavior, as shown in Fig. 9. Based on the Timoshenko beam theory, GIc can be calculated as:
| (14) |
Figure 9.
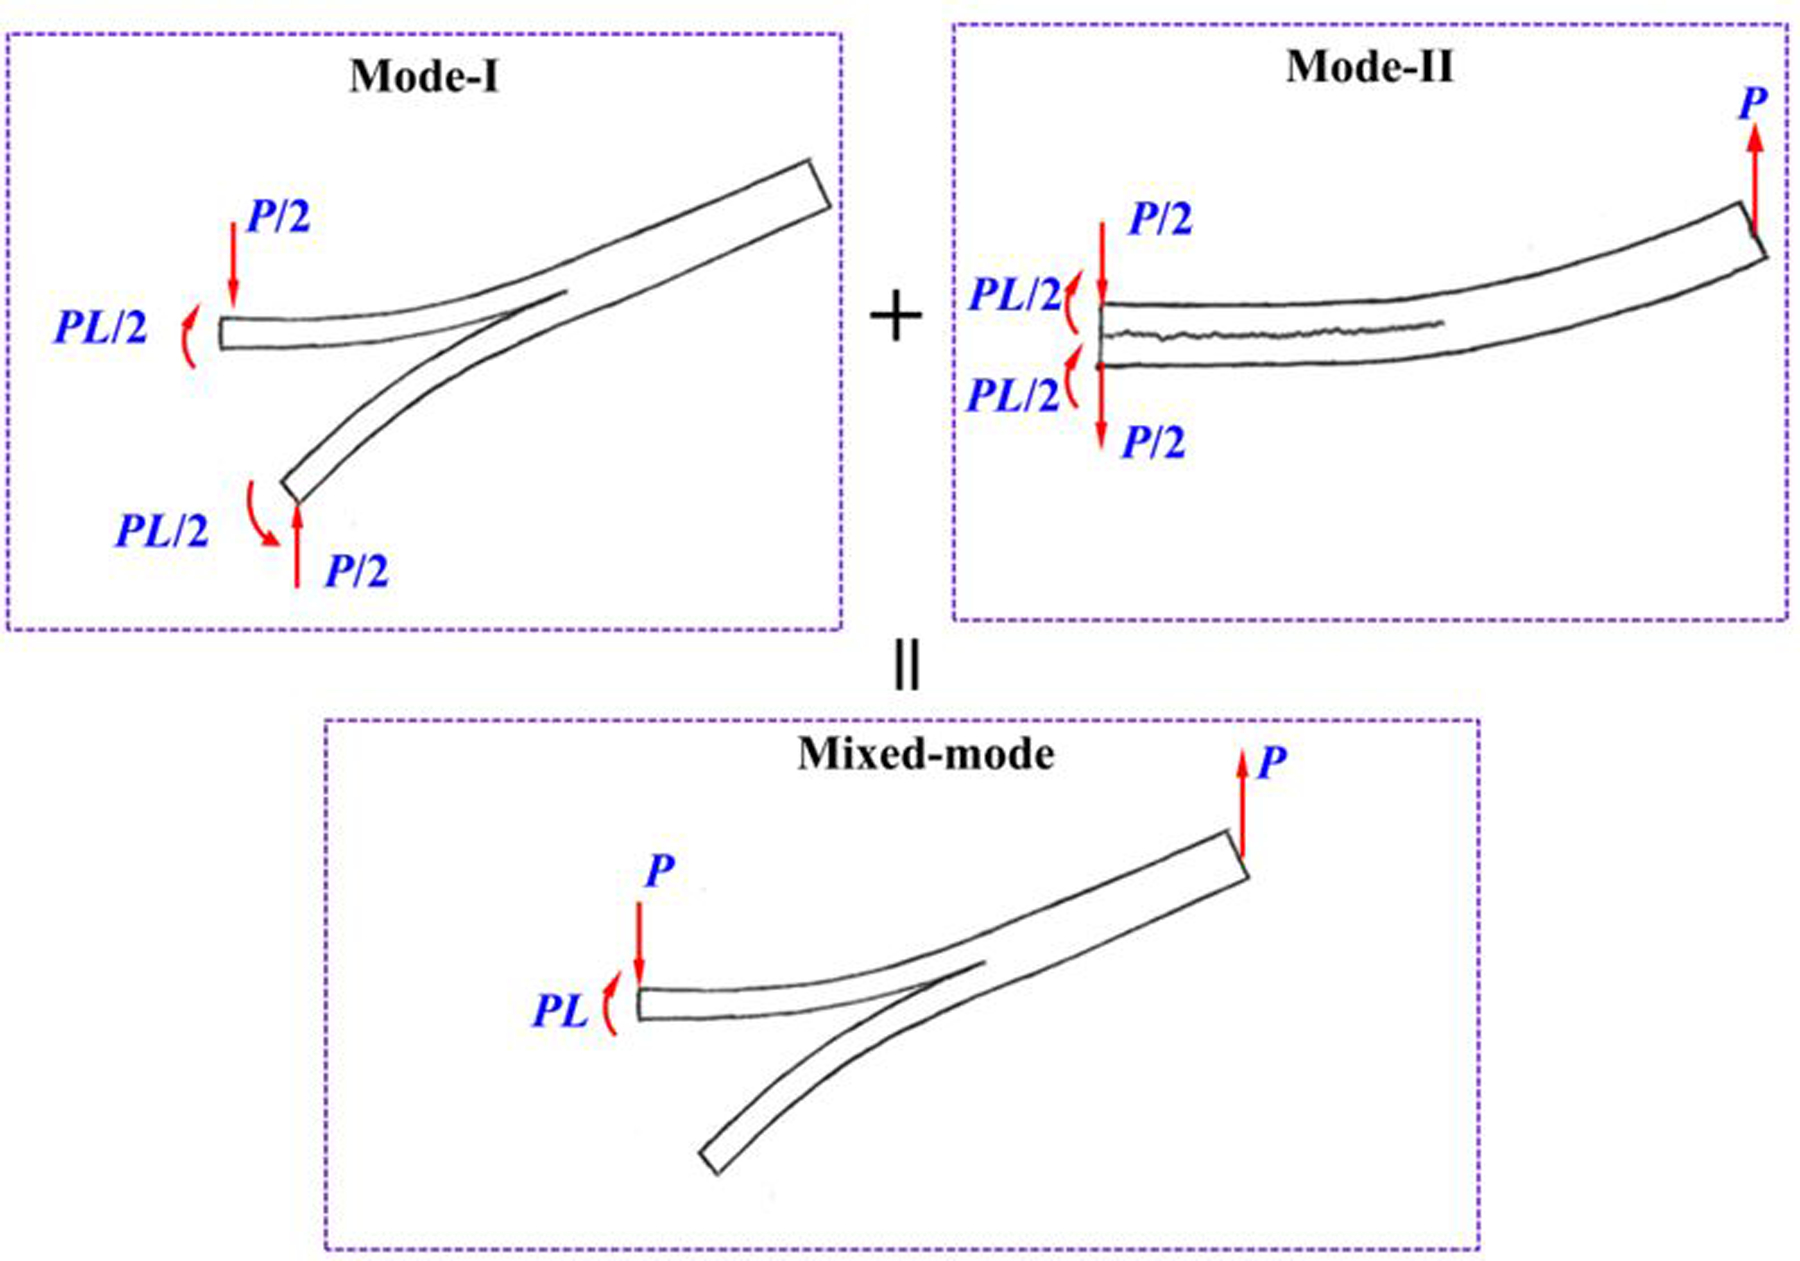
Illustration of linear superposition of pure Mode-I and pure Mode-II specimen end loadings which give rise to the loading state found in a mixed-mode specimen.
Eqns. (13) and (14) thus yield,
| (15) |
From this analysis, the ratio of GIIc/GTc is
| (16) |
B-K fracture criterion [47] can be expressed as:
| (17) |
Hence, the mode mixity parameter m is obtained as:
| (18) |
On substituting the mean value of GIc from WTDCB tests (534 J/m2), mean value of GIIc from ENF tests (913 J/m2), and mean value of GTc from FRMMELS tests (788 J/m2) into Eqn. (18), the B-K interaction parameters m is obtained as 0.475.
It is to be noted that the present method uses only fracture toughness values obtained from DCB, ENF, and FRMMELS tests with a constant mixed-mode ratio (of ) to completely define the B-K delamination failure criterion as:
| (19) |
3.2.3.2. Typical mixed-mode bending tests
To create the mixed mode I/II delamination in laminated composites, the typical mixed-mode bending (MMB) apparatus, as shown in Fig. 10(a), is designed in accordance with ASTM D6671/D6671M standard [19] for verifying the accuracy and testing confidence of FRMMELS tests. Specimen dimensions used here are 2L = 50.8 mm, initial crack length a0 = 20 mm, width W=25 mm and thickness 2h=2.3 mm. In order to fully characterize the mixed-mode fracture toughness of the CFRP composites, four mixed-mode ratios of GIIc/GTc are used, namely 0.25, 0.5, 0.75 and 0.8. The moment arm length c to produce the desired mode-mixity GIIc/GTc is obtained in terms of the following expression [19]:
| (20) |
where α is the mode mixture transformation parameter for setting the moment arm length, β is the non-dimensional crack length correction parameter for mode-mixture and L is the half-span length of the typical MMB test apparatus (see Fig. 10(a)). The parameters α and β are derived as:
| (21) |
where χ is a correction factor defined in ASTM standard D6671/D6671M [19]. The corresponding c for mode-mixity 0.25, 0.5, 0.75, and 0.8 are 42.3 mm, 22.2 mm, 15.2 mm, and 14.2 mm, respectively.
Figure 10.
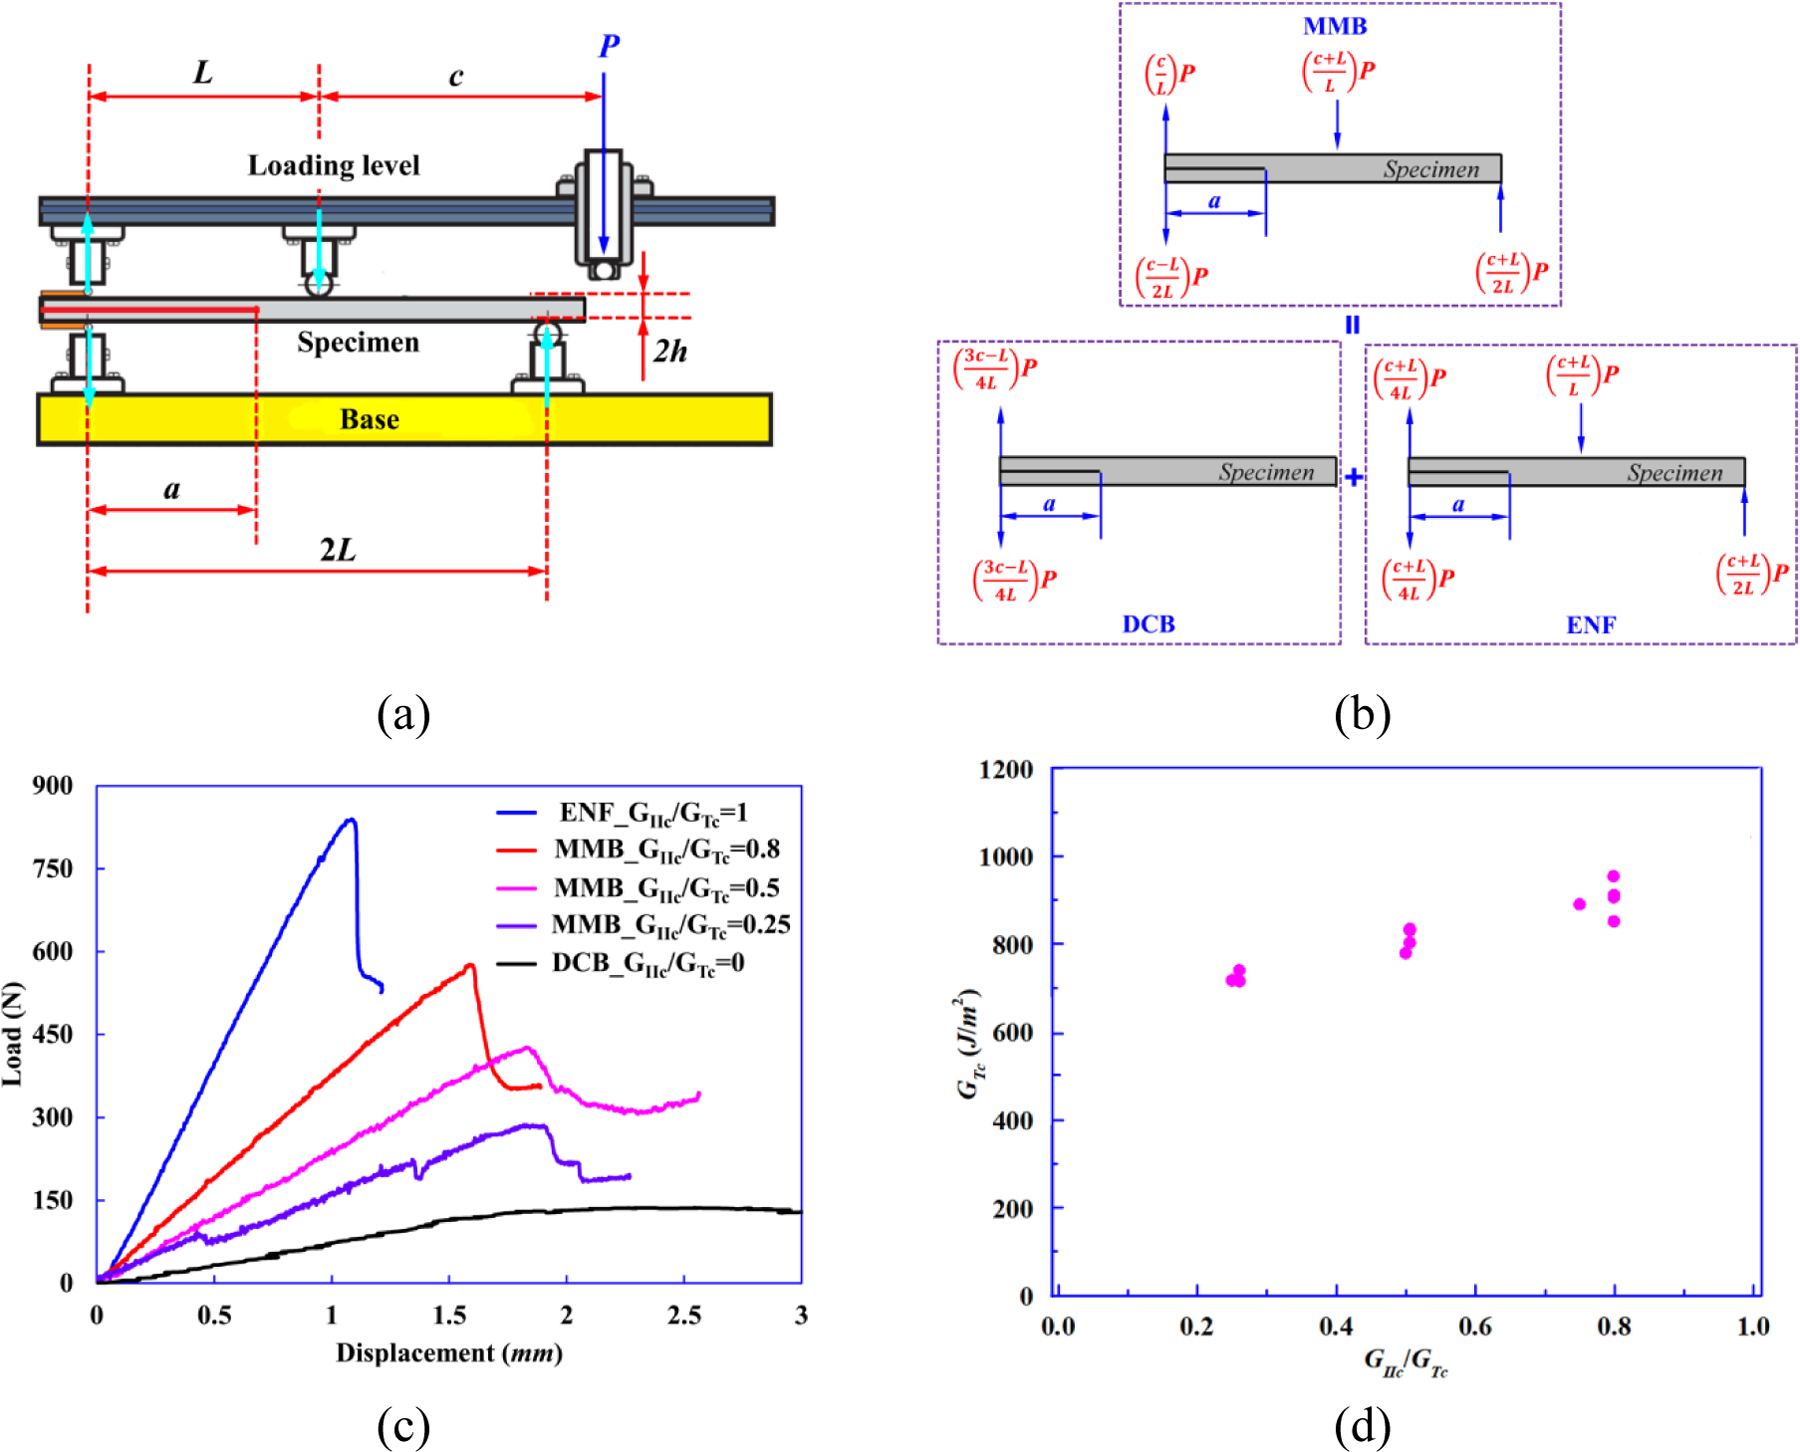
(a)-(b) Test setup and specimen loading conditions of typical MMB test. (c) A comparison of load-displacement curves for samples tested at different mode mixities. (d) Results of total fracture toughness versus mode mixity.
The tests are conducted under a displacement rate of 0.25 mm/min using a 20 kN load-cell to record the load. The crack opening displacement is determined by measuring the relative displacement between the upper and the lower substrates at the initial crack tip using the DIC technique. The typical MMB apparatus is a combination of a FWDCB (mode-I) specimen and an ENF (mode-II) specimen, which introduces mode-I loading at the end of lever and mode-II loading at the fulcrum, as shown in Fig. 10(b).
The mode-I and mode-II portions of loads in a typical MMB test are determined from Eq. (22).
| (22) |
where P is the applied load. The GIc and GIIc are calculated based on the modified beam theory as follows [60]:
| (23) |
| (24) |
| (25) |
where E11 is the longitudinal elastic modulus of the composite material which controls the bending response, and symbols a, W and 2h have their usual meaning.
The load value at the first deviation from the linear part in the load-displacement curve (see Fig. 10(c)) is chosen to measure the critical strain energy release rate at the delamination initiation. The experimental results for four mixed-mode ratios are listed Table 2 and shown in Fig. 10(d).
Table 2.
The experimental values of GIc, GIIc, GTc obtained from typical MMB Tests.
| c (mm) | m = GIIc/GTc | GTc (J/m2) | GIc (J/m2) | GIIc (J/m2) | |
|---|---|---|---|---|---|
| MMB-1 | 42.3 | 0.25 | 717.2 | 537.90 | 179.30 |
| MMB-2 | 40.5 | 0.26 | 739.6 | 547.30 | 192.30 |
| MMB-3 | 40.5 | 0.26 | 715.2 | 529.25 | 185.95 |
| MMB-4 | 22.2 | 0.50 | 779.3 | 389.65 | 389.65 |
| MMB-5 | 22.0 | 0.51 | 802.8 | 396.58 | 406.22 |
| MMB-6 | 22.0 | 0.51 | 830.9 | 410.46 | 420.44 |
| MMB-7 | 22.0 | 0.51 | 834.2 | 412.09 | 422.11 |
| MMB-8 | 15.2 | 0.75 | 890.1 | 222.53 | 667.58 |
| MMB-9 | 14.2 | 0.80 | 851.7 | 171.19 | 680.51 |
| MMB-10 | 14.2 | 0.80 | 911.5 | 183.21 | 728.29 |
| MMB-11 | 14.2 | 0.80 | 954.2 | 191.79 | 762.41 |
| MMB-12 | 14.2 | 0.80 | 906.3 | 182.17 | 724.13 |
3.2.3.3. Assessment of FRMMELS tests
There are other sample geometries which may accomplish a similar effect of imposing multiple modes [59, 61–63]. FRMMELS specimen geometry is selected because of multiple advantages. In essence, the sample mimics the geometry of pure Mode-I WTDCB as a means of obviating the need to directly measure the crack length. Moreover, FRMMELS sample contains an inherent constant ratio of fracture energies of different modes, which depends on the width taper ratio k. This is very useful when conducting a test to keep control of the interaction of modes.
Fig. 11 shows a comparison between experimental data obtained from FRMMELS tests and mixed-mode failure envelope of B-K criterion obtained from a least-square-fitting to all the experimental results of mode-I WTDCB, FWDCB tests, mode-II ENF tests as well as the traditional MMB tests. The detailed experimental values and statistical analysis of the obtained results for mode-I WTDCB, FWDCB tests, mode-II ENF tests, mixed-mode FRMMELS tests as well as typical MMB tests are listed in Table 2–3. Good agreement between the predictions and experimental data is generally observed. The m value of 0.484 obtained from the curve fit procedure is very close to 0.475 obtained from FRMMELS tests.
Figure 11.
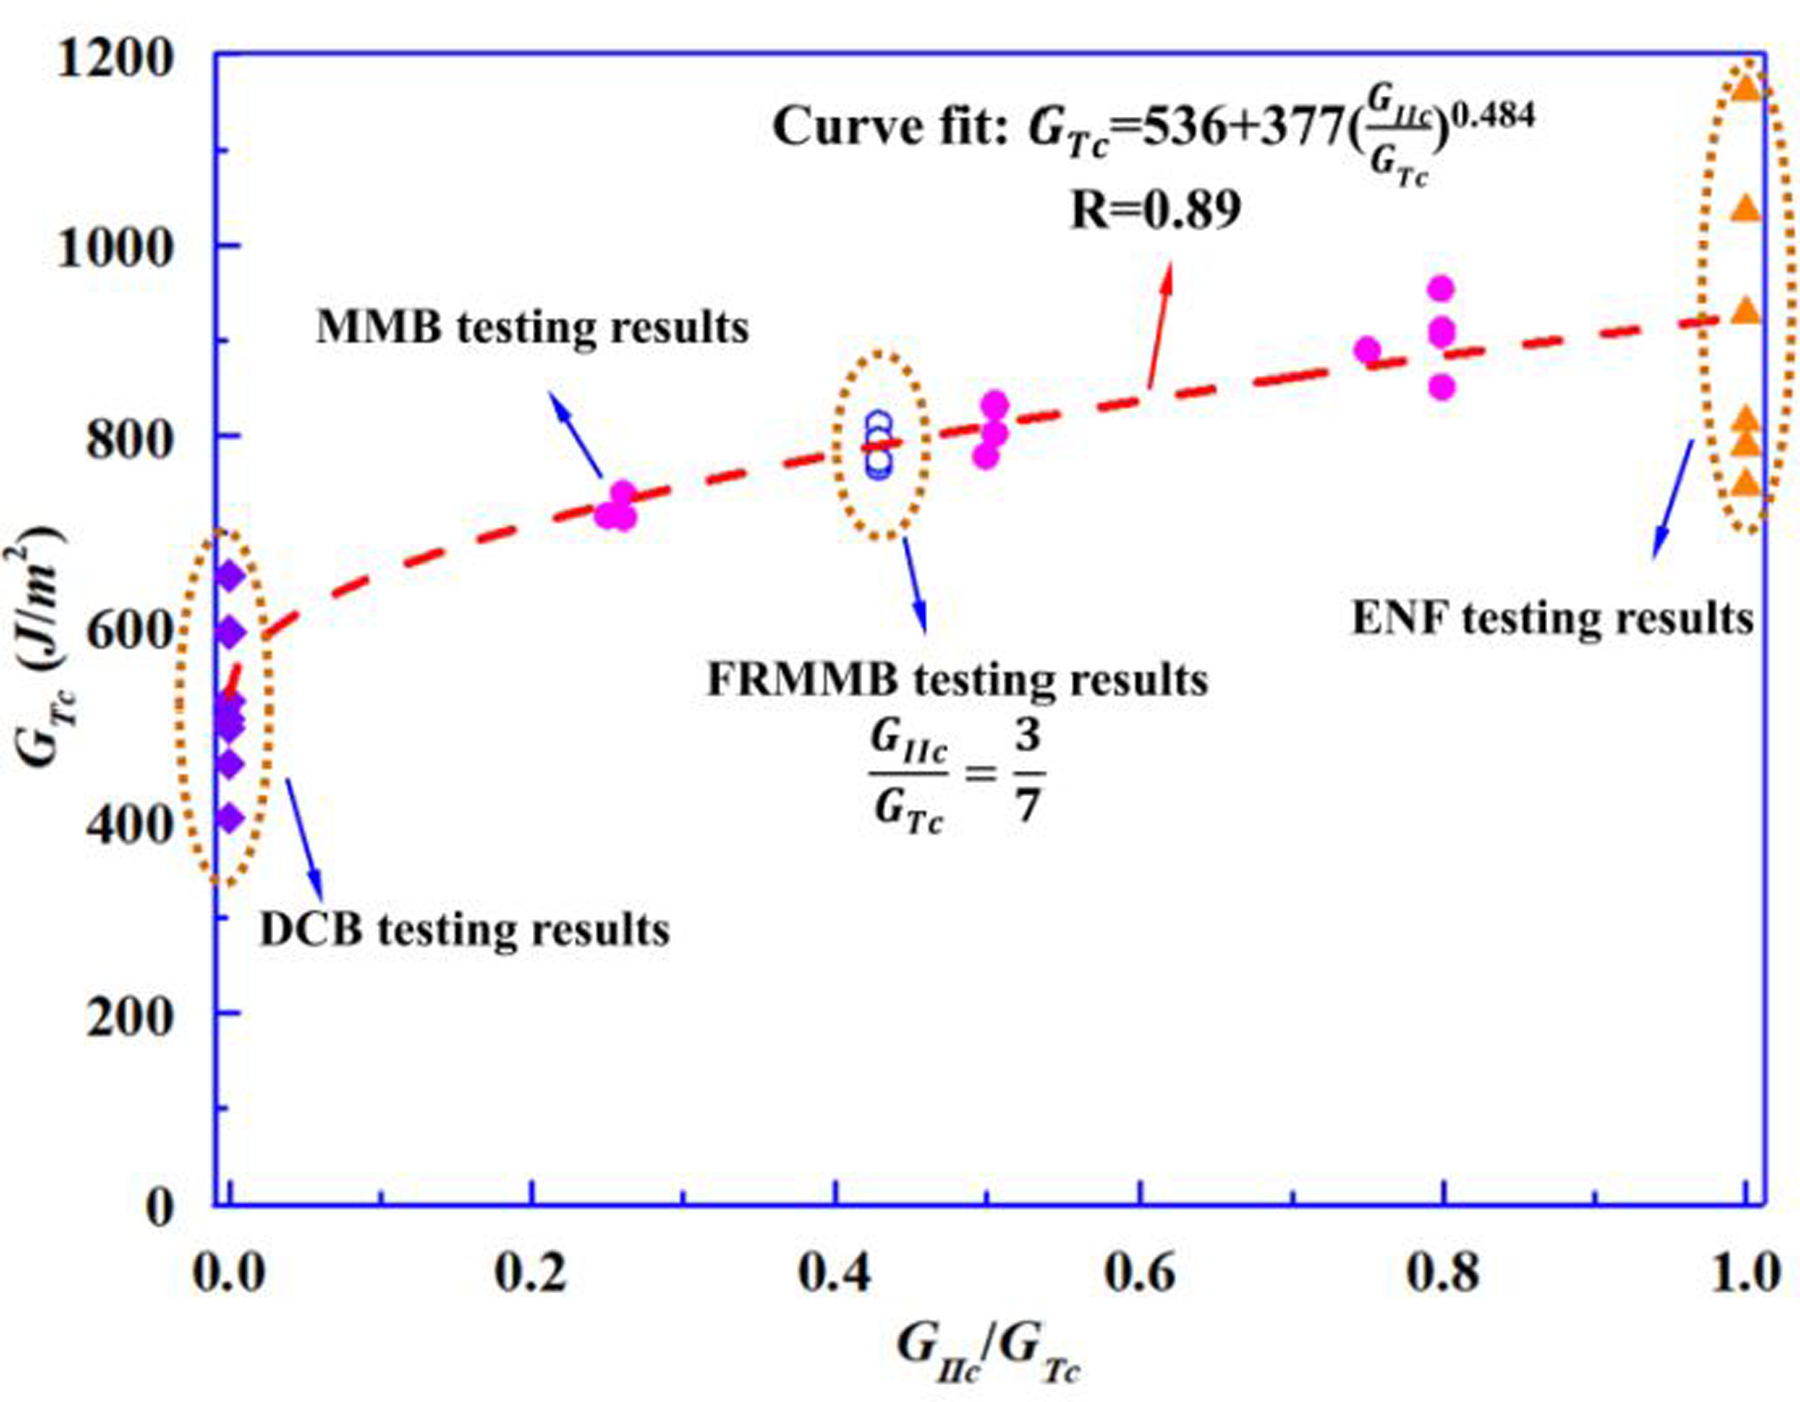
A comparison between curve-fitted mixed-mode failure envelope of B-K criterion and experimental data obtained from FRMMELS tests.
Table 3.
The summary of experimental values of mode-I WTDCB, FWDCB tests, mode-II ENF tests as well as mixed-mode FRMMELS tests.
| Mode-I WTDCB, FWDCB tests | Mode-II ENF tests | Mixed-mode tests | |||||
|---|---|---|---|---|---|---|---|
| WTDCB Tests |
GIc (J/m2) |
FWDCB Tests |
GIc (J/m2) |
ENF Tests |
GIIc (J/m2) |
FRMMELS tests |
GTc (J/m2) |
| WTDCB-1 | 594.5 | FWDCB-1 | 654 | ENF-1 | 929 | FRMMELS-1 | 758 |
| WTDCB-2 | 583.6 | FWDCB-2 | 404 | ENF-2 | 815 | FRMMELS-2 | 803 |
| WTDCB-3 | 460.6 | FWDCB-3 | 507 | ENF-3 | 790 | FRMMELS-3 | 796 |
| WTDCB-4 | 496.7 | FWDCB-4 | 523 | ENF-4 | 1162 | FRMMELS-4 | 795 |
| ENF-5 | 1036 | ||||||
| ENF-6 | 749 | ||||||
| AVE | 534 | AVE | 522 | AVE | 913 | AVE | 788 |
| CoV (%) | 12.3 | CoV (%) | 19.7 | CoV (%) | 17.6 | CoV (%) | 3.0 |
In summary, the new mixed-mode test, FRMMELS, developed in the present work appears to be a simple yet effective method to determine mixed-mode inter-laminar fracture toughness and the B-K criterion.
3.3. Computational modeling and determining the inter-laminar interfacial strengths
Inter-laminar interfacial strengths have been traditionally difficult to be measured through experiments owing to the challenges in accurately determining the onset of delamination traction [64], which is usually chosen artificially. In this section, computational models of mode-I WTDCB and mode-II ENF are developed to carry out parametric studies to obtain realistic interfacial strengths. With appropriate initial interface stiffness (K = 4×10⁵ N/mm3), viscosity coefficient (10−5), the number of cohesive elements (Ne=5) in the cohesive zone and the fracture toughness values obtained from experimental tests, a suitable interfacial strength in the tensile direction (Nn) is firstly obtained through computational modeling of WTDCB by matching the load-displacement curves obtained from experimental tests. Similarly, interfacial strength in the shearing direction (Ss) is then determined by conducting computational modeling of ENF test. To further validate the calibrated interfacial strengths, computational modeling of FRMMELS is carried out to verify the accuracy. Three-dimensional (3D) computational models of WTDCB, ENF and FRMMELS are shown in Fig. 12(a)–(c), respectively.
Figure 12.
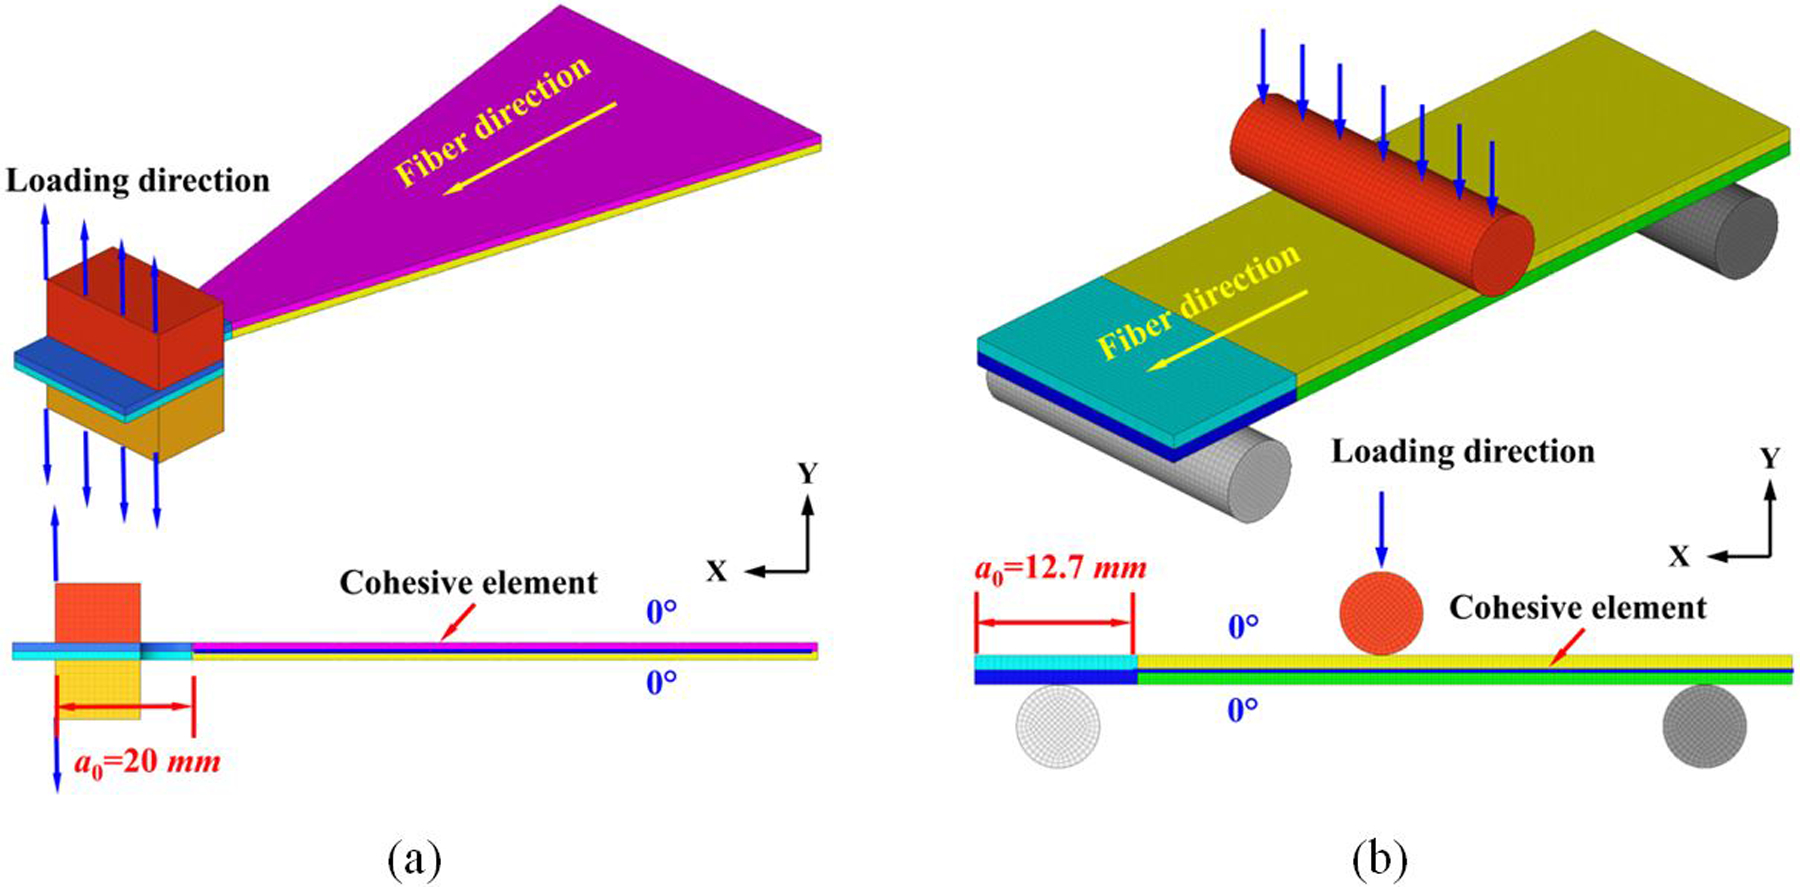
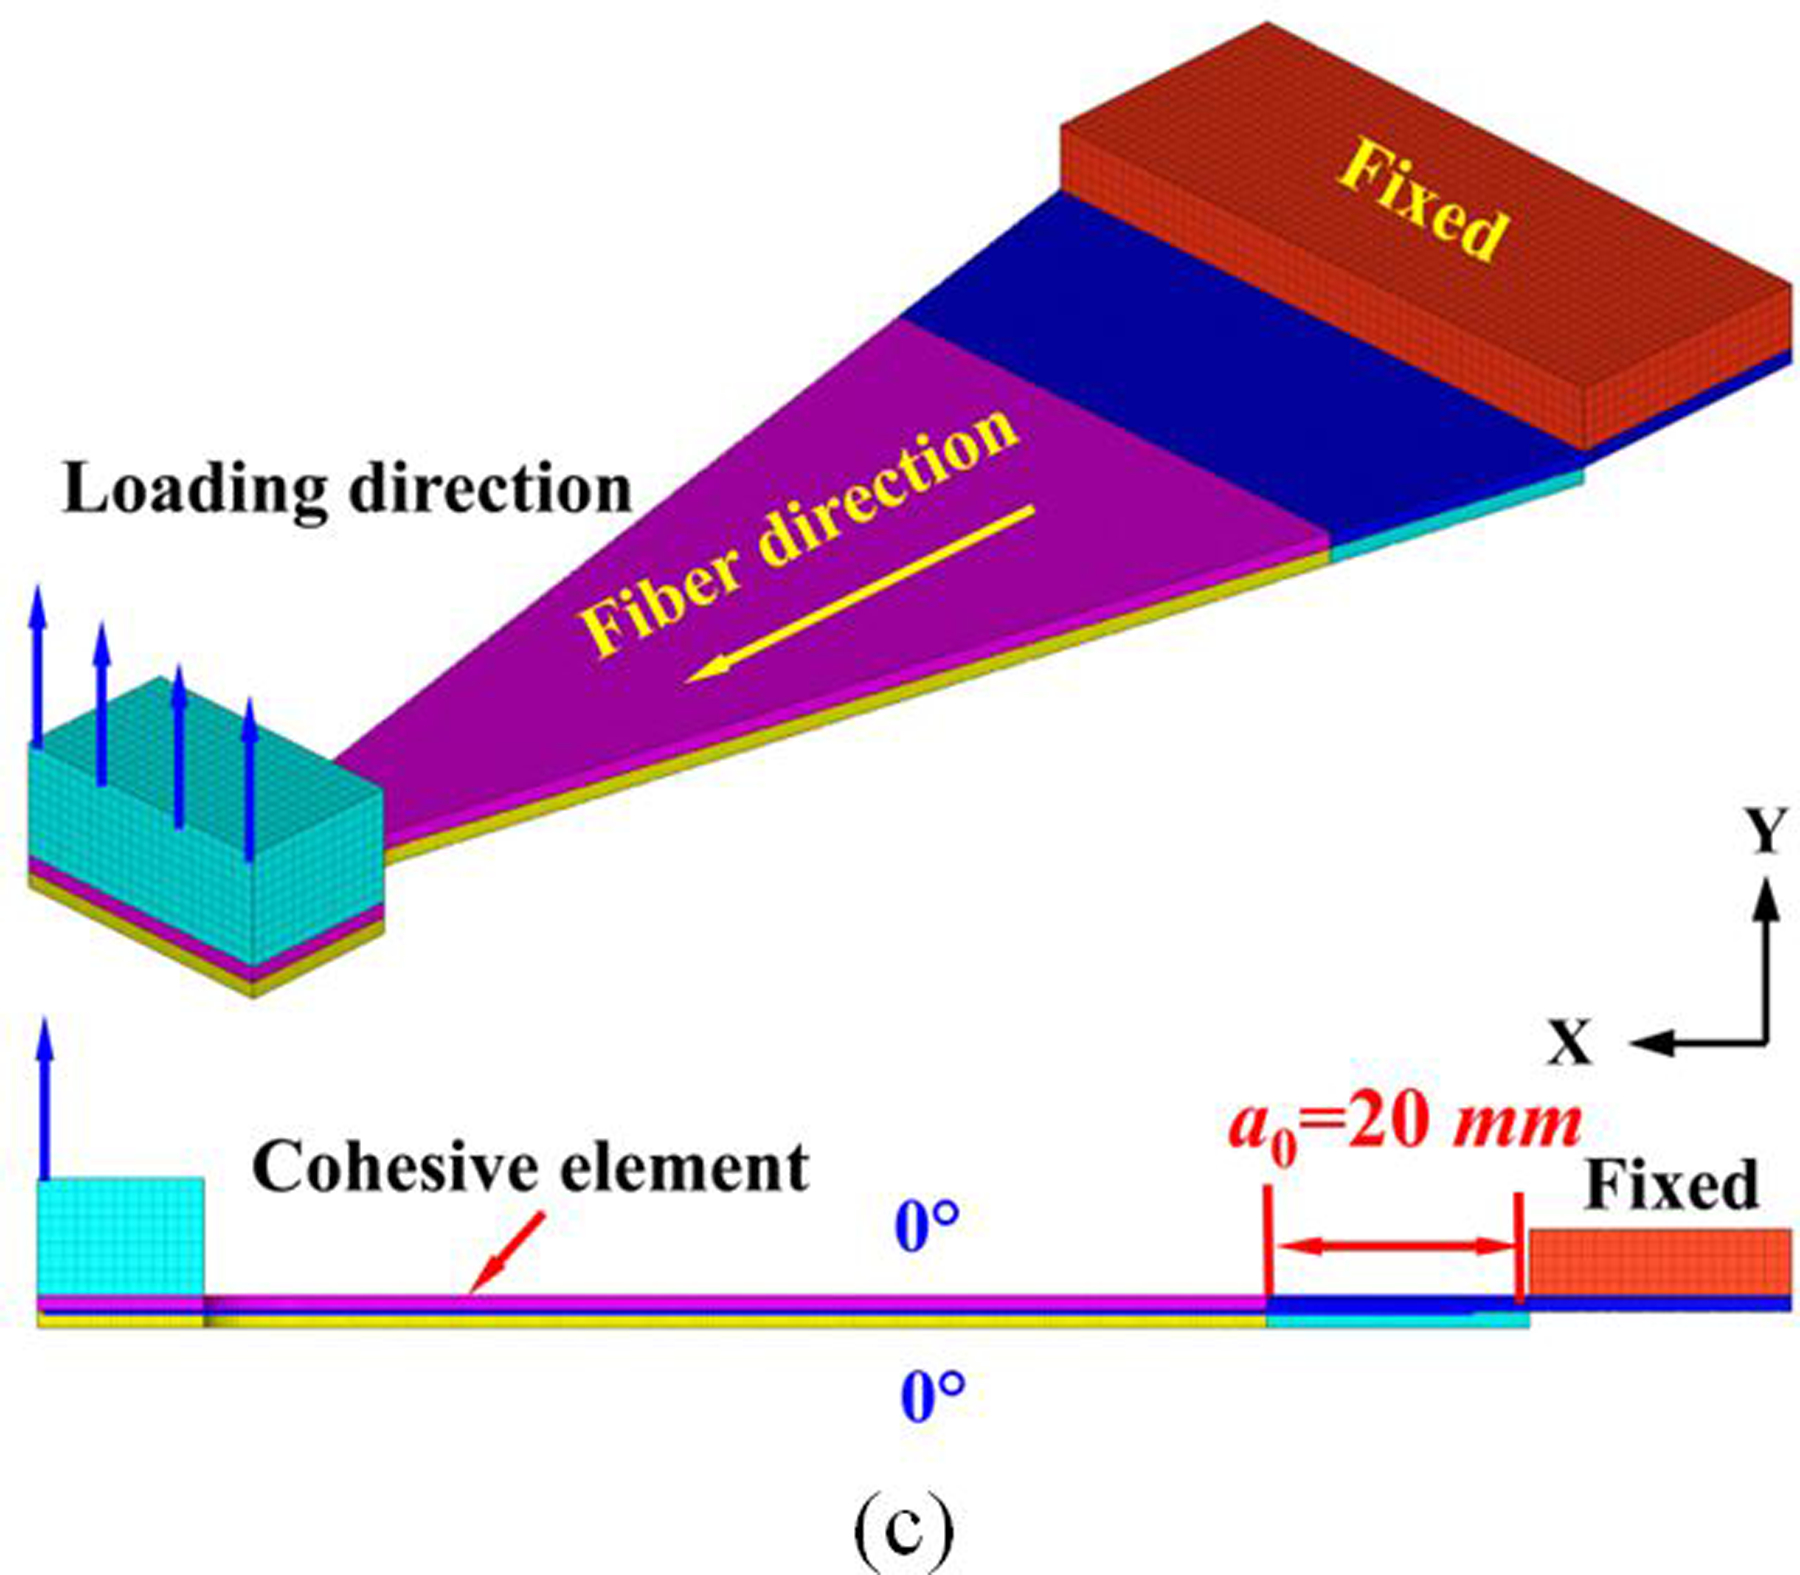
3D computational models of various test specimens in ABAQUS-Explicit FE code; (a) Mode-I WTDCB, (b) Mode-II ENF, and (c) FRMMELS.
The loading position and initial crack length are consistent with the experimental tests. In the delamination area, hard contact is applied to prevent the two sub-laminates from penetrating each other. C3D8R element is used in ABAQUS-Explicit FE code to discretize the laminated plate, and COH3D8 element is used to discretize the cohesive area. The outer 0° plies are modeled as homogenized and with a linear-elastic transversely isotropic material law. The relevant material properties are E11=125.9 GPa, E22=E33=8.6 GPa, G12=G13=4.584 GPa, G23=2.735 GPa, v12= v13=0.33 and v23=0.606.
3.3.1. Calibration of interfacial strengths from parametric studies
3.3.1.1. Parametric analysis scheme for interfacial tensile strength Nn
The chosen trial values of interfacial tensile strength Nn are set as 10, 15, 17, and 20 MPa and fracture toughness GIc values are 500, 550, 600, and 650 J/m2, respectively in the parametric study. First, GIc is set as 600 J/m2 and then we study the influence of Nn on the peak and stable load from computational simulations of WTDCB test. The predicted load-displacement curves and GI -displacement curves by using these Nn values are shown in Fig. 13(a) and (b), respectively. The results show that Nn has negligible effect on the predictions of stable load and GIc, while the peak load increases with increasing Nn. The best agreement between the experimental and predicted load-displacement traces is observed for Nn value of 17 MPa.
Figure 13.
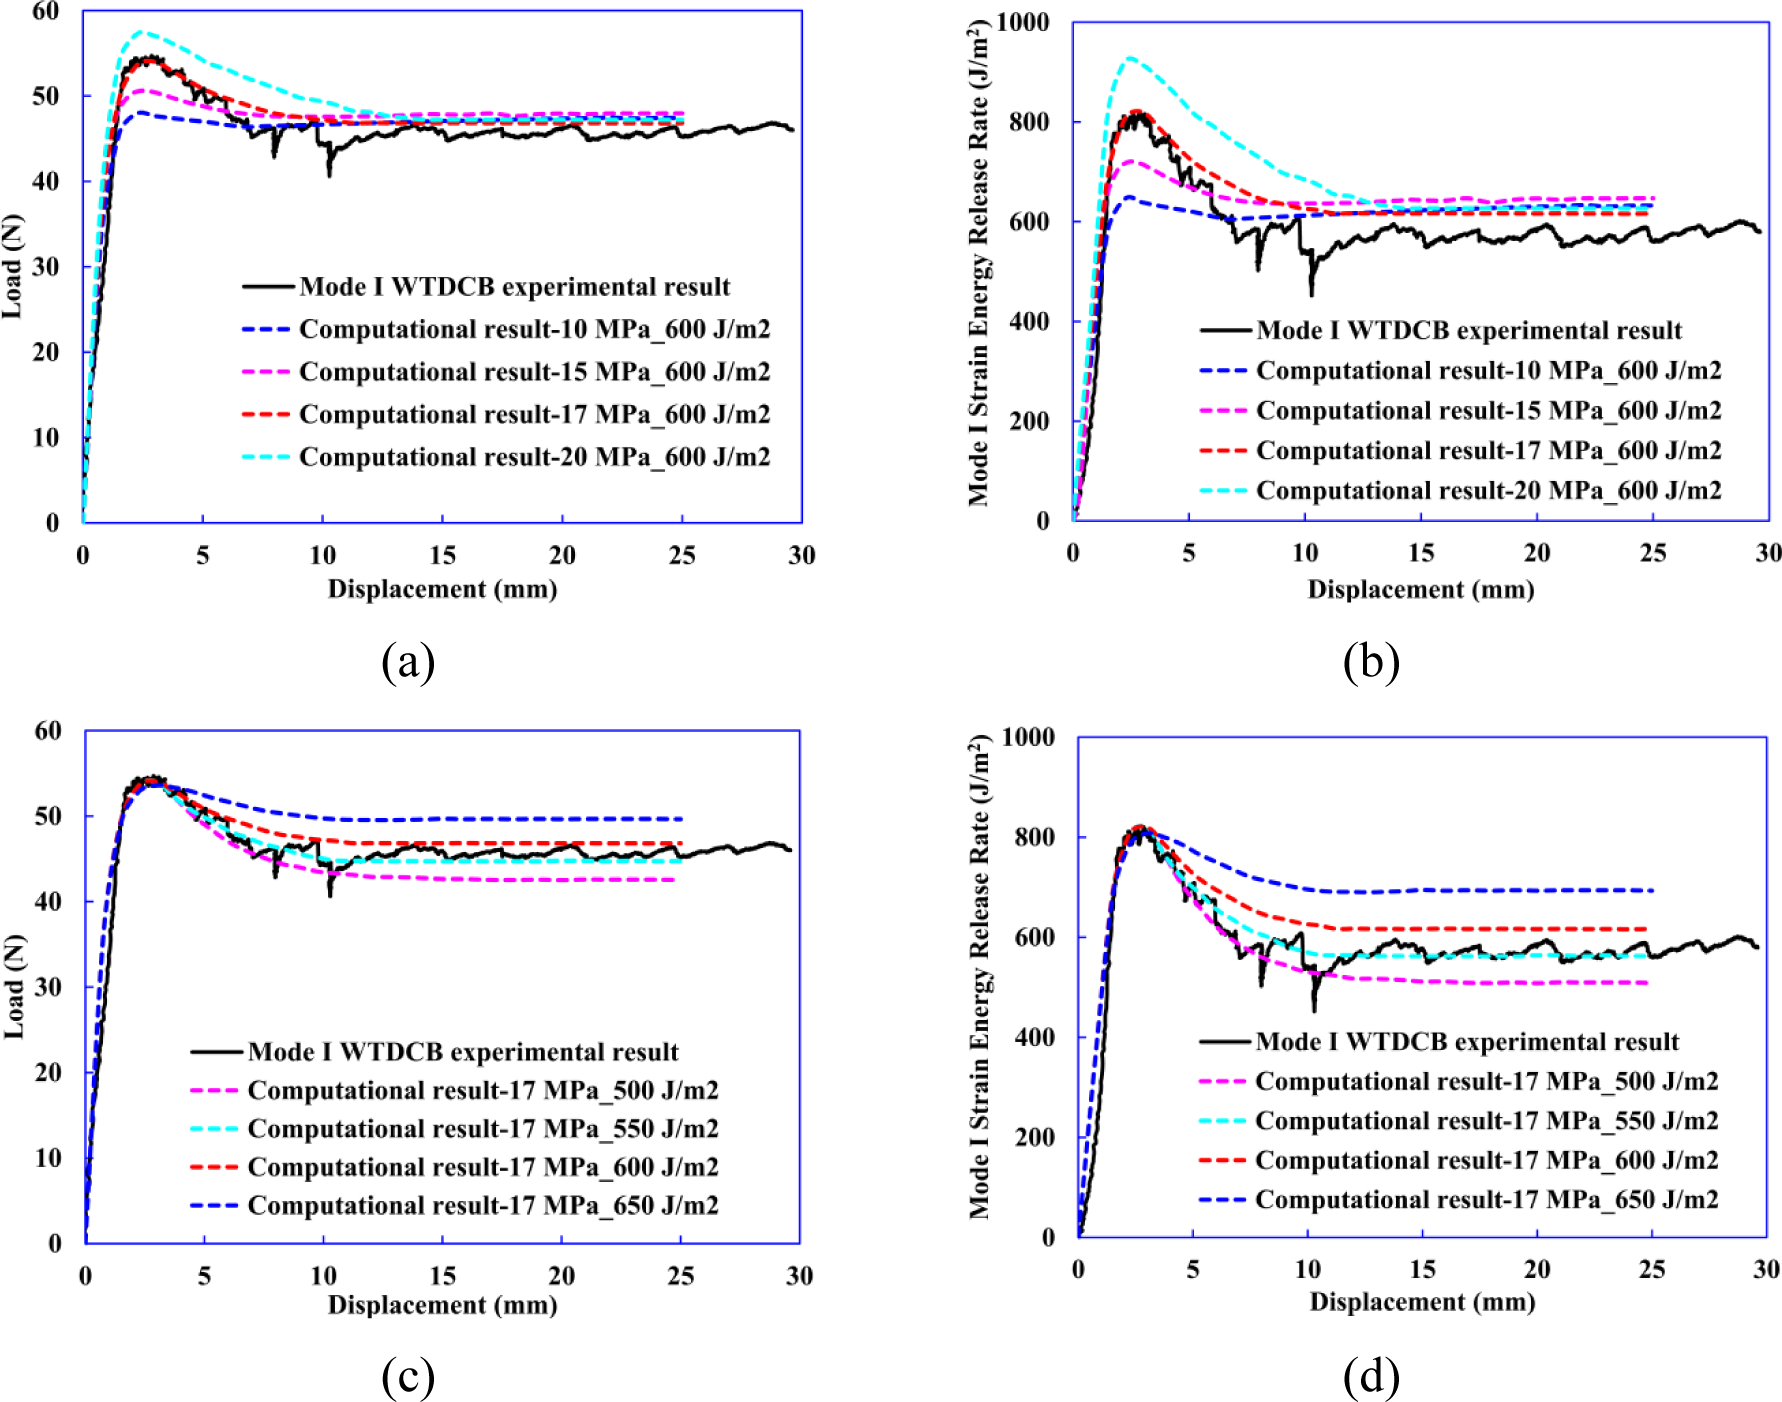
Comparison of (a) load–displacement curves by changing Nn values while keeping GIc at 660 J/m2, (b) GI -displacement curves by changing Nn values while keeping GIc at 660 J/m2, (c) load–displacement curves by changing GIc values while keeping Nn at 17 MPa and (d) GI -displacement curves by changing GIc values while keeping Nn at 17 MPa.
Next, the value of Nn is set to 17 MPa while GIc values are varied. The predicted load-displacement curves and GI-displacement curves by using various GIc are shown in Fig. 13 (c) and (d), respectively. The results show that GIc has negligible effect on the predictions of peak load, while predicted stable load and GIc increase with increasing values of GIc. The best agreement between the experimental and predicted load-displacement traces is found for GIc value of 550 J/m2.
In sum, the peak force is largely governed by Nn while the plateau in force that occurs after delamination propagation is highly influenced by the value of GIc. The Nn and GIc values are calibrated as 17 MPa and 550 J/m2 respectively through the parametric study.
An example of delamination initiation and propagation observed by computational modeling of WTDCB (Nn=17 MPa, GIc=550 J/m2) is shown in Fig.14. The delamination front shapes are somewhat jagged, suggesting that growth happens in one location then stops and continues at another location across the width. On average, however, the delamination appears to grow uniformly across the length direction.
Figure 14.
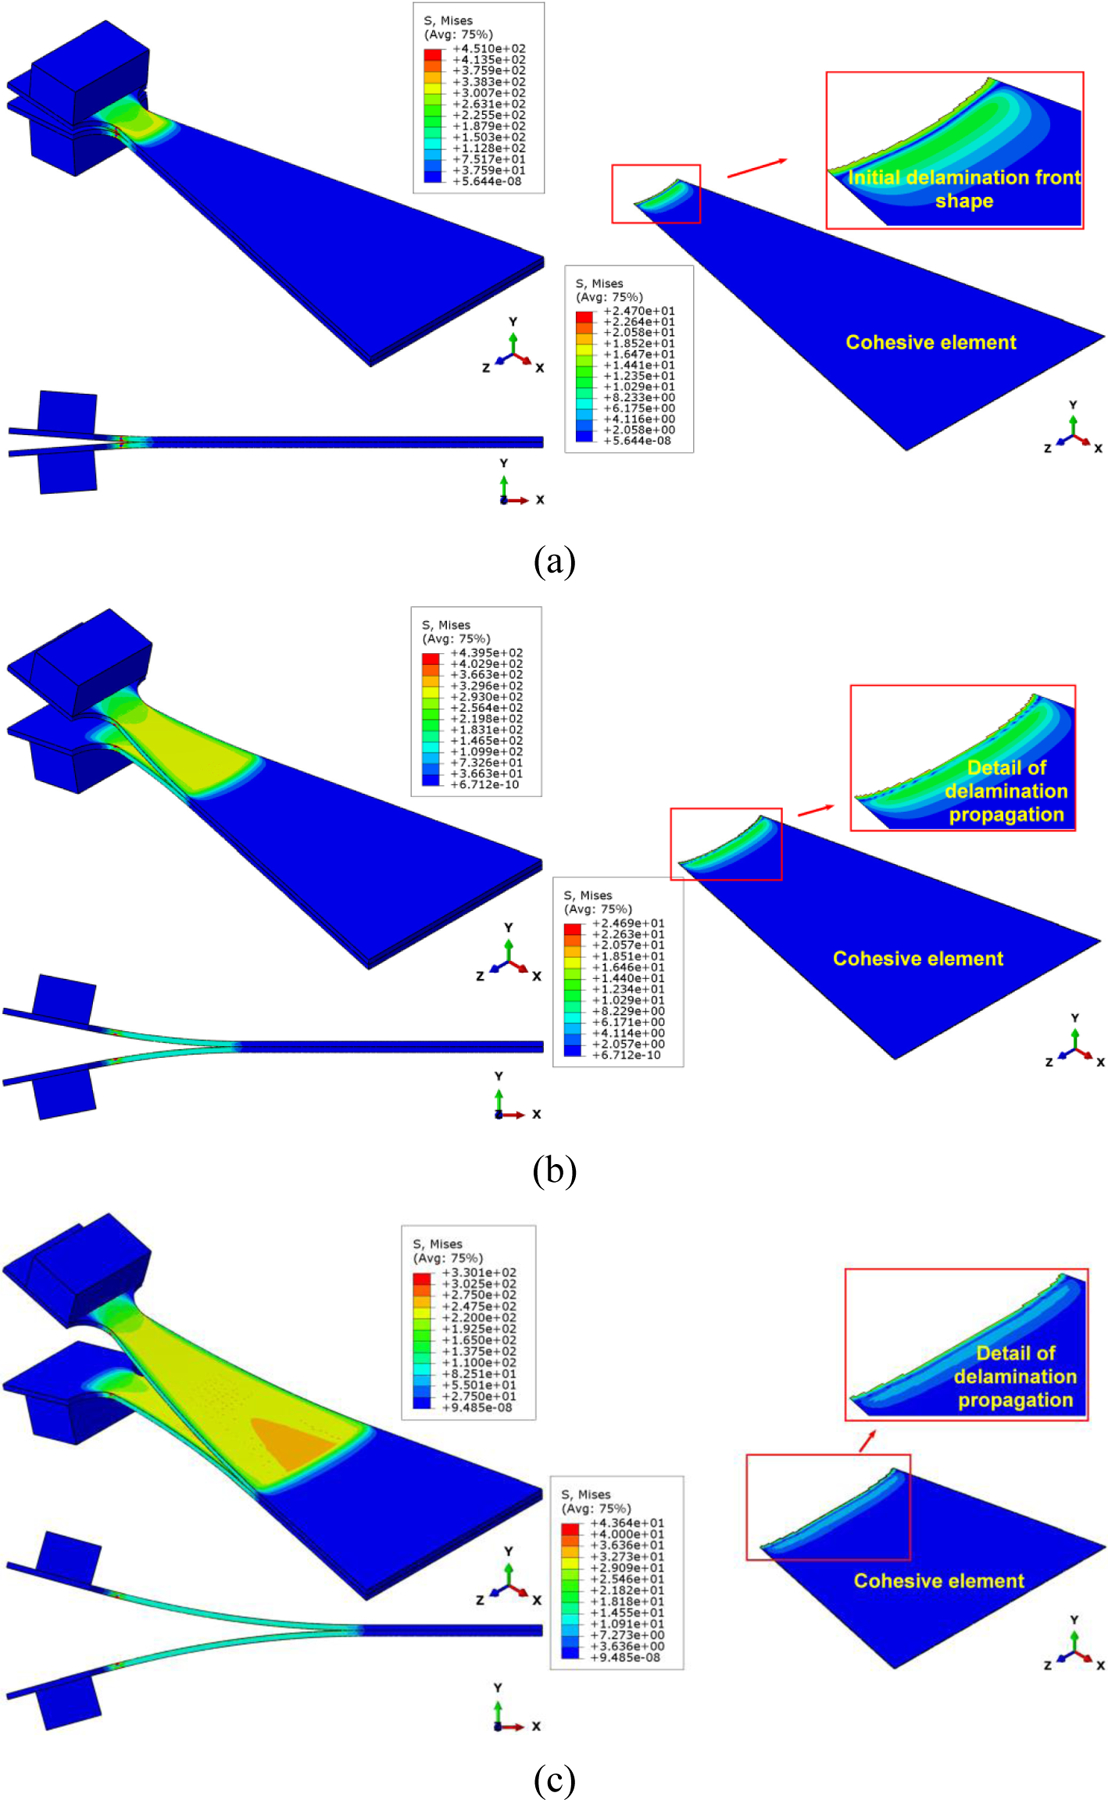
Computational modeling of WTDCB test (Nn=17 MPa, GIc=550 J/m2) showing Mises stress distribution in the sample at (a) delamination initiation, and during (b)-(c) delamination propagation.
3.3.1.2. Parametric analysis scheme for interfacial shear strength Ss
In the computational model of ENF test, the chosen initial values of Ss are 45, 50, 55, and 60 MPa while GIIc is set to 913 J/m2, consistent with the experimental result in section 3.2.2. As shown in Fig. 15(a), two stages can be observed in force-displacement curves involving (I) elastic deformation and (II) delamination initiation and propagation. In stage I, as the load increases linearly with displacement, no observable interfacial cracks are observed during the elastic deformation, as shown in Fig. 15(b). In stage II, all curves reach their peak load and the samples are damaged instantaneously. Simultaneously, as indicated in Fig. 15(c), an occurrence of delamination is observed.
Figure 15.
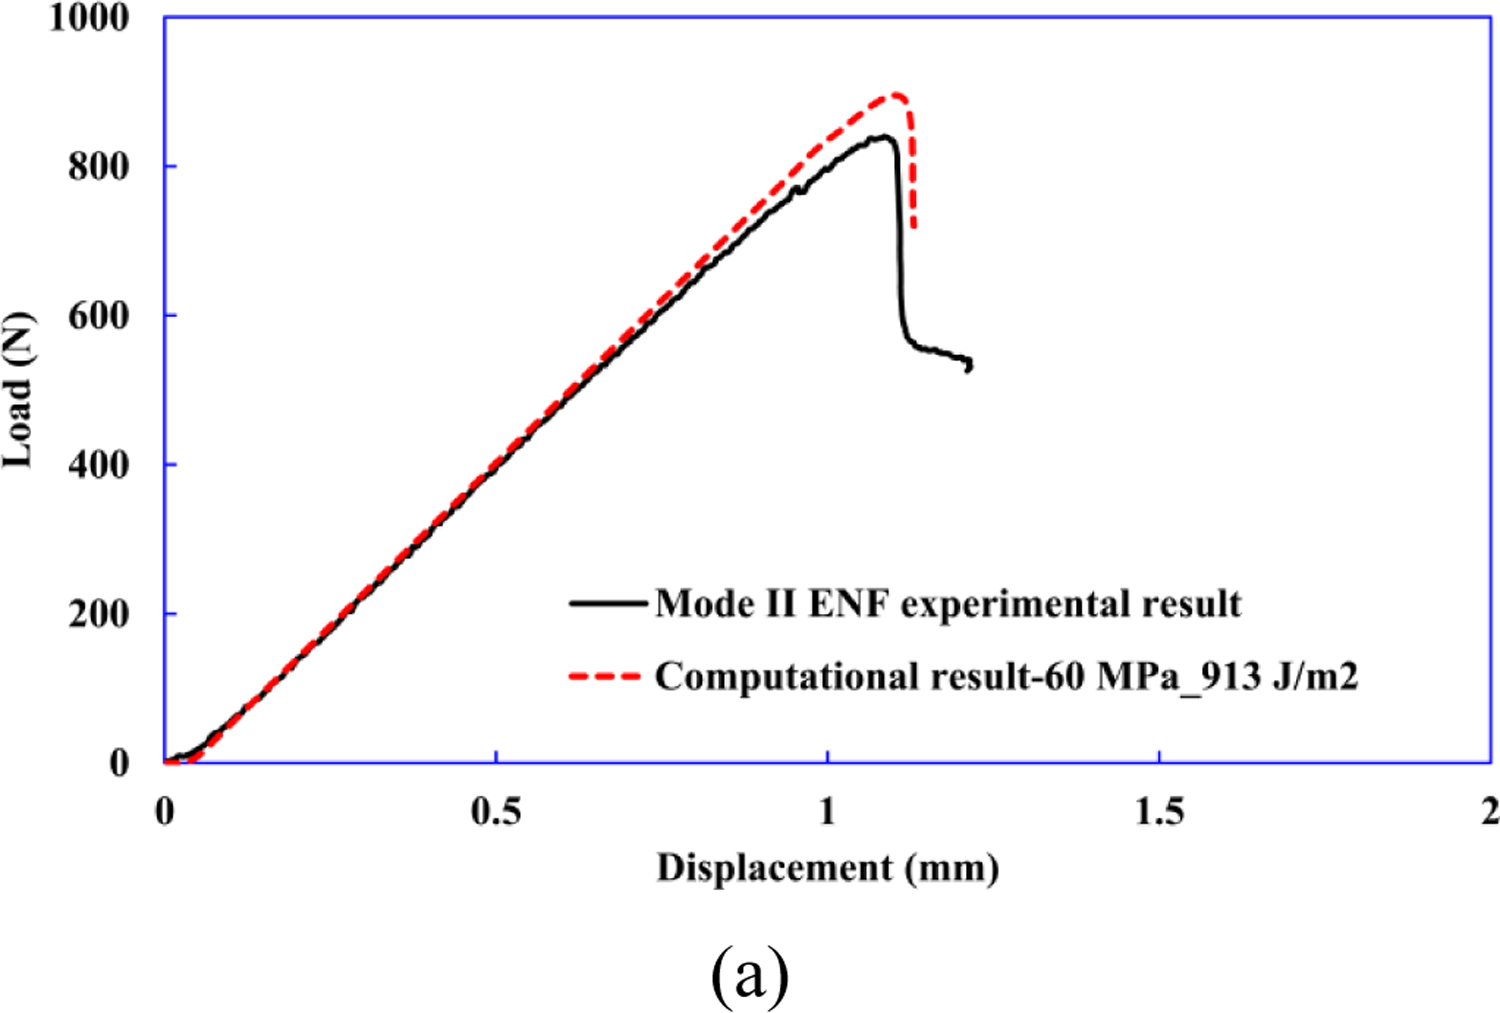
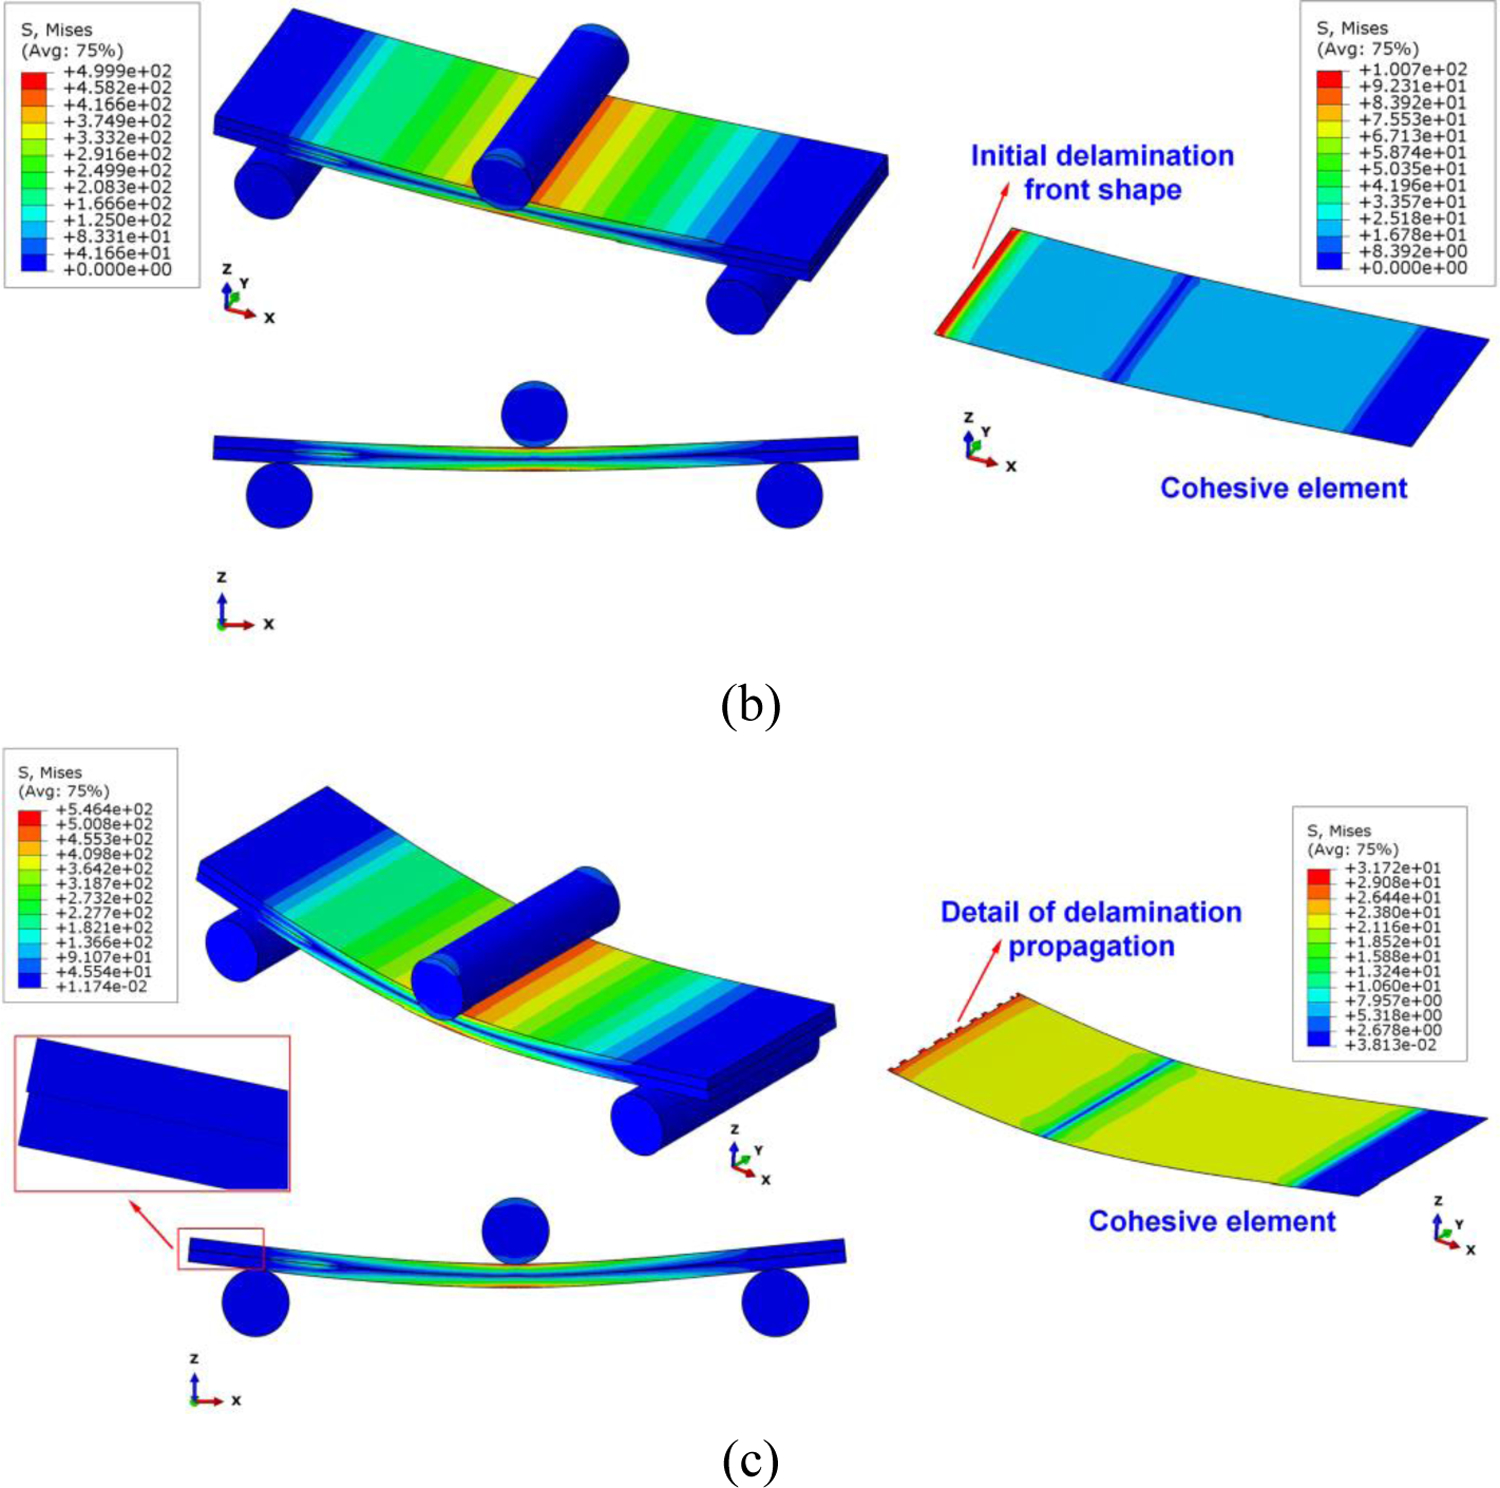
Computational modeling of mode-II ENF test. (a) Comparison of the numerical and experimental load–displacement curves, where Ss=60 MPa and GIIc=913 J/m2 are calibrated to match the two curves. (b) Onset of delamination, and (c) delamination propagation are captured and shown in the computational results.
Examining the load-displacement relationships from experimental results and computational predictions, it is evident that the peak load is highly influenced by Ss, and increasing Ss causes an increase in the maximum force. Compared with the experimental results, the load-displacement curve observed from Ss=60 MPa gives a reasonable replication of the experimentally observed load-displacement curve with an initial linear region followed by a drop in the load as the delamination propagation begins, as shown in Fig. 15(a). Thus, Ss is calibrated to be 60 MPa.
3.3.2. Validating the interface strength
The load-displacement curves predicted from computational modeling (Nn=17 MPa, GIc=550 J/m2, Ss=60 MPa and GIIc=913 J/m2) and FRMMELS mixed-mode test are compared in Fig. 16(a). Good agreement is observed in the linear elastic region and a slight difference can be seen in the nonlinear stage. The deviation from linearity appears to be a consequence of delamination initiation as shown in Fig. 16(b). With further increment in load, a gradual reduction in stiffness occurs as a result of delamination propagation, as shown in Fig. 16(c)–(d). Good agreement between the computational and experimental result is found, indicating that the interface strengths calibrated from computational modeling of WTDCB and ENF are indeed reliable.
Figure 16.
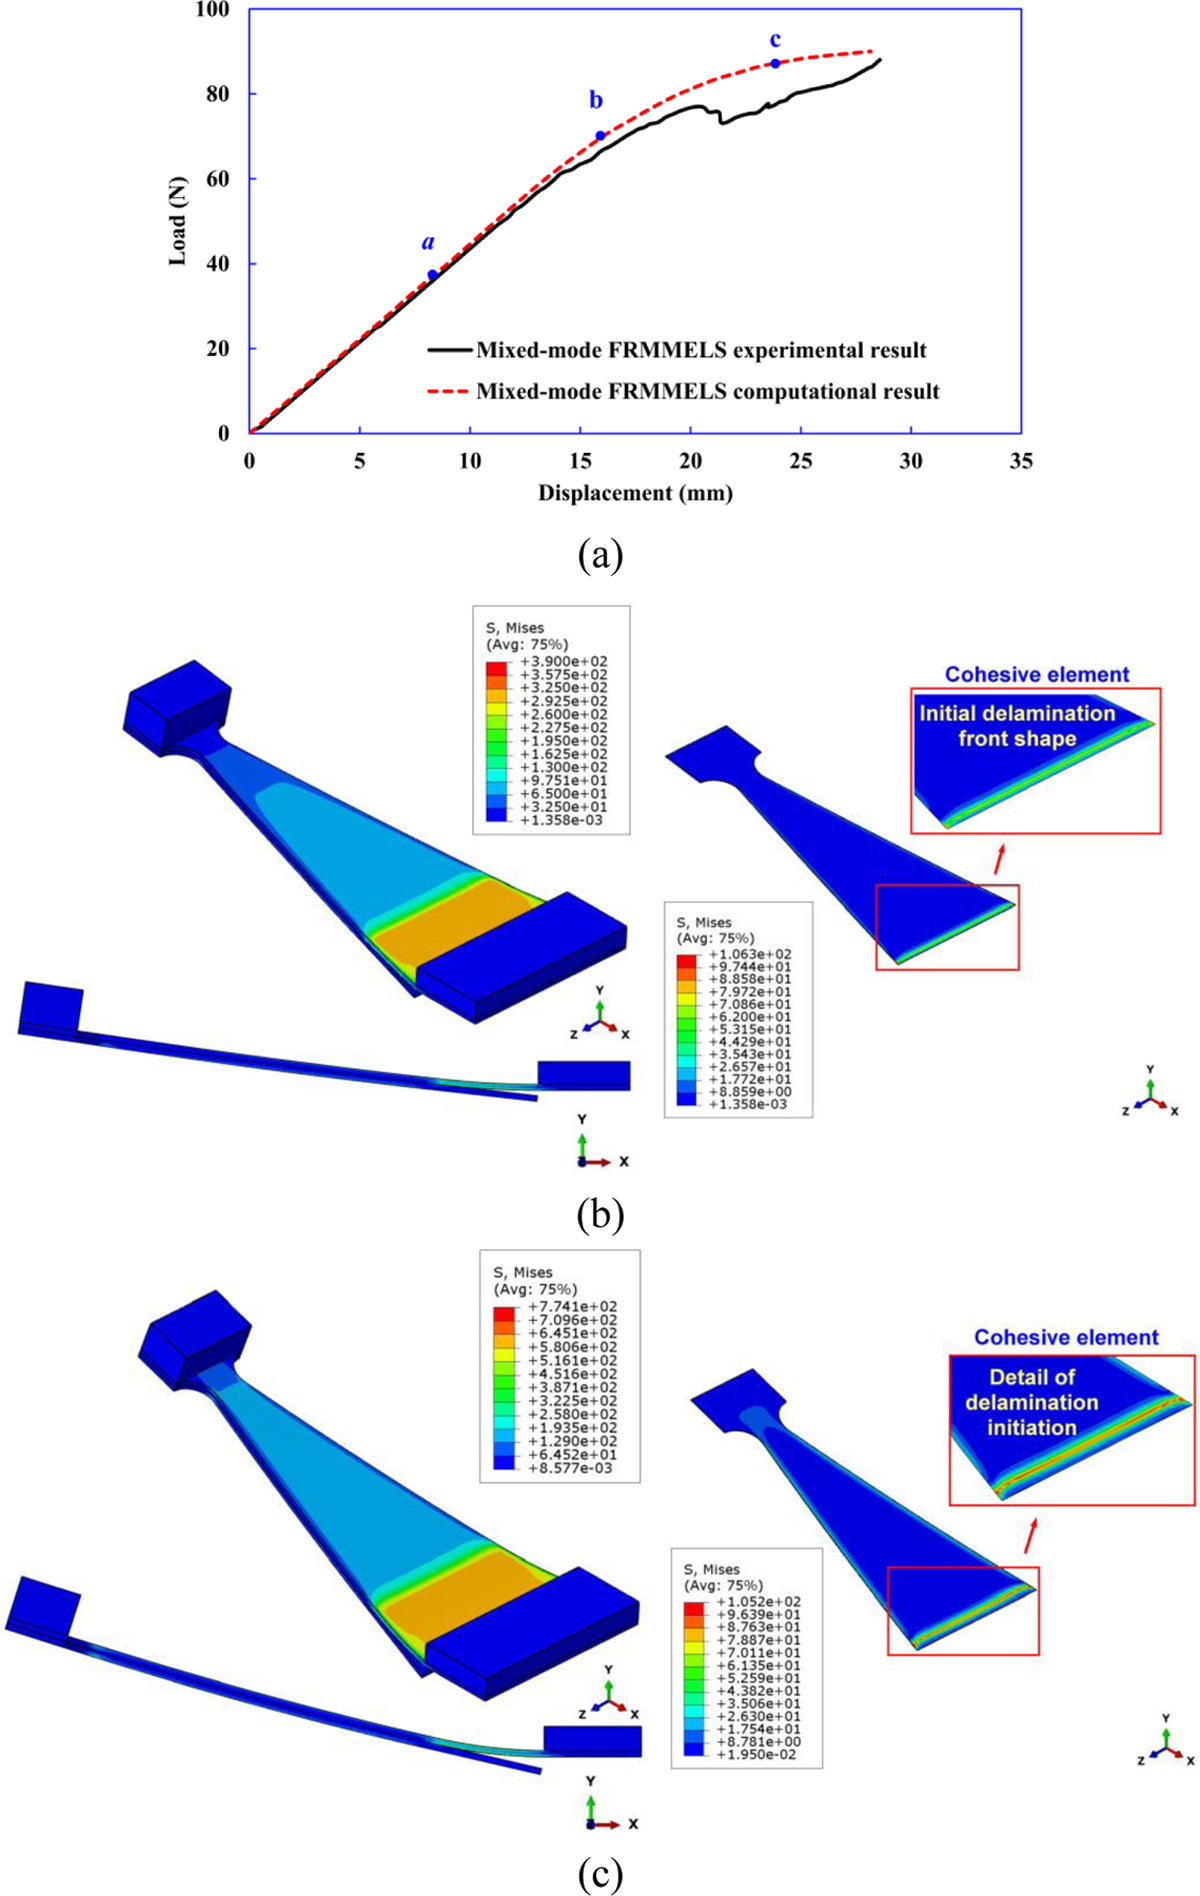
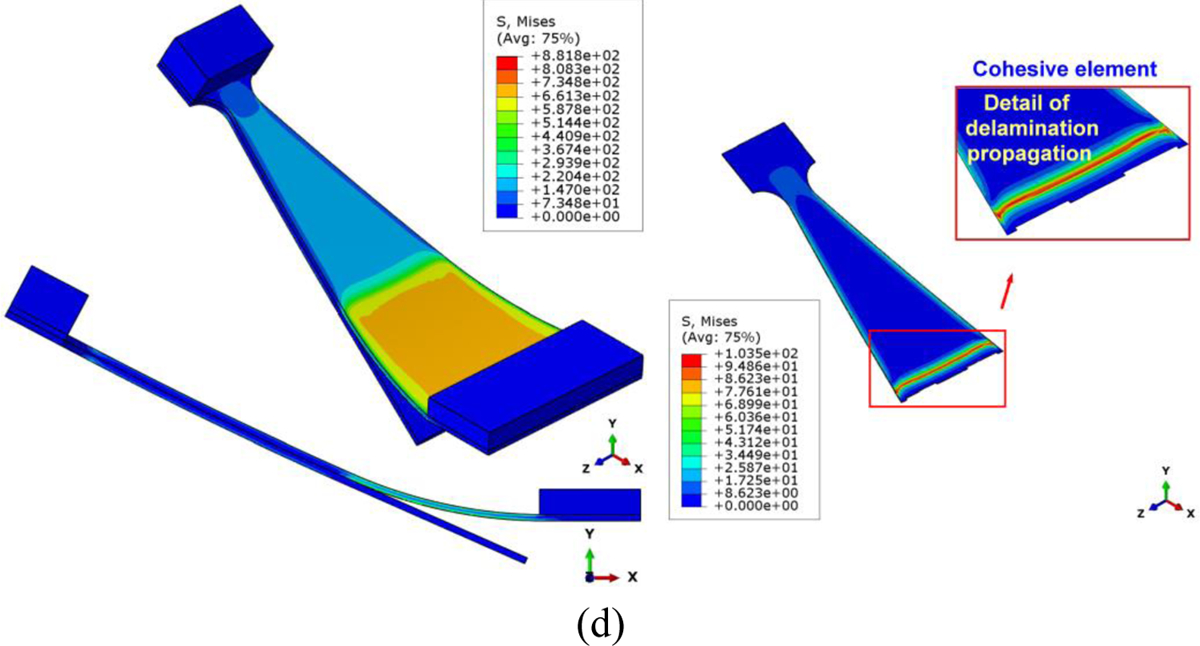
Computational modeling of mixed-mode FRMMELS test. (a) Comparison of the numerical and experimental load–displacement curves. (b) Onset of delamination, and (c)-(d) delamination propagation as shown in computational modeling. The corresponding CZM parameters are Nn=17 MPa, GIc=550 J/m2, Ss=60 MPa, and GIIc=913 J/m2.
4. Failure prediction of open-hole cross-ply laminates subjected to four point bending load
4.1. Experimental methodology
In real applications, CFRP laminated components are often fastened to the main body-in-white using bolts or rivet joints and thus usually contain holes. It is therefore very important to understand the failure mechanisms of open-hole CFRP laminated composites. Hart-Smith [65] proposed a good illustration of the relative joint strength efficiency of fibrous composites, as shown in Fig. 17. The results shown that strength efficiency of composite joint reaches the peak point when ratio of hole diameter to specimen width (d/W) is about 0.22. Thus, in this study, the hole diameter d and the specimen width W are chosen to be 10 mm and 45 mm, respectively, which gives d/W ≈ 0.22.
Figure 17.
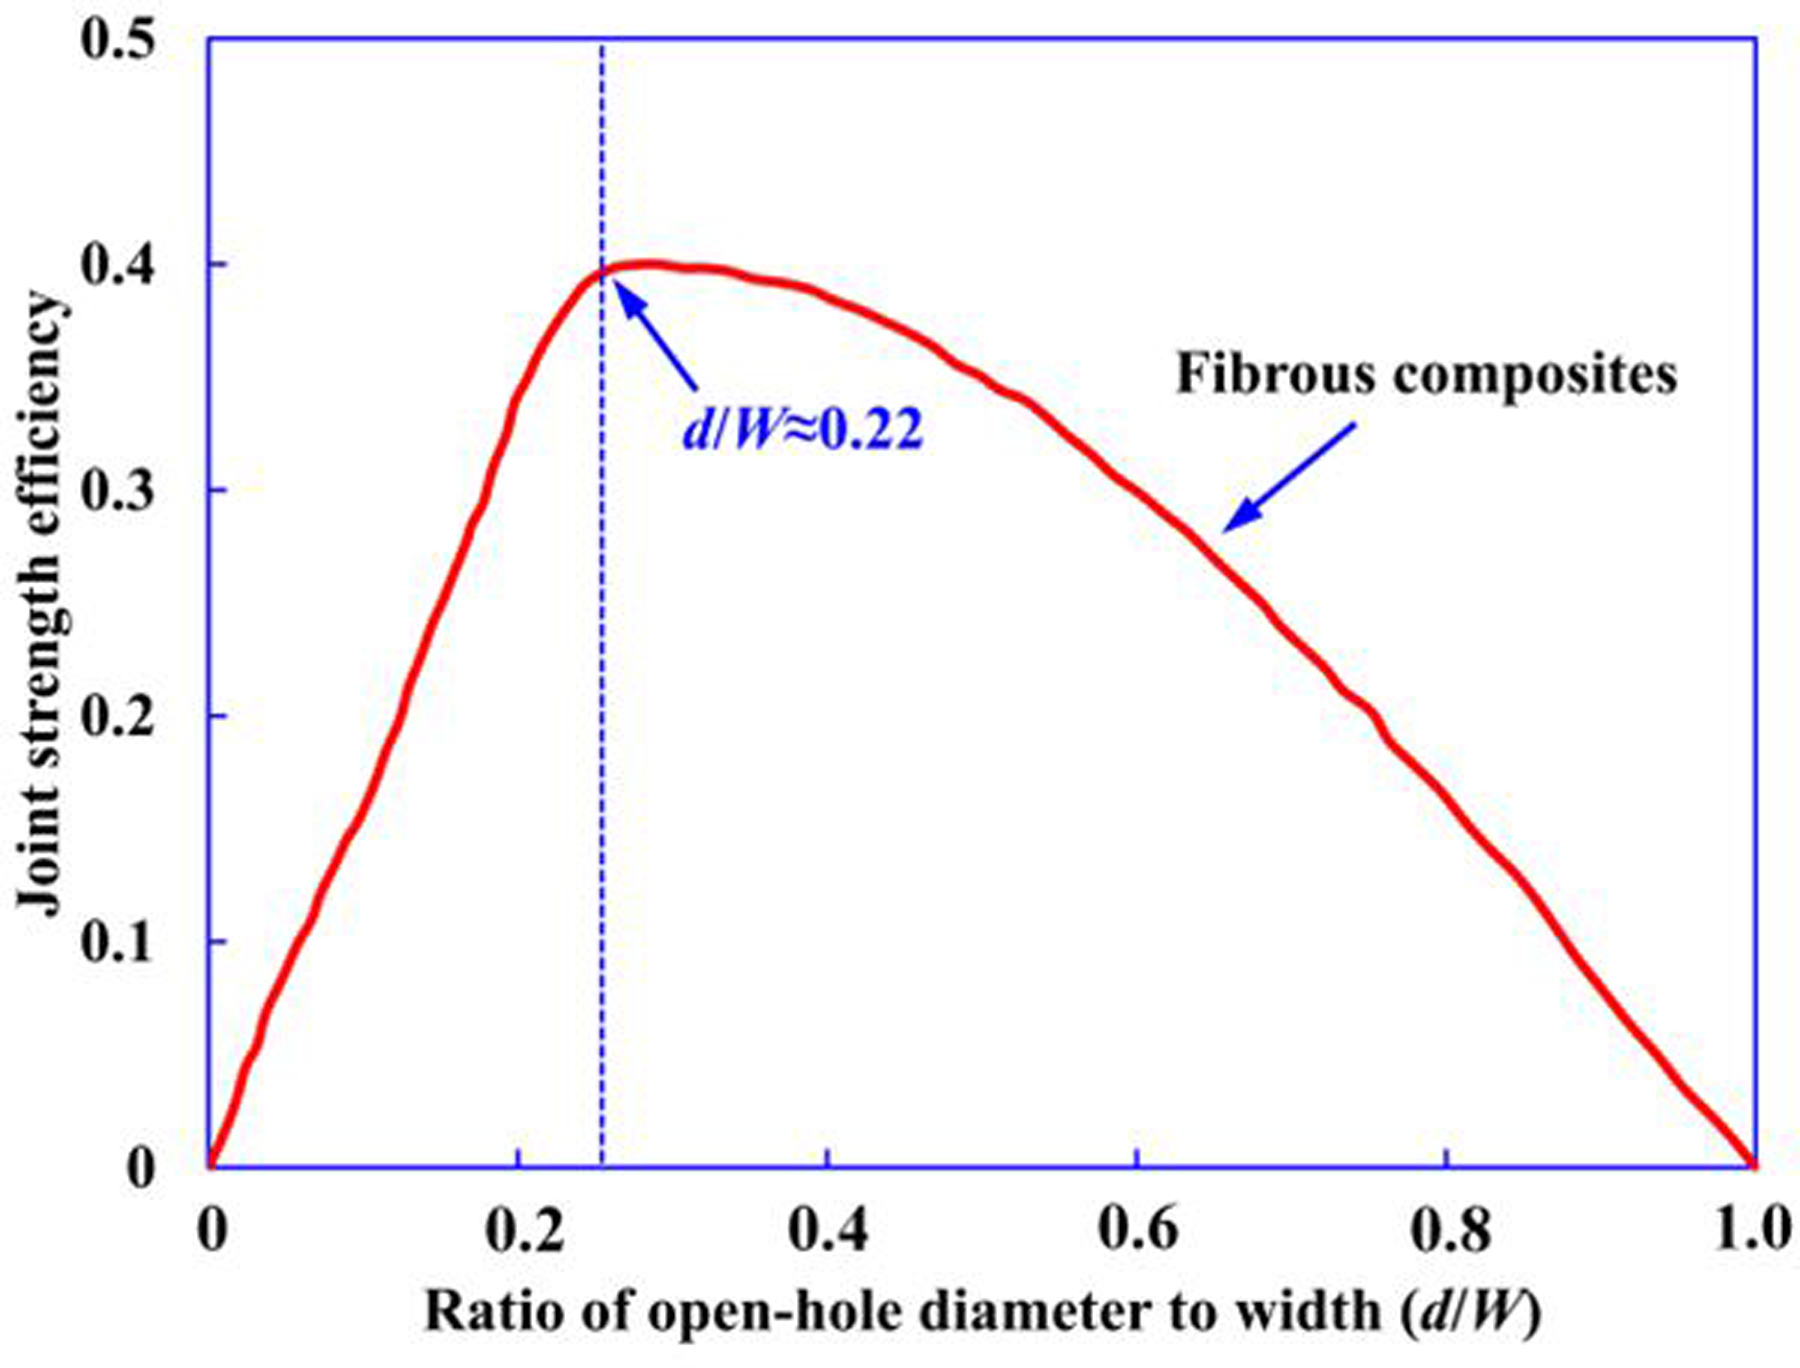
Relative joint strength efficiency of fibrous composite with various ratios of open-hole diameter to width according to Hart-Smith [65].
In this study, open-hole cross-ply laminates with a stacking sequence of [0/90/90/0/0/0]s and a total thickness of 2.5 mm are used in this study. The sample is molded with A42 carbon fiber and thermoset epoxy resin with a fiber volume fraction of 51.4%. The laminate is built-up with 12 layers of unidirectional prepregs and prepared by hot compression with holding time of 3 minutes for curing. Both carbon fiber and epoxy resin are supplied by Dow Chemical Company. The high-pressure water-jet machining can cause delamination or separation around the hole in a test specimen. Therefore, to improve the quality of the hole, the cross-ply laminates are pre-drilled with circular holes on a drill press prior to water-jet cutting of the outer boundaries of the specimen. In the process of producing pre-drilled holes, we find that macroscopic cracks appear around the hole when the diameter of hole is 5 mm. While, no initial cracks and delamination can be found if the diameter less than 2 mm, as shown in Fig. 18(a). Therefore, a pre-drilled hole with a diameter of 2 mm is selected in this study. Subsequently, the diameter of the hole is expanded to 10 mm and the required sample size is cut by using water-jet. We have confirmed that in this way, we can get rid of the delamination/separation around the hole during the described sample preparation process.
Figure 18.
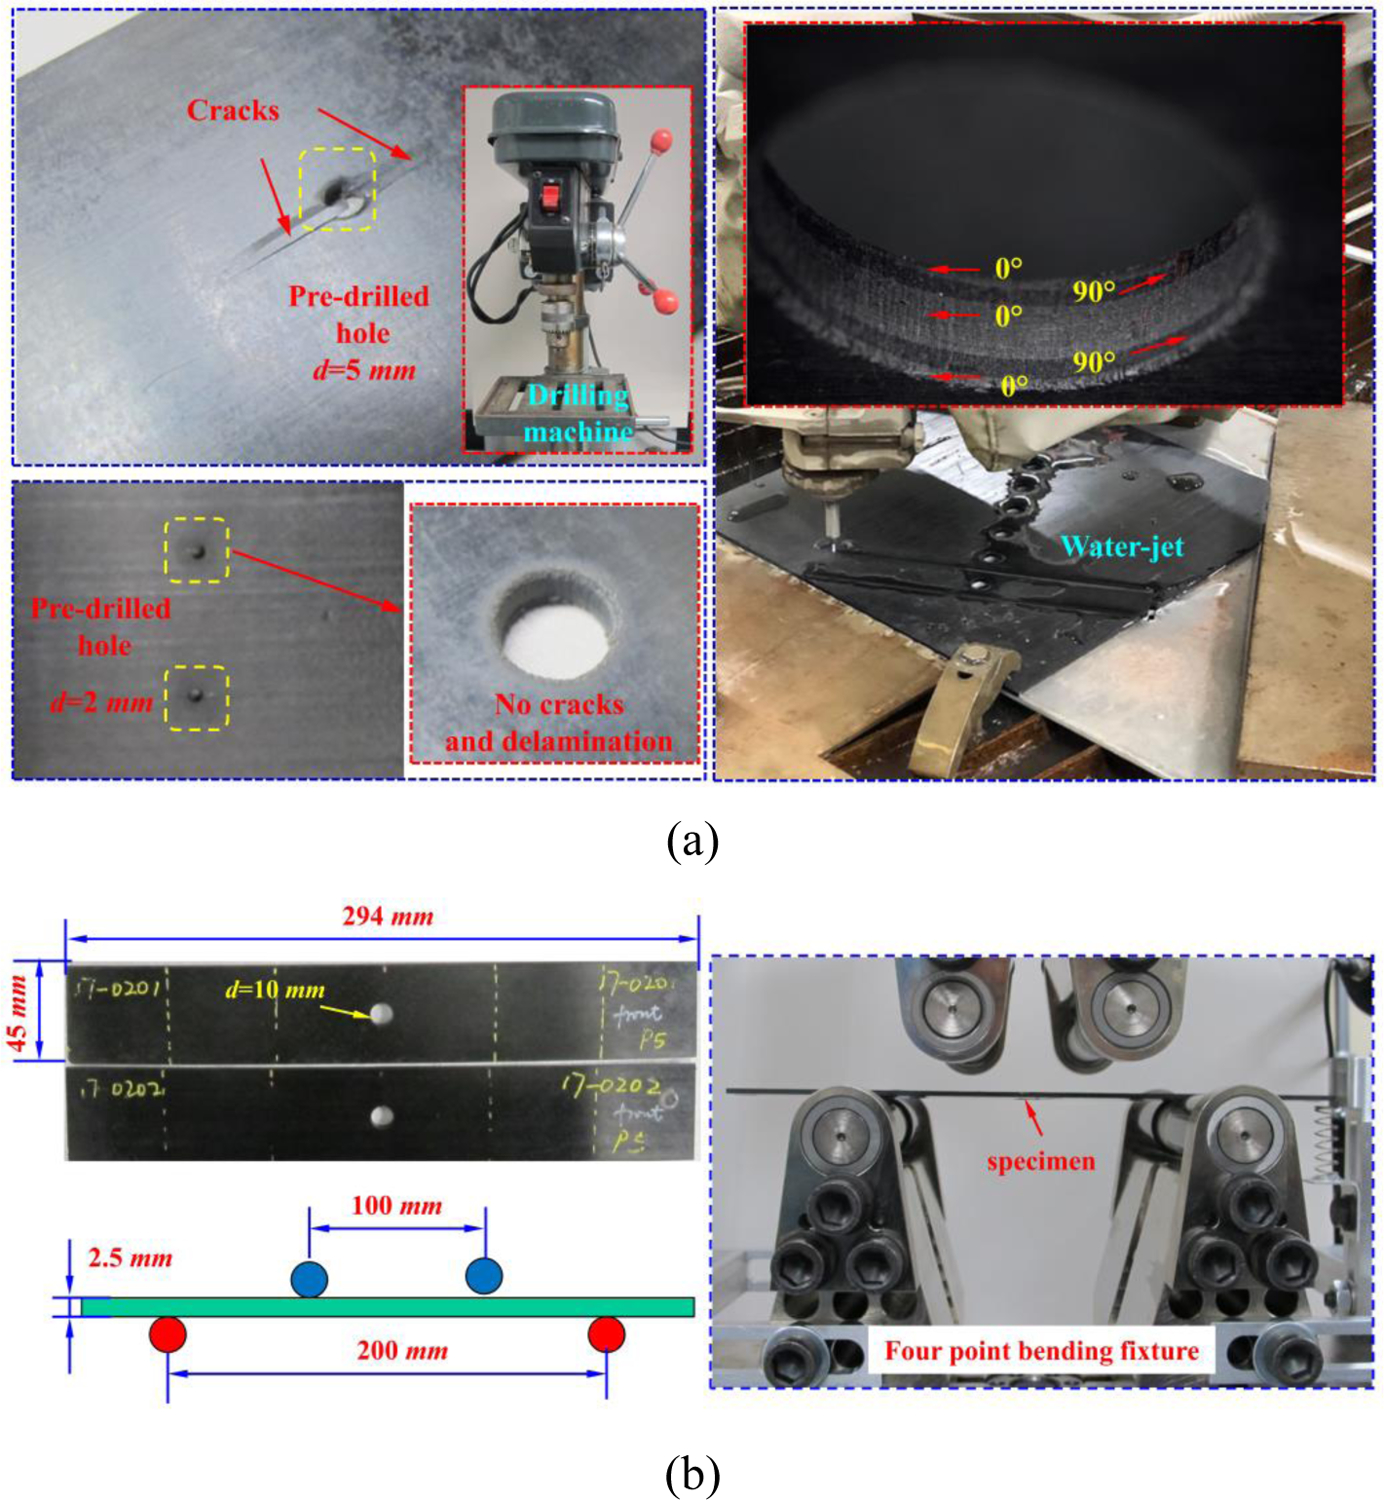
(a) Photographs of hole drilling and water-jet cutting processes, and we have found that a pre-drilled hole with a diameter of 2 mm and then expanded to 10 mm using water-jet leaves no cracks and delamination around the hole in the specimen. (b) Open-hole specimen geometry and four-point bending experimental setup.
The detailed open-hole specimen geometry and test setup are shown in Fig. 18(b). Tests are conducted at a crosshead displacement rate of 5 mm/min. Three specimens are tested to characterize the failure mechanism of open-hole cross-ply laminates by AMTS 810 servo-hydraulic test machine with four-point bending fixture in order to provide verification data for computational predictions.
Experimental load-displacement curves of open-hole cross-ply laminates under four-point bending load are shown in Fig. 19(a). From these tests, an average peak load of 1.2 kN is obtained. The load-displacement curves for all test specimens could be divided into three stages: Stage I is the elastic stage, in which the load-displacement curves have a linear relation; In stage II, delamination initiates at the interface between the 0° and 90° plies at the vicinity of the hole and sample edge, as shown in Fig. 19(b)–(c). Then, delamination propagates along the ply interface with a non-linear increase in the bending load with displacement; In stage III, 0° layer breakage occurs when the compressive stress at the compressive bending side reaches the longitudinal compression strength of CFRP composites, which results in an instantaneous drop in peak load to 1/2 of its value (see Fig. 19(d)). Subsequently, the load remains nearly constant (0.6 kN) with severe delamination around the hole and edge area. Finally, failure initiation and propagation of the 0° layers and 90° layers on the tensile bending side lead to catastrophic failure of the open-hole cross-ply laminates, as shown in Fig. 19(e)–(f).
Figure 19.
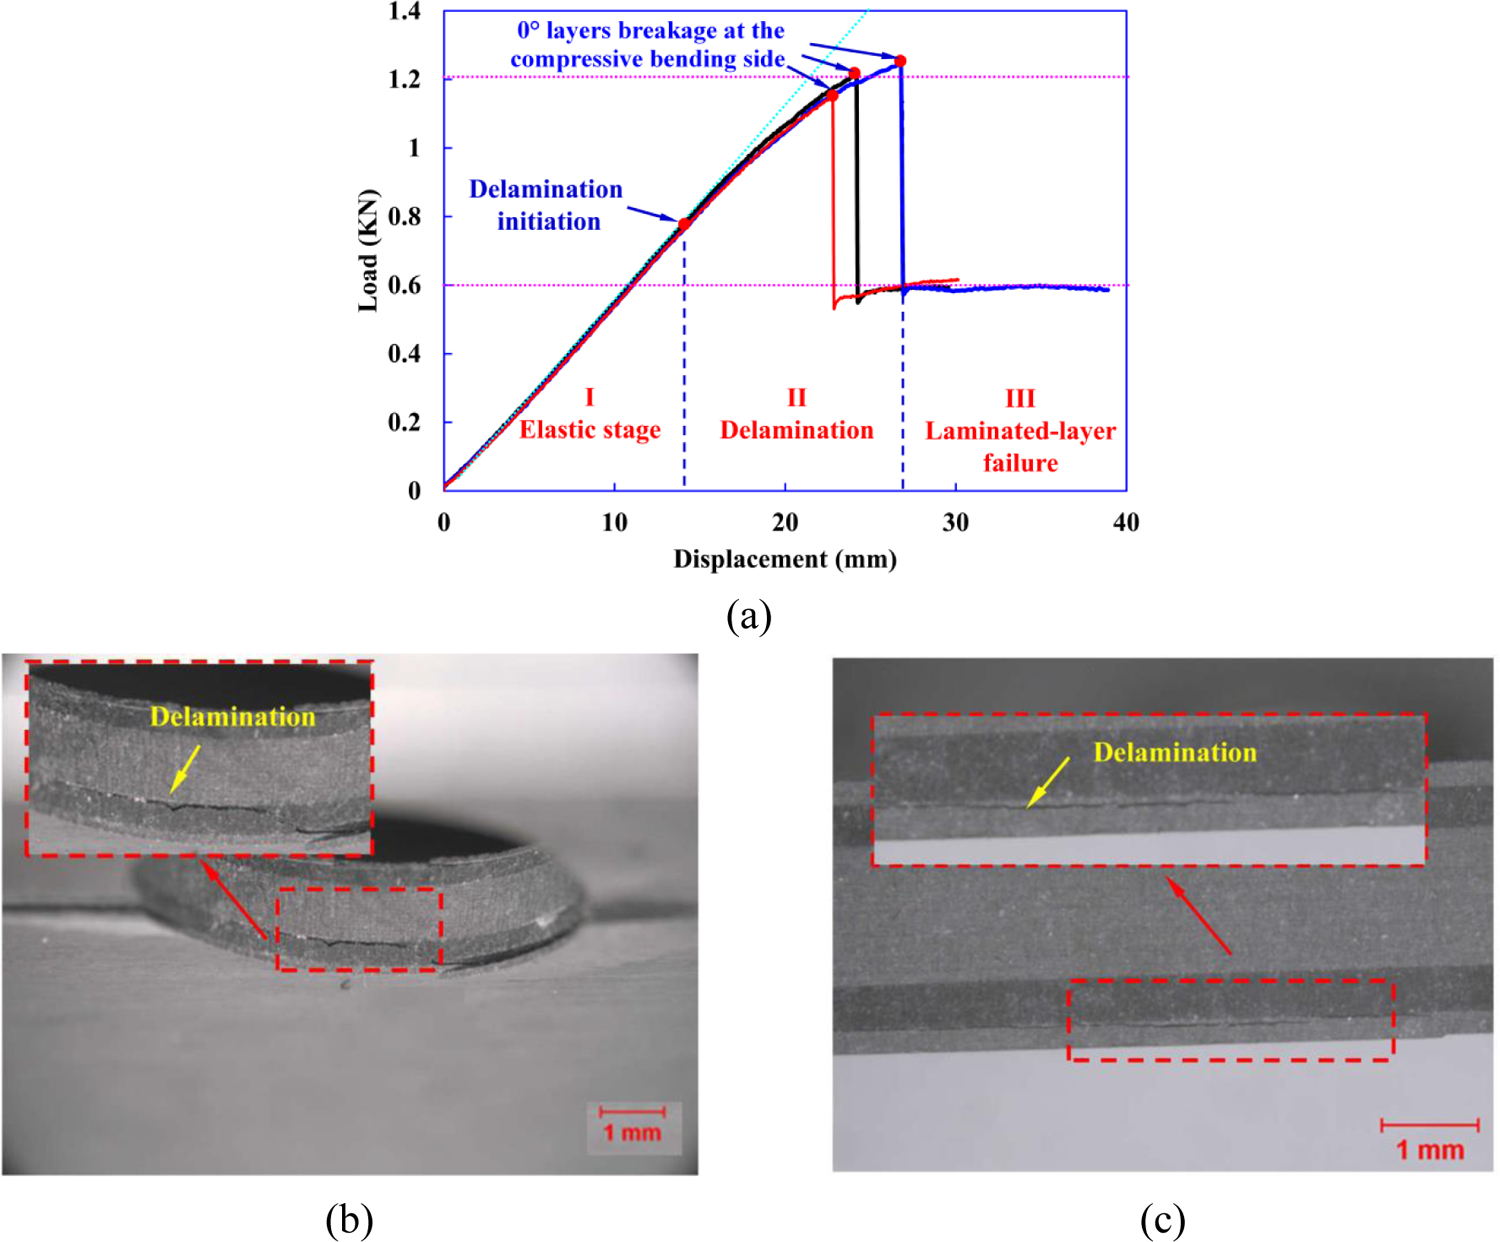
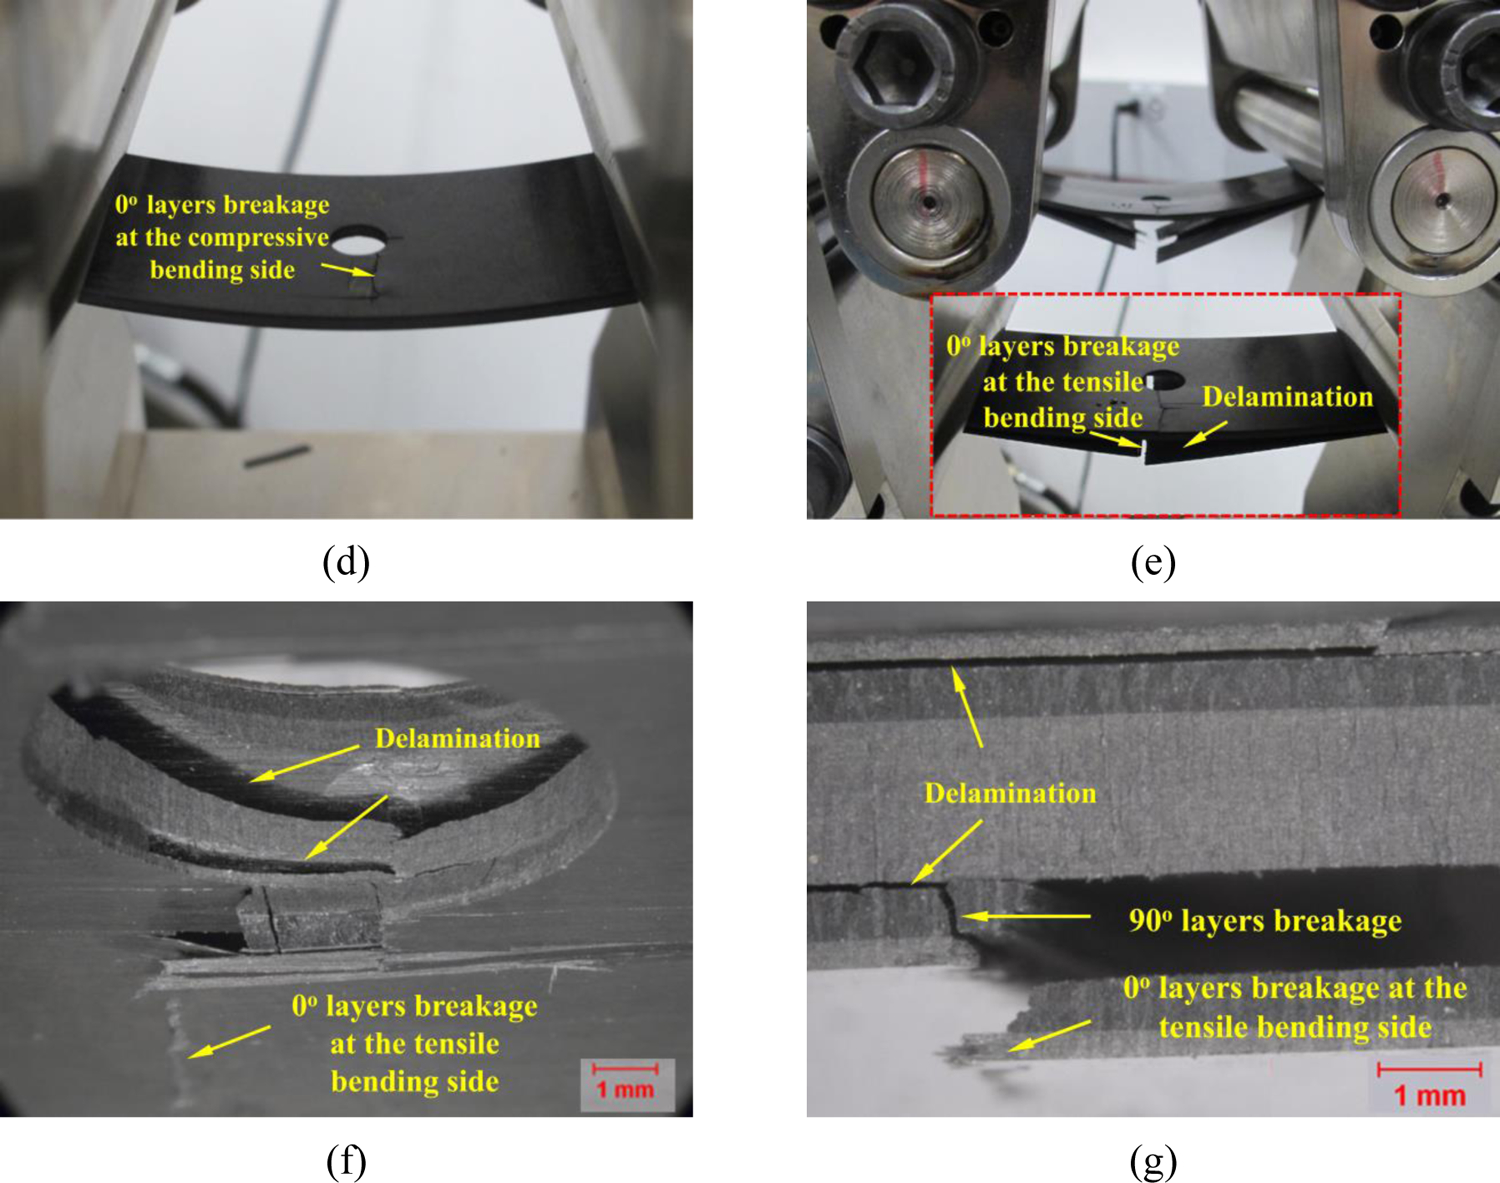
(a) Three-stage load-displacement curves of open-hole cross-ply laminates under four-point bending load. (b)-(g) illustrate the observed various failure mechanisms in the open-hole cross-ply laminates at different stages of deformation.
The experimental results show that delamination plays a critical role during the bending deformation of open-hole cross-ply laminates. In order to accurately characterize the delamination behavior of open-hole cross-ply laminates subjected to four-point bending load, the material parameters of CZM for computational modeling are extremely important. In the next section, we will use the parameters determined by combined experimental characterization and computational modeling in Section 3 and carry out multiscale computational modeling to get a thorough understanding of the failure mechanisms of cross-ply laminates subjected to four-point bending.
4.2. Multi-scale computational modeling
4.2.1. Description of multi-scale computational model
A multi-scale computational model of the open-hole cross-ply laminates with a stacking sequence of [0/90/90/0/0/0]s is developed to simulate the failure process under flexural loading. The model consists of rectangular planar specimen with dimensions of 294×45×2.5 mm3 with a central symmetric open hole between the two supports and two indenters, as shown in Fig. 20. The span between two supports and two indenters are 200 mm and 100 mm respectively, which are consistent with the experimental setup. Both the cylindrical pin supports and indenters are defined as discrete rigid, all with a radius of 10 mm same as in the experiments.
Figure 20.
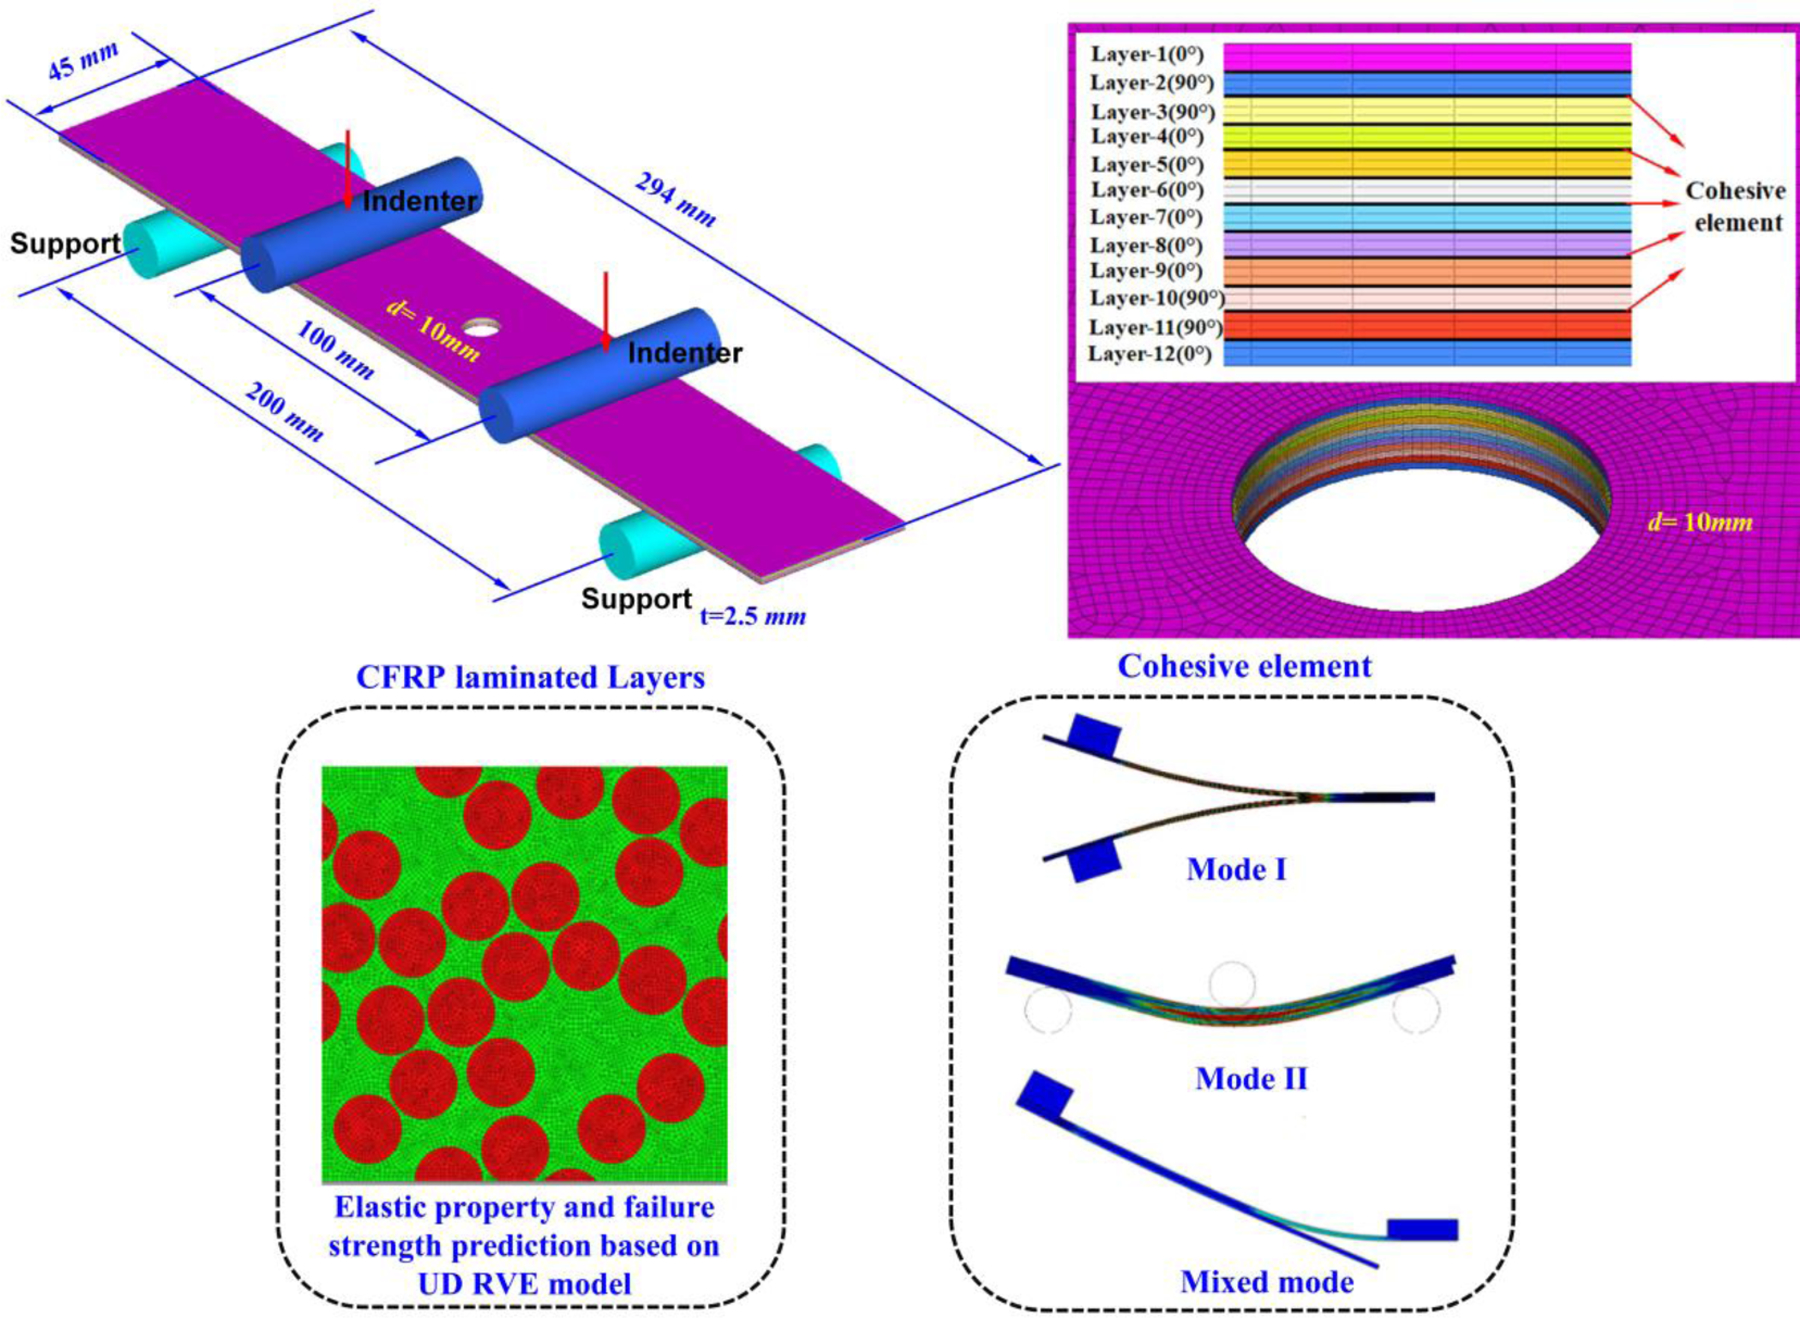
Schematic of multi-scale modeling of open-hole cross-ply laminates under four-point bending.
The open-hole cross-ply laminates are meshed using 8-node linear brick element (C3D8R) with the reduced integration and hourglass control. Both the global and local coordinates are defined to interpret the ply orientation and to accurately capture the mechanical behaviors of laminated layers. The interfaces between two adjacent plies are meshed using the first-order cohesive elements (COH3D8).
The contact condition between the indenter and the open-hole cross-ply laminates is surface-to-surface with small displacement, and the friction coefficient is chosen as 0.2 [66]. In order to mimic the boundary conditions of the experiments, the right and left supports are coupled with the open-hole cross-ply laminates and the contact conditions between them are rigid. The boundary conditions are defined by constraining all degrees of freedom of the supports. In order to facilitate solution convergence, the loading conditions of the model are divided into two steps. In the first step, a very small displacement of 0.001 mm is applied to the reference point of the indenters to ensure contact between the test specimen and the indenters. In the second step, a downward displacement of 40 mm is applied which leads to the failure of the open-hole cross-ply laminates due to flexural bending.
4.2.2. Material constitutive laws
4.2.2.1. CFRP laminated layers
The CFRP laminated layers are modeled using an elastic-plastic-damage model combining the Liu-Huang-Stout (LHS) yield criterion [48] and the RVE-based failure criteria [49].
LHS yield criterion is used to describe the elasto-plastic behaviors of the CFRP laminated layers. The yield criterion is defined as:
| (26) |
where F, G, H, L, M, N I, J and K are parameters characterizing the current state of anisotropy. These parameters can be simplified and defined as follows:
| (27) |
where σ1t and σ1c are the longitudinal tensile and compressive yield stresses; σ2t (σ3t) and σ2c (σ3c) are the transverse tensile and compressive yield stresses; ) and are the in-plane and out-of-plane shear stresses.
An associative flow rule is adopted to describe the yield surface evolution:
| (28) |
where represents the plastic multiplier and is determined by the Newton-Raphson method.
In order to characterize the damage evolution, the above elastic-plastic constitutive model is implemented into the continuum damage mechanics (CDM) framework. RVE-based failure criteria incorporating various damage mechanisms is adopted to describe the damage initiation, as described in our previous work [49]. Both the tension and compression failures in the longitudinal and transverse directions are identified as characteristic failure modes, which are described as follows:
| Tension dominated failure (σ22 > 0) |
(29) | |
| Shear dominated failure |
|
(30) |
| Compression dominated failure |
|
(31) |
| Fiber-compression dominated failure (σ11 ≤ 0) |
(32) | |
| Fiber-tension dominated failure (σ11 > 0) |
(33) |
where XT, XC, YT, YC, and SL are the failure strengths for fiber tension, fiber compression, transverse tension, transverse compression, and in-plane shear, respectively. The symbols and represent transverse normal and in-plane shear stress of the transition point.
The damage evolution of the CFRP laminated layers is defined through a reduction in the stiffness matrix C(D):
| (34) |
where Cij (i=1–6, j=1–6) are the components of undamaged stiffness matrix, and the parameters di are defined as follows:
| (35) |
where dL and dT are denoted as:
| (36) |
In Eqn. (36), εLf is the tensile or compressive failure strain along fiber direction; εL0 is the tensile or compressive initial damage strain along fiber direction; εTf is the tensile or compressive failure strain along transverse direction; εT0 is the tensile or compressive initial damage strain along transverse direction.
To avoid the element size effect, the strain at the end of failure is determined by the fracture toughness based on smeared formulation:
| (37) |
where GL and GT are the fracture toughness, which are adopted from the results of unidirectional reinforced carbon/epoxy laminate in Ref.[67]. In Eqn. (37), Lc is the characteristic element size.
The above damage model is implemented at the integral point in every element of laminated layers by the user subroutine VUMAT in ABAQUS [68]. Mechanical properties of the laminated layers are listed in Table 1.
4.2.2.2. Inter-laminar 0°/0°, 90°/90° and 0°/90° interface
The interface between the adjacent plies is modeled by means of a general mixed-mode CZM. Although a number of experimental studies indicate that the most conservative fracture toughness values can be obtained by propagating the interlaminar crack in the fiber direction in UD composites [69], there is growing experimental evidence that the interface lay-up for 0°/θ° [70–72], anti-symmetric﹢θ°/﹣θ° interfaces [73–75], and the direction of the interlaminar crack propagation with respect to the reinforcement directions of the adjacent plies have significant influences on the fracture toughness [76]. Polaha et al. [77] tested C12K/R6376 with lay-up of [θ°/θ°] (θ=0, 15, 30), and the experimental data indicated fracture toughness GIc increase with increasing fiber angle θ. Laksimi et al. [78] tested considerably tougher T300/VICOTEX M10 for 0°/0° and 90°/90° layers, and the fracture toughness GIc increased by 26% when propagation direction was changed from along the fibers (0°/0° interface) to transverse to the fibers (90°/90° interface). Meanwhile, experimental work showed that the apparent values of the fracture toughness GIc of 0°/90° were two times higher than those of 0°/0° layers under steady state propagation conditions [71]. In addition, Hwang et al. [79] tested mode II fracture toughness of C12K/R6376 with lay-up of [θ°/θ°] (θ=0, 15, 30, 45), and the fracture toughness GIIc was found to decrease as the fiber angle θ increased. Rubbrecht and Verpoest [80] also studied cross-ply interface for HTA/6376 and AS4/3501–6, and found that fracture toughness GIIc decreases monotonically with increasing θ. Qualitatively similar results were obtained by Laksimi et al. [81] for E-glass/M10 using ELS tests for fiber orientation θ=0, 15, 30, 45, and 60. Furthermore, experimental results shown that the fracture toughness GIIc for delamination direction normal to reinforcement (90°/90° interface) was lower by 40% than that along the fibers (0°/0° interface) [82]. Trakas and Kortschot [82] compared fracture toughness GIIc for cross-ply interface (0°/45°) of AS4/3501–6 to that of UD composite (0°/0°), and found somewhat smaller (by about 20%) average fracture toughness GIIc for cross-ply interface by ENF test. Similar results were obtained by Russell et al. [83] for AS1/3501–6. Therefore, application of appropriate fracture toughness values for different ply interfaces is necessary for accurate prediction of delamination development.
Based on above experimental observations, in this study, the mode I and mode II interfacial properties of 90°/90° are set to be 1.26 and 0.6 times of 0°/0° interface, respectively. For the 0°/90° interface, the mode I and mode II interfacial properties are set to be 2 and 0.8 times of 0°/0° interface respectively. The corresponding interfacial properties of 0°/0°, 90°/90°, and 0°/90° for different modes are listed in Table 4, where the interfacial properties of 0°/0° have been obtained from experimental and computational results in Section 3.
Table 4.
Inter-laminar 0°/0°, 90°/90° and 0°/90° interface properties.
| Cross-ply interface |
K (N/mm3) |
Nn
(MPa) |
Ss= St
(MPa) |
GIc
(J/m2) |
GIIc= GIIIc (J/m2) |
m |
|---|---|---|---|---|---|---|
| 0°/0° interface | 4×10⁵ | 17 | 60 | 550 | 913 | 0.475 |
| 90°/90° interface | 4×10⁵ | 21 | 36 | 693 | 547 | 0.475 |
| 0°/90° interface | 4×10⁵ | 34 | 48 | 1100 | 730 | 0.475 |
4.3. Computational results and discussions
Fig. 21(a) shows a comparison between the experimental and simulation results on the load-displacement curves. In general, the computational curve agrees well with the experimental curve in terms of the shape as well as the magnitudes of loads and displacement values. The numerical peak and stable loads are 1.19 kN and 0.57 kN respectively with a relative difference of less than 1% compared to the experimental values. Such a tiny difference in experimental and numerically predicted values gives enough confidence that the computational model can predict the load-carrying capacity of the CFRP laminated composite under four-point bending load quite accurately.
Figure 21.
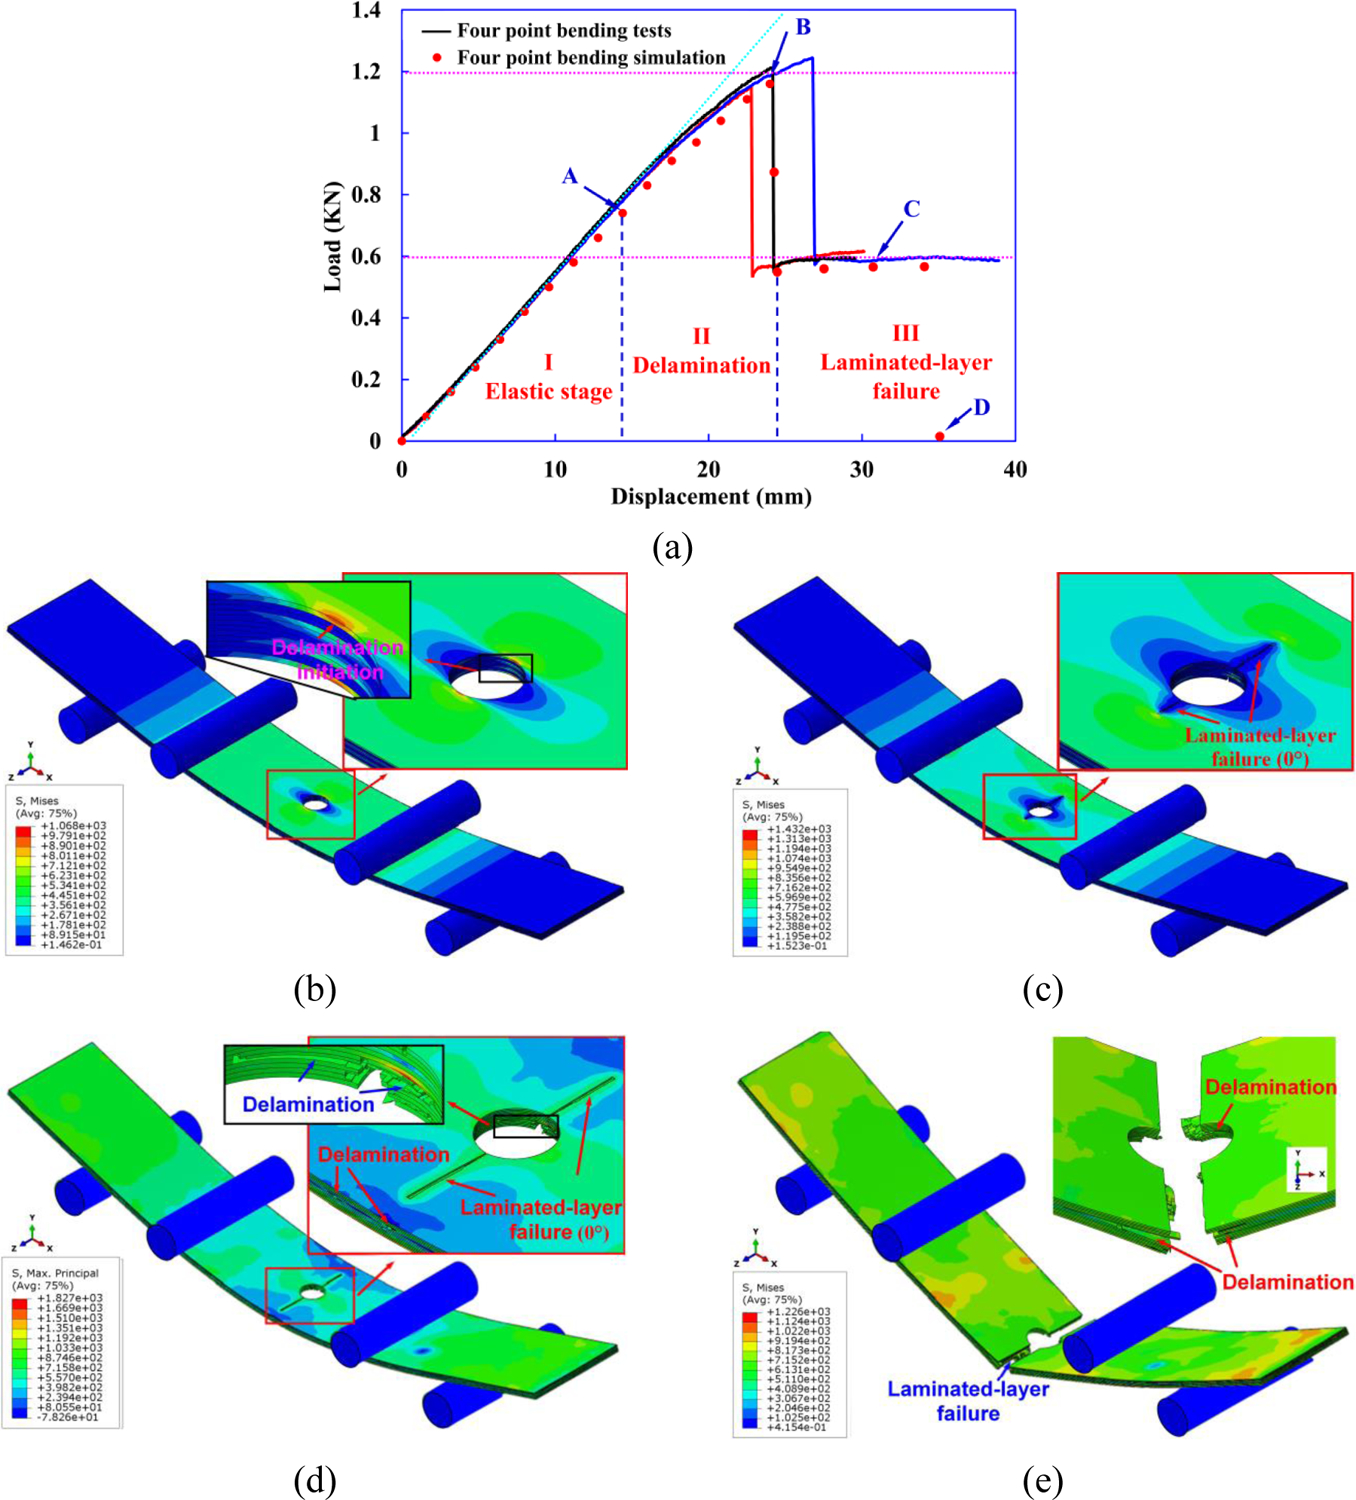
Multi-scale computational modeling results for the four-point bending; (a) comparison of computational and experimental force-displacement curves, and a sequence of predicted failure modes at different stages of load-displacement curve corresponding to points (b) A; (c) B; (d) C; and (e) D.
In addition, the multi-scale computational model is able to capture the sequence of damage initiation and propagation at different stages of load-displacement curve in the open-hole cross-ply laminates subjected to four-point bending load, as shown in Fig. 21(b)–(e). The initiation and propagation of delamination of interface between the adjacent layers as well as the final failure of CFRP laminated-layers is consistent with the experimental observations. Summarizing the multi-scale computational modeling results, we have the following key results:
Under the four-point bending load, delamination at the interface between the 0° and 90° plies first occurs at the vicinity of the hole where the stress concentration is the highest, which is made clear through an enlarged view of the hole area in the inset in Fig. 21(b).
With continued bending, the cracks in 0° layers at compressive bending side initiate around the poles of the hole when the compressive stress reaches the longitudinal compression strength of CFRP composites. This results in a dramatic load drop to half of the maximum load, as shown in Fig. 21(c).
Interfacial cracks between the 0° and 90° plies and the cracks of 0° layers at compressive bending side propagate through width direction, as shown in Fig. 21(d). During this period, the load bearing capacity of the open-hole cross-ply laminates remains stable.
Finally, severe delamination followed by a macroscopic crack initiation and propagation along the width direction in 0° layers on tensile side of the bending leads to ultimate failure of the open-hole cross-ply laminates, as shown in Fig. 21(e).
In summary, the whole failure process as predicted by the multi-scale model is in good agreement with what has been observed experimentally (Fig. 19). Furthermore, the multi-scale modeling framework enables a more comprehensive understanding of the damage mechanisms in the open-hole cross-ply laminates subjected to four-point bending load.
5. Conclusions
In this paper, an integrated experimental and computational effort has been demonstrated to enable a better understanding of the deformation and failure behavior of open-hole cross-ply CFRP composites under flexural loading conditions. First, two novel WTDCB and FRMMELS specimen geometries are proposed to characterize the mode-I fracture toughness and mixed-mode fracture toughness behavior of CFRP composite using the B-K fracture criterion. Since the proposed WTDCB specimen is generally insensitive to the crack length, the calculation of GIc has been greatly simplified. By comparing GIc obtained from WTDCB tests and the typical FWDCB tests, it is found that WTDCB specimen offers a more accurate and reliable means to determine GIc, as its geometry obviates the need to directly measure the crack tip location during tests. The FRMMELS specimen resembles not only pure mode-I WTDCB specimen, but also enables the calculation of GTc with a few modifications to introduce a mixture of mode-I and mode-II loading cases, which has also been shown to be independent of crack length. Moreover, FRMMELS sample contains a fixed mixed-mode GIIc/GTc ratio that depends on the width taper ratio k. A comparison between curve-fitted mixed-mode failure envelope of B-K criterion based on a set of test results from mode-I WTDCB, FWDCB, mode-II ENF, and MMB tests with experimental data obtained from FRMMELS tests also shows excellent agreement. This indicates that FRMMELS test offers a simple yet effective method to determine mixed-mode GTc and thereby B-K criterion mode mixity parameter.
In addition, the interfacial strength parameters Nn and Ss are calibrated based on computational modeling of WTDCB and ENF tests by matching the experimental results. Subsequently, the accuracy of calibrated interface strength parameters are validated by comparing the computational and experimental results of FRMMELS tests. Building upon the series of efforts, failure mechanisms prevalent in the open-hole cross-ply CFRP laminates subjected to four-point bending have been studied systematically using experimental and multi-scale computational analyses with the developed CZM model. The initiation and propagation of delamination, the failure of laminated layers, and the load-displacement curves predicted from computational analyses are all in good agreement with what have been observed experimentally.
In conclusion, we have presented a detailed analysis of deformation and failure characteristics of open-hole cross-ply laminates by combining experimental and computational investigations. The analyses and methods presented in this study would enable a new level of understanding of the damage mechanisms in the open-hole cross-ply laminates and would further offer certain effective solutions to the great challenge of delamination prediction for CFRP laminated composites used in structural applications.
Acknowledgments
The authors acknowledge support from the Ford Motor Company with funding from the U.S. Department of Energy’s Office of Energy Efficiency and Renewable Energy (EERE), under Award Number DE-EE0006867. In addition, Q. Sun would like to acknowledge support from the China Scholarship Council (CSC). Z. Meng would like to acknowledge startup funds from Clemson University and SC TRIMH support (P20 GM121342).
References
- [1].Vasiliev VV, Morozov EV. Advanced mechanics of composite materials and structures: Elsevier; 2018. [Google Scholar]
- [2].Tang H, Chen Z, Zhou G, Li Y, Avery K, Guo H, Kang H, Zeng D, Su X. Correlation between failure and local material property in chopped carbon fiber chip‐reinforced sheet molding compound composites under tensile load.Polymer Composites. 2019;40(S2):E962–E74. [Google Scholar]
- [3].Rybicki EF, Kanninen MF. A finite element calculation of stress intensity factors by a modified crack closure integral.Engineering fracture mechanics. 1977;9(4):931–8. [Google Scholar]
- [4].Sun Q, Guo H, Zhou G, Meng Z, Chen Z, Kang H, Keten S, Su X. Experimental and computational analysis of failure mechanisms in unidirectional carbon fiber reinforced polymer laminates under longitudinal compression loading.Composite Structures. 2018;203:335–48. [Google Scholar]
- [5].Sun Q, Zhou G, Guo H, Meng Z, Chen Z, Liu H, Kang H, Su X. Failure mechanisms of cross-ply carbon fiber reinforced polymer laminates under longitudinal compression with experimental and computational analyses.Composites Part B: Engineering. 2019;167:147–60. [Google Scholar]
- [6].Sun Q, Zhou G, Meng Z, Jain M, Su X. An integrated computational materials engineering framework to analyze the failure behaviors of carbon fiber reinforced polymer composites for lightweight vehicle applications.Composites science and technology. 2021;202:108560. [DOI] [PMC free article] [PubMed] [Google Scholar]
- [7].Sun Q, Zhou G, Tang H, Meng Z, Jain M, Su X, Han W. In-situ effect in cross-ply laminates under various loading conditions analyzed with hybrid macro/micro-scale computational models.Composite Structures. 2021;261:113592. [DOI] [PMC free article] [PubMed] [Google Scholar]
- [8].Tang H, Chen H, Sun Q, Chen Z, Yan W. Experimental and computational analysis of structure-property relationship in carbon fiber reinforced polymer composites fabricated by selective laser sintering.Composites Part B: Engineering. 2021;204:108499. [Google Scholar]
- [9].Zhou G, Sun Q, Meng Z, Li D, Peng Y, Zeng D, Su X. Experimental investigation on the effects of fabric architectures on mechanical and damage behaviors of carbon/epoxy woven composites.Composite structures. 2021;257:113366. [DOI] [PMC free article] [PubMed] [Google Scholar]
- [10].Zhou G, Sun Q, Li D, Meng Z, Peng Y, Zeng D, Su X. Effects of fabric architectures on mechanical and damage behaviors in carbon/epoxy woven composites under multiaxial stress states.Polymer Testing. 2020;90:106657. [Google Scholar]
- [11].Zhou G, Sun Q, Li D, Meng Z, Peng Y, Chen Z, Zeng D, Su X. Meso-scale modeling and damage analysis of carbon/epoxy woven fabric composite under in-plane tension and compression loadings.International journal of mechanical sciences. 2021;190:105980. [DOI] [PMC free article] [PubMed] [Google Scholar]
- [12].Zhou G, Sun Q, Fenner J, Li D, Zeng D, Su X, Peng Y. Crushing behaviors of unidirectional carbon fiber reinforced plastic composites under dynamic bending and axial crushing loading.International Journal of Impact Engineering. 2020;140:103539. [Google Scholar]
- [13].Sun Q, Meng Z, Zhou G, Lin S-P, Kang H, Keten S, Guo H, Su X. Multi-scale computational analysis of unidirectional carbon fiber reinforced polymer composites under various loading conditions.Composite Structures. 2018;196:30–43. [Google Scholar]
- [14].Williams J, Hadavinia H, Kinloch A. Cohesive zone models in the characterisation of toughness.Compos Sci Technol. 2005;3. [Google Scholar]
- [15].Heidari-Rarani M, Shokrieh M, Camanho P. Finite element modeling of mode I delamination growth in laminated DCB specimens with R-curve effects.Composites Part B: Engineering. 2013;45(1):897–903. [Google Scholar]
- [16].Tabiei A, Zhang W. Composite laminate delamination simulation and experiment: A review of recent development.Applied Mechanics Reviews. 2018;70(3). [Google Scholar]
- [17].Standard A. D5528, 01 (2007) e3,” Standard Test Method for Mode I Interlaminar Fracture Toughness of Unidirectional Fiber-Reinforced Polymer Matrix Composites.ASTM International. 2007. [Google Scholar]
- [18].Astm A d7905/d7905m-14, Standard Test Method for Determination of the Mode ii Interlaminar Fracture Toughness of Unidirectional Fiber-Reinforced Polymer Matrix Composites.ASTM International. [Google Scholar]
- [19].ASTM D. 6671–01, Standard Test Method for Mixed Mode I-Mode II Interlaminar Fracture Toughness of Unidirectional Fiber Reinforced Polymer Matrix Composites.Annual book of ASTM standards. 2001;15:03. [Google Scholar]
- [20].Marzi S, Rauh A, Hinterhölzl RM. Fracture mechanical investigations and cohesive zone failure modelling on automotive composites.Composite Structures. 2014;111:324–31. [Google Scholar]
- [21].Navarro P, Aubry J, Pascal F, Marguet S, Ferrero J-F, Dorival O. Influence of the stacking sequence and crack velocity on fracture toughness of woven composite laminates in mode I.Engineering Fracture Mechanics. 2014;131:340–8. [Google Scholar]
- [22].Brown E Use of the tapered double-cantilever beam geometry for fracture toughness measurements and its application to the quantification of self-healing.The Journal of Strain Analysis for Engineering Design. 2011;46(3):167–86. [Google Scholar]
- [23].Reeder JR, Crews JH Jr. Mixed-mode bending method for delamination testing.AiAA Journal. 1990;28(7):1270–6. [Google Scholar]
- [24].Binienda WK, Reddy E. Mixed-mode fracture in unidirectional graphite epoxy composite laminates with central notch.Journal of reinforced plastics and composites. 1992;11(3):324–38. [Google Scholar]
- [25].Sundararaman V, Davidson BD. An unsymmetric double cantilever beam test for interfacial fracture toughness determination.International journal of solids and structures. 1997;34(7):799–817. [Google Scholar]
- [26].Hong CS, Yoon S. Modified end notched flexure specimen for mixed mode interlaminar fracture in laminated composites.International Journal of Fracture. 1990;43:R3–R9. [Google Scholar]
- [27].Davidson BD, Sundararaman V. A single leg bending test for interfacial fracture toughness determination.International Journal of Fracture. 1996;78(2):193–210. [Google Scholar]
- [28].Feraboli P, Kedward K. Four-point bend interlaminar shear testing of uni-and multi-directional carbon/epoxy composite systems.Composites Part A: Applied Science and Manufacturing. 2003;34(12):1265–71. [Google Scholar]
- [29].Ayatollahi M, Aliha M. Analysis of a new specimen for mixed mode fracture tests on brittle materials.Engineering Fracture Mechanics. 2009;76(11):1563–73. [Google Scholar]
- [30].Lu X, Ridha M, Chen B, Tan V, Tay T. On cohesive element parameters and delamination modelling.Engineering Fracture Mechanics. 2019;206:278–96. [Google Scholar]
- [31].Sørensen BF, Jacobsen TK. Characterizing delamination of fibre composites by mixed mode cohesive laws.Composites science and technology. 2009;69(3–4):445–56. [Google Scholar]
- [32].De Morais A, Pereira A. Application of the effective crack method to mode I and mode II interlaminar fracture of carbon/epoxy unidirectional laminates.Composites Part A: Applied Science and Manufacturing. 2007;38(3):785–94. [Google Scholar]
- [33].Svensson D, Alfredsson KS, Biel A, Stigh U. Measurement of cohesive laws for interlaminar failure of CFRP.Composites science and technology. 2014;100:53–62. [Google Scholar]
- [34].Mingming G, Xiaoquan C, Qian Z. Compressive test and numerical simulation of center‐notched composite laminates with different crack configurations.Polymer Composites. 2017;38(12):2631–41. [Google Scholar]
- [35].Li X, Tan Z, Wang L, Zhang J, Xiao Z, Luo H. Experimental investigations of bolted, adhesively bonded and hybrid bolted/bonded single-lap joints in composite laminates.Materials Today Communications. 2020;24:101244. [Google Scholar]
- [36].Hallett SR, Green BG, Jiang W, Wisnom M. An experimental and numerical investigation into the damage mechanisms in notched composites.Composites Part A: Applied Science and Manufacturing. 2009;40(5):613–24. [Google Scholar]
- [37].Wang J, Callus P, Bannister M. Experimental and numerical investigation of the tension and compression strength of un-notched and notched quasi-isotropic laminates.Composite Structures. 2004;64(3–4):297–306. [Google Scholar]
- [38].Talib AA, Ramadhan A, Rafie AM, Zahari R. Influence of cut-out hole on multi-layer Kevlar-29/epoxy composite laminated plates.Materials & design. 2013;43:89–98. [Google Scholar]
- [39].Camanho PP, Maimí P, Dávila C. Prediction of size effects in notched laminates using continuum damage mechanics.Composites science and technology. 2007;67(13):2715–27. [Google Scholar]
- [40].Van der Meer F, Sluys L. Mesh-independent modeling of both distributed and discrete matrix cracking in interaction with delamination in composites.Engineering Fracture Mechanics. 2010;77(4):719–35. [Google Scholar]
- [41].Higuchi R, Okabe T, Nagashima T. Numerical simulation of progressive damage and failure in composite laminates using XFEM/CZM coupled approach.Composites Part A: Applied Science and Manufacturing. 2017;95:197–207. [Google Scholar]
- [42].Ridha M, Wang C, Chen B, Tay T. Modelling complex progressive failure in notched composite laminates with varying sizes and stacking sequences.Composites Part A: Applied Science and Manufacturing. 2014;58:16–23. [Google Scholar]
- [43].Su ZC, Tay TE, Ridha M, Chen B. Progressive damage modeling of open-hole composite laminates under compression.Composite Structures. 2015;122:507–17. [Google Scholar]
- [44].Falcó O, Ávila R, Tijs B, Lopes C. Modelling and simulation methodology for unidirectional composite laminates in a Virtual Test Lab framework.Composite Structures. 2018;190:137–59. [Google Scholar]
- [45].Hongkarnjanakul N, Bouvet C, Rivallant S. Validation of low velocity impact modelling on different stacking sequences of CFRP laminates and influence of fibre failure.Composite Structures. 2013;106:549–59. [Google Scholar]
- [46].Abir M, Tay T, Ridha M, Lee H. On the relationship between failure mechanism and compression after impact (CAI) strength in composites.Composite Structures. 2017;182:242–50. [Google Scholar]
- [47].Kenane M, Benzeggagh M. Mixed-mode delamination fracture toughness of unidirectional glass/epoxy composites under fatigue loading.Composites Science and Technology. 1997;57(5):597–605. [Google Scholar]
- [48].Liu C, Huang Y, Stout M. On the asymmetric yield surface of plastically orthotropic materials: a phenomenological study.Acta materialia. 1997;45(6):2397–406. [Google Scholar]
- [49].Sun Q, Zhou G, Meng Z, Guo H, Chen Z, Liu H, Kang H, Keten S, Su X. Failure criteria of unidirectional carbon fiber reinforced polymer composites informed by a computational micromechanics model.Composites Science and Technology. 2019;172:81–95. [Google Scholar]
- [50].Version A. 6.14 Documentation (Abaqus), 2014.Abaqus User’s Manual.
- [51].Bascom W, Jensen R, Bullman G, Hunston D. The width-tapered double cantilever beam for interlaminar fracture testing. 1984.
- [52].Yaniv G, Daniel IM, editors. Height-tapered double cantilever beam specimen for study of rate effects on fracture toughness of composites. Composite materials: testing and design (Eighth Conference); 1988: ASTM International. [Google Scholar]
- [53].Ghazali H, Ye L, Zhang MQ. Interlaminar fracture of CF/EP composite containing a dual-component microencapsulated self-healant.Composites Part A: Applied Science and Manufacturing. 2016;82:226–34. [Google Scholar]
- [54].Argüelles A, Viña J, Canteli A, Lopez A. Influence of the matrix type on the mode I fracture of carbon-epoxy composites under dynamic delamination.Experimental mechanics. 2011;51(3):293–301. [Google Scholar]
- [55].Joshi SC, Dikshit V. Enhancing interlaminar fracture characteristics of woven CFRP prepreg composites through CNT dispersion.Journal of Composite Materials. 2012;46(6):665–75. [Google Scholar]
- [56].Johnson WS, Mangalgiri P. Influence of the resin on interlaminar mixed-mode fracture. Toughened composites: ASTM International; 1987. [Google Scholar]
- [57].Kinloch A, Wang Y, Williams J, Yayla P. The mixed-mode delamination of fibre composite materials.Composites science and technology. 1993;47(3):225–37. [Google Scholar]
- [58].Pereira A, De Morais A. Mixed mode I+ II interlaminar fracture of carbon/epoxy laminates.Composites Part A: Applied Science and Manufacturing. 2008;39(2):322–33. [Google Scholar]
- [59].Blanco N, Gamstedt EK, Costa J, Trias D. Analysis of the mixed-mode end load split delamination test.Composite structures. 2006;76(1–2):14–20. [Google Scholar]
- [60].Standard A. D6671/D6671M (2006) Standard test method for mixed mode I-mode II interlaminar fracture toughness of unidirectional fiber reinforced polymer matrix composites.ASTM International, West Conshohocken, PA: doi. 2006;10:D6671_DM. [Google Scholar]
- [61].Dahlen C, Springer GS. Delamination growth in composites under cyclic loads.Journal of Composite Materials. 1994;28(8):732–81. [Google Scholar]
- [62].Wilkins D, Eisenmann J, Camin R, Margolis W, Benson R. Characterizing delamination growth in graphite-epoxy. Damage in Composite Materials: Basic Mechanisms, Accumulation, Tolerance, and Characterization: ASTM International; 1982. [Google Scholar]
- [63].Crews JH, Reeder JR. A mixed-mode bending apparatus for delamination testing. 1988.
- [64].Turon A, Camanho PP, Costa J, Dávila C. A damage model for the simulation of delamination in advanced composites under variable-mode loading.Mechanics of materials. 2006;38(11):1072–89. [Google Scholar]
- [65].Hart-Smith LJ. Bolted joint analyses for composite structures—Current empirical methods and future scientific prospects. Joining and Repair of Composite Structures: ASTM International; 2004. [Google Scholar]
- [66].Shi Y, Pinna C, Soutis C. Modelling impact damage in composite laminates: a simulation of intra-and inter-laminar cracking.Composite Structures. 2014;114:10–9. [Google Scholar]
- [67].Pinho ST. Modelling failure of laminated composites using physically-based failure models. 2005.
- [68].Hibbitt Karlsson, Sorensen. ABAQUS/Explicit: user’s manual: Hibbitt, Karlsson and Sorenson Incorporated; 2001. [Google Scholar]
- [69].Andersons J, König M. Dependence of fracture toughness of composite laminates on interface ply orientations and delamination growth direction.Composites Science and Technology. 2004;64(13–14):2139–52. [Google Scholar]
- [70].Olsson R, Thesken J, Brandt F, Jönsson N, Nilsson S. Investigations of delamination criticality and the transferability of growth criteria.Composite Structures. 1996;36(3–4):221–47. [Google Scholar]
- [71].De Moura M, Pereira A, De Morais A. Influence of intralaminar cracking on the apparent interlaminar mode I fracture toughness of cross‐ply laminates.Fatigue & fracture of engineering materials & structures. 2004;27(9):759–66. [Google Scholar]
- [72].Sebaey T, Blanco N, Costa J, Lopes C. Characterization of crack propagation in mode I delamination of multidirectional CFRP laminates.Composites Science and Technology. 2012;72(11):1251–6. [Google Scholar]
- [73].Shi Y, Hull D, Price J. Mode II fracture of+ θ/-θ angled laminate interfaces.Composites science and technology. 1993;47(2):173–84. [Google Scholar]
- [74].Lachaud F, Piquet R, Michel L, editors. Delamination in mode I and II of carbon fibre composite materials: fibre orientation influence. Proc 12th International Conference on Composite Materials, Paris, July; 1999. [Google Scholar]
- [75].Laksimi A, Benyahia AA, Benzeggagh M, Gong X-L. Initiation and bifurcation mechanisms of cracks in multi-directional laminates.Composites science and technology. 2000;60(4):597–604. [Google Scholar]
- [76].Gong Y, Zhang B, Zhao L, Zhang J, Hu N, Zhang C. R-curve behaviour of the mixed-mode I/II delamination in carbon/epoxy laminates with unidirectional and multidirectional interfaces.Composite Structures. 2019;223:110949. [Google Scholar]
- [77].Polaha J, Davidson B, Hudson R, Pieracci A. Effects of mode ratio, ply orientation and precracking on the delamination toughness of a laminated composite.Journal of Reinforced Plastics and Composites. 1996;15(2):141–73. [Google Scholar]
- [78].Laksimi A, Benzeggagh M, Jing G, Hecini M, Roelandt J. Mode I interlaminar fracture of symmetrical cross-ply composites.Composites science and technology. 1991;41(2):147–64. [Google Scholar]
- [79].Hwang J, Lee C, Hwang W. Effect of crack propagation directions on the interlaminar fracture toughness of carbon/epoxy composite materials.Applied Composite Materials. 2001;8(6):411–33. [Google Scholar]
- [80].Rubbrecht P, Verpoest I, editors. The development of two new test methods to determine the mode I and mode II fracture toughness for varying fibre orientation at the crack interface. Proc 38th International SAMPE Symposium and Exhibition 1993; 1993. [Google Scholar]
- [81].Laksimi A, Ahmed Benyahia A, L. Gong X, Benmedakhene S. Mode II delamination in±laminates: Analysis and optimisation.Advanced Composite Materials. 2000;9(3):207–21. [Google Scholar]
- [82].Trakas K, Kortschot MT. The relationship between critical strain energy release rate and fracture mode in multidirectional carbon-fiber/epoxy laminates. Composite Materials: Fatigue and Fracture (Sixth Volume): ASTM International; 1997. [Google Scholar]
- [83].Russel A, editor Factors affecting the interlaminar fracture energy of graphite/epoxy laminates. Proc 4th Int Conf on Composite Materials; 1982. [Google Scholar]


