

Summary
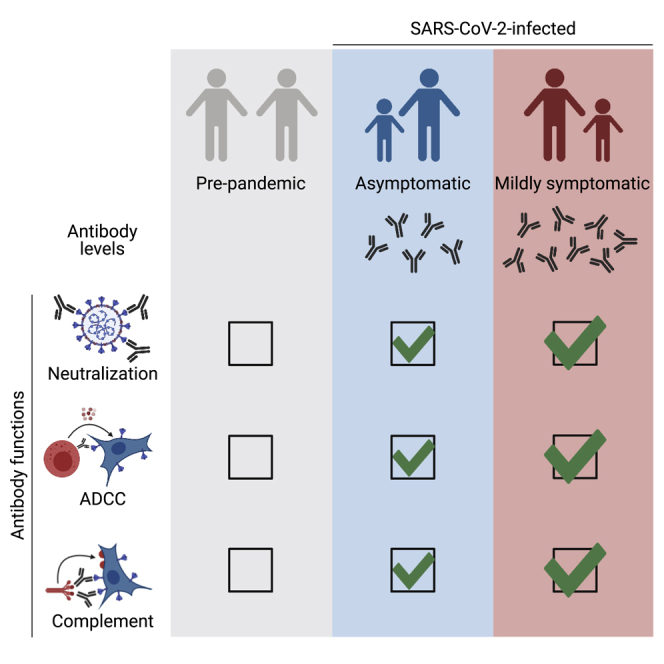
Many SARS-CoV-2-infected individuals remain asymptomatic. Little is known about the extent and quality of their antiviral humoral response. Here, we analyze antibody functions in 52 asymptomatic infected individuals, 119 mildly symptomatic, and 21 hospitalized patients with COVID-19. We measure anti-spike immunoglobulin G (IgG), IgA, and IgM levels with the S-Flow assay and map IgG-targeted epitopes with a Luminex assay. We also evaluate neutralization, complement deposition, and antibody-dependent cellular cytotoxicity (ADCC) using replication-competent SARS-CoV-2 or reporter cell systems. We show that COVID-19 sera mediate complement deposition and kill infected cells by ADCC. Sera from asymptomatic individuals neutralize the virus, activate ADCC, and trigger complement deposition. Antibody levels and functions are lower in asymptomatic individuals than they are in symptomatic cases. Antibody functions are correlated, regardless of disease severity. Longitudinal samplings show that antibody functions follow similar kinetics of induction and contraction. Overall, asymptomatic SARS-CoV-2 infection elicits polyfunctional antibodies neutralizing the virus and targeting infected cells.
Keywords: SARS-CoV-2, ADCC, complement, asymptomatic, antibody
Graphical abstract
Highlights
COVID-19 patient sera activate the complement system and kill infected cells by ADCC
Asymptomatic and symptomatic individuals harbor polyfunctional antibodies
Antibody levels and functions are slightly lower in asymptomatic individuals
Functions of anti-Spike antibodies have similar kinetics of induction and contraction
Dufloo et al. show that SARS-CoV-2 infection elicits antibodies that neutralize the virus, activate the complement system, and kill infected cells by ADCC. These polyfunctional antibodies are slightly more abundant in symptomatic COVID-19 patients than in asymptomatic individuals and correlate with disease severity.
Introduction
The severe acute respiratory syndrome coronavirus 2 (SARS-CoV-2) emerged in 2019 and became pandemic in 2020.1,2 SARS-CoV-2 is responsible for the coronavirus disease 2019 (COVID-19).3 As of March 27, 2021, almost 125 million individuals were infected, and 2.7 million have died of COVID-19. The rapid spread of the virus has overwhelmed health care organization in many areas. In the absence of prophylactic or therapeutic strategies, governments used non-pharmaceutical measures to decrease viral transmission.4 As restrictive policies were relaxed, many countries experienced new epidemic waves, demonstrating the necessity for population immunity, triggered either by infection or vaccination, to limit SARS-CoV-2 circulation. Therefore, the immune response induced by SARS-CoV-2 is under intense investigation, aiming at informing vaccine design, identifying correlates of protection, and determining the duration of protective immunity.
The outcome of SARS-CoV-2 infection is highly variable, ranging from asymptomatic disease to life-threatening, acute respiratory distress syndrome.5,6 About one half of infected individuals remain asymptomatic.7,8 Males, the elderly, and people suffering from diabetes, obesity, and cardiovascular diseases have an increased risk of admission to intensive care units (ICUs) and death.6,9 Severe COVID-19 is due to immunological dysfunctions, including impaired type I interferon response,10, 11, 12, 13 increased inflammation,14, 15, 16 complement activation,17 and endothelial stress.18 Because of this over-activation of the immune system and prolonged antigenic exposure, survivors of severe COVID-19 display a strong immune memory to the virus, as determined by antibody titers and CD4+ T cell re-stimulation.19,20 Mild and asymptomatic infections induce seroconversion and production of neutralizing antibodies,21,22 but titers are lower in asymptomatic individuals (ASs).22 Whether such responses are protective is unknown. A deeper understanding of the immune response after asymptomatic SARS-CoV-2 infection is needed.
The spike protein of SARS-CoV-2 is responsible for viral entry by interacting with the angiotensin-converting enzyme 2 (ACE2) receptor.23 It is a class I fusion protein, which requires proteolytic cleavage for activation. The two subunits S1 and S2 assemble into a trimer of heterodimers to form the mature spike.24 The S1 subunit has “closed” and “open” conformations, the latter exposing the receptor binding domain (RBD), the main target of neutralizing antibodies.25, 26, 27, 28 The spike protein is exposed at the surface of viral particles and infected cells,29 making them sensitive to antibody targeting. Antiviral activities of antibodies are not restricted to neutralization of viral particles. Infected cells covered by antibodies can be eliminated through various mechanisms, including antibody-dependent cellular cytotoxicity (ADCC) and complement-dependent cytotoxicity (CDC).30, 31, 32, 33, 34 Those activities rely on the fragment crystallizable (Fc) domain of antibodies and cognate Fc receptors (FcR).35 Fc-effector functions are necessary for optimal efficacy of antibodies in both therapeutic and prophylactic settings.36, 37, 38 The capacity of antibodies to elicit Fc-effector functions is governed by antibody specificity, isotypes, and glycosylation.39 Thus, Fc-mediated antiviral activities cannot be predicted from binding and neutralization data and require functional evaluation. Fc-effector functions in SARS-CoV-2 infection remain understudied. Antibodies in sera from critical COVID-19 patients form immune complexes that can trigger natural killer (NK) cell activation and complement deposition.40 Induction of afucosylated IgG anti-spike antibodies with increased Fc binding capacity correlates with the severity of COVID-19.41 However, whether polyfunctional antibodies are induced during asymptomatic COVID-19 disease and whether they can eliminate infected cells remain unknown.
Here, we established cellular assays to evaluate ADCC and complement activities of sera from COVID-19 patients with different disease severities. We combined these assays with measurements of antibody titers and neutralization. Altogether, our results indicate that SARS-CoV-2 asymptomatic infection induces a polyfunctional antibody response.
Results
Sera from COVID-19 patients activate the complement
We first determined whether antibodies from COVID-19 patients activate the complement after binding to SARS-CoV-2-infected cells. We used the lung epithelial cell line A549 expressing ACE2 (A549-ACE2 cells) as target cells.29 Cells were infected with SARS-CoV-2 at a multiplicity of infection (MOI) of 1. After 24 h, cells were incubated with heat-inactivated (HI) serum from either pre-pandemic or COVID-19 individuals as a source of antibodies (dilution 1:100). We selected a panel of 11 sera from symptomatic (n = 9) or asymptomatic (n = 2) SARS-CoV-2-infected individuals identified in two previous sero-epidemiological studies42,43 (Table S2). Sera sampled before 2019 (pre-pandemic samples) were used as controls (n = 12). The source of complement was normal human serum (NHS) (dilution 1:2). Heat-inactivated human serum (HIHS) was used as a control (Figure 1A). After 4 h of incubation, cells were stained with anti-C3b/iC3b and anti-spike antibodies to examine complement deposition and SARS-CoV-2 infection, respectively. C3b/iC3b deposition (hereafter, referred to as C3 deposition) was measured in spike+ cells. As shown in one representative experiment (Figure 1B), we did not observe C3 deposition in the absence of antibodies or with a pre-pandemic serum. In contrast, with a COVID-19 serum, C3 deposition occurred on 79% of infected cells (Figure 1B). To calculate a cutoff of positivity, we determined the mean signal of the 12 pre-pandemic sera and added 3 standard deviations (SD) (Figures 1C and S1A). All but one COVID-19 serum displayed C3b deposition above that cutoff (p < 0.0001; Mann-Whitney test) (Figures 1C and S1A). No C3 deposition was observed with HIHS (Figures 1B and S1B). Despite C3 deposition, we did not observe killing (complement-dependent cytotoxicity [CDC]) of infected cells (Figures 1D and S1C). We then performed a dose-response analysis of the three COVID-19 individuals with the highest activity (Figure S1D). That analysis revealed an efficient complement activation at high serum dilution (effective dilution 50%[ED50] up to 1,151) and complete lack of activity in pre-pandemic samples (ED50 < 100). We also used U2OS-ACE2-GFPsplit cells (also termed S-Fuse cells).29 This reporter cell line allows quantification and live imaging of SARS-CoV-2 replication by measuring the formation of GFP+ syncytia upon infection. Similarly, we detected complement deposition, but no CDC of S-Fuse-infected cells (not shown).
Figure 1.

COVID-19 sera activate the complement
(A) Schematic of the complement activation test on infected cells.
(B) Complement deposition on infected cells was measured after culture with or without a control or a COVID-19 serum in presence of normal (NHS) or heat-inactivated (HIHS) human serum. One representative experiment is shown. Percentages indicate the proportion of C3+ cells among infected (spike+) cells.
(C) Complement deposition with pre-pandemic (n = 12) and COVID-19 patients’ (n = 11) sera. The percentage of C3+ cells among infected cells is represented. Each dot represents the mean of three independent experiments for one serum donor.
(D) Complement-dependent cytotoxicity (CDC) of infected cells was calculated as the relative disappearance of spike+ cells in the NHS compared with HIHS condition, with pre-pandemic (n = 12) and COVID-19 patients’ (n = 11) sera. Each dot represents the mean of three independent experiments.
(E) Schematic of the complement activation test on Raji-spike cells.
(F) Raji-spike cells were cultured with sera from pre-pandemic individuals (n = 12) or COVID-19 patients (n = 11) and serum from a healthy individual as a source of complement. Each dot represents a different serum.
(G) Correlation of the C3 deposition on A549-ACE2-infected cells and CDC of Raji-spike cells induced by sera from pre-pandemic individuals (gray, n = 12) and COVID-19 patients (blue or red, n = 11). Correlation r and p values were calculated using a Spearman correlation test.
The dotted line indicates the threshold calculated with pre-pandemic sera. Blue: asymptomatic individuals; red: symptomatic patients. In (C), (D), and (F), the bar indicates the mean and a Mann-Whitney test was performed ns, not significant; ∗∗∗∗p < 0.0001. See also Figure S1 and Tables S1 and S2.
To evaluate the contribution of anti-spike antibodies to complement deposition, we engineered Raji cells expressing the spike protein. We chose Raji cells because they lack CD59, a potent CDC inhibitor.30 Raji-spike cells were incubated with HI serum from either pre-pandemic or convalescent COVID-19 individuals (dilution 1:33), and NHS as a source of complement (dilution 1:2). After 24 h, cell death was assessed using a viability dye (Figure 1E). COVID-19 sera displayed CDC activity above the threshold determined by the pre-pandemic sera (p < 0.0001; Mann-Whitney test) (Figure 1F). The CDC activity on Raji-spike cells positively correlated with C3 deposition on A549-ACE2-infected cells (r = 0.91, p < 0.0001; Spearman correlation) (Figure 1G).
Sera from COVID-19 patients trigger ADCC
We then assessed the ADCC activity of sera from COVID-19 patients. To visualize ADCC, we used SARS-CoV-2-infected S-Fuse cells as targets.29 S-Fuse cells were infected for 18 h with SARS-CoV-2 at a MOI of 0.1 and incubated with heterologous primary NK cells (ratio 1:1) in the presence or absence of serum (dilution 1:100). After 4 h of co-culture, the area of infected (GFP+) cells was quantified using an automated microscope (Figure 2A). GFP+ syncytia that formed after infection were readily visible (Figure 2B). Adding NK cells (ratio 1:1) decreased the GFP area to an extent similar to the “no serum” and “pre-pandemic serum” conditions, likely because of basal cytotoxic activity of NK cells against infected cells, independently of antibodies (Figure 2B). The GFP signal almost completely disappeared in the presence of a convalescent COVID-19 serum (Figure 2B), demonstrating an induction of ADCC by NK cells. Of note, A549-ACE2-infected cells were not sensitive to ADCC (not shown). We, thus, used S-Fuse cells to interrogate our panel of COVID-19 sera (n = 11; nine symptomatic and two ASs) and pre-pandemic samples (n = 13) using six donors of NK cells (Figure 2C). We calculated the extent of GFP elimination triggered by each serum in comparison to the condition with NK cells and no serum. The six NK donors were active in this test, with variations in their efficacy (Figure S2A). The mean value of pre-epidemic samples was used to determine a threshold of positivity (mean + 3 SD). Using this method, 10 of the 11 tested COVID-19 sera displayed ADCC activity (p < 0.0001; Mann-Whitney test) (Figure 2C). Titration of the three COVID-19 individuals with the highest activity showed efficient ADCC activity at high serum dilution (ED50 up to 6,330) and a lack of activity in pre-pandemic samples (ED50 < 100) (Figure S2B). Importantly, sera from either COVID-19 patient (n = 10) or pre-pandemic individual (n = 15) cells did not display any killing activity in the absence of NK cells (Figure S2C). Variations in the ratio of NK cells to target cells affected the spontaneous killing of NK cells. We did not detect an elimination of infected cells at a 1:3 (NK to target) ratio and only a slight spontaneous killing at a 1:1 ratio (Figure S2D). Serum-specific ADCC activity was maximal at a 1:1 ratio and started to decrease at a 1:10 NK-cells-to-target-cells ratio (Figure S2E).
Figure 2.

COVID-19 sera trigger antibody-dependent cellular cytotoxicity by NK cells
(A) Schematic of the ADCC test on infected cells.
(B) Representative images of the ADCC assay. Infected cells created GFP+ syncytia (green). Nuclei were stained with Hoechst (blue). Scale bar: 400 μm.
(C) Quantification of the ADCC triggered by pre-pandemic (n = 13) or COVID-19 (n = 11) sera. Each dot represents the mean of six donors of NK cells for one serum donor.
(D) The survival of infected cells was followed by live imaging without NK cells (green, n = 22) or with NK cells and no serum (black, n = 18), a pre-pandemic serum (gray, n = 18) or a COVID-19 serum (red, n = 20). Results from two independent experiments are represented. Log-rank (Mantel-Cox) test; ∗∗∗∗p < 0.0001.
(E) Time-lapse of the ADCC of an infected cell by a NK cell in the presence of a COVID-19 serum. GFP indicates infected cells. PI was added to monitor cell death in red. The NK cell that contacts the infected cell is indicated with the arrowhead. Scale bar: 30 μm.
(F) Schematic of the CD16 activation test.
(G) Raji-spike cells were co-cultured with Jurkat-CD16-NFAT-rLuc in presence of pre-pandemic (n = 13) or COVID-19 (n = 11) sera for 18 h. The ADCC score was measured as the fold increase of luciferase expression over the “no serum” condition.
(H) Correlation of the ADCC and the NFAT test score ED50 with sera from pre-pandemic individuals (gray, n = 13) and COVID-19 patients (blue or red, n = 11). Correlation r and p values were calculated using a Spearman correlation test.
Blue: asymptomatic individuals; red: symptomatic patients. Dotted line: positivity threshold calculated with pre-pandemic sera. In (C) and (G), the bar indicates the mean, and a Mann-Whitney test was performed. ∗∗∗∗p < 0.0001. See also Figure S2 and Tables S1 and S2.
We then performed video-microscopy experiments to determine whether the decrease in GFP was due to the killing of infected cells. SARS-CoV-2-infected S-Fuse cells were cultivated with NK cells and COVID-19 or pre-pandemic sera. Propidium iodide (PI) was added to the culture medium to monitor cell death. The infected GFP+ cells were tracked, and their viability was determined (Figure 2D). After 4 h of co-culture, 100% of infected cells were killed when NK cells and COVID-19 serum were present (Figure 2D). NK cells alone or with a pre-pandemic serum reduced S-Fuse viability to a lesser extent (p < 0.0001; log-rang Mantel-Cox test) (Figure 2D). Analysis of the videos revealed that NK cells established contacts with infected cells before death (Figure 2E; Video S1). These results show that sera from COVID-19 patients kill SARS-CoV-2-infected cell by ADCC.
The syncytia appear in green (GFP). PI was added to monitor cell death and appears in red. The NK cell that comes and contacts the infected cell is indicated with a white arrowhead. Time post addition of NK cells and serum is indicated. Scale bar: 30 μm.
We also used Raji-spike cells and Jurkat-CD16-NFAT-rLuc reporter cells as a simple assay to evaluate ADCC of COVID-19 sera. This system measures the capacity of a serum to activate NFAT through CD16 (the pathway initiating ADCC in NK cells) in the presence of antigen-expressing target cells (Figure 2F). The convalescent sera activated CD16 above the threshold calculated with the pre-pandemic samples (p < 0.0001; Mann-Whitney test) (Figure 2G). The extent of CD16 activation correlated to ADCC activity against S-Fuse-infected cells, suggesting that anti-spike antibodies contribute to the killing of infected cells (r = 0.77, p < 0.0001; Spearman correlation) (Figure 2H).
Overall, these data show that sera from SARS-CoV-2-infected individuals harbor polyfunctional antibodies triggering complement deposition and ADCC. NK cells eliminate infected cells in the presence of specific antibodies, whereas complement activation is non-lytic, at least in the cell lines tested here.
Antibody responses in asymptomatic and mild COVID-19 individuals
We then took advantage of two sero-epidemiological studies conducted in a high school and in primary schools, respectively,42,43 to determine whether sera of COVID-19 ASs and symptomatic individuals (Ss) differ in their ability to trigger ADCC and complement deposition. In the first cohort, we identified a group of 21 seropositive individuals, who did not report any symptoms (ASs) (Table S2). As a control, we randomly selected seropositive individuals who reported at least one symptom (Ss; n = 76 among 137). These individuals suffered from a mild disease because none required external oxygen supplementation or hospitalization. The symptomatic group reported their first symptoms on average 45 days before blood sampling. ASs were younger than Ss (16 versus 30 years old; Table S2).
With the sera from these 97 individuals, we first measured the presence of antibodies binding the spike, at a 1:300 dilution (Figure 3A). We adapted our S-Flow assay, which allows sensitive and quantitative assessment of anti-spike IgG by flow cytometry,19 to measure IgA and IgM (Figure 3A). Consistent with our prior identification as being seropositive, ASs and Ss harbored IgG antibodies, as determined by a percentage of spike+ cells above the cutoff of 20% (Figure 3A). The frequency of IgA+ and IgM+ cells tended to be lower in ASs with no significant differences (Figure 3A). We did not observe differences by analyzing the intensity of binding for individuals positive for IgG, IgA, and IgM (Figure S3A). We, then, measured IgG binding titers by serial dilutions. Titration curves of ASs were lower than those of Ss (Figure 3B). ED50 were significantly lower in ASs (p = 0.018; Mann-Whitney test) (Figure 3B). Because the spike protein contains multiple epitopes,27 we used a Luminex assay to map anti-S1, anti-S2, anti-RBD, and anti-spike IgGs (Figure 3C). We also included the N protein (Figure 3C), as well as antigens from hCoV-229E and hCoV-NL63 and from adenovirus 40, influenza A, mumps, and rubella viruses, to assess pre-existing immunity to human seasonal coronaviruses and other viruses (Figures S3B–S3D). The overall response to S1, S2, RBD, spike, and N antigens tended to be lower in ASs than in Ss, albeit not significantly (Figures 3C and S3B). We did not observe differences between ASs and Ss in the IgG response to hCoV-229E and NL63 (Figure S3C). The response to the antigens from the other viruses was similar between the two groups, except for influenza A, likely reflecting the age difference (p = 0.001; Mann-Whitney test) (Figures S3D and S3E). Altogether, these data show that the intensity of the antibody response specific to SARS-CoV-2 is slightly lower in asymptomatic than it is in mildly symptomatic individuals.
Figure 3.

Antibody response to SARS-CoV-2 in sera of asymptomatic and mildly symptomatic COVID-19 individuals
(A) IgG (left), IgA (middle), and IgM (right) levels were quantified in asymptomatic (AS; blue; n = 21) and mildly symptomatic (S; red; n = 76) individuals using the flow-cytometry-based S-Flow assay. The percentage of positive cells is represented. Dotted line: positivity threshold measured with pre-pandemic sera.
(B) Dose-response analysis of anti-spike IgG response in AS (blue; n = 21) and S (red; n = 76) patients measured with the S-Flow assay. Left panel: the mean binding percentage at each serum dilution is represented with the 95% confidence interval. Right panel: the antibody titers (half-maximal effective dose [ED50]) of each individual are represented.
(C) Luminex analysis of the antibody response against receptor binding domain (RBD), S1 and S2 subdomains of the spike, the full spike, and nucleoprotein (NP) for AS (blue line; n = 21) and S (red line; n = 76) sera. The median of MFI for AS and S sera are represented.
In (A) and (B), a Mann-Whitney test was performed (∗p < 0.05), and the bar indicates the median. See also Figure S3 and Table S2.
To further document the function of anti-SARS-CoV-2 antibodies, we measured the capacity of sera to neutralize lentiviral spike pseudotypes in 293T-ACE2 cells (pseudo-neutralization)19 and SARS-CoV-2 virus in S-Fuse cells (neutralization).29 We also quantified complement deposition and ADCC activities using the two Raji-spike-based assays. Sera were interrogated with serial dilutions to calculate exact titers for those four functions. Most of the sera from ASs and Ss were active in these assays (Figure 4). Sera from ASs display titers slightly below those from Ss (Figure 4A). The differences in half-maximal inhibitory dilution (ID50) were, however, not significant (Figure 4B). We also compared the maximal level of the response (Figure 4C). The level of antibody-mediated complement activation was significantly higher in Ss than it was in ASs (p = 0.036; Mann-Whitney test) (Figure 4C).
Figure 4.

Functional characterization of the sera from COVID-19 individuals
(A) AS (blue; n = 21) and S (red; n = 76) sera were tested with serial dilutions for their ability to neutralize Spike pseudoparticles, neutralize SARS-CoV-2, trigger ADCC in the Jurkat-CD16-NFAT-rLuc/Raji-spike system, or induce CDC of Raji-spike cells. The mean activity at each serum dilution and the 95% confidence interval are depicted.
(B) The half-maximal inhibitory dilution (ID50) of pseudoneutralization and neutralization, and the ED50 of ADCC and CDC induction are depicted. AS (blue; n = 21) and S (red; n = 76) groups are compared.
(C) The maximum activity of each assay is compared for AS (blue; n = 21) and S (red; n = 76) individuals.
∗p < 0.05 (Mann-Whitney test). Dotted lines: positivity threshold measured with pre-pandemic sera. Bars indicate median. See also Table S2.
Altogether, our data show that sera of SARS-CoV-2-infected individuals harbor polyfunctional antibodies. ASs have a decreased capacity to activate the complement and have lower IgG titers.
Correlations between antibody antiviral activities
We, then, sought to perform an unsupervised analysis of antibody features measured in Ss and ASs. We first created correlation matrices of antibody characteristics in each group (Figure 5A). The response to antigens from other viruses and hCoV did not correlate to SARS-CoV-2-related antibody properties. The features corresponding to SARS-CoV-2 appeared positively correlated in both groups. Anti-influenza A IgG measured by Luminex negatively correlated with some SARS-CoV-2 features in ASs, but correlation coefficients remained low. ADCC ED50 and maximum activity more strongly correlated to other features in ASs compared with Ss. The IgM-associated features (IgM mean fluorescent intensity [MFI] and IgM%) appeared more strongly correlated to other features in the S group (Figure 5A). Altogether, this analysis reveals slight differences in ADCC and IgM responses between AS and S groups, with an overall high level of coordination in each group. Consistently, principal component analysis (PCA) failed to separate individuals according to their symptoms, showing that no combination of antibody features allowed a strict segregation of the two groups (Figure 5B). This observation was confirmed by unsupervised hierarchical clustering (Figure S4).
Figure 5.

Similarity of antibody response in asymptomatic and symptomatic individuals
(A) Pearson correlation matrix of features assessed in asymptomatic (top) and symptomatic (bottom) individuals. Only statistically significant correlations (p < 0.05) are depicted. Antibody features are alphabetically clustered. The size and color of the dots correspond to the Pearson correlation r values.
(B) Principal component analysis of asymptomatic (blue; n = 21) and symptomatic (red; n = 70) patients. Each point represents a single patient. The ellipses indicate the Student’s t-distribution with 95% probability. See also Figure S4 and Table S2.
Overall, this unsupervised analysis shows that the antibody response to SARS-CoV-2 is coordinated in AS and S groups, with differences in ADCC and IgM responses.
Antibody response to SARS-CoV-2 in other groups of asymptomatic, symptomatic, and hospitalized individuals
To further characterize the functionality of antibodies in patients with COVID-19, we analyzed a second cohort established in primary schools of Crépy-en-Valois, France (n = 1340; Fontanet et al.;43 Table S3). We chose to analyze this second group of ASs separately to ensure that the Ss used in the comparisons were infected during the same epidemic wave in order to compensate for a lack of the date of infection for ASs. This cohort included a large proportion of children (6–11 years old). We selected all ASs (n = 31) and formed a group of gender- and age-matched, mildly symptomatic individuals (Ss; n = 43 among the 107 of the cohort) (Figure S5A). We also included COVID-19-hospitalized individuals (Hs) from the French COVID cohort (n = 21). As expected, when compared to ASs and Ss, hospitalized patients were older, more often male, and were sampled sooner after the onset of symptoms (Table S4; Figure S5B).
We assessed the anti-spike antibody profile by S-Flow in the 95 individuals forming these three groups (AS, S, and H) (Figure 6A). Frequencies of IgG, IgA, and IgM were significantly greater in hospitalized patients than they were in ASs (p = 0.0101, p < 0.0001, and p < 0.0001, respectively; Kruskal-Wallis test). When compared to Ss, hospitalized patients harbored significantly more IgA and IgM (p = 0.0002 and p < 0.0001, respectively; Kruskal-Wallis test) (Figure 6A). Measuring the MFI of binding of IgG+, IgA+, and IgM+ individuals showed greater IgG response in hospitalized patients compared with ASs and higher IgA response compared with Ss (Figure S6A). We also performed a restricted analysis to compare only ASs and Ss. The frequency of IgA+ and IgM+ cells and the MFI of IgG+ cells were significantly higher in Ss (p = 0.0007, p = 0.014, p = 0.018, respectively; Mann-Whitney test) (Figure S6B).
Figure 6.

Similarity of antibody response in other groups of asymptomatic, symptomatic, and hospitalized individuals
(A) IgG (left), IgA (middle), and IgM (right) levels were quantified in ASs (n = 31), Ss (n = 43), and Hs (n = 21) using the S-Flow assay. The percentage of positive cells is represented.
(B) AS (n = 31), S (n = 43), and H (n = 21) sera were tested for their ability to neutralize spike pseudoparticles (left), trigger ADCC in the Jurkat-CD16-NFAT-rLuc/Raji-spike system (middle), or trigger CDC of Raji-spike cells (right).
(C) Principal component analysis of asymptomatic (blue; n = 31), symptomatic (red; n = 43), and hospitalized (brown; n = 21) patients. Each point represents a single patient. The ellipses indicate the Student’s t-distribution with 95% probability for each group.
Dotted lines: positivity threshold measured with pre-pandemic sera; bars are median. In (A) and (B), a Kruskal-Wallis test was performed; ∗p < 0.05, ∗∗∗p < 0.001, ∗∗∗∗p < 0.0001. See also Figures S5–S7 and Tables S3 and S4.
We then measured pseudo-neutralization, ADCC, and complement deposition capacity of the 95 sera. Antibody functions paralleled that of antibody binding, with the highest and lowest activities in hospitalized and ASs, respectively (Figure 6B). Mildly symptomatic individuals scored between Hs and ASs (Figure 6B). Ss resembled ASs for the level of ADCC, with a lower activity than Hs (p < 0.0001; Kruskal-Wallis test), but were similar to Hs for complement deposition (Figure 6B). Interestingly, neutralization, CDC, ADCC, and anti-S IgG were significantly higher in Hs who survived when compared to fatal COVID-19 cases (Figure S6C).
To further characterize the anti-spike response across these three groups, we performed unsupervised PCA analysis, which included the nine antibody features. ASs and Ss clustered together as previously observed in the first groups. In contrast, Hs appeared divergent, with most individuals clustering apart on the first component (PC-1) (Figure 6C). The contributions of the nine features to PC-1 ranged from 8% to 14%, indicating that Hs had an overall higher response, rather than an increase in a limited set of features (Figure S6D).
We then mixed the different groups of individuals that we had analyzed separately to increase the power of our statistical tests. We, thus, compared the antibody response of all ASs and Ss (n = 52 and n = 119, respectively) (Figures S7A–S7C). Frequencies of IgG, IgA, and IgM were significantly lower in ASs than they were in Ss. Moreover, the MFI of IgG binding, as well as neutralization and complement activities, was significantly lower in ASs than they were in Ss. ADCC activity was also lower but did not reach significance. Correlation between age and antibody levels revealed a positive association for IgG, IgA, and IgM in Ss (Figure S7D).
The results that ASs harbor a polyfunctional anti-spike antibody response that is lower than it is Ss were thus confirmed in a second group of infected persons. Our results also show that our group of Hs, who were sampled earlier, were older, and were more often male, displayed the highest levels of antibodies and functions.
Kinetics of antibody functions after SARS-CoV-2 infection
We then aimed at determining the dynamics of antibody functions after SARS-CoV-2 infection. We identified seven hospitalized patients and 22 mildly symptomatic COVID-19 cases with longitudinal sampling in our cohorts. Because only symptomatic individuals were invited for a second sampling in our sero-epidemiological studies, no longitudinal samples were available for ASs. Hospitalized patients had the highest temporal resolution and were sampled early after the onset of symptoms, with up to eight samples per individual, from days 6 to 23 after symptom onset (Figure S5B). We, thus, documented the induction of the polyfunctional response in these hospitalized patients (Figure 7A). Mildly symptomatic individuals were sampled twice, with an interval of 25–29 days. The first sampling was usually performed 21 days after onset of symptoms. The mildly symptomatic individuals allowed us to assess the contraction of the immune responses (Figure 7B). We measured IgG, IgA, and IgM levels; ADCC; complement deposition; and neutralization or pseudo-neutralization in the longitudinal samples available.
Figure 7.

Kinetics of antibody functions in acute hospitalized patients and convalescent mildly symptomatic individuals
(A) Hospitalized patients (n = 7) in the acute phase were sampled at several times after symptom onset. Their IgG (top left), IgM (top middle), and IgA (top right) levels were assessed longitudinally. CDC (bottom left), ADCC (bottom middle), and pseudoneutralization (bottom right) were also measured. The red curve represents a non-linear fit (four parameters) of the mean of all donors. The average fit of each function is also depicted (right panel).
(B) Sera from mildly symptomatic patients in the convalescent phase (n = 21–22) were sampled twice at a 25–29-day interval. ADCC (top left), IgG (top right), pseudoneutralization (middle left), real-virus neutralization (middle right), and CDC (bottom left) levels were measured with serial dilutions. For each assay, the ED50 is represented against the day after symptom onset on the left graph. On the right graph, data for first and second samplings were pooled. ∗p < 0.05, ∗∗p < 0.01, ns, not significant (Wilcoxon test).
See also Table S4.
In hospitalized patients, all functions, except complement deposition, were induced simultaneously between 6 and 23 days after onset of symptoms (Figure 7A). This delay may reflect a lower sensitivity of the assay, a slower appearance of complement-potent antibodies, or a requirement for high antibody titers to trigger this activity.
In mildly symptomatic individuals, we observed a significant decrease in antibody binding titers, their neutralization, and their ADCC function over time (p = 0.011, p = 0.001, p = 0.001, respectively; Wilcoxon test) (Figure 7B). A decline of complement deposition activity was also visible over time, but that was not significant.
Discussion
In this study, we show that ASs mount a polyfunctional anti-SARS-CoV-2 humoral response. Our results confirm and extend reports of decreased antibody titers in ASs,22,44 in which Fc-associated antibody functions were not analyzed. The levels of antibodies are lower in ASs, and, therefore, their neutralizing activity and Fc-mediated functions are also reduced. The differences are, however, modest and not always significant. Our results were consistent across two cohorts, despite minor differences, such as lower IgA and IgM levels in ASs in the second cohort, when compared to the first one. These differences might be attributed to various sampling times after onset of symptoms and to age variations. Indeed, the two serological investigations were not conducted at the same time, explaining the difference in the average time after symptom onset. This is the reason why we chose to keep the analyses separated, to avoid comparing ASs to Ss infected in different epidemic waves. However, combining ASs and Ss from the two cohorts provided comparable results, albeit differences were more significant, probably because of an increased statistical power.
We also observed that Hs display high levels of anti-SARS-CoV-2-specific antibodies. However, our group of Hs was sampled earlier, was older, and was more often male than our groups of Ss and ASs. Interestingly, it has been reported that antibody binding and neutralization are higher in severe and critical cases.19,20,28,45 This suggests that disease severity drives the increase in antibody levels and functionality, as reported by others.46,47 The future investigation of antibody functions in age- and gender-matched groups will uncover the contribution of those parameters to the immune response to SARS-CoV-2. We further show that complement deposition and ADCC activities are also elevated in hospitalized patients. An increase in soluble C5a levels proportional to COVID-19 severity and high levels of C5aR1 expression in blood and pulmonary myeloid cells have been reported.17 The origin of the activation of the C5a-C5aR1 axis in severe COVID-19 remains unknown.48 Whether antibody-mediated complement activation at the surface of infected cells participates in disease severity deserves further investigation.
It is noteworthy that the neutralizing activity of antibodies correlates with their ability to mediate complement deposition and ADCC, irrespective of the severity of the disease. A pilot longitudinal analysis performed in some of the hospitalized patients further demonstrated that the acquisition of the different functions similarly increased overtime. The ability to trigger complement deposition was, however, delayed by 1 week, compared with ADCC and neutralization. This may be due to a lower sensitivity of our complement test or to the fact that complement deposition requires higher antibody titers than the other functions. By analyzing mildly symptomatic patients at two time points, sampled up to 70 days after symptom onset, we also observed a decline in antibody levels and functions. A recent pre-print suggests that neutralization decays more rapidly than ADCC does.49 This suggests that neutralization and Fc-mediated activities are not performed by the same antibodies, and/or that the half-lives of neutralizing and non-neutralizing antibodies are different. Consistently, it has been shown that anti-spike IgG, IgA, and IgM follow distinct kinetics of induction and contraction.50 An analysis of monoclonal antibodies derived from convalescent patients will help determine whether the different functions can be dissociated, which may depend on the isotype or the epitope recognized by individual antibodies.
What are the consequences of complement deposition at the plasma membrane? We show here that sera from COVID-19 patients readily triggered C3 deposition at the surface of infected S-Fuse or A549-ACE2 cells, but the C3 deposition did not induce detectable cell death. This may be due to the presence of molecules, such as CD59, CD55, and CD46, which counteract complement-dependent killing. Raji-spike cells, which lack CD59,30 were indeed readily killed after complement deposition. In contrast, infected S-Fuse cells were rapidly eliminated by NK cells, when anti-SARS-CoV-2 antibodies were added to the culture medium. Our results suggest that NK cells are more potent than complement cells at killing SARS-CoV-2-infected cells after activation by antibodies. This is in line with previous observations with other viruses. For instance, HIV-1-infected cells may be eliminated by NK cells but not by CDC.30, 31, 32 In COVID-19 patients, the main cellular targets of SARS-CoV-2 are ciliated cells from the airways and type-II alveolar pneumocytes.51 The viral receptor ACE2 is expressed in other tissues than the respiratory tract, and several studies have demonstrated that SARS-CoV-2 has a large cellular tropism.52,53 Levels of molecules regulating CDC and ADCC vary among cell types.54,55 Thus, it is likely that these cells display different susceptibilities to ADCC and CDC. Future work will help in understanding the sensitivity of natural target cells to antiviral antibodies, the fate and role of infected cells coated with complement, and the overall contribution of non-neutralizing antibody functions to the immune response to SARS-CoV-2.
The levels of antibodies targeting other viruses, including two seasonal coronaviruses were similar in ASs and Ss, suggesting that these previous infections did not affect disease severity. One noticeable exception was a higher titer of anti-flu antibodies in symptomatic persons. The reasons for this remain to be characterized, but a simple explanation may be related to the older age of symptomatic individuals in the first cohort.
Our data did not provide a scenario explaining why some individuals remain asymptomatic. Rather, it shows that the antibody response of ASs, despite being lower, is not dramatically different from that of Ss. It has been reported that neutralizing IgA dominates the early neutralizing antibody response to SARS-CoV-2.56 Rapid IgA responses may be more prevalent in ASs versus Ss, highlighting a difference between these two categories of individuals.57 Thus, an early induction of functional antibodies may contribute to the asymptomatic phenotype. A rapid control of the virus likely decreases the overall antigenic burden, also providing an explanation for the lower antibody response observed in ASs at later time points. Challenging that hypothesis would require a longitudinal sampling of ASs. That was not possible in our study because ASs were identified retrospectively through sero-epidemiological studies. However, we observed a tendency for a higher correlation between the MFI of IgA and other antibody features in ASs, suggesting that they may harbor a distinctive IgA profile. Thus, a careful assessment of the kinetics of the immune response in ASs and the relationship between the IgA response and other immune component may help in understanding the mechanisms underlying asymptomatic control of SARS-CoV-2 infection.
Vaccines under development aim at producing neutralizing anti-spike antibodies.58 The Fc region is required for optimal efficacy of anti-spike monoclonal antibodies in vivo through mechanisms that may involve those described here.59,60 Non-neutralizing antibodies participate in protection offered by experimental vaccines against influenza or HIV.61,62 It will be of interest to assess whether SARS-CoV-2 vaccine candidates elicit non-neutralizing antibody functions and whether those functions correlate with vaccine efficacy.
In conclusion, we show here that ASs mount a humoral immune response only slightly decreased when compared with symptomatic SARS-CoV-2 infections. This response includes, in addition to neutralization, the ability to trigger ADCC and complement deposition. Our results warrant further analysis of neutralization and other antibody functions in the evaluation of vaccine candidates and the study of COVID-19 immunopathology.
Limitations of study
Our study has limitations. The first one is the absence of information regarding the date of virus acquisition in ASs. However, both Ss and ASs were sampled at the beginning of the epidemic in northern France and were likely infected within a short time frame. This is also why we analyzed the two groups of ASs separately, to compare them to Ss infected during the same epidemic wave. Another limitation is the lack of PCR confirmation for ASs and mildly symptomatic individuals. Our analysis is, therefore, restricted to individuals who have seroconverted. Moreover, the different groups were not all age-matched. In our first group, ASs were, as expected, younger than Ss. This was balanced in our second group, in which we selected Ss to match the age of the AS group, but Hs were older than ASs and Ss in this study. In addition, Hs were more often male. These biases limit our interpretation of the link between ADCC and complement levels and hospitalization. Future work will help shed light on the influence of age and other clinical and biological characteristics on the intensity and polyfunctionality of the antibody response.
STAR★Methods
Key resources table
| REAGENT or RESOURCE | SOURCE | IDENTIFIER |
|---|---|---|
| Antibodies | ||
| Biotinylated anti-Spike monoclonal Ab | Kind gift of Dr Hugo Mouquet (Institut Pasteur, Paris, France) | N/A |
| Anti-human IgM Alexa Fluor 488 | Thermo Fisher Scientific | Cat#A-21215; RRID: AB_2535800 |
| Anti-human IgA Alexa Fluor 647 | Jackson ImmunoResearch | Cat#109-605-011; RRID: AB_2337883 |
| Anti-human IgG Alexa Fluor 647 | Thermo Fisher Scientific | Cat#A-21445; RRID: AB_2535862 |
| Anti-C3b/iC3b antibody APC | Tebu-bio | Cat#CL7631APC; RRID: AB_11188343 |
| Bacterial and virus strains | ||
| SARS-CoV-2 strain BetaCoV/France/IDF0372/2020 | National Reference Centre for Respiratory Viruses (Institut Pasteur, Paris, France) | N/A |
| Chemicals, peptides, and recombinant proteins | ||
| Hoechst 33342 | Invitrogen | Cat#H3570 |
| Paraformaldehyde 4% | Alfa Aesar | Cat#J19943.K2 |
| Streptavidin R-PE | Invitrogen | Cat#SA10044 |
| Propidium Iodide | Invitrogen | Cat#P3566 |
| Critical commercial assays | ||
| NK Cell Isolation Kit, human | Miltenyi Biotec | Cat#130-092-657 |
| ADCC Reporter Bioassay | Promega | Cat#G7010 |
| LIVE/DEAD Fixable Aqua Dead Cell Stain Kit | Invitrogen | Cat#L34957 |
| Bright-Glo Luciferase Assay System | Promega | Cat#E2620 |
| Experimental models: cell lines | ||
| Raji cells | ATCC | Cat#CCL-86 |
| 293T cells | ATCC | Cat#CRL-3216 |
| A549 cells | ATCC | Cat#CCL-185 |
| U2OS cells | ATCC | Cat#HTB-96 |
| Software and algorithms | ||
| Harmony High-Content Imaging and Analysis Software | PerkinElmer | Cat#HH17000012 |
| Excel 365 | Microsoft | https://www.microsoft.com/en-ca/microsoft-365/excel |
| Prism 8 | Graphpad | https://www.graphpad.com/ |
| R v4.0.2 (2020-06-22) | The R Foundation for Statistical Computing | www.r-project.org |
| Rstudio v1.3.959 | RStudio | https://www.rstudio.com |
| FlowJo v10 | Tree Star | https://www.flowjo.com/ |
Resource availability
Lead contact
Further information and requests for resources and reagents should be directed to the Lead contact Timothée Bruel (timothee.bruel@pasteur.fr).
Materials availability
This study did not generate new unique reagents.
Data and code availability
This study did not generate or analyze datasets or code.
Experimental model and subject details
Human samples
Pre-pandemic individuals’ sera
Pre-pandemic sera were sampled from 200 anonymized healthy blood donors recruited between September 2014 and April 2019 at the Val d’Oise sites of EFS (the French blood agency). The ICAReB platform (BRIF code n°BB-0033-00062) of Institut Pasteur collects and manages bioresources following ISO (International Organization for Standardization) 9001 and NF S 96-900 quality standards. More information about the participants included can be found in Table S1.
Asymptomatic and symptomatic individuals’ sera
Following the first documented local transmission of SARS-CoV-2 in France, outbreak investigation and contact tracing identified two cases in the high school of Crépy-en-Valois (France) on 2 February 2020. We conducted two retrospective seroepidemiological studies in the city:
-
(i)
First, a retrospective closed cohort study in the high school.42 Between 30 March and 4 April, all pupils, as well as teachers and non-teaching staff (administrative, cleaners, catering) from the high school were invited to participate in the investigation (n = 1200). Participants completed a questionnaire which covered sociodemographic information and a 5 mL blood sample was taken (n = 661). Some of the participants (n = 203) had a previous blood sampling as part of an initial investigation of the cluster on March 3-4, 2020. More information about the participants included can be found in Table S2.
-
(ii)
Second, an investigation across primary schools.43 We invited all pupils, teachers and non-teaching staff (administrative, cleaners, catering) from each of the six primary schools who were registered at the school from the beginning of the epidemic (estimated around 13 January 2020) up to the time of the investigation on April 28-30, 2020. Participants (with the help of their parents in the case of pupils) completed a questionnaire that covered sociodemographic information and a 5 mL blood sample was taken (n = 1340). More information about the participants included can be found in Table S3.
These studies are registered with Clinicaltrials.gov (ID: NCT04325646) and received ethical approval by the Comité de Protection des Personnes Ile-de-France (CPP-IDF) III. Informed consent was obtained from all study participants. The ICAReB platform (BRIF code n°BB-0033-00062) of Institut Pasteur collected and managed bioresources following ISO (International Organization for Standardization) 9001 and NF S 96-900 quality standards.
Sera from hospitalized COVID-19 patients
Serum samples from hospitalized COVID-19 cases were obtained from Hôpital Bichat–Claude-Bernard as part of the French COVID-19 cohort. Each participant provided written consent to participate in the study, which was approved by the regional investigational review board (CPP-IDF VII, Paris, France) (ID RCB: 2020-A00256-33) and performed according to European guidelines and the Declaration of Helsinki. More information about the participants included can be found in Table S4.
Primary NK cells
Peripheral blood mononuclear cells (PBMCs) were isolated from peripheral blood of healthy human donors from the Etablissement Français du Sang (EFS), in accordance with local ethical guidelines. NK cells were enriched by magnetic negative selection (Miltenyi) and cultured overnight (37°C) in complete RPMI medium before use. More information about the participants included can be found in Table S1.
Cell lines
Raji cells (ATCC® CCL-86) were grown in complete RPMI medium (10% Fetal Calf Serum (FCS), 1% Penicillin/Streptomycin (PS)). 293T cells (ATCC® CRL-3216) and U2OS cells (ATCC® HTB-96) were grown in complete DMEM medium (10% FCS, 1% PS). A549 cells (ATCC® CCL-185) were cultured in F-12K Nutrient Mixture Media with 10% FCS and 1% PS. 293T, U2OS and A549 cells stably expressing ACE2, and U2OS-ACE2 cells stably expressing the GFPsplit system (GFP1-10 and GFP11; S-Fuse cells) were previously described.29 Blasticidin (10 μg/mL) and puromycin (1 μg/mL) were used to select for ACE2 and GFPsplit transgenes expression, respectively. 293T and Raji cells stably expressing the SARS-CoV-2 Spike protein (GenBank: QHD43416.1) were generated by lentiviral transduction and selection with puromycin (1 μg/mL). Absence of mycoplasma contamination was confirmed in all cell lines with the Mycoalert Mycoplasma Detection Kit (Lonza). All cell lines were cultured at 37°C and 5% CO2.
Viruses
The SARS-CoV-2 strain BetaCoV/France/IDF0372/2020 was supplied by the National Reference Centre for Respiratory Viruses hosted by Institut Pasteur (Paris, France). The human sample from which the strain was isolated has been provided by Dr. X. Lescure and Pr. Y. Yazdanpanah from the Bichât Hospital, Paris, France. The viral strain was supplied through the European Virus Archive goes Global (Evag) platform (Horizon 2020 research and innovation grant n°653316). Titration of viral stocks was performed on Vero E6, with a limiting dilution technique allowing a calculation of PFU (plaque-forming unit)/ml.
Methods details
Serological analysis of antibodies
S-Flow
The S-Flow assay was performed as previously described.19 Briefly, 293T-S were incubated at 4°C for 30 min with sera (1:300 dilution, unless otherwise specified) in PBS containing 0.5% BSA and 2 mM EDTA, washed with PBS, and stained using either anti-IgG Alexa Fluor 647 (dilution 1:600; Thermo Fisher Scientific), or anti-IgM Alexa Fluor 488 (dilution 1:600; Thermo Fisher Scientific), or anti-IgA Alexa Fluor 647 (dilution 1:800; Jackson ImmunoResearch). Cells were washed with PBS and fixed for 10 min using 4% paraformaldehyde (PFA). Data were acquired on an Attune NxT instrument (Life Technologies). Specific binding was calculated with the following formula: 100 × (% binding on 293T-Spike − % binding on control cells)/(100 − % binding on control cells).
Luminex
A multiplex Luminex® MAGPIX® assay was developed to measure IgG antibody responses to SARS-CoV-2 antigens (trimeric Spike, S1, S2 RBD, Nucleoprotein), Nucleoprotein from two seasonal coronaviruses (NL63 and 229E), and antigens from other viruses (Influenza A H1N1, adenovirus type 40, mumps, rubella).63
Antibody-dependent cellular cytotoxicity assays
ADCC assay on infected cells
4x10³ U2OS-ACE2-GFP-1-10 and 4x10³ U2OS-ACE2-GFP-11 cells were plated in a μClear 96-well plate (Greiner Bio-One). The next day, cells were infected at a multiplicity of infection (MOI) of 0.1 for 18h. NK cells isolated from PBMCs of a healthy donor (ratio 1:1 unless otherwise stated) and sera from pre-pandemic or COVID-19 individuals (dilution 1:100 unless otherwise stated) were added. After 4 hours, cells were fixed with 2% PFA, washed, stained with Hoechst (dilution 1:1,000, Invitrogen) and acquired with an Opera Phenix high content confocal microscope (PerkinElmer). The GFP area was quantified with the Harmony software (PerkinElmer). ADCC was measured using the following formula: 100 x (GFP area in “no serum” – GFP area in “tested serum”)/(GFP area in “no serum”).
CD16 activation reporter assay
ADCC was quantified using the ADCC Reporter Bioassay (Promega) according to manufacturer’s instructions. Briefly, 5x10⁴ Raji-Spike cells were co-cultured with 5x10⁴ Jurkat-CD16-NFAT-rLuc cells in presence or absence of pre-pandemic or COVID-19 sera at the indicated dilution. Luciferase was measured after 18 hours of incubation using an EnSpire plate reader (PerkinElmer). ADCC was measured as the fold induction of Luciferase activity compared to the “no serum” condition.
Complement activation assays
Complement activation assay on infected cells
1.5x10⁴ A549-ACE2 cells were plated in 96-well plates. After overnight incubation, cells were infected at a MOI of 1 for 24 hours. Then, pre-pandemic or COVID-19 serum was added as a source of antibodies (dilution 1:100) and normal (NHS) or heat-inactivated (HIHS) serum was added as a source of complement (dilution 1:2). After 4 hours, cells were detached using PBS-EDTA and incubated 30 min at 4°C with an APC-conjugated anti-C3b/iC3b antibody (clone 6C9, Tebu-bio, dilution 1:50). Cells were washed with PBS and fixed with 4% PFA. For Spike staining, cells were incubated 30 min with a biotinylated anti-Spike monoclonal antibody (10 μg/mL in PBS/BSA 0.5%/Saponin 0.05%), washed, and incubated 30 min with Streptavidin R-PE (dilution 1:100 in PBS/BSA 0.5%/Saponin 0.05%, Invitrogen). The anti-Spike antibody was a kind gift of Hugo Mouquet (Institut Pasteur, Paris). Data were acquired on an Attune NxT instrument (Life Technologies). For each serum, complement-dependent cytotoxicity (CDC) of infected cells was calculated using the following formula: 100 × (% of infected cells with HIHS − % of infected cells with NHS)/(% of infected cells with HIHS).
Complement activation assay on Raji-Spike cells
Complement-dependent cytotoxicity (CDC) of Raji cells was measured as previously described.30 Briefly Raji-Spike cells (5x10⁴) were cultivated in the presence of 50% normal (NHS) or heat-inactivated (HIHS) human serum and with or without pre-pandemic or COVID-19 sera (diluted 1:33 unless otherwise stated). After 24h, cells were washed with PBS and the live/dead fixable aqua dead cell marker (1:1,000 in PBS; Life Technologies) was added for 30 min at 4°C before fixation. Data were acquired on an Attune NxT instrument (Life Technologies). CDC was calculated using the following formula: 100 × (% of dead cells with serum − % of dead cells without serum)/(100 − % of dead cells without serum).
Neutralization assays
Pseudo-neutralization assay
2x10⁴ 293T-ACE2 cells were plated in 96-well plates. Single cycle lentiviral Spike pseudotypes encoding for a luciferase reporter gene were preincubated 30 minutes at room temperature with the serum to be tested at the indicated dilution and added to the cells. The luciferase signal was measured after 48h. The percentage of neutralization was calculated with the following formula, setting the “no serum” condition at 0% and the “no-pseudotype” condition at 100%: 100 x (1 – (value with serum – value with “no-pseudotype”)/(value with “no serum” – value with “no-pseudotype”)).
SARS-CoV-2 neutralization assay
4x10³ U2OS-ACE2-GFP-1-10 and 4x10³ U2OS-ACE2-GFP-11 cells were plated overnight in a μClear 96-well plate (Greiner Bio-One). SARS-CoV-2 was incubated with sera at the indicated dilutions for 30 minutes at room temperature and added on cells (MOI 0.1). 18 hours later, cells were fixed with 2% PFA, washed, stained with Hoechst (dilution 1:1,000, Invitrogen) and acquired with an Opera Phenix high content confocal microscope (PerkinElmer). For each well, the GFP area and the number of nuclei were quantified using the Harmony software (PerkinElmer). The percentage of neutralization was calculated using the nuclei count or the GFP area using the following formula, setting the “no serum” condition at 0% and the non-infected condition at 100%: 100 x (1 – (value with serum – value in “non-infected”)/(value in “no serum” – value in “non-infected”)).
Live-imaging
1x10⁴ U2OS-ACE2-GFP-1-10 and 1x10⁴ U2OS-ACE2-GFP-11 cells were plated overnight in each compartment of a μ-Dish35 mm Quad (Ibidi). The next day, cells were infected at a MOI of 0.1. 18 hours later, NK cells were added at 1:1 ratio as well as serum from a pre-pandemic or a COVID-19 individual (dilution 1:100). Conditions without NK and Serum (“No serum No NK”) and with NK cells but without serum (“no serum”) were included as controls. Propidium iodide (PI) (10 μg/ml, Invitrogen) was added to monitor cell death. Transmission and fluorescence images were acquired at a 20X magnification every 4 minutes for 4 hours on a BioStation IM-Q (Nikon). At least 5 fields were recorded in each condition. Images were analyzed using the FIJI software.
Quantification and statistical analysis
Calculations, figures and statistics were performed using Excel 365 (Microsoft), Prism 9 (GraphPad Software) or RStudio Desktop 1.3.1093 (R Studio, PBC). For R analysis we used the following packages: corrplot (https://github.com/taiyun/corrplot), pheatmap (https://cran.r-project.org/web/packages/pheatmap/index.html), factoextra and FactoMineR (https://cran.r-project.org/web/packages/factoextra/index.html) and readxl (https://cran.r-project.org/web/packages/readxl/index.html). All information about sample sizes and statistical tests performed can be found in the figure legends.
Acknowledgments
We thank the individuals who donated their blood. We thank M.M. Rajah for critical reading of the manuscript; J. Toubiana and S. Brisse (Institut Pasteur) for providing pre-pandemic serum samples; R. Lemahieu for organizing the epidemiological survey; and the ICAReB team for management and distribution of serum samples. We thank F. Mentre, S. Tubiana, the French COVID-19 Cohort, and REACTing for cohort management. We thank S. Ferandes Pellerin and N. Jolly for their coordination of the CORSER studies. This work was supported by the Urgence COVID-19 Fundraising Campaign of Institut Pasteur. O.S. is funded by Institut Pasteur, ANRS, Sidaction, the Vaccine Research Institute (ANR-10-LABX-77), Labex IBEID (ANR-10-LABX-62-IBEID), the “TIMTAMDEN” project (a collaboration of Inserm, Institut Pasteur, and IRD; ANR-14-CE14-0029), the ANR “CHIKV-Viro-Immuno” project (ANR-14-CE14-0015-01), and the Gilead HIV cure program. J.D. and L.G. are supported by the French Ministry of Higher Education, Research and Innovation. H.M. is funded by the Institut Pasteur, the Milieu Intérieur Program (ANR-10-LABX-69-01), Inserm, and REACTing and EU RECOVER grants. C.P. is supported by a fellowship from the Agence Nationale de Recherches sur le Sida et les Hépatites Virales (ANRS).
Author contributions
Conceptualization and methodology, J.D., L.G., O.S., and T.B.; cohort management and sample collection, A.W., M.-N.U., Y.L., and B.H.; acquisition or analysis of data, J.D., L.G., I.S., Y.M., L.T., F.A., S.P., C.P., J.B., R.R., H.M., P.C., M.W., A.F., O.S., and T.B.; data assembly and manuscript writing, J.D., L.G., O.S., and T.B.; funding acquisition, H.M., P.C., M.W., Y.L., B.H., A.F., O.S., and T.B.; supervision, O.S. and T.B.
Declaration of interests
P.C. is the founder and chief scientific officer of TheraVectys. L.G., I.S., T.B., R.R., J.B., and O.S. are coinventors on provisional patent no. US 63/020,063 entitled “S-Flow: a FACS-based assay for serological analysis of SARS-CoV2 infection” submitted by Institut Pasteur.
Published: April 20, 2021
Footnotes
Supplemental information can be found online at https://doi.org/10.1016/j.xcrm.2021.100275.
Contributor Information
Olivier Schwartz, Email: olivier.schwartz@pasteur.fr.
Timothée Bruel, Email: timothee.bruel@pasteur.fr.
Supplemental information
References
- 1.Wu F., Zhao S., Yu B., Chen Y.-M., Wang W., Song Z.-G., Hu Y., Tao Z.W., Tian J.H., Pei Y.Y. A new coronavirus associated with human respiratory disease in China. Nature. 2020;579:265–269. doi: 10.1038/s41586-020-2008-3. [DOI] [PMC free article] [PubMed] [Google Scholar]
- 2.Zhou P., Yang X.-L., Wang X.-G., Hu B., Zhang L., Zhang W., Si H.R., Zhu Y., Li B., Huang C.L. A pneumonia outbreak associated with a new coronavirus of probable bat origin. Nature. 2020;579:270–273. doi: 10.1038/s41586-020-2012-7. [DOI] [PMC free article] [PubMed] [Google Scholar]
- 3.Gorbalenya A.E., Baker S.C., Baric R.S., de Groot R.J., Drosten C., Gulyaeva A.A., Coronaviridae Study Group of the International Committee on Taxonomy of Viruses The species Severe acute respiratory syndrome-related coronavirus: classifying 2019-nCoV and naming it SARS-CoV-2. Nat. Microbiol. 2020;5:536–544. doi: 10.1038/s41564-020-0695-z. [DOI] [PMC free article] [PubMed] [Google Scholar]
- 4.Flaxman S., Mishra S., Gandy A., Unwin H.J.T., Mellan T.A., Coupland H., Whittaker C., Zhu H., Berah T., Eaton J.W., Imperial College COVID-19 Response Team Estimating the effects of non-pharmaceutical interventions on COVID-19 in Europe. Nature. 2020;584:257–261. doi: 10.1038/s41586-020-2405-7. [DOI] [PubMed] [Google Scholar]
- 5.Guan W.-J., Ni Z.-Y., Hu Y., Liang W.-H., Ou C.-Q., He J.-X., Liu L., Shan H., Lei C.L., Hui D.S.C., China Medical Treatment Expert Group for Covid-19 Clinical characteristics of coronavirus disease 2019 in China. N. Engl. J. Med. 2020;382:1708–1720. doi: 10.1056/NEJMoa2002032. [DOI] [PMC free article] [PubMed] [Google Scholar]
- 6.Huang C., Wang Y., Li X., Ren L., Zhao J., Hu Y., Zhang L., Fan G., Xu J., Gu X. Clinical features of patients infected with 2019 novel coronavirus in Wuhan, China. Lancet. 2020;395:497–506. doi: 10.1016/S0140-6736(20)30183-5. [DOI] [PMC free article] [PubMed] [Google Scholar]
- 7.Sakurai A., Sasaki T., Kato S., Hayashi M., Tsuzuki S.I., Ishihara T., Iwata M., Morise Z., Doi Y. Natural history of asymptomatic SARS-CoV-2 infection. N. Engl. J. Med. 2020;383:885–886. doi: 10.1056/NEJMc2013020. [DOI] [PMC free article] [PubMed] [Google Scholar]
- 8.Lavezzo E., Franchin E., Ciavarella C., Cuomo-Dannenburg G., Barzon L., Del Vecchio C., Rossi L., Manganelli R., Loregian A., Navarin N., Imperial College COVID-19 Response Team. Imperial College COVID-19 Response Team Suppression of a SARS-CoV-2 outbreak in the Italian municipality of Vo’. Nature. 2020;584:425–429. doi: 10.1038/s41586-020-2488-1. [DOI] [PMC free article] [PubMed] [Google Scholar]
- 9.Cummings M.J., Baldwin M.R., Abrams D., Jacobson S.D., Meyer B.J., Balough E.M., Aaron J.G., Claassen J., Rabbani L.E., Hastie J. Epidemiology, clinical course, and outcomes of critically ill adults with COVID-19 in New York City: a prospective cohort study. Lancet. 2020;395:1763–1770. doi: 10.1016/S0140-6736(20)31189-2. [DOI] [PMC free article] [PubMed] [Google Scholar]
- 10.Blanco-Melo D., Nilsson-Payant B.E., Liu W.-C., Uhl S., Hoagland D., Møller R., Jordan T.X., Oishi K., Panis M., Sachs D. Imbalanced host response to SARS-CoV-2 drives development of COVID-19. Cell. 2020;181:1036–1045.e9. doi: 10.1016/j.cell.2020.04.026. [DOI] [PMC free article] [PubMed] [Google Scholar]
- 11.Hadjadj J., Yatim N., Barnabei L., Corneau A., Boussier J., Smith N., Péré H., Charbit B., Bondet V., Chenevier-Gobeaux C. Impaired type I interferon activity and inflammatory responses in severe COVID-19 patients. Science. 2020;369:718–724. doi: 10.1126/science.abc6027. [DOI] [PMC free article] [PubMed] [Google Scholar]
- 12.Bastard P., Rosen L.B., Zhang Q., Michailidis E., Hoffmann H.-H., Zhang Y., Dorgham K., Philippot Q., Rosain J., Béziat V., HGID Lab. NIAID-USUHS Immune Response to COVID Group. COVID Clinicians. COVID-STORM Clinicians. Imagine COVID Group. French COVID Cohort Study Group. Milieu Intérieur Consortium. CoV-Contact Cohort. Amsterdam UMC Covid-19 Biobank. COVID Human Genetic Effort Autoantibodies against type I IFNs in patients with life-threatening COVID-19. Science. 2020;370:eabd4585. doi: 10.1126/science.abd4585. [DOI] [PMC free article] [PubMed] [Google Scholar]
- 13.Zhang Q., Bastard P., Liu Z., Le Pen J., Moncada-Velez M., Chen J., Ogishi M., Sabli I.K.D., Hodeib S., Korol C., COVID-STORM Clinicians. COVID Clinicians. Imagine COVID Group. French COVID Cohort Study Group. CoV-Contact Cohort. Amsterdam UMC Covid-19 Biobank. COVID Human Genetic Effort. NIAID-USUHS/TAGC COVID Immunity Group Inborn errors of type I IFN immunity in patients with life-threatening COVID-19. Science. 2020;370:eabd4570. doi: 10.1126/science.abd4570. [DOI] [PMC free article] [PubMed] [Google Scholar]
- 14.Lucas C., Wong P., Klein J., Castro T.B.R., Silva J., Sundaram M., Ellingson M.K., Mao T., Oh J.E., Israelow B., Yale IMPACT Team Longitudinal analyses reveal immunological misfiring in severe COVID-19. Nature. 2020;584:463–469. doi: 10.1038/s41586-020-2588-y. [DOI] [PMC free article] [PubMed] [Google Scholar]
- 15.Giamarellos-Bourboulis E.J., Netea M.G., Rovina N., Akinosoglou K., Antoniadou A., Antonakos N., Damoraki G., Gkavogianni T., Adami M.E., Katsaounou P. Complex immune dysregulation in COVID-19 patients with severe respiratory failure. Cell Host Microbe. 2020;27:992–1000.e3. doi: 10.1016/j.chom.2020.04.009. [DOI] [PMC free article] [PubMed] [Google Scholar]
- 16.Zhou Z., Ren L., Zhang L., Zhong J., Xiao Y., Jia Z., Guo L., Yang J., Wang C., Jiang S. Heightened innate immune responses in the respiratory tract of COVID-19 patients. Cell Host Microbe. 2020;27:883–890.e2. doi: 10.1016/j.chom.2020.04.017. [DOI] [PMC free article] [PubMed] [Google Scholar]
- 17.Carvelli J., Demaria O., Vély F., Batista L., Chouaki Benmansour N., Fares J., Carpentier S., Thibult M.L., Morel A., Remark R., Explore COVID-19 IPH group. Explore COVID-19 Marseille Immunopole group Association of COVID-19 inflammation with activation of the C5a-C5aR1 axis. Nature. 2020;588:146–150. doi: 10.1038/s41586-020-2600-6. [DOI] [PMC free article] [PubMed] [Google Scholar]
- 18.Varga Z., Flammer A.J., Steiger P., Haberecker M., Andermatt R., Zinkernagel A.S., Mehra M.R., Schuepbach R.A., Ruschitzka F., Moch H. Endothelial cell infection and endotheliitis in COVID-19. Lancet. 2020;395:1417–1418. doi: 10.1016/S0140-6736(20)30937-5. [DOI] [PMC free article] [PubMed] [Google Scholar]
- 19.Grzelak L., Temmam S., Planchais C., Demeret C., Tondeur L., Huon C., Guivel-Benhassine F., Staropoli I., Chazal M., Dufloo J. A comparison of four serological assays for detecting anti-SARS-CoV-2 antibodies in human serum samples from different populations. Sci. Transl. Med. 2020;12:eabc3103. doi: 10.1126/scitranslmed.abc3103. [DOI] [PMC free article] [PubMed] [Google Scholar]
- 20.Peng Y., Mentzer A.J., Liu G., Yao X., Yin Z., Dong D., Dejnirattisai W., Rostron T., Supasa P., Liu C., Oxford Immunology Network Covid-19 Response T cell Consortium. ISARIC4C Investigators Broad and strong memory CD4+ and CD8+ T cells induced by SARS-CoV-2 in UK convalescent individuals following COVID-19. Nat. Immunol. 2020;21:1336–1345. doi: 10.1038/s41590-020-0782-6. [DOI] [PMC free article] [PubMed] [Google Scholar]
- 21.Fafi-Kremer S., Bruel T., Madec Y., Grant R., Tondeur L., Grzelak L., Staropoli I., Anna F., Souque P., Fernandes-Pellerin S. Serologic responses to SARS-CoV-2 infection among hospital staff with mild disease in eastern France. EBioMedicine. 2020;59:102915. doi: 10.1016/j.ebiom.2020.102915. [DOI] [PMC free article] [PubMed] [Google Scholar]
- 22.Long Q.-X., Tang X.-J., Shi Q.-L., Li Q., Deng H.-J., Yuan J., Hu J.L., Xu W., Zhang Y., Lv F.J. Clinical and immunological assessment of asymptomatic SARS-CoV-2 infections. Nat. Med. 2020;26:1200–1204. doi: 10.1038/s41591-020-0965-6. [DOI] [PubMed] [Google Scholar]
- 23.Hoffmann M., Kleine-Weber H., Schroeder S., Krüger N., Herrler T., Erichsen S., Schiergens T.S., Herrler G., Wu N.H., Nitsche A. SARS-CoV-2 cell entry depends on ACE2 and TMPRSS2 and is blocked by a clinically proven protease inhibitor. Cell. 2020;181:271–280.e8. doi: 10.1016/j.cell.2020.02.052. [DOI] [PMC free article] [PubMed] [Google Scholar]
- 24.Wrapp D., Wang N., Corbett K.S., Goldsmith J.A., Hsieh C.-L., Abiona O., Graham B.S., McLellan J.S. Cryo-EM structure of the 2019-nCoV spike in the prefusion conformation. Science. 2020;367:1260–1263. doi: 10.1126/science.abb2507. [DOI] [PMC free article] [PubMed] [Google Scholar]
- 25.Rogers T.F., Zhao F., Huang D., Beutler N., Burns A., He W.T., Limbo O., Smith C., Song G., Woehl J. Isolation of potent SARS-CoV-2 neutralizing antibodies and protection from disease in a small animal model. Science. 2020;369:956–963. doi: 10.1126/science.abc7520. [DOI] [PMC free article] [PubMed] [Google Scholar]
- 26.Wec A.Z., Wrapp D., Herbert A.S., Maurer D.P., Haslwanter D., Sakharkar M., Jangra R.K., Dieterle M.E., Lilov A., Huang D. Broad neutralization of SARS-related viruses by human monoclonal antibodies. Science. 2020;369:731–736. doi: 10.1126/science.abc7424. [DOI] [PMC free article] [PubMed] [Google Scholar]
- 27.Barnes C.O., West A.P., Jr., Huey-Tubman K.E., Hoffmann M.A.G., Sharaf N.G., Hoffman P.R., Koranda N., Gristick H.B., Gaebler C., Muecksch F. Structures of human antibodies bound to SARS-CoV-2 spike reveal common epitopes and recurrent features of antibodies. Cell. 2020;182:828–842.e16. doi: 10.1016/j.cell.2020.06.025. [DOI] [PMC free article] [PubMed] [Google Scholar]
- 28.Robbiani D.F., Gaebler C., Muecksch F., Lorenzi J.C.C., Wang Z., Cho A., Agudelo M., Barnes C.O., Gazumyan A., Finkin S. Convergent antibody responses to SARS-CoV-2 in convalescent individuals. Nature. 2020;584:437–442. doi: 10.1038/s41586-020-2456-9. [DOI] [PMC free article] [PubMed] [Google Scholar]
- 29.Buchrieser J., Dufloo J., Hubert M., Monel B., Planas D., Rajah M.M., Planchais C., Porrot F., Guivel-Benhassine F., Van der Werf S. Syncytia formation by SARS-CoV-2-infected cells. EMBO J. 2020;39:e106267. doi: 10.15252/embj.2020106267. [DOI] [PMC free article] [PubMed] [Google Scholar]
- 30.Dufloo J., Guivel-Benhassine F., Buchrieser J., Lorin V., Grzelak L., Dupouy E., Mestrallet G., Bourdic K., Lambotte O., Mouquet H. Anti-HIV-1 antibodies trigger non-lytic complement deposition on infected cells. EMBO Rep. 2020;21:e49351. doi: 10.15252/embr.201949351. [DOI] [PMC free article] [PubMed] [Google Scholar]
- 31.Bruel T., Guivel-Benhassine F., Amraoui S., Malbec M., Richard L., Bourdic K., Donahue D.A., Lorin V., Casartelli N., Noël N. Elimination of HIV-1-infected cells by broadly neutralizing antibodies. Nat. Commun. 2016;7:10844. doi: 10.1038/ncomms10844. [DOI] [PMC free article] [PubMed] [Google Scholar]
- 32.von Bredow B., Arias J.F., Heyer L.N., Moldt B., Le K., Robinson J.E., Zolla-Pazner S., Burton D.R., Evans D.T. Comparison of antibody-dependent cell-mediated cytotoxicity and virus neutralization by HIV-1 Env-specific monoclonal antibodies. J. Virol. 2016;90:6127–6139. doi: 10.1128/JVI.00347-16. [DOI] [PMC free article] [PubMed] [Google Scholar]
- 33.Richard J., Prévost J., Alsahafi N., Ding S., Finzi A. Impact of HIV-1 envelope conformation on ADCC responses. Trends Microbiol. 2018;26:253–265. doi: 10.1016/j.tim.2017.10.007. [DOI] [PubMed] [Google Scholar]
- 34.Dai H.-S., Griffin N., Bolyard C., Mao H.C., Zhang J., Cripe T.P., Suenaga T., Arase H., Nakano I., Chiocca E.A. The Fc domain of immunoglobulin is sufficient to bridge NK cells with virally infected cells. Immunity. 2017;47:159–170.e10. doi: 10.1016/j.immuni.2017.06.019. [DOI] [PMC free article] [PubMed] [Google Scholar]
- 35.Bournazos S., Ravetch J.V. Fcγ receptor function and the design of vaccination strategies. Immunity. 2017;47:224–233. doi: 10.1016/j.immuni.2017.07.009. [DOI] [PMC free article] [PubMed] [Google Scholar]
- 36.Bournazos S., Klein F., Pietzsch J., Seaman M.S., Nussenzweig M.C., Ravetch J.V. Broadly neutralizing anti-HIV-1 antibodies require Fc effector functions for in vivo activity. Cell. 2014;158:1243–1253. doi: 10.1016/j.cell.2014.08.023. [DOI] [PMC free article] [PubMed] [Google Scholar]
- 37.DiLillo D.J., Palese P., Wilson P.C., Ravetch J.V. Broadly neutralizing anti-influenza antibodies require Fc receptor engagement for in vivo protection. J. Clin. Invest. 2016;126:605–610. doi: 10.1172/JCI84428. [DOI] [PMC free article] [PubMed] [Google Scholar]
- 38.Gunn B.M., Yu W.-H., Karim M.M., Brannan J.M., Herbert A.S., Wec A.Z., Halfmann P.J., Fusco M.L., Schendel S.L., Gangavarapu K. A role for Fc function in therapeutic monoclonal antibody-mediated protection against Ebola virus. Cell Host Microbe. 2018;24:221–233.e5. doi: 10.1016/j.chom.2018.07.009. [DOI] [PMC free article] [PubMed] [Google Scholar]
- 39.Lu L.L., Suscovich T.J., Fortune S.M., Alter G. Beyond binding: antibody effector functions in infectious diseases. Nat. Rev. Immunol. 2018;18:46–61. doi: 10.1038/nri.2017.106. [DOI] [PMC free article] [PubMed] [Google Scholar]
- 40.Atyeo C., Fischinger S., Zohar T., Slein M.D., Burke J., Loos C., McCulloch D.J., Newman K.L., Wolf C., Yu J. Distinct early serological signatures track with SARS-CoV-2 survival. Immunity. 2020;53:524–532.e4. doi: 10.1016/j.immuni.2020.07.020. [DOI] [PMC free article] [PubMed] [Google Scholar]
- 41.Larsen M.D., de Graaf E.L., Sonneveld M.E., Plomp H.R., Nouta J., Hoepel W., Chen H.J., Linty F., Visser R., Brinkhaus M., Amsterdam UMC COVID-19. Biobank Study Group Afucosylated IgG characterizes enveloped viral responses and correlates with COVID-19 severity. Science. 2021;371:eabc8378. doi: 10.1126/science.abc8378. [DOI] [PMC free article] [PubMed] [Google Scholar]
- 42.Fontanet A., Tondeur L., Madec Y., Grant R., Besombes C., Jolly N., Pellerin S.F., Ungeheuer M.-N., Cailleau I., Kuhmel L. Cluster of COVID-19 in northern France: a retrospective closed cohort study. medRxiv. 2020 doi: 10.1101/2020.04.18.20071134. [DOI] [Google Scholar]
- 43.Fontanet A., Grant R., Tondeur L., Madec Y., Grzelak L., Cailleau I., Ungeheuer M.-N., Renaudat C., Pellerin S.F., Kuhmel L. SARS-CoV-2 infection in primary schools in northern France: a retrospective cohort study in an area of high transmission. MedRxiv. 2020 doi: 10.1101/2020.06.25.20140178. [DOI] [PMC free article] [PubMed] [Google Scholar]
- 44.Sekine T., Perez-Potti A., Rivera-Ballesteros O., Strålin K., Gorin J.-B., Olsson A., Llewellyn-Lacey S., Kamal H., Bogdanovic G., Muschiol S., Karolinska COVID-19 Study Group Robust T cell immunity in convalescent individuals with asymptomatic or mild COVID-19. Cell. 2020;183:158–168.e14. doi: 10.1016/j.cell.2020.08.017. [DOI] [PMC free article] [PubMed] [Google Scholar]
- 45.Wang X., Guo X., Xin Q., Pan Y., Hu Y., Li J., Chu Y., Feng Y., Wang Q. Neutralizing antibodies responses to SARS-CoV-2 in COVID-19 inpatients and convalescent patients. Clin. Infect. Dis. 2020;71:2688–2695. doi: 10.1093/cid/ciaa721. [DOI] [PMC free article] [PubMed] [Google Scholar]
- 46.Garcia-Beltran W.F., Lam E.C., Astudillo M.G., Yang D., Miller T.E., Feldman J., Hauser B.M., Caradonna T.M., Clayton K.L., Nitido A.D. COVID-19-neutralizing antibodies predict disease severity and survival. Cell. 2021;184:476–488.e11. doi: 10.1016/j.cell.2020.12.015. [DOI] [PMC free article] [PubMed] [Google Scholar]
- 47.Guthmiller J.J., Stovicek O., Wang J., Changrob S., Li L., Halfmann P., Zheng N.Y., Utset H., Stamper C.T., Dugan H.L. SARS-CoV-2 infection severity is linked to superior humoral immunity against the spike. MBio. 2021;12 doi: 10.1128/mBio.02940-20. e02940-20. [DOI] [PMC free article] [PubMed] [Google Scholar]
- 48.Risitano A.M., Mastellos D.C., Huber-Lang M., Yancopoulou D., Garlanda C., Ciceri F., Lambris J.D. Complement as a target in COVID-19? Nat. Rev. Immunol. 2020;20:343–344. doi: 10.1038/s41577-020-0320-7. [DOI] [PMC free article] [PubMed] [Google Scholar]
- 49.Anand S.P., Prévost J., Nayrac M., Beaudoin-Bussières G., Benlarbi M., Gasser R., Brassard N., Laumaea A., Gong S.Y., Bourassa C. Longitudinal analysis of humoral immunity against SARS-CoV-2 Spike in convalescent individuals up to 8 months post-symptom onset. bioRxiv. 2021 doi: 10.1101/2021.01.25.428097. [DOI] [PMC free article] [PubMed] [Google Scholar]
- 50.Prévost J., Gasser R., Beaudoin-Bussières G., Richard J., Duerr R., Laumaea A., Anand S.P., Goyette G., Benlarbi M., Ding S. Cross-sectional evaluation of humoral responses against SARS-CoV-2 Spike. Cell Rep. Med. 2020;1:100126. doi: 10.1016/j.xcrm.2020.100126. [DOI] [PMC free article] [PubMed] [Google Scholar]
- 51.Hou Y.J., Okuda K., Edwards C.E., Martinez D.R., Asakura T., Dinnon K.H., 3rd, Kato T., Lee R.E., Yount B.L., Mascenik T.M. SARS-CoV-2 reverse genetics reveals a variable infection gradient in the respiratory tract. Cell. 2020;182:429–446.e14. doi: 10.1016/j.cell.2020.05.042. [DOI] [PMC free article] [PubMed] [Google Scholar]
- 52.Chu H., Chan J.F.-W., Yuen T.T.-T., Shuai H., Yuan S., Wang Y., Hu B., Yip C.C., Tsang J.O., Huang X. Comparative tropism, replication kinetics, and cell damage profiling of SARS-CoV-2 and SARS-CoV with implications for clinical manifestations, transmissibility, and laboratory studies of COVID-19: an observational study. Lancet Microbe. 2020;1:e14–e23. doi: 10.1016/S2666-5247(20)30004-5. [DOI] [PMC free article] [PubMed] [Google Scholar]
- 53.Hui K.P.Y., Cheung M.-C., Perera R.A.P.M., Ng K.-C., Bui C.H.T., Ho J.C.W., Ng M.M.T., Kuok D.I.T., Shih K.C., Tsao S.W. Tropism, replication competence, and innate immune responses of the coronavirus SARS-CoV-2 in human respiratory tract and conjunctiva: an analysis in ex-vivo and in-vitro cultures. Lancet Respir. Med. 2020;8:687–695. doi: 10.1016/S2213-2600(20)30193-4. [DOI] [PMC free article] [PubMed] [Google Scholar]
- 54.Vivier E., Nunès J.A., Vély F. Natural killer cell signaling pathways. Science. 2004;306:1517–1519. doi: 10.1126/science.1103478. [DOI] [PubMed] [Google Scholar]
- 55.Han X., Zhou Z., Fei L., Sun H., Wang R., Chen Y., Chen H., Wang J., Tang H., Ge W. Construction of a human cell landscape at single-cell level. Nature. 2020;581:303–309. doi: 10.1038/s41586-020-2157-4. [DOI] [PubMed] [Google Scholar]
- 56.Sterlin D., Mathian A., Miyara M., Mohr A., Anna F., Claër L., Quentric P., Fadlallah J., Devilliers H., Ghillani P. IgA dominates the early neutralizing antibody response to SARS-CoV-2. Sci. Transl. Med. 2021;13:eabd2223. doi: 10.1126/scitranslmed.abd2223. [DOI] [PMC free article] [PubMed] [Google Scholar]
- 57.Carsetti R., Zaffina S., Piano Mortari E., Terreri S., Corrente F., Capponi C., Palomba P., Mirabella M., Cascioli S., Palange P. Different innate and adaptive immune responses to SARS-CoV-2 infection of asymptomatic, mild, and severe cases. Front. Immunol. 2020;11:610300. doi: 10.3389/fimmu.2020.610300. [DOI] [PMC free article] [PubMed] [Google Scholar]
- 58.Krammer F. SARS-CoV-2 vaccines in development. Nature. 2020;586:516–527. doi: 10.1038/s41586-020-2798-3. [DOI] [PubMed] [Google Scholar]
- 59.Schäfer A., Muecksch F., Lorenzi J.C.C., Leist S.R., Cipolla M., Bournazos S., Schmidt F., Gazumyan A., Baric R.S., Robbiani D.F. Antibody potency, effector function and combinations in protection from SARS-CoV-2 infection in vivo. bioRxiv. 2020 doi: 10.1101/2020.09.15.298067. [DOI] [PMC free article] [PubMed] [Google Scholar]
- 60.Winkler E.S., Gilchuk P., Yu J., Bailey A.L., Chen R.E., Chong Z., Zost S.J., Jang H., Huang Y., Allen J.D. Human neutralizing antibodies against SARS-CoV-2 require intact Fc effector functions for optimal therapeutic protection. Cell. 2021;184:1804–1820.e16. doi: 10.1016/j.cell.2021.02.026. [DOI] [PMC free article] [PubMed] [Google Scholar]
- 61.Alter G., Yu W.-H., Chandrashekar A., Borducchi E.N., Ghneim K., Sharma A., Nedellec R., McKenney K.R., Linde C., Broge T. Passive transfer of vaccine-elicited antibodies protects against SIV in Rhesus macaques. Cell. 2020;183:185–196.e14. doi: 10.1016/j.cell.2020.08.033. [DOI] [PMC free article] [PubMed] [Google Scholar]
- 62.Henry Dunand C.J., Leon P.E., Huang M., Choi A., Chromikova V., Ho I.Y., Tan G.S., Cruz J., Hirsh A., Zheng N.Y. Both neutralizing and non-neutralizing human H7N9 influenza vaccine-induced monoclonal antibodies confer protection. Cell Host Microbe. 2016;19:800–813. doi: 10.1016/j.chom.2016.05.014. [DOI] [PMC free article] [PubMed] [Google Scholar]
- 63.Rosado J., Pelleau S., Cockram C., Merkling S.H., Nekkab N., Demeret C., Meola A., Kerneis S., Terrier B., Fafi-Kremer S. Multiplex assays for the identification of serological signatures of SARS-CoV-2 infection: an antibody-based diagnostic and machine learning study. Lancet Microbe. 2021;2:e60–e69. doi: 10.1016/S2666-5247(20)30197-X. [DOI] [PMC free article] [PubMed] [Google Scholar]
Associated Data
This section collects any data citations, data availability statements, or supplementary materials included in this article.
Supplementary Materials
The syncytia appear in green (GFP). PI was added to monitor cell death and appears in red. The NK cell that comes and contacts the infected cell is indicated with a white arrowhead. Time post addition of NK cells and serum is indicated. Scale bar: 30 μm.
Data Availability Statement
This study did not generate or analyze datasets or code.