

Abstract
Objective.
Exhaled breath condensate (EBC) 8-isoprostane concentrations are increased in asthma, but it is not known if they acutely change following bronchoprovocation. The objective of this study was to evaluate EBC 8-isoprostane concentrations following allergen-induced bronchoprovocation in asthma.
Methods.
This comparison study included eight mild atopic asthmatics and six controls. Asthmatics were challenged with inhaled specific allergen, methacholine, and irrelevant allergen in random order. Controls were challenged with irrelevant allergen. EBCs collected at 0, 3, 6, 9, and 23 hours by the R-tube method were measured for 8-isoprostanes by ELISA technique. Repeated measures ANOVA technique was used for analysis.
Results.
EBC 8-isoprostane concentrations did not change following any inhalational challenge, as compared to baseline, in either asthmatics or controls.
Conclusions.
EBC 8-isoprostane concentrations do not acutely change following bronchoprovocation in subjects with mild asthma.
Keywords: 8-isoprostanes, allergen bronchoprovocation, asthma, exhaled breath condensate, oxidant stress
Introduction
Exhaled breath condensate (EBC) is obtained by cooling and collecting exhaled breath in a cold trap. It is a noninvasive technique to analyze the airway lining fluid for nonvolatile molecules (1). The mechanisms that contribute to the presence of nonvolatile molecules in EBC have not yet been elucidated, but the formation of an aerosol during reopening of alveoli or at the branching of small airways is a likely mechanism. The collection procedure itself has no influence on airway function or inflammation. Although mostly water vapor, EBC contains multiple constituents such as small molecules, proteins, and DNA (2). Recent studies have investigated the use of EBC for measuring airway oxidant stress in lung diseases.
Oxidant stress is characterized by an imbalance between increased exposure to free radicals, principally derived from oxygen, and antioxidant defenses. Lipids are a major target of free radical attack, which induces lipid peroxidation. There is increased generation of oxidants and lipid peroxidation products both in the lungs and in the urine and plasma of patients with asthma (3). One of the major candidates for clinical measurement of oxidant stress in vivo is F2-isoprostanes, a class of prostanoids formed by free radical–catalyzed lipid peroxidation of arachidonic acid. The most prevalent F2-isoprostane in humans is 8-epi-PGF2α or 15F2t-IsoP, also known as 8-isoprostane. 8-Isoprostanes can be detected in EBC by enzyme-linked immunosorbent assay (ELISA), radioimmunoassay (RIA), and gas chromatography mass spectrometry (GCMS) assay (4). EBC 8-isoprostane levels are increased in both adults and children with asthma and positively associated with asthma severity (5, 6). Unlike exhaled nitric oxide, EBC 8-isoprostane concentrations do not appreciably change with treatment with corticosteroids (4-6), suggesting that EBC 8-isoprostanes may reflect disease status, independent of therapeutic interventions.
Following an allergen-induced bronchoprovocation, urine and bronchoalveolar lavage fluid 8-isoprostane concentrations increase among subjects with asthma (7), suggesting that acute oxidant injury occurs in the setting of allergic inflammation. It is, however, unclear whether EBC can similarly detect acute changes in oxidant stress in the airway lining fluid, following a similar allergen challenge among subjects with asthma. Our objective was to evaluate acute changes in airway oxidant stress, using EBC 8-isoprostane concentrations, following allergen bronchoprovocation in asthma. We hypothesized that experimental allergen inhalation in sensitized subjects with asthma would result in an acute increase in airway oxidant stress, as reflected by an increase in concentrations of EBC 8-isoprostanes, as measured primarily using the ELISA technique.
Methods
EBC Collection and Processing.
EBC was collected, as per the American Thoracic Society/European Respiratory Society (ATS/ERS) guidelines (8), using an R-tube (Respiratory Research, Inc., Austin, TX) by asking the subject to breathe tidally via a mouthpiece through a non-rebreathing valve, thus separating the inspiratory and expiratory air. The expired air flowed through a condenser (precooled to −70°C), and approximately 3 mL of breath condensate was collected during a period of 20–30 minutes (9). Multiple EBC samples were obtained: the first just before the start of the challenge and again at 3, 6, 9, and 23 hours after the challenge. Immediately following collection, EBC was stored at −70°C. Before its analysis by ELISA assay, EBC was concentrated 14-fold using a lyophilizer (LabConCo, Kansas City, MO) (10).
First Stage: “Spike and Recovery” Experiment for 8-Isoprostanes in EBC Using ELISA Technique
Our first stage involved an experiment in which “spikes” of 40 pg of purified 8-isoprostane (Cayman Chemical Co.) was added to 1 mL samples of EBC. After 14-fold concentration by lyophilization and using the ELISA technique described below, 109% of the anticipated values were recovered from the reconstituted sample, confirming the suitability of the ELISA assay. Additionally, EBC 8-isoprostane samples collected in Tween-20 coated versus uncoated apparatus were compared to evaluate the benefit of precoating the collection apparatus with low concentrations of detergent, on the basis of the potential for adsorption of the 8-isoprostane to the surface of the collection chamber (11). After correction for the 14-fold concentration, the results showed no significant difference in the concentrations of 8-isoprostane between samples collected (1.2 ± 0.5 pg/mL) without Tween-20 versus (1.5 ± 0.1 pg/mL) with Tween-20 (p > .05). Following this first stage, it was decided to use collection apparatus without precoating with Tween-20. We also measured the spiked samples with and without lyophilization and found similar results. We therefore concluded that lyophilization did not adversely affect EBC 8-isoprostane concentrations.
Second Stage: Interventional Studies Measuring 8-Isoprostanes in EBC Using ELISA Technique (Primary Study)
Our second stage involved a comparison study including eight sensitized subjects with mild atopic asthma and six healthy controls. Asthma was defined by the presence of all the following criteria—physician diagnosis based upon standard guidelines (12), confirmed skin test “atopy,” presence of nonspecific airway hyper-reactivity (methacholine PC20 of ≤ 16 mg/mL), and presence of specific airway reactivity to either Juniper-Mountain cedar or Bermuda grass allergen inhalation (i.e., FEV1 decline of ≥20%) on screening evaluation. Controls were defined as those that met none of the first three criteria. Seven of the eight subjects with asthma had intermittent disease severity, as defined by “no use of daily medications with short-acting inhaled α2 agonists as needed” to maintain “good asthma control” (12, 13). This phenotype was chosen to minimize serious adverse reactions to allergen inhalation and to minimize the confounding effect of asthma medications. Atopy was defined as immediate-type skin test reactivity (at least 3 mm wheal diameter and no wheal in response to normal saline) to at least one aeroallegen common in the Albuquerque area. The allergens tested in duplicate by a skin prick test were Cottonwood, Juniper-Mountain cedar, Bermuda grass, Kentucky bluegrass, Meadow fescue grass, Russian thistle, Kochia, Western ragweed, Cat hair, Dust mites Dermatophagoides farinae, and Dermatophagoides pteronyssinus (Greer Labs, Lenoir, NC).
Inclusion and Exclusion Criteria.
The study included English speaking adults and excluded those with history of diabetes; abnormal fasting glucose; use of anti-diabetes medications; history of atherosclerotic cardiovascular disease or abnormal electrocardiogram suggestive of the same; use of statins; history of chronic infectious or active inflammatory or active neoplastic conditions; use of systemic corticosteroids, leukotriene receptor antagonists, or cromolyn in the previous 3 months or allergen immunotherapy within the previous 5 years; presence of HIV risk factors; history of abnormal chest radiograph; elevated serum creatinine (>1.8 mg/dL in men and >1.5 mg/dL in women (14)); current history of smoking; or use of supplemental reproductive hormones. In addition, the exposure challenge tests were delayed in the event of a known acute infection or surgery within the prior 4 weeks and known respiratory tract infections within the prior 8 weeks. The study protocol (HRRC-06-232) was approved by the local institutional review board at the University of New Mexico. Informed consent was obtained from all study participants.
Exposures.
All subjects were studied with one or three inhalational challenge/s in random order (as outlined in Table 1). All subjects inhaled incremental concentrations of an irrelevant allergen to which they were not sensitive, that is, associated with a negative skin prick test. Additionally, subjects with asthma underwent inhalational challenges with incremental doses of a non-immunological stimulus (methacholine) (15, 16) and a specific allergen (to which the subject was sensitive, i.e., associated with a positive skin prick test) (17). The specific allergens used were Bermuda grass (n = 3) and Juniper-Mountain Cedar (n = 5; Greer Labs, Lenoir, NC). The starting dose of the specific allergen challenge was determined by a titration skin allergen prick test (18). The inhalational challenges for the cases were in random order, each on a separate visit, with a window of at least 72 hour duration following irrelevant allergen and methacholine challenges and of at least 7-day duration following specific allergen challenge, to minimize the “carry-over” effect on subsequent test results. For actively menstruating women, the testing was done within 3–14 days following the cessation of menstrual flow to minimize the potential effect of menstrual cycles on airway oxidant stress. Wherever possible, the phlebotomists, technicians, and nurses conducting the various tests were blinded to the exposure status of the cases and controls.
TABLE 1.—
List of inhalational challenges performed in random order.
| Sensitized subjects with asthma | Non-atopic healthy controls |
|---|---|
| Irrelevant allergen inhalation (allergen tested negative on skin prick test on screening evaluation or I-A test) Methacholine inhalation (non-immunological stimulus or M-A test) Specific allergen inhalation (allergen tested positive on skin prick test on screening evaluation and starting challenge dose subsequently evaluated on titration skin allergen prick test or S-A) |
Irrelevant allergen inhalation (allergen tested negative on skin prick test on screening evaluation or I-C) |
Note: For the final stage, a subset of asthmatics was also tested with no inhalational challenge.
Inhalational Challenge Tests.
The challenges, as outlined in Table 1, were performed at 0700 hours in a fasting state with medications withheld before the test as outlined in the ATS guidelines (19, 20). Irrelevant allergen inhalational challenge was performed on both cases (I-A) and controls (I-C), with a commercially available allergen to which they were not sensitized (i.e., not associated with a positive skin prick test). In the event that such an allergen was not available (as some atopic asthmatics had multiple positive skin tests), a saline inhalation challenge was performed with an equal number of steps. Non-immunological stimulus (methacholine) inhalational challenge was performed on cases (M-A) using the Cockcroft modification of the methods of Chai et al. (15, 16). Briefly, subjects inhaled each of the following increasing concentrations (0.15, 0.31, 0.62, 1.25, 2.5, 5.0, 10.0, 16, and 25 mg/mL) of methacholine by tidal breathing via a nebulizer through a Rosenthal-French dose-metering device until the FEV1 decreased by at least 20% from baseline values. Specific or sensitizing allergen inhalational challenge (S-A) was performed with an allergen to which the cases were sensitive to using the protocol published in literature by Gerblich et al. (17). Allergen was inhaled via a nebulizer through a similar dose-metering device until the FEV1 decreased by at least 20% from baseline, starting at three to four half-logarithmic concentration below that caused skin test positivity (18).
Outcomes.
The outcomes included EBC 8-isoprostane challenge response curves, area under the curves (using the trapezoid rule), and peak and baseline concentrations.
Comparison of EBC 8-Isoprostane ELISA and GCMS Assays.
EBC 8-isoprostane concentrations were initially compared between ELISA and gas chromatography negative ion chemical ionization mass spectrometry techniques (21, 22). For the former, a commercially available assay using the competitive ELISA technique (Cayman Chemical, Ann Arbor, MI) was used. For the latter, 8-isoprostane was purified using affinity columns containing anti-8-isoprostane antibody (Cayman Chemical, Ann Arbor, MI) and analysis performed on a Hewlett-Packard 5890 Series II gas chromatograph (Hewlett-Packard, Bracknell, UK) linked to a Trio 1000 (DSR, Warrington, UK) mass spectrometer with chemical ionization capability. Since our initial comparison revealed that the ELISA was more sensitive than the GCMS assay, subsequent measurements were primarily performed in duplicate using ELISA. The sensitivity and useful range of the ELISA assay was 3.9 and 3.9–500 pg/mL, respectively.
EBC 8-Isoprostane Test Characteristics, Using ELISA.
Of the 150 EBC samples collected, two were missing at the time of analysis and 18 had sufficient volumes to run singlets only. The remaining 130 samples (86.7% of all samples drawn) were tested in duplicate. Of the 278 total number of tests performed (both singlets and duplicates), 25 samples (9.0%) were outside the valid linear range of the assay despite the 14-fold concentration. These samples included 19 and 6 samples (6.8% and 2.2%, respectively) that were below and above the linear range of the assay, respectively. Since the values of these six samples were several folds higher than the next highest samples, they were considered as outliers and not analyzed. In addition, the 19 EBC samples below the sensitivity cutpoint of 3.9 pg/mL were given an arbitrary value of 1.95 pg/mL, half the value of the sensitivity cutpoint.
Third Stage: Repeat Interventional Studies Measuring 8-Isoprostanes in EBC Using RIA Technique
In the final stage of experiments, we repeated the specific allergen inhalational challenge in a subset of subjects with asthma (n = 4) and compared them with no inhalational challenge (no spirometries were performed in the latter case). The EBC specimens were similarly collected and processed but analyzed in duplicate for 8-isoprostanes using RIA technique instead of ELISA.
EBC 8-Isoprostane Assay, Using RIA Technique.
A previously described antiserum against 8-isoprostane (Rab 1) was used for the RIA assay (3). A 250 μL aliquot of the reconstituted EBC sample was added to 1250 μL of assay buffer (phosphate 0.025 M, pH 7.5) containing approximately 2500 dpm of [3H]8-isoprostane, which was mixed with appropriately diluted antiserum and incubated for 24–30 hours at 4°C (23). Approximately, 40%–45% binding of the labeled hapten was obtained when 8-isoprostane antiserum was used at a final dilution of 1:200,000. 8-Isoprostane standard competes with the binding of the homologous tracer in a linear fashion over the range from 2 to 250 pg/mL (24). Separation of antibody bound from free [3H]8-isoprostane was achieved by rapidly adding 0.1 mL of a 5% bovine serum albumin solution and 0.1 mL of a charcoal suspension (70 mg/mL) and subsequent centrifugation at 4°C for 10 min at 5000 rpm (3000g) (24). Supernatant solutions containing antibody-bound 8-isoprostane were decanted directly into 10 mL scintillation liquid. Radioactivity was counted in a liquid scintillation counter. Data were processed using a computer that was programmed to correct for nonspecific binding. This approach has been previously validated by reverse phase high performance liquid chromatography (23). The previously published intra-assay and inter-assay coefficients of variation for 8-isoprostane with this approach are ±2.0% and ±2.9% at 2 pg/mL, the lowest standard concentrations are ±3.7% and ±10.8% at 250 pg/mL, the highest standard concentration (23).
Statistical Analysis of Data.
For the primary study (Stage 2), data were first corrected for the 14-fold concentration and then transformed using logarithms to the base 10, after adding 0.5 to all values of EBC 8-isoprostane. The logarithmic transformation was performed because of the non-normal distribution of data. Furthermore, there was an indication of increasing variability with increasing mean, indicating a potential need for logarithmic transformation. The analysis of response of outcome measures at subsequent time points to a challenge, with respect to the baseline level, was made by a repeated measures (RM) ANOVA, with both the three challenges and time as repeated factors using SAS (PROC-MIXED). The outcomes between cases and controls were also compared by RM-ANOVA, using case status as the grouping factor and time as the repeated factor. If there were significant differences, post-hoc testing with paired t-tests was performed as appropriate. Statistical significance was accepted as p < .05. The study protocol was approved by the University of New Mexico’s Human Research Protection Office (6-232).
Sample Size and Power Estimates.
Based on previous studies (7, 25, 26) and assuming a modest correlation of 0.7 between the baseline and follow-up values, the SD of the difference was estimated at 0.5–7.0 pg/mL for EBC 8-isoprostane. Based on these estimates, the minimally detectable difference for EBC 8-isoprostane following allergen bronchoprovocation was further estimated to be 0.5–8.0 pg/mL for the eight asthmatics and 0.9–12 pg/mL between the eight asthmatics and six controls with five repeated measures with 80% power (the absolute differences published in the literature were 10.5 pg/mL for bronchoalveolar lavage 8-isoprostanes (7) and 13.0–22.2 pg/mL for EBC 8-isoprostanes (6)).
Results
The primary study included eight subjects with mild atopic asthma (cases; PC20 of 10.5 ± 9.9 mg/mL) and six controls. The majority of enrolled subjects were premenopausal overweight women (see Table 2). Seven of the eight cases had intermittent severity of asthma, with one having mild persistent asthma requiring inhaled corticosteroids. After correction for the 14-fold concentration, the baseline values for ELISA-assessed EBC 8-isoprostane among the eight asthmatics (obtained from the mean of the three baseline values before each challenge, 2.50 ± 0.99 pg/mL) was not significantly higher than that for the five controls for whom data was available (1.54 ± 1.39 pg/mL, p = .22; baseline EBC sample for one control was lost during storage—the study was not powered to examine differences between asthmatics and controls in chronic or baseline airway oxidant stress).
TABLE 2.—
Baseline characteristics of study subjects.
| Characteristic | Asthma (n = 8) | Controls (n = 6) |
|---|---|---|
| Women* | 5 | 4 |
| Pre-menopausal* | 4/5 | 4/4 |
| Age (in years)* | 31.4 ± 8.5 | 39.9 ± 9.7 |
| White race* | 7 | 4 |
| Ex-smokers* | 2 | 3 |
| Age of onset of asthma (years) | 12.4 ± 5.4 | N/A |
| Use of inhaled corticosteroids | 1 | 0 |
| Confirmed skin test atopy to common aeroallergens | 8 | 0 |
| Body composition measurements | ||
| Body mass index (kg/m2)* | 26.4 ± 4.9 | 29.4 ± 6.6 |
| Waist circumference (cm)* | 86.8 ± 14.0 | 91.7 ± 9.8 |
| Triceps skinfold thickness (mm)* | 19.9 ± 5.9 | 22.9 ± 9.9 |
| Percent body fat (DEXA)* | 35.1 ± 6.3 | 38.8 ± 12.3 |
| Percent truncal fat (DEXA)* | 37.9 ± 7.2 | 42.3 ± 11.4 |
| Insulin resistance (HOMA units)* | 2.4 ± 1.2 | 2.5 ± 1.7 |
| Inhalational challenge test results | ||
| Methacholine PC20 (mg/mL) | 10.5 ± 9.9 | N/A |
| Percent drop in FEV1 following methacholine challenge | 26.8 ± 8.9 | N/A |
| Percent drop in FEV1 following specific challenge | 28.8 ± 5.3 | N/A |
| Percent drop in FEV1 following irrelevant challenge* | −3.0 ± 5.2 | −2.8 ± 5.7 |
Note: Mean ± S.D. are reported.
Abbreviations: DEXA: Dual energy X-ray absorptiometry; HOMA: Homeostasis model assessment; N/A: Not applicable.
There was no significant difference between the two groups with respect to these variables (p > .05 for all analyses).
ELISA-Assessed EBC 8-Isoprostane Response to Inhalational Challenge
In the range of values measured after 14-fold EBC concentration, the manufacturer-suggested inter-assay and intra-assay coefficients of variation in buffer diluent were 24.3% and 6.4%, respectively. The measured intra-assay coefficient of variation in concentrated EBC in our study using ELISA technique was, however, 37.7 ± 32.5%. The measured inter-day coefficient of variation in EBC for the three baseline values among asthmatics in our study using the ELISA technique was, however, 71.6 ± 46.3%.
Following any inhalational challenge (in both cases and controls), there was no significant change in EBC 8-isoprostane concentrations compared to baseline, as suggested by the within-test paired t-test analyses (Table 3 and Figure 1). Further, there was no significant difference between the three challenges among subjects with asthma (S-A, M-A, and I-A) with respect to the challenge response curve, area under the curve, log baseline, and log peak values of EBC 8-isoprostane. Similar results were obtained when S-A was compared with I-C.
TABLE 3.—
Response of ELISA-assessed EBC 8-isoprostane measures (pg/mL) to inhalational challenge.
| Outcome measure | Specific allergen, asthma (S-A) |
Methacholine, asthma (M-A) |
Irrelevant allergen, asthma (I-A) |
Irrelevant allergen, controls (I-C) |
p-value—comparison of S-A, M-A & I-A |
p-value—comparison of S-A & I-C |
|
|---|---|---|---|---|---|---|---|
| Challenge response curves (log concentration) | .80 | .39 | |||||
| EBC 8-isoprostane | AUC | − 7.98 ± 32.21 | 2.20 ± 6.13 | −5.84 ± 16.09 | 6.76 ± 17.07 | .60 | .38 |
| Log baseline | 0.37 ± 0.40 | − 0.01 ± 0.59 | 0.26 ± 0.37 | −0.03 ± 0.55 | .31 | .22 | |
| Log peak | 0.30 ± 0.43 | 0.47 ± 0.62 | 0.24 ± 0.28 | 0.46 ± 0.71 | .61 | .64 | |
Notes: For challenge response curves, main effects due to test are reported from a RM-ANOVA analysis with time and challenge as the repeat factors.
AUC or Area under the curve for EBC isoprostane was obtained from four observations at −1 to +9 hours following the challenge after adjustment for the baseline value, using the trapezoid rule; Negative AUC suggests that the curve is overall below the baseline value.
Mean ± S.D. are reported (after correction for the 14-fold concentration of EBC in the assay process).
Abbreviations: AUC: Area under the curve; ELISA: enzyme-linked immunosorbent assay.
FIGURE 1.—
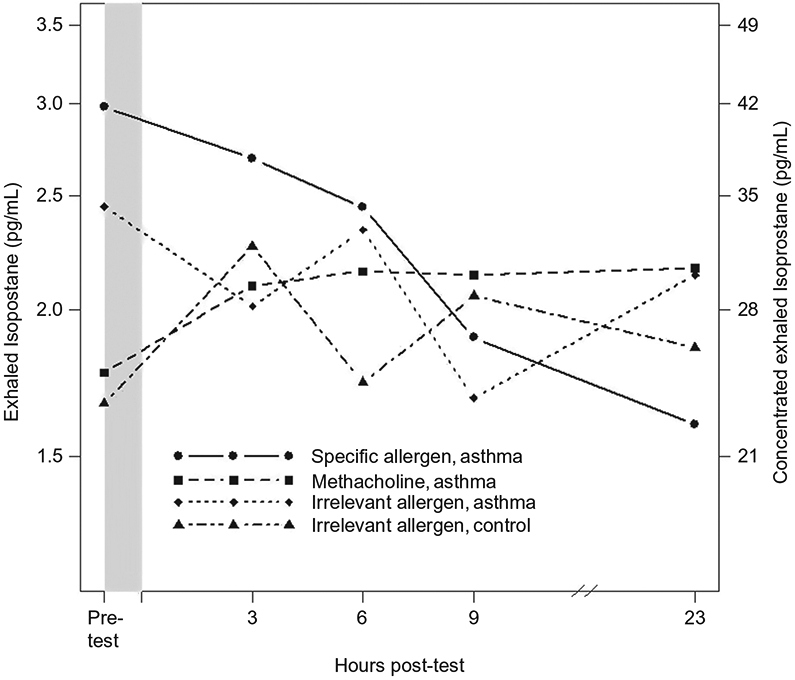
Response of EBC 8-isoprostanes (ELISA-assessed) to various inhalational challenges among asthmatics and healthy controls. The p-values for comparison between challenge response curves are presented in Table 3. The y-axis on the left reflects values for EBC 8-isoprostanes corrected for the 14-fold concentration and the axis on the right reflects values measured in concentrated EBC samples.
RIA-Assessed EBC 8-Isoprostane Response to Inhalational Challenge in a Subset of Asthmatics
The measured intra-assay coefficient of variation in EBC in our study using RIA technique was 26.3 ± 16.2%. The measured inter-day coefficient of variation in baseline values among asthmatics in our study using the RIA technique was 33.2 ± 13.1%. These values were higher than those previously reported in the literature (23). We also noted that RIA-assessed mean baseline 8-isoprostane concentrations were approximately tenfold higher than those assessed by ELISA on different days.
In the final stage of experiments, we repeated the specific allergen inhalational challenge in a subset of subjects with asthma (n = 4) and compared them with no inhalational challenge in the same subjects. Again, we noted no significant change in EBC 8-isoprostane concentration compared to baseline, as suggested by the within-test paired t-test analyses. Further, there was no significant difference between the two tests among subjects with asthma (S-A and N-A) with respect to the challenge response curve, area under the curve, log baseline, and log peak values of EBC 8-Isoprostane (Table 4).
TABLE 4.—
Response of RIA-assessed EBC 8-isoprostane measures (in pg/mL) to specific allergen inhalational challenge.
| Outcome measure | Specific allergen, asthma (S-A) | No challenge asthma (N-A) | p-value | |
|---|---|---|---|---|
| EBC 8-isoprostane | Challenge response curves (log concentration) | .50 | ||
| AUC | −44.91 ± 90.10 | −40.23 ± 79.15 | .91 | |
| Log baseline | 1.41 ± 0.19 | 1.41 ± 0.22 | .95 | |
| Log peak | 1.50 ± 0.14 | 1.49 ± 0.13 | .14 | |
Note: For challenge response curves, main effects due to test are reported from a RM-ANOVA analysis with time and challenge as the repeat factors. The curves are shown in Figure 1. AUC or Area under the curve for EBC isoprostane was obtained from four observations at −1 to +9 hours following the challenge after adjustment for the baseline value, using the trapezoid rule; Negative AUC suggests that the curve is overall below the baseline value.
Mean ± S.D. are reported
Abbreviations: AUC: Area under the curve; RIA: radioimmunoassay.
Discussion
EBC 8-isoprostane concentrations, as measured by the commercially available ELISA assay, do not acutely increase following bronchoprovocation by either specific allergen or methacholine inhalation in this study of mild atopic asthmatics. Similar results are seen with RIA assay of 8-isoprostanes in EBC. These EBC results are at variance with another study that showed an increase in bronchoalveolar lavage isoprostane concentrations following allergen challenge among a similar group of nine mild asthmatics (7).
We posit the following explanations for our results. Although our study was designed to detect an effect size published in the literature of 0.5–8.0 pg/mL for change in EBC 8-isoprostane with 80% power (5-7, 27), our study may have been underpowered and our results may therefore reflect a β-error. However, our post hoc evaluation of the SD of the differences was in the lower range of what we had postulated, suggesting that our power analysis (as discussed in the methods section) was indeed adequate. Furthermore, our use of logarithmic transformation of data resulted in a greater effect size than was postulated in the power analysis for our study. Further, our use of repeated measures analysis added power to our study, despite the relatively small number of asthmatics. Therefore, we do not believe that β-error alone explains our findings.
We noticed that the ELISA measurement of 8-isoprostanes showed greater intra-assay coefficient of variation in EBC than was suggested by the manufacturer in a buffer diluent. This may be secondary to assay-specific interference in the EBC matrix from other EBC constituents. Although all isoprostane analyses were performed in duplicate, it may have been better to analyze each sample in triplicate to decrease the random error related to variation in measurement. While this may have been a contributory factor toward our negative result, it is unlikely to be the only explanation since our estimated effect size was comparable to that reported with the ELISA assay of 8-isoprostanes in another study (27). Further, 8-isoprostane levels in unconcentrated EBC are often below the sensitivity cutpoint of the ELISA assay. This, however, does not explain our findings, since we concentrated our EBC samples 14-fold to ensure that 8-isoprostane levels would be measured in the linear range of the assay. Since only 19 (6.8%) samples were below the sensitivity cutpoint of the assay, our EBC concentration strategy was appropriate. Additionally, it is possible that our assignment of an arbitrary value of 1.95 pg/mL (half the value of the sensitivity cutpoint) to these 19 samples may have biased our results. We reanalyzed our results after excluding the 19 samples and after assigning them a value of 0 pg/mL and found similar results as described above.
Urine and bronchoalveolar lavage fluid 8-isoprostane concentrations have been shown to increase following an allergen challenge among patients with asthma (7). It is, however, possible that EBC does not reflect systemic oxidant injury (as measured by urine 8-isoprostanes). Further, it is possible that EBC and bronchoalveolar lavage fluid measure oxidant injury at different sites within the airway. It is also possible that performing an invasive procedure may itself cause airway oxidant injury, and this may have confounded the results in the study by Dworski et al. that lacked controls (7). We are unable to offer definite conclusions in this regard, since we did not simultaneously measure urine and bronchoalveolar lavage 8-isoprostanes in our primary study. Further, allergen was bronchoscopically instilled (and not inhaled) in the study by Dworski et al. and bronchoalveolar lavage fluid measured for 8-isoprostanes 24 hours later (and not serially over 23 hours as in our study). These differences in study design and differences in method variability and technical aspects such as EBC matrix interference, collection, storage, and transport conditions may explain the discrepant results between our study and that by Dworski et al.
Further, we studied 8-isoprostanes (which reflect the oxidant stress in the lipid-laden compartment) as the only marker of airway oxidant stress. It is possible that other markers of oxidant stress in the lipid-laden compartment or other compartments may yield different results. However, our choice of 8-isoprostanes was dictated by a previous study that had shown an increase in this compound following an allergen challenge (7). Further, 8-isoprostanes are considered the most specific in vivo markers of lipid peroxidation (28) and were therefore an appropriate outcome. It is possible that bronchoprovocation of overweight women with asthma does not significantly increase airway eosinophilic inflammation and oxidant stress, as compared to other asthma subgroups. This is, however, an unlikely explanation for our findings, since all subjects in our study were atopic (and therefore capable of mounting airway eosinophilic inflammation) and since overweight women demonstrate higher EBC 8-isoprostanes than normal-weight women (29). Our choice of mild asthma may have influenced our results since those with moderate or severe persistent disease may better show an increase in airway oxidant stress. Our choice of subjects was limited by safety concerns and need to avoid bias from medication use. Further, we tried to replicate the study by Dworski et al. who had examined mild asthmatics as well (7).
It is possible that RIA or GCMS assays may have yielded different results than the ELISA technique we used in our primary study. As mentioned previously, we did repeat a component of our primary study with RIA and found similar results with four asthmatics. Also mentioned previously, we did not find GCMS to be a suitably sensitive technique for measuring EBC 8-isoprostanes and, therefore, do not think that it would have detected a signal that ELISA was unable to detect.
In our primary study, the specific allergen and methacholine inhalational states were compared to a control state where multiple spirometry tests were performed at multiple time points. It is possible that the repeated acts of performing multiple spirometries themselves produced airway oxidant stress, raised EBC 8-isoprostane concentrations, and therefore biased our results toward a null association. To correct for this limitation, we changed our control state in the third stage of our study to be free of any inhalation challenge or spirometry maneuver and found similar results as the primary study.
Our study seemingly contradicts other studies that have established EBC 8-isoprostane concentrations to be elevated in asthma (5, 6). However, we believe that while EBC 8-isoprostanes may truly reflect chronic airway oxidant stress, this biomarker may not accurately measure acute changes in airway oxidant stress levels in mild asthmatics. Since our objective was to detect acute changes in airway oxidant stress from an experimental manipulation, we did not power our study to confirm the previously reported differences in chronic (baseline) airway oxidant stress between our mild asthmatics and controls.
The strengths of our study include our careful phenotyping of asthma and controls: use of concentration techniques by lyophilization to correct for the dilute nature of EBC; use of multiple assay techniques to measure EBC 8-isoprostanes; and use of multiple acute interventions with repeated measures design to test an innovative hypothesis. Our major limitation is our inability to simultaneously measure urine and bronchoalveolar lavage 8-isoprostane concentrations. However, repeated bronchoscopic sampling may itself affect the airway oxidant stress level and introduce bias in serial measurement of EBC 8-isoprostanes concentrations in this experiment.
Conclusions/Key findings
EBC 8-isoprostane concentrations do not increase following acute bronchoprovocation by either specific allergen or methacholine inhalation in asthma. We postulate that while EBC 8-isoprostanes may truly reflect chronic airway oxidant stress, this biomarker may not accurately measure acute changes in airway oxidant stress levels after allergen- or methacholine-induced bronchoprovocation in patients with mild asthma. Further research on both EBC measurement of 8-isoprostanes and other biomarkers of airway oxidant stress is needed to shed light on this subject.
Footnotes
Declaration of interest
The authors report no conflicts of interest. The authors alone are responsible for the content and writing of the paper.
References
- 1.Gessner C, Stenglein S, Brautigam M, Muller A, Schauer J. Miflonide/Foradil via Aerolizer compared with other anti-inflammatory and anti-obstructive therapeutic regimens. Pneumologie. 2003;57(3):137–143. [DOI] [PubMed] [Google Scholar]
- 2.Montuschi P, Barnes PJ. Analysis of exhaled breath condensate for monitoring airway inflammation. Trends Pharmacol Sci 2002; 23 (5):232–237. [DOI] [PubMed] [Google Scholar]
- 3.Montuschi P, Barnes PJ. Isoprostanes and asthma. Drug Discov Today Ther Strateg 2006; 3:287–292. [Google Scholar]
- 4.Kharitonov SA, Barnes PJ. Exhaled markers of pulmonary disease. Am J Respir Crit Care Med 2001; 163(7):1693–1722. [DOI] [PubMed] [Google Scholar]
- 5.Montuschi P, Corradi M, Ciabattoni G, Nightingale J, Kharitonov SA, Barnes PJ. Increased 8-isoprostane, a marker of oxidative stress, in exhaled condensate of asthma patients. Am J Respir Crit Care Med 1999; 160(1):216–220. [DOI] [PubMed] [Google Scholar]
- 6.Baraldi E, Ghiro L, Piovan V, Carraro S, Ciabattoni G, Barnes PJ, Montuschi P. Increased exhaled 8-isoprostane in childhood asthma. Chest 2003; 124(1):25–31. [DOI] [PubMed] [Google Scholar]
- 7.Dworski R, Murray JJ, Roberts LJ 2nd, Oates JA, Morrow JD, Fisher L, Sheller JR. Allergen-induced synthesis of F(2)-isoprostanes in atopic asthmatics. Evidence for oxidant stress. Am J Respir Crit Care Med 1999; 160(6):1947–1951. [DOI] [PubMed] [Google Scholar]
- 8.Horvath I, Hunt J, Barnes PJ, Alving K, Antczak A, Baraldi E, Becher G, van Beurden WJ, Corradi M, Dekhuijzen R, Dweik RA, Dwyer T, Effros R, Erzurum S, Gaston B, Gessner C, Greening A, Ho LP, Hohlfeld J, Jobsis Q, Laskowski D, Loukides S, Marlin D, Montuschi P, Olin AC, Redington AE, Reinhold P, van Rensen EL, Rubinstein I, Silkoff P, Toren K, Vass G, Vogelberg C, Wirtz H. Exhaled breath condensate: Methodological recommendations and unresolved questions. Eur Respir J 2005; 26(3):523–548. [DOI] [PubMed] [Google Scholar]
- 9.Gessner C, Kuhn H, Seyfarth HJ, Pankau H, Winkler J, Schauer J, Wirtz H. Factors influencing breath condensate volume. Pneumologie 2001; 55 (9):414–419. [DOI] [PubMed] [Google Scholar]
- 10.Sack U, Scheibe R, Wotzel M, Hammerschmidt S, Kuhn H, Emmrich F, Hoheisel G, Wirtz H, Gessner C. Multiplex analysis of cytokines in exhaled breath condensate. Cytometry A 2006; 69(3):169–172. [DOI] [PubMed] [Google Scholar]
- 11.Tufvesson E, Bjermer L. Methodological improvements for measuring eicosanoids and cytokines in exhaled breath condensate. Respir Med 2006; 100(1):34–38. [DOI] [PubMed] [Google Scholar]
- 12.Expert Panel Report. 3 (EPR-3): Guidelines for the diagnosis and management of asthma-summary report 2007. J Allergy Clin Immunol 2007; 120(5 Suppl): S94–S138. [DOI] [PubMed] [Google Scholar]
- 13.Williams SG, Schmidt DK, Redd SC, Storms W. Key clinical activities for quality asthma care. Recommendations of the National Asthma Education and Prevention Program. MMWR Recomm Rep 2003; 52 (RR-6):1–8. [PubMed] [Google Scholar]
- 14.Steffes MW, Gross MD, Schreiner PJ, Yu X, Hilner JE, Gingerich R, Jacobs DR Jr. Serum adiponectin in young adults–interactions with central adiposity, circulating levels of glucose, and insulin resistance: The CARDIA study. Ann Epidemiol 2004; 14(7):492–498. [DOI] [PubMed] [Google Scholar]
- 15.Chai H, Farr RS, Froehlich LA, Mathison DA, McLean JA, Rosenthal RR, Sheffer AL, Spector SL, Townley RG. Standardization of bronchial inhalation challenge procedures. J Allergy Clin Immunol 1975; 56 (4):323–327. [DOI] [PubMed] [Google Scholar]
- 16.Allen ND, Davis BE, Hurst TS, Cockcroft DW. Difference between dosimeter and tidal breathing methacholine challenge: Contributions of dose and deep inspiration bronchoprotection. Chest 2005; 128 (6):4018–4023. [DOI] [PubMed] [Google Scholar]
- 17.Gerblich AA, Campbell AE, Schuyler MR. Changes in T-lymphocyte subpopulations after antigenic bronchial provocation in asthmatics. N Engl J Med 1984; 310(21):1349–1352. [DOI] [PubMed] [Google Scholar]
- 18.Allergen Challenge Protocol, AAAI recommendation. Available at: http://www.aaaai.org/members/only/teaching_slides/ [database on the Internet] 2004. Accessed July 1, 2005.
- 19.Crapo RO, Casaburi R, Coates AL, Enright PL, Hankinson JL, Irvin CG, MacIntyre NR, McKay RT, Wanger JS, Anderson SD, Cockcroft DW, Fish JE, Sterk PJ. Guidelines for methacholine and exercise challenge testing-1999. This official statement of the American Thoracic Society was adopted by the ATS Board of Directors, July 1999. Am J Respir Crit Care Med 2000; 161(1):309–329. [DOI] [PubMed] [Google Scholar]
- 20.Miller MR, Hankinson J, Brusasco V, Burgos F, Casaburi R, Coates A, Crapo R, Enright P, van der Grinten CPM, Gustafsson P, Jensen R, Johnson DC, MacIntyre N, McKay R, Navajas D, Pedersen OF, Pellegrino R, Viegi G. Standardisation of spirometry. Eur Respir J 2005; 26:319–338. [DOI] [PubMed] [Google Scholar]
- 21.Moloney ED, Mumby SE, Gajdocsi R, Cranshaw JH, Kharitonov SA, Quinlan GJ, Griffiths MJ. Exhaled breath condensate detects markers of pulmonary inflammation after cardiothoracic surgery. Am J Respir Crit Care Med 2004; 169(1):64–69. [DOI] [PubMed] [Google Scholar]
- 22.Roberts LJ 2nd, Moore KP, Zackert WE, Oates JA, Morrow JD. Identification of the major urinary metabolite of the F2-isoprostane 8-iso-prostaglandin F2alpha in humans. J Biol Chem 1996; 271 (34):20617–20620. [DOI] [PubMed] [Google Scholar]
- 23.Montuschi P, Ragazzoni E, Valente S, Corbo G, Mondino C, Ciappi G, Ciabattoni G. Validation of 8-isoprostane and prostaglandin E(2) measurements in exhaled breath condensate. Inflam Res. [Clinical Trial Research Support, Non-U.S. Gov’t] 2003; 52(12):502–507. [DOI] [PubMed] [Google Scholar]
- 24.Wang Z, Ciabattoni G, Creminon C, Lawson J, Fitzgerald GA, Patrono C, Maclouf J. Immunological characterization of urinary 8-epi-prostaglandin F2 alpha excretion in man. J Pharmacol Exp Therap. [Research Support, Non-U.S. Gov’t] 1995; 275(1):94–100. [PubMed] [Google Scholar]
- 25.Fallo F, Scarda A, Sonino N, Paoletta A, Boscaro M, Pagano C, Federspil G, Vettor R. Effect of glucocorticoids on adiponectin: A study in healthy subjects and in Cushing’s syndrome. Eur J Endocrinol 2004; 150(3):339–344. [DOI] [PubMed] [Google Scholar]
- 26.Janssen JA, Huizenga NA, Stolk RP, Grobbee DE, Pols HA, de Jong FH, Attanasio AM, Blum WF, Lamberts SW. The acute effect of dexamethasone on plasma leptin concentrations and the relationships between fasting leptin, the IGF-I/IGFBP system, dehydroepiandrosterone, androstenedione and testosterone in an elderly population. Clin Endocrinol (Oxf) 1998; 48(5):621–626. [DOI] [PubMed] [Google Scholar]
- 27.Zanconato S, Carraro S, Corradi M, Alinovi R, Pasquale MF, Piacentini G, Zacchello F, Baraldi E. Leukotrienes and 8-isoprostane in exhaled breath condensate of children with stable and unstable asthma. J Allergy Clin Immunol. [Clinical Trial Comparative Study Research Support, Non-U.S. Gov’t] 2004; 113(2):257–263. [DOI] [PubMed] [Google Scholar]
- 28.Janicka M, Kot-Wasik A, Kot J, Namiesnik J. Isoprostanes-biomarkers of lipid peroxidation: Their utility in evaluating oxidative stress and analysis. Int J Mol Sci 2010; 11(11):4631–4659. [DOI] [PMC free article] [PubMed] [Google Scholar]
- 29.Komakula S, Khatri S, Mermis J, Savill S, Haque S, Rojas M, Brown L, Teague GW, Holguin F. Body mass index is associated with reduced exhaled nitric oxide and higher exhaled 8-isoprostanes in asthmatics. Respir Res 2007; 8:32. [DOI] [PMC free article] [PubMed] [Google Scholar]