


Abstract
Background
Ultrasound was first introduced in clinical dermatology in 1979. Since that time, ultrasound technology has continued to develop along with its popularity and utility.
Main text summary
Today, high-frequency ultrasound (HFUS), or ultrasound using a frequency of at least 10 megahertz (MHz), allows for high-resolution imaging of the skin from the stratum corneum to the deep fascia. This non-invasive and easy-to-interpret tool allows physicians to assess skin findings in real-time, enabling enhanced diagnostic, management, and surgical capabilities. In this review, we discuss how HFUS fits into the landscape of skin imaging. We provide a brief history of its introduction to dermatology, explain key principles of ultrasonography, and review its use in characterizing normal skin, common neoplasms of the skin, dermatologic diseases and cosmetic dermatology.
Conclusion
As frequency advancements in ultrasonography continue, the broad applications of this imaging modality will continue to grow. HFUS is a fast, safe and readily available tool that can aid in diagnosing, monitoring and treating dermatologic conditions by providing more objective assessment measures.
Keywords: High-frequency ultrasound, Dermatology, Diagnostic imaging, Ultrasonography
Introduction
Dermatology is among the rare specialties of medicine in which the organ of interest can be readily examined and biopsied. As a consequence, histology has become the gold standard for many dermatologic diagnoses. It has also allowed for clinicopathologic correlation to guide therapeutics and advance prognostics [1]. In the last few decades, a number of imaging modalities have been introduced to augment clinical exam or obviate the need for histology [2]. Some examples include total body digital photography (TBDP), dermoscopy, reflectance confocal microscopy (RCM), optical coherence tomography (OCT), and ultrasound. In this review, we discuss how ultrasound fits into the landscape of skin imaging. We provide a brief history of its introduction to dermatology, explain key principles of ultrasonography, and review its use in characterizing normal skin, common neoplasms of the skin, dermatologic diseases and cosmetic dermatology.
History of ultrasound in medicine
Sonography dates back to the late 1700s when two Italian zoologists discovered the acoustic orientation sense of bats [3]. Nearly a century later, the Curie brothers presented the piezoelectric effect of sound waves on natural quartz [4]. It was their observation that a force applied to the crystal produced an electric discharge. Conversely, an alternating electric current applied to a crystal produces vibrations that generate high-frequency sound waves called ultrasound [4, 5]. Over a half-century later, the technique was adapted by both the American military as SONAR and by an American Neurologist, Karl Dussik, who used ultrasound to detect brain tumors in patients [5].
Ultrasound emerged in the practice of dermatology around 1980 when two independent groups used the technique to measure skin thickness in normal and diseased skin [6]. Since then, the practice has gained popularity in several European and South American countries that incorporate its use in resident training and where its application is reimbursable [7, 8]. As the technology has improved, so has its utility. In an early study of over 4300 skin lesions, Wortsman et al. demonstrated the ability of higher frequency ultrasound (7–15 MHz) to significantly improve diagnostic accuracy. Compared to clinical examination alone, ultrasound corrected the referring diagnosis in 17% of cases and detected 3 missed malignancies [9]. The application of ultrasound in dermatology is continuously evolving and increasingly studied [10, 11].
Ultrasound technology and how it works
Ultrasound allows for high-resolution imaging of the skin from the stratum corneum down to the deep fascia [12]. Newer ultrasound technologies, including high-frequency ultrasound (HFUS, between 20 and 30 MHz) and ultra high-frequency ultrasound (UHFUS, > 30 MHz), have further enhanced imaging clarity and expanded upon the myriad applications for use of ultrasound in dermatology [11, 13, 14]. With fast acquisition times, ultrasound images are produced in real-time, allowing for physical adjustments and optimal imaging. Many devices include color Doppler analysis for characterization of blood flow and vessel morphology. It is readily available and can be easily incorporated into clinical practice [10, 11, 15].
The main component of the ultrasound device is the transducer—typically a handheld device containing thousands of piezoelectric crystals. These crystals, when stimulated by an electric voltage, generate millions of acoustic waves that pass through tissue and are reflected back to the transducer. As the waves return to the transducer, they are converted back into electrical energy interpreted by a computer. The computer then generates a one-dimensional line graph in amplitude mode (A-mode) that can be used to interpret echogenicity at various distances from the probe. In brightness mode (B-mode) an image is generated with different intensities of brightness.
These varying intensities are dependent upon the ultrasound waves’ ability to pass through the tissue. Bright or hyperechoic regions represent an abrupt increase in tissue density while dark or hypoechoic areas represent a decrease or no change in tissue density. A black anechoic region represents an area of tissue from which virtually no waves are reflected [5]. Although dense structures reflect a greater number of waves, resulting in a hyperechoic ultrasonographic structures, they may also generate an artifactual acoustic shadow due to attenuation of the ultrasound waves at the interface between two tissues of varying densities [13]. Another common artifact, acoustic enhancement, can appear as a result of relatively unimpeded passage of ultrasound waves through a preceding area of low acoustic impedance. This results in the appearance of a brighter structure deep to the area of low impedance [16, 17].
The resolution and penetration of an ultrasound image depends on the frequency of the acoustic waves produced. Traditional lower-frequency ultrasound devices are ideal for evaluation of internal organs like the liver and lungs due to their penetration ability. HFUS and UHFUS waves, on the other hand, are unable to travel easily through tissue, but provide higher-resolution, superficial detail. This makes HFUS and UHFUS ideal for visualizing a superficial organ like the skin [5, 10, 11, 15, 18, 19]. Given the diverse range of probe frequencies and the variation of dermal thickness in different regions of the body, specific frequencies should be considered for optimal visualization of lesions in various anatomic locations [15].
Normal skin
One of the first dermatologic applications of ultrasound measured the thickness of healthy skin [20]. While this original study used a 15-MHz transducer (and not meeting current standards for HFUS), the study was among the first to highlight the benefit of higher frequencies. Subsequent research has demonstrated that the three layers of the skin have distinct echogenicity, or corresponding levels of brightness (Fig. 1) [21]. The epidermis is mainly composed of keratin, a dense, fibrous structural protein that strongly reflects ultrasound waves; therefore, the epidermis is hyperechoic. The dermis is also hyperechoic, though to a lesser extent than the epidermis, due to its high content of collagen. Finally, the subcutis is hypoechoic due to the presence of fat lobules that allow for the unimpeded passage of ultrasound waves [2, 21].
Fig. 1.

Normal skin from the anterior arm using a 50-MHz HFUS probe (Longport, Inc. EPISCAN). Note the fine hyperechoic epidermal entry echo. Deep to the entry echo is the hyperechoic dermis measuring about 1 millimeter (mm) with thicker horizontal bands in the deep dermis corresponding to the organized, horizontally arrayed collagen bundles in the reticular dermis. Deep to the dermis is the subcutis composed primarily of hypoechoic fat globules. Within this layer is the hyperechoic superficial fascia. Deep to the subcutis is the hyperechoic deep fascia overlying the biceps muscle
The dermis can be further distinguished on ultrasound based on the arrangement of collagen and elastin bundles; the upper 20% of the hyperechoic dermis corresponds to the papillary dermis and contains irregularly arranged, thinner collagen and elastin bundles. The lower 80% of the dermis is made up of more regularly arranged collagen and elastin. Correspondingly, ultrasound at frequencies > 10 MHz demonstrates a reticular dermis with hyperechoic strands of thicker collagen bundles interposed with hypoechoic extracellular matrix [2, 5, 22].
An important consideration when using ultrasound to study healthy skin is persistence of a well-defined high-amplitude echo between the ultrasound gel and the corneal layer of the epidermis. This has been attributed to the impedance jump of the ultrasound waves from the ultrasound gel to the callused epidermal cells [2]. This reflection is thus referred to as the epidermal entry echo. Thus, the epidermal entry echo is not a direct visualization of the epidermis per se, but an artifact representing the epidermis [23].
Ultrasound studies examining healthy skin have demonstrated that while skin thickness is inversely proportional to age, echogenicity tends to increase with age corresponding to increase collagen production [24–28]. One notable exception is sun-damaged skin, as first described in 1988 by Querleux et al., where there is presence of a subepidermal low-echogenic band (SLEB). The SLEB was described as a dark band subjacent to the epidermal entry echo [29]. Though not specific to sun damage, its presence in more than 50% of adults over the age of 40 and its prominence in highly sun-exposed areas like the face and dorsal forearms have been correlated to solar elastosis, a histologic marker of cutaneous sun damage [25]. Similar findings have been recently demonstrated in patients treated with radiotherapy for head and neck cancers [30].
Glabrous skin, hair follicles, and the scalp
Compared to non-glabrous skin, glabrous epidermis appears as a bright bilaminar structure when visualized by ultrasound (Fig. 2). The bilaminar structure is thought to be caused by sound waves first entering the thick, compact stratum corneum before entering the normally hyperechoic epidermis itself [9]. This bilaminar appearance can be difficult to visualize at lower frequencies in which the stratum corneum is poorly resolved from the entry echo, but is discernable in UHFUS ranges [31]. Understanding the structure and characteristics of normal glabrous skin has allowed for differentiation between abnormalities in glabrous skin in conditions like Pachyonychia Congenita and other palmoplantar keratodermas [32–34].
Fig. 2.

Glabrous skin from the palm using a 50-MHz HFUS probe (Longport, Inc. EPISCAN). Note the bilaminar hyperechoic entry echo due to the thickened stratum corneum in this anatomic location
At other anatomic sites, hair follicles appear as oblique hypoechoic bands on ultrasound imaging. Multiple studies have demonstrated ultrasound can be used to estimate the phase of hair follicle growth, identify inflammation of hair follicles, and assess hair density [18, 35, 36]. Hair follicle growth phase is estimated based on band termination relative to the subcutis with anagen phase hairs terminating in the deeper dermis and telogen phase hairs terminating more superficially. An inflamed hair follicle will appear thicker and darker relative to a normal hair follicle. A number of studies have suggested that the ultrasonographic findings of an inflamed hair follicle may improve diagnostics by identifying early signs of adnexal pathologies like hidradenitis suppurativa [35, 37, 38].
In addition to identifying changes in hair follicle appearance, ultrasound has also been used to characterize scalp cysts; cysts typically appear as round and dark structures. Trichilemmal cysts characteristically contain hyperechoic areas within their round, dermal anechoic structures, corresponding to the dense keratinous and oily inner-cystic debris [35]. Pilomatricomas appear targetoid with a solid hyperechoic nodule thought to correspond to cystic calcifications or giant cells surrounded by a hypoechoic rim [35].
The nail
The dorsal and ventral plates of the nail are visible as separate entities on ultrasound, generating the second instance of a hyperechoic bilaminar linear structure (Fig. 3). The matrix of the nail is hypoechoic and ventral to the hyperechoic proximal nail fold. The nail bed is normally hypoechoic and just deep to the hyperechoic ventral nail plate. Finally, the surface of the distal phalanx appears as a hyperechoic linear structure [5, 22, 39].
Fig. 3.
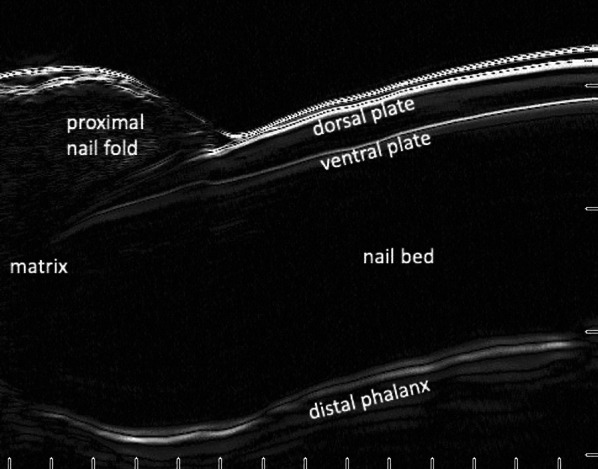
Longitudinal view of a normal nail using a 50-MHz HFUS probe (Longport, Inc. EPISCAN). Note the bilaminar appearance of the nail plate consisting of the hyperechoic dorsal and ventral nail plates separated by a hypoechoic band. The top-most hyperechoic horizontal line represents the probe membrane
Ultrasonography in neoplastic disease
Nonmelanoma skin cancers
The main dermatologic use of ultrasound is in the pre-operative assessment of non-melanoma and melanoma skin cancers [40, 41] and detection of early neoplasms [42]. In general, cutaneous neoplasms appear sonographically as hypoechoic lesions in a relatively hyperechoic epidermis and/or dermis [43]. The most prevalent human malignancy, BCC, has several histologic subtypes including superficial, nodular, micronodular and morpheaform [44]. The most common BCC histologic subtype—nodular—sonographically appears as a hypoechoic lesion with well-defined borders and is usually found in the dermis, though occasionally can extend deeper into the subcutis (Fig. 4) [42, 45]. Some histologic subtypes of BCC that have demonstrated more aggressive biologic behavior have been shown to feature small hyperechoic dots seen within the hypoechoic tumor. Such spots are referred to as “flower cotton” spots [13, 46]. Though the cause of this artifactual finding is unknown, flower cotton spots are thought to correlate with clusters of apoptotic neoplastic cells within the tumor [13, 46]. Risk of aggressive BCC phenotype, such as micronodular or morpheaform, and risk of recurrence have been correlated to increasing numbers of flower cotton spots [47]. Furthermore, the presence of flower cotton spots is important in differentiating a BCC from melanoma as melanoma lacks these hyperechoic inclusions [48, 49].
Fig. 4.

Nodular basal cell carcinoma measuring 5 mm by 7 mm on the left lower cheek of a 66-year-old man. Note the pearly borders and central ulceration in the gross photograph (a), the polymorphous vessels and ulceration in the dermatoscopic photo (b), and the 5 mm hypoechoic lesion in the superficial dermis across the short axis of this biopsy-supported nodular basal cell carcinoma using a 50-MHz UHFUS probe (Longport, Inc. EPISCAN)
The clinical relevance of ultrasound in the examination of suspected SCC is less well defined. Ultrasound has been used to identify SCCs, which also appear as hypoechoic lesions [42, 50]. However, in 2010 Wortsman et al. analyzed 75 non-melanoma skin cancers of which 18 were cutaneous SCCs. She demonstrated a modest but significant increase in diagnostic accuracy with the addition of higher frequencies of ultrasound [9]. An additional study demonstrated the accuracy of SCC measurement with HFUS by comparing SCC depth to histometry, noting a correlation to the 100th of a millimeter [51]. Despite this correlation, ultrasonographic examination of SCCs can be limited by the presence of an acoustic shadow artifact due to the reflection of ultrasound waves by thickened, hyperkeratotic stratum corneum, which may obscure lesion boundaries [48, 52]. Therefore, ultrasound has suggested use as a complementary tool to support the pre-operative evaluation of SCC but not as the sole method of diagnosis [50].
An additional form of non-melanoma skin cancer studied with HFUS is mycosis fungoides (MF) [53, 54]. MF is characterized by presence of a SLEB, which researchers have noticed can be helpful for identifying response to therapy and disease remission; in two separate studies of patients with MF, thinning or complete disappearance of the SLEB corresponded with disease severity and completion of therapy, supporting the utility of HFUS as an objective tool in routine clinical practice [53, 55].
Melanoma
In the study of melanoma, ultrasound demonstrates a homogenous hypoechoic lesion. The shape of the lesion often correlates to the histologic subtype of the melanoma. For example, nodular melanoma will typically present with a spherical hypoechoic lesion, while a superficial spreading melanoma will present with a thinner, lenticular, hypoechoic lesion subjacent to the epidermal entry echo [13]. Although no distinct ultrasonographic features of melanoma have been described, one important strength of ultrasound is its ability to predict Breslow thickness of a melanoma [48, 56]. This correlation with histologic thickness, the current gold standard on which melanoma staging and surgical planning rests, is predicted to be over 92% [57]. When compared to other techniques like OCT, ultrasound has superior correlation with histology, repeatability and inter-rater reliability [58]. Where OCT tends to underestimate Breslow thickness, ultrasound has been shown to modestly overestimate tumor thickness [58]. The cause of this overestimation is thought to result from the technology’s inability to distinguish an inflammatory infiltrate from melanocytic proliferation and neovascularization. Another contributing factor may be the desiccation of tissue as it is processed for histologic review. Nevertheless, its ability to resolve well beyond the dermis renders HFUS superior to other imaging modalities in predicting Breslow thickness [59].
Though melanomas have been distinguished from benign melanocytic proliferations with specificities as low as 30%, the addition of color Doppler sharply improves ultrasound as a diagnostic tool [43]. Melanomas have been shown to demonstrate more dense vascularization than benign nevi and exhibit low-flow arterioles. In another study of pigmented lesions, the direction of intralesional blood flow demonstrated a 100% specificity in distinguishing melanoma from non-melanoma tumors [46, 60].
Single-center experience with 50-MHz ultrasound device
In a single-center experience with a 50-MHz device, the Longport, Inc. EPISCAN, the authors examined ultra-high-frequency ultrasound biomicrographs of nearly 70 cutaneous lesions as well as normal skin and adnexae. Transducer power gain and time-gain compensation (TGC) were set to the device’s default settings—100% and 10%, respectively, with a TGC start of 0%. Skin position, or distance between transducer and impermeable membrane barrier, or skin, was 7.5 mm. Scanning depth ranged from 3.8 mm to 15.0 mm, with a scan length of 15 mm at a rate of 1 scan per frame per second. A standard acquisition protocol was followed. The protocol included a horizontal (cranial–caudal) scan and perpendicular scan in the center of each lesion or anatomical area with and without pressure. Then, 3D-views were simulated using two sweeps in both planes over 3–8 s for a total of three to eight 2D-slices in each plane.
Normal skin of the non-sun exposed medial upper arm of a middle-aged man demonstrated a hyperechoic epidermal entry echo and hyperechoic dermis with horizontally arrayed collagen bundles of the reticular dermis. These superficial structures are followed by the hypoechoic subcutis transected by a hyperechoic band of superficial fascia and the hypoechoic biceps muscle invested by the hyperechoic deep fascia (Fig. 1). The thickened stratum corneum over the thenar eminence demonstrated a hyperechoic bilaminar entry echo (Fig. 2). Ultrasound of a first digit nail also demonstrated a bilaminar appearance with hyperechoic dorsal and ventral plates separated by a hypoechoic band (Fig. 3). Finally, a basal cell carcinoma on the medial mandibular cheek of an elderly man demonstrated a hypoechoic lesion in the superficial dermis with subtle posterior acoustic enhancement (Fig. 4).
Inflammatory skin diseases
Sclerosing disorders
One of the earliest dermatologic applications of ultrasound was in scleroderma [61]. Due to the pathological increase in collagen deposition, ultrasound can help differentiate between the inflammatory and sclerotic phases of the disease [62]. In the inflammatory phase there is a reduction in echogenicity of the skin and dermal thickening, whereas in the sclerotic phase there is increased echogenicity and thickening [63]. Finally, ultrasonographic features of sclerodermatous skin in the atrophic phase demonstrates thinning of the dermis with an echogenicity similar to unaffected surrounding skin [64].
The modified Rodnan score is used to measure skin hardening. Skin lesions are scored on a 4-point scale from 0 to 3. This score is applied to 17 discrete areas of the body after evaluation by a clinician. A study found that 18-MHz ultrasound is more sensitive than clinical assessment in measuring skin hardening, with results of ultrasound providing the additional benefits of being quantitative, valid, and reproducible [65].
In a study of 16 patients with morphea and four with extragenital lichen sclerosis, the results of HFUS demonstrated unique features of extragenital lichen sclerosis characterized by widened, polycyclic, hyperechoic and disorganized epidermal entry echo relative to that seen in morphea [62]. Another study using UHFUS to measure response to treatment demonstrated a statistically significant decrease in dermal thickness and density after treatment with ultraviolet A1 phototherapy [66].
Psoriasis
Currently, evaluation of psoriasis in a clinical setting includes the use of the Psoriasis Epidemiology Screening Tool, a validated screening tool designed to identify patients who should be referred to a rheumatologist for possible co-existing psoriatic arthritis. Rheumatologists, on the other hand, use the Classification Criteria for Psoriatic Arthritis (CASPAR) to characterize psoriatic arthritis disease burden.
A 2015 study used ultrasound (6–18 MHz) to determine the prevalence of enthesitis, a feature in the pathogenesis of psoriatic arthritis, among psoriasis patients with and without psoriatic arthritis as defined by CASPAR criteria [67]. The study found at least one ultrasonographic sign of enthesitis in approximately half the patients with psoriatic arthritis, but also in almost half of the psoriasis patients without a diagnosis of psoriatic arthritis [67]. Furthermore, after these patients were treated for 6 months with systemic therapy, ultrasonographic features of enthesitis in both of these groups improved, suggesting subclinical joint involvement and underdiagnosis of psoriatic arthritis among psoriasis patients [67].
In a 2013 study, researchers found that 78% of patients with psoriasis had at least one nail abnormality identified by ultrasound: loss of ultrasonographic architecture, pitting, or both [68]. This study suggested that OCT was better than ultrasound at 9–14 MHz for identifying features of psoriatic nails, but both were more sensitive than clinical examination alone [68]. In a later study utilizing a UHFUS 40-MHz probe, researchers identified ventral nail plate deposits, irregular or fused nail plates, and significantly thicker nail plates in patients with psoriasis compared to controls, with Doppler-ultrasound noting increased nail blood flow and increased vascular resistance [69].
Finally, a recent study using 20-MHz HFUS to compare two treatment arms reliably demonstrated a reduction in the SLEB of psoriatic skin coinciding with clinical improvement, supporting the use of ultrasonography as a useful objective marker in patients with psoriasis [70].
Hidradenitis suppurativa
Hidradenitis suppurativa (HS) is an inflammatory disease that affects between 0.05 and 4.1% of the population [71–73]. This disease results in chronic inflammation of the hair follicle and presents with painful, erythematous nodules that often rupture, forming draining sinus tracts that eventually scar. Current HS staging tools include Hurley staging, HS severity index, HS physician global assessment and sonographic scoring of HS [74, 75]. Hurley staging is generally the most commonly used method for assessment of HS severity, but lacks the ability to effectively measure disease fluctuation and response to treatment [74].
A number of studies have demonstrated that these various staging tools underestimate the true disease severity in comparison to ultrasound-assisted staging of HS [76–79]. Ultrasound has allowed for understanding of a proposed sequence of skin changes in HS pathology with the earliest sign of follicular widening eventuating in the formation of fistulous tracts and increased vascularity over acutely inflamed lesions [78]. A meaningful association between the ultrasonographically measured diameter of an HS nodule and the patient’s subjective assessment of the nodule’s tenderness and the clinician’s assessment of erythema have also been established [80].
Finally, ultrasound can aid in medical and surgical management of HS. One study noted a modification in the management of 82% of cases following ultrasonographic evaluation with a 24% transition from medical to surgical management [78].
Atopic dermatitis
Atopic dermatitis (AD) is a chronic inflammatory skin condition characterized by intense pruritis and abnormal skin barrier function [81]. Currently, there is a lack of standardization of core outcome measurement tools for this disease. The Harmonising Outcome Measures in Eczema initiative recommends the use of the Eczema Area and Severity Index and the Scoring Atopic Dermatitis in assessing physician-reported signs of AD, noting the utility of the latter in clinical trials [82, 83]. But these disease severity tools are subjective, cumbersome and have demonstrated poor reproducibility [84, 85].
A number of studies have attempted to better understand the severity of AD through the use of ultrasound. In particular, these studies have sought to measure the thickness of the SLEB and skin echogenicity in order to quantify disease burden. Unlike in sun damaged skin, in AD, the SLEB appears to be the result of edema and inflammatory cell infiltrate in sites of active inflammation [13]. In one 2019 study, the mean thickness of the hypoechoic band was found to be higher in lesional skin but present in both lesional and non-lesional skin of individuals with AD [81]. A separate study compared SLEB thickness in patients with AD as visualized by 20-MHz ultrasound to their EASI score and histopathological findings from 5 mm punch biopsies. The study found SLEB thickness correlated with the histologic degree of epidermal hyperkeratosis, parakeratosis, spongiosis, and intensity of inflammatory infiltrates as well as the provider-assessed EASI scores [84]. Finally, two studies using HFUS and UHFUS to examine the effect of phototherapy and tacrolimus on SLEB thickness found statistically significant reductions in mean SLEB thickness [86, 87].
Granulomatous diseases
Sarcoidosis is characterized by the formation of granulomas in a number of different organs and is associated with cutaneous induration and erythema. A pilot study in 2017 evaluated the utility of UHFUS in objectively quantifying granuloma burden in cutaneous sarcoidosis in comparison to the Cutaneous Sarcoidosis Activity and Morphology Instrument (CSAMI) and histopathological evaluation [88]. The study found a strong correlation between the mean brightness of UHFUS and the lesion CSAMI score, as well as the percent of the dermis with granulomas on histopathology; ultimately, these results highlighted the utility of ultrasound in quantifying disease burden in patients with cutaneous sarcoidosis [88].
Another granulomatous disease, idiopathic facial aseptic granuloma (IFAG), is a self-limiting pediatric disease; as such, it does not require aggressive treatment [16]. On ultrasound, IFAG can appear as a poorly defined oval shaped hypoechogenic lesion in the dermis surrounded by areas of hyperechogenicity and hypervascularization due to inflammation. Ultrasound can therefore be utilized to differentiate IFAG from its differential diagnoses that might require further management. For example, a facial abscess may exhibit a characteristic “squish sign” with ultrasound and would require incision and drainage with antimicrobial therapy [89]. Further differentiating factors include lack of calcium deposits, differentiating it from a pilomatricoma, lack of defined borders, as seen in epidermal cysts, and lack of vascularity, as seen in vascular tumors [16]. The use of ultrasound to properly diagnose, manage and monitor disease progression in IFAG is therefore important and provides a non-invasive alternative to biopsy [16].
Vascular lesions
A number of vascular lesions have been studied using ultrasound, including Port-wine stains (PWS), arteriovenous (AV) malformations and spider nevi. The first study to successfully examine PWS using ultrasound was conducted in 2018 [90]. This retrospective study utilized both 10-MHz and 22-MHz transducers with and without Doppler to assess lesional depth, echogenicity, vessel density and AV flow signals. The results of this study demonstrated a clear contrast between lesional and normal skin [90]. Furthermore, the study demonstrated ultrasound could help differentiate a PWS from other vascular anomalies due to their hypoechoic, poorly vascularized appearance with venous flow, while other capillary-arteriovenous malformations appear hyperechoic and well-vascularized with mixed arterial and venous blood flow [90].
Another type of vascular lesion known as a Spider nevus has also been characterized using ultrasound [91]. Spider nevi were historically classified as low-flow capillary malformations [92]; however, a 2017 study by Alegre-Sanchez et al. found that spider nevi demonstrated pulsatile flow on dermoscopy and ultrasound. This finding was subsequently supported by the presence of high-flow arterial-type waveform as seen on Doppler-ultrasound, suggesting that spider nevi are more similar to arteriovenous malformations, or high-flow vascular lesions [91].
Ultrasound can also be used to guide and assess response to treatment [48]. For example, researchers have used its Doppler capabilities to correctly identify venous structures and aid in guiding injectable foam sclerotherapy for the treatment of venous leg ulcers, demonstrating good healing rate and a low reflux ratio [93].
Cosmetic applications
Several cosmetic applications of ultrasound have been established. For example, botulinum toxin injections demonstrate increase subcutaneous echogenicity leading to a blurring of the normally discrete boundaries between the subcutis and underlying muscle [94]. Similarly, fillers can be visualized using ultrasound to determine locations of prior injections—an important application since a small but significant proportion of patients seeking injectable fillers fail to report prior procedures. The risk of granulomas and filler dermopathies associated with injections of multiple filler materials has been established [95–97].
The efficacy of topical vitamin C therapy in increasing collagen production, reducing ultraviolet radiation induced oxidative stress and enhancing dermal remodeling has been demonstrated in several studies [98, 99]. One notable study using HFUS evaluated the skin of patients throughout a 60-day period of topical vitamin C therapy, demonstrating increased echogenicity in both the epidermis and dermis after 40 days and to a greater extent after 60 days [98]. Ultrasound at 15-MHz and 20-MHz has also been used to evaluate the efficacy of an oral micronutrient supplement on preservation of skin quality through the measurement of skin thickness and density [99, 100].
Conclusion
While ultrasound has been used in dermatology for more than 40 years, its uses have continued to evolve with improvements in technology. Today, there are a few dermatologic lesions with pathognomonic sonographic features. One example is the “jellyfish” sign described in some cases of dermatofibrosarcoma protuberans [101]. Other examples include the “saw-tooth” pattern of cellulite [102–104]. Pathognomonic ultrasonographic features are likely to increase with integration of higher frequency ultrasound devices in clinical practice; for future work with HFUS, a core international task force group formed by 15 physicians from 11 countries called the DERMUS (dermatologic ultrasound) group recommends dermatologists use Doppler-capable ultrasound devices with a frequency of at least 15- to 22-MHz in all ultrasound examinations of the skin [18].
While there is support for use of ultrasound in future dermatological practice, there are a number of limitations associated with the use of this tool. One major limitation is the skill of the operator. Consequently, the DERMUS group suggests utilizing ultrasound at least 300 times per year to achieve minimum competency. Similarly, it is strongly advised that the dermatologist functions as the sonographer because of the years of training in dermatologic pathologies and ability to correlate histology with clinical presentation of cutaneous lesions [18].
As frequency advancements in ultrasonography continue, the broad applications of this imaging modality will continue to grow. Ultrasound is a fast, safe and readily available tool that can aid in diagnosing, monitoring and treating dermatologic conditions by providing more objective assessment measures.
Acknowledgements
Not applicable.
Abbreviations
- HFUS
High-frequency ultrasound
- MHz
Megahertz
- TBDP
Total body digital photography
- RCM
Reflectance confocal microscopy
- OCT
Optical coherence tomography
- μm
Micrometers
- BCC
Basal cell carcinoma
- SCC
Squamous cell carcinoma
- SLEB
Subepidermal low-echogenic band
- MF
Mycosis fungoides
- CASPAR
Classification criteria for psoriatic arthritis
- HS
Hidradenitis suppurativa
- AD
Atopic dermatitis
- CSAMI
Cutaneous Sarcoidosis Activity and Morphology Instrument
- IFAG
Idiopathic facial aseptic granuloma
- PWS
Port-wine stain
- AV
Arteriovenous
Authors' contributions
JL and SCC had the concept for the review article and performed the majority of the literature search, with assistance from DLB and NH. JJJ and XY contributed to the imaging and planing of the work that led to this manuscript. DLB, NH, JL and SCC drafted the article, with all authors critically revising the work. All authors read and approved the final manuscript.
Funding
Not applicable.
Availability of data and materials
Not applicable.
Declarations
Ethics approval and consent to participate:
Not applicable.
Consent for publication
Not applicable.
Competing interests
The authors declare that they have no competing interest.
Footnotes
Publisher's Note
Springer Nature remains neutral with regard to jurisdictional claims in published maps and institutional affiliations.
References
- 1.Bhattacharya A, Young A, Wong A, Stalling S, Wei M, Hadley D. Precision diagnosis of melanoma and other skin lesions from digital images. AMIA Jt Summits Transl Sci Proc. 2017;2017:220–226. [PMC free article] [PubMed] [Google Scholar]
- 2.Schneider SL, Kohli I, Hamzavi IH, Council ML, Rossi AM, Ozog DM. Emerging imaging technologies in dermatology: Part I: Basic principles. J Am Acad Dermatol. 2019;80(4):1114–1120. doi: 10.1016/j.jaad.2018.11.042. [DOI] [PMC free article] [PubMed] [Google Scholar]
- 3.Kane D, Grassi W, Sturrock R, Balint PV. A brief history of musculoskeletal ultrasound: 'From bats and ships to babies and hips'. Rheumatology. 2004;43(7):931–933. doi: 10.1093/rheumatology/keh004. [DOI] [PubMed] [Google Scholar]
- 4.Parsons SK, Chan JA, Yu WW, Obadan N, Ratichek SJ, Lee J et al. Noninvasive Diagnostic Techniques for the Detection of Skin Cancers. AHRQ Comparative Effectiveness Technical Briefs. Rockville (MD)2011. [PubMed]
- 5.Barcaui Ede O, Carvalho AC, Lopes FP, Pineiro-Maceira J, Barcaui CB. High frequency ultrasound with color Doppler in dermatology. An Bras Dermatol. 2016;91(3):262–273. doi: 10.1590/abd1806-4841.20164446. [DOI] [PMC free article] [PubMed] [Google Scholar]
- 6.Mlosek RK, Malinowska S. Ultrasound image of the skin, apparatus and imaging basics. J Ultrason. 2013;13(53):212–221. doi: 10.15557/JoU.2013.0021. [DOI] [PMC free article] [PubMed] [Google Scholar]
- 7.Kleinerman R, Whang TB, Bard RL, Marmur ES. Ultrasound in dermatology: principles and applications. J Am Acad Dermatol. 2012;67(3):478–487. doi: 10.1016/j.jaad.2011.12.016. [DOI] [PubMed] [Google Scholar]
- 8.Dill-Muller D, Maschke J. Ultrasonography in dermatology. J Dtsch Dermatol Ges. 2007;5(8):689–707. doi: 10.1111/j.1610-0387.2007.06453.x. [DOI] [PubMed] [Google Scholar]
- 9.Wortsman X, Wortsman J. Clinical usefulness of variable-frequency ultrasound in localized lesions of the skin. J Am Acad Dermatol. 2010;62(2):247–256. doi: 10.1016/j.jaad.2009.06.016. [DOI] [PubMed] [Google Scholar]
- 10.Bhatta AK, Keyal U, Liu Y. Application of high frequency ultrasound in dermatology. Discov Med. 2018;26(145):237–242. [PubMed] [Google Scholar]
- 11.Izzetti R, Oranges T, Janowska A, Gabriele M, Graziani F, Romanelli M. The application of ultra-high-frequency ultrasound in dermatology and wound management. Int J Low Extrem Wounds. 2020;19(4):334–340. doi: 10.1177/1534734620972815. [DOI] [PubMed] [Google Scholar]
- 12.Shung KK. High frequency ultrasonic imaging. J Med Ultrasound. 2009;17(1):25–30. doi: 10.1016/S0929-6441(09)60012-6. [DOI] [PMC free article] [PubMed] [Google Scholar]
- 13.Polanska A, Danczak-Pazdrowska A, Jalowska M, Zaba R, Adamski Z. Current applications of high-frequency ultrasonography in dermatology. Postepy Dermatol Alergol. 2017;34(6):535–542. doi: 10.5114/ada.2017.72457. [DOI] [PMC free article] [PubMed] [Google Scholar]
- 14.Izzetti R, Vitali S, Aringhieri G, Nisi M, Oranges T, Dini V, et al. Ultra-high frequency ultrasound, a promising diagnostic technique: review of the literature and single-center experience. Can Assoc Radiol J. 2020 doi: 10.1177/0846537120940684. [DOI] [PubMed] [Google Scholar]
- 15.Iyengar S, Makin IR, Sadhwani D, Moon E, Yanes AF, Geisler A, et al. Utility of a high-resolution superficial diagnostic ultrasound system for assessing skin thickness: a cross-sectional study. Dermatol Surg. 2018;44(6):855–864. doi: 10.1097/DSS.0000000000001445. [DOI] [PubMed] [Google Scholar]
- 16.Knopfel N, Gomez-Zubiaur A, Noguera-Morel L, Torrelo A, Hernandez-Martin A. Ultrasound findings in idiopathic facial aseptic granuloma: case series and literature review. Pediatr Dermatol. 2018;35(3):397–400. doi: 10.1111/pde.13324. [DOI] [PubMed] [Google Scholar]
- 17.Li JW, Tong YY, Zhou J, Shi ZT, Sun PX, Chang C. Tumor proliferation and invasiveness derived from ultrasound appearances of invasive breast cancers: moving beyond the routine differential diagnosis. J Ultrasound Med. 2020 doi: 10.1002/jum.15250. [DOI] [PubMed] [Google Scholar]
- 18.Wortsman X, Alfageme F, Roustan G, Arias-Santiago S, Martorell A, Catalano O, et al. Guidelines for performing dermatologic ultrasound examinations by the DERMUS Group. J Ultrasound Med. 2016;35(3):577–580. doi: 10.7863/ultra.15.06046. [DOI] [PubMed] [Google Scholar]
- 19.Izzetti R, Vitali S, Oranges T, Dini V, Romanelli M, Caramella D, et al. Intraoral ultra-high frequency ultrasound study of oral lichen planus: a pictorial review. Skin Res Technol. 2020;26(2):200–204. doi: 10.1111/srt.12777. [DOI] [PubMed] [Google Scholar]
- 20.Alexander H, Miller DL. Determining skin thickness with pulsed ultra sound. J Invest Dermatol. 1979;72(1):17–19. doi: 10.1111/1523-1747.ep12530104. [DOI] [PubMed] [Google Scholar]
- 21.Van Mulder TJ, de Koeijer M, Theeten H, Willems D, Van Damme P, Demolder M, et al. High frequency ultrasound to assess skin thickness in healthy adults. Vaccine. 2017;35(14):1810–1815. doi: 10.1016/j.vaccine.2016.07.039. [DOI] [PubMed] [Google Scholar]
- 22.Barcaui Ede O, Carvalho AC, Pineiro-Maceira J, Barcaui CB, Moraes H. Study of the skin anatomy with high-frequency (22 MHz) ultrasonography and histological correlation. Radiol Bras. 2015;48(5):324–329. doi: 10.1590/0100-3984.2014.0028. [DOI] [PMC free article] [PubMed] [Google Scholar]
- 23.Jemec GB, Gniadecka M, Ulrich J. Ultrasound in dermatology. Part I. High frequency ultrasound. Eur J Dermatol. 2000;10(6):492–497. [PubMed] [Google Scholar]
- 24.de Rigal J, Escoffier C, Querleux B, Faivre B, Agache P, Leveque JL. Assessment of aging of the human skin by in vivo ultrasonic imaging. J Invest Dermatol. 1989;93(5):621–625. doi: 10.1111/1523-1747.ep12319741. [DOI] [PubMed] [Google Scholar]
- 25.Sandby-Moller J, Wulf HC. Ultrasonographic subepidermal low-echogenic band, dependence of age and body site. Skin Res Technol. 2004;10(1):57–63. doi: 10.1111/j.1600-0846.2004.00056.x. [DOI] [PubMed] [Google Scholar]
- 26.Seidenari S, Pagnoni A, Di Nardo A, Giannetti A. Echographic evaluation with image analysis of normal skin: variations according to age and sex. Skin Pharmacol. 1994;7(4):201–209. doi: 10.1159/000211295. [DOI] [PubMed] [Google Scholar]
- 27.Tsukahara K, Takema Y, Moriwaki S, Fujimura T, Kitahara T, Imokawa G. Age-related alterations of echogenicity in Japanese skin. Dermatology. 2000;200(4):303–307. doi: 10.1159/000018392. [DOI] [PubMed] [Google Scholar]
- 28.Gniadecka M. Effects of ageing on dermal echogenicity. Skin Res Technol. 2001;7(3):204–207. doi: 10.1034/j.1600-0846.2001.70310.x. [DOI] [PubMed] [Google Scholar]
- 29.Querleux B, Leveque JL, de Rigal J. In vivo cross-sectional ultrasonic imaging of human skin. Dermatologica. 1988;177(6):332–337. doi: 10.1159/000248602. [DOI] [PubMed] [Google Scholar]
- 30.Pazdrowski J, Danczak-Pazdrowska A, Polanska A, Kazmierska J, Barczak W, Szewczyk M, et al. An ultrasonographic monitoring of skin condition in patients receiving radiotherapy for head and neck cancers. Skin Res Technol. 2019;25(6):857–861. doi: 10.1111/srt.12745. [DOI] [PubMed] [Google Scholar]
- 31.El Gammal S, El Gammal C, Kaspar K, Pieck C, Altmeyer P, Vogt M, et al. Sonography of the skin at 100 MHz enables in vivo visualization of stratum corneum and viable epidermis in palmar skin and psoriatic plaques. J Invest Dermatol. 1999;113(5):821–829. doi: 10.1046/j.1523-1747.1999.00795.x. [DOI] [PubMed] [Google Scholar]
- 32.Goldberg I, Sprecher E, Schwartz ME, Gaitini D. Comparative study of high-resolution multifrequency ultrasound of the plantar skin in patients with various types of hereditary palmoplantar keratoderma. Dermatology. 2013;226(4):365–370. doi: 10.1159/000351321. [DOI] [PubMed] [Google Scholar]
- 33.Eliason MJ, Leachman SA, Feng BJ, Schwartz ME, Hansen CD. A review of the clinical phenotype of 254 patients with genetically confirmed pachyonychia congenita. J Am Acad Dermatol. 2012;67(4):680–686. doi: 10.1016/j.jaad.2011.12.009. [DOI] [PubMed] [Google Scholar]
- 34.McLean WH, Hansen CD, Eliason MJ, Smith FJ. The phenotypic and molecular genetic features of pachyonychia congenita. J Invest Dermatol. 2011;131(5):1015–1017. doi: 10.1038/jid.2011.59. [DOI] [PubMed] [Google Scholar]
- 35.Wortsman X, Wortsman J, Matsuoka L, Saavedra T, Mardones F, Saavedra D, et al. Sonography in pathologies of scalp and hair. Br J Radiol. 2012;85(1013):647–655. doi: 10.1259/bjr/22636640. [DOI] [PMC free article] [PubMed] [Google Scholar]
- 36.Wortsman X, Carreno L, Ferreira-Wortsman C, Poniachik R, Pizarro K, Morales C, et al. Ultrasound characteristics of the hair follicles and tracts, sebaceous glands, montgomery glands, apocrine glands, and arrector pili muscles. J Ultrasound Med. 2019;38(8):1995–2004. doi: 10.1002/jum.14888. [DOI] [PubMed] [Google Scholar]
- 37.Wortsman X. Common applications of dermatologic sonography. J Ultrasound Med. 2012;31(1):97–111. doi: 10.7863/jum.2012.31.1.97. [DOI] [PubMed] [Google Scholar]
- 38.Wortsman X, Rodriguez C, Lobos C, Eguiguren G, Molina MT. Ultrasound diagnosis and staging in pediatric Hidradenitis Suppurativa. Pediatr Dermatol. 2016;33(4):e260–e264. doi: 10.1111/pde.12895. [DOI] [PubMed] [Google Scholar]
- 39.Wortsman X, Jemec GB. Ultrasound imaging of nails. Dermatol Clin. 2006;24(3):323–328. doi: 10.1016/j.det.2006.03.014. [DOI] [PubMed] [Google Scholar]
- 40.Schneider SL, Kohli I, Hamzavi IH, Council ML, Rossi AM, Ozog DM. Emerging imaging technologies in dermatology: Part II: applications and limitations. J Am Acad Dermatol. 2019;80(4):1121–1131. doi: 10.1016/j.jaad.2018.11.043. [DOI] [PMC free article] [PubMed] [Google Scholar]
- 41.Pilat P, Borzecki A, Jazienicki M, Gerkowicz A, Krasowska D. High-frequency ultrasound in the diagnosis of selected non-melanoma skin nodular lesions. Postepy Dermatol Alergol. 2019;36(5):572–580. doi: 10.5114/ada.2019.89505. [DOI] [PMC free article] [PubMed] [Google Scholar]
- 42.Bard RL. High-frequency ultrasound examination in the diagnosis of skin cancer. Dermatol Clin. 2017;35(4):505–511. doi: 10.1016/j.det.2017.06.011. [DOI] [PubMed] [Google Scholar]
- 43.Harland CC, Kale SG, Jackson P, Mortimer PS, Bamber JC. Differentiation of common benign pigmented skin lesions from melanoma by high-resolution ultrasound. Br J Dermatol. 2000;143(2):281–289. doi: 10.1046/j.1365-2133.2000.03652.x. [DOI] [PubMed] [Google Scholar]
- 44.Dinnes J, Bamber J, Chuchu N, Bayliss SE, Takwoingi Y, Davenport C, et al. High-frequency ultrasound for diagnosing skin cancer in adults. Cochrane Database Syst Rev. 2018;12:CD03188. doi: 10.1002/14651858.CD013188. [DOI] [PMC free article] [PubMed] [Google Scholar]
- 45.Bobadilla JL, Love RB, Jankowska-Gan E, Xu Q, Haynes LD, Braun RK, et al. Th-17, monokines, collagen type V, and primary graft dysfunction in lung transplantation. Am J Respir Crit Care Med. 2008;177(6):660–668. doi: 10.1164/rccm.200612-1901OC. [DOI] [PMC free article] [PubMed] [Google Scholar]
- 46.Marmur ES, Berkowitz EZ, Fuchs BS, Singer GK, Yoo JY. Use of high-frequency, high-resolution ultrasound before Mohs surgery. Dermatol Surg. 2010;36(6):841–847. doi: 10.1111/j.1524-4725.2010.01558.x. [DOI] [PubMed] [Google Scholar]
- 47.Malvehy J, Pellacani G. Dermoscopy, confocal microscopy and other non-invasive tools for the diagnosis of non-melanoma skin cancers and other skin conditions. Acta Derm Venereol. 2017;218:22–30. doi: 10.2340/00015555-2720. [DOI] [PubMed] [Google Scholar]
- 48.Mandava A, Ravuri PR, Konathan R. High-resolution ultrasound imaging of cutaneous lesions. Indian J Radiol Imaging. 2013;23(3):269–277. doi: 10.4103/0971-3026.120272. [DOI] [PMC free article] [PubMed] [Google Scholar]
- 49.Uhara H, Hayashi K, Koga H, Saida T. Multiple hypersonographic spots in basal cell carcinoma. Dermatol Surg. 2007;33(10):1215–1219. doi: 10.1111/j.1524-4725.2007.33256.x. [DOI] [PubMed] [Google Scholar]
- 50.Warszawik-Hendzel O, Olszewska M, Maj M, Rakowska A, Czuwara J, Rudnicka L. Non-invasive diagnostic techniques in the diagnosis of squamous cell carcinoma. J Dermatol Case Rep. 2015;9(4):89–97. doi: 10.3315/jdcr.2015.1221. [DOI] [PMC free article] [PubMed] [Google Scholar]
- 51.Rohrbach DJ, Muffoletto D, Huihui J, Saager R, Keymel K, Paquette A, et al. Preoperative mapping of nonmelanoma skin cancer using spatial frequency domain and ultrasound imaging. Acad Radiol. 2014;21(2):263–270. doi: 10.1016/j.acra.2013.11.013. [DOI] [PMC free article] [PubMed] [Google Scholar]
- 52.Schmid-Wendtner MH, Dill-Muller D. Ultrasound technology in dermatology. Semin Cutan Med Surg. 2008;27(1):44–51. doi: 10.1016/j.sder.2008.01.003. [DOI] [PubMed] [Google Scholar]
- 53.Polanska A, Danczak-Pazdrowska A, Olek-Hrab K, Osmola-Mankowska A, Bowszyc-Dmochowska M, Zaba R, et al. High-frequency ultrasonography-New non-invasive method in assessment of skin lymphomas. Skin Res Technol. 2018;24(3):517–521. doi: 10.1111/srt.12450. [DOI] [PubMed] [Google Scholar]
- 54.Wang Y, Niu Z, Liu J, Zhu Q, Liu Z, Liu Y, et al. Value of high-frequency ultrasound in accurate staging of mycosis fungoides/Sezary Syndrome. J Ultrasound Med. 2020 doi: 10.1002/jum.15297. [DOI] [PubMed] [Google Scholar]
- 55.Polanska A, Osmola-Mankowska A, Olek-Hrab K, Molinska-Glura M, Adamski Z, Zaba R, et al. High-frequency ultrasonography in objective evaluation of the efficacy of PUVA and UVA 1 phototherapy in mycosis fungoides. Arch Dermatol Res. 2017;309(8):645–651. doi: 10.1007/s00403-017-1767-7. [DOI] [PubMed] [Google Scholar]
- 56.Szymanska E, Nowicki A, Mlosek K, Litniewski J, Lewandowski M, Secomski W, et al. Skin imaging with high frequency ultrasound - preliminary results. Eur J Ultrasound. 2000;12(1):9–16. doi: 10.1016/s0929-8266(00)00097-5. [DOI] [PubMed] [Google Scholar]
- 57.Botar-Jid CM, Cosgarea R, Bolboaca SD, Senila SC, Lenghel LM, Rogojan L, et al. Assessment of cutaneous melanoma by use of very- high-frequency ultrasound and real-time elastography. AJR Am J Roentgenol. 2016;206(4):699–704. doi: 10.2214/AJR.15.15182. [DOI] [PubMed] [Google Scholar]
- 58.Pilat P, Borzecki A, Jazienicki M, Krasowska D. Skin melanoma imaging using ultrasonography: a literature review. Postepy Dermatol Alergol. 2018;35(3):238–242. doi: 10.5114/ada.2018.76211. [DOI] [PMC free article] [PubMed] [Google Scholar]
- 59.Kozarova A, Kozar M, Tonhajzerova I, Pappova T, Minarikova E. The value of high-frequency 20 MHz ultrasonography for preoperative measurement of cutaneous melanoma thickness. Acta Dermatovenerol Croat. 2018;26(1):15–20. [PubMed] [Google Scholar]
- 60.Samimi M, Perrinaud A, Naouri M, Maruani A, Perrodeau E, Vaillant L, et al. High-resolution ultrasonography assists the differential diagnosis of blue naevi and cutaneous metastases of melanoma. Br J Dermatol. 2010;163(3):550–556. doi: 10.1111/j.1365-2133.2010.09903.x. [DOI] [PubMed] [Google Scholar]
- 61.Akesson A, Forsberg L, Hederstrom E, Wollheim F. Ultrasound examination of skin thickness in patients with progressive systemic sclerosis (scleroderma) Acta Radiol Diagn (Stockh) 1986;27(1):91–94. doi: 10.1177/028418518602700117. [DOI] [PubMed] [Google Scholar]
- 62.Bialynicki-Birula R, Reszke R, Szepietowski JC. High-frequency ultrasonography (HFUS) as a useful tool in differentiating between plaque morphea and extragenital lichen sclerosus lesions. Postepy Dermatol Alergol. 2017;34(5):485–489. doi: 10.5114/ada.2017.71118. [DOI] [PMC free article] [PubMed] [Google Scholar]
- 63.Hesselstrand R, Carlestam J, Wildt M, Sandqvist G, Andreasson K. High frequency ultrasound of skin involvement in systemic sclerosis - a follow-up study. Arthritis Res Ther. 2015;17:329. doi: 10.1186/s13075-015-0853-5. [DOI] [PMC free article] [PubMed] [Google Scholar]
- 64.Ranosz-Janicka I, Lis-Swiety A, Skrzypek-Salamon A, Brzezinska-Wcislo L. An extended high-frequency ultrasound protocol for assessing and quantifying of inflammation and fibrosis in localized scleroderma. Skin Res Technol. 2019;25(3):359–366. doi: 10.1111/srt.12660. [DOI] [PubMed] [Google Scholar]
- 65.Li H, Furst DE, Jin H, Sun C, Wang X, Yang L, et al. High-frequency ultrasound of the skin in systemic sclerosis: an exploratory study to examine correlation with disease activity and to define the minimally detectable difference. Arthritis Res Ther. 2018;20(1):181. doi: 10.1186/s13075-018-1686-9. [DOI] [PMC free article] [PubMed] [Google Scholar]
- 66.Arisi M, Lorenzi L, Incardona P, Fusano M, Zanca A, Rossi MT, et al. Clinical, histological and high-frequency ultrasonographic evaluation (50 MHz) of morphoea treated with ultraviolet al phototherapy. Clin Exp Dermatol. 2019;44(3):270–276. doi: 10.1111/ced.13693. [DOI] [PubMed] [Google Scholar]
- 67.Acquacalda E, Albert C, Montaudie H, Fontas E, Danre A, Roux CH, et al. Ultrasound study of entheses in psoriasis patients with or without musculoskeletal symptoms: a prospective study. Joint Bone Spine. 2015;82(4):267–271. doi: 10.1016/j.jbspin.2015.01.016. [DOI] [PubMed] [Google Scholar]
- 68.Aydin SZ, Castillo-Gallego C, Ash ZR, Abignano G, Marzo-Ortega H, Wittmann M, et al. Potential use of optical coherence tomography and high-frequency ultrasound for the assessment of nail disease in psoriasis and psoriatic arthritis. Dermatology. 2013;227(1):45–51. doi: 10.1159/000351702. [DOI] [PubMed] [Google Scholar]
- 69.Marina ME, Solomon C, Bolboaca SD, Bocsa C, Mihu CM, Tataru AD. High-frequency sonography in the evaluation of nail psoriasis. Med Ultrason. 2016;18(3):312–317. doi: 10.11152/mu.2013.2066.183.hgh. [DOI] [PubMed] [Google Scholar]
- 70.Polanska A, Gaura T, Bowszyc-Dmochowska M, Osmola-Mankowska A, Olek-Hrab K, Adamski Z, et al. Calcipotriol/betamethasone ointment compared to narrow-band UVB in plaque psoriasis: first clinical and ultrasonographic study. Int J Dermatol. 2019;58(1):108–113. doi: 10.1111/ijd.14150. [DOI] [PubMed] [Google Scholar]
- 71.Jemec GB, Heidenheim M, Nielsen NH. The prevalence of hidradenitis suppurativa and its potential precursor lesions. J Am Acad Dermatol. 1996;35(2 Pt 1):191–194. doi: 10.1016/s0190-9622(96)90321-7. [DOI] [PubMed] [Google Scholar]
- 72.Revuz JE, Canoui-Poitrine F, Wolkenstein P, Viallette C, Gabison G, Pouget F, et al. Prevalence and factors associated with hidradenitis suppurativa: results from two case-control studies. J Am Acad Dermatol. 2008;59(4):596–601. doi: 10.1016/j.jaad.2008.06.020. [DOI] [PubMed] [Google Scholar]
- 73.Cosmatos I, Matcho A, Weinstein R, Montgomery MO, Stang P. Analysis of patient claims data to determine the prevalence of hidradenitis suppurativa in the United States. J Am Acad Dermatol. 2013;68(3):412–419. doi: 10.1016/j.jaad.2012.07.027. [DOI] [PubMed] [Google Scholar]
- 74.Vinkel C, Thomsen SF. Hidradenitis Suppurativa: causes, features, and current treatments. J Clin Aesthet Dermatol. 2018;11(10):17–23. [PMC free article] [PubMed] [Google Scholar]
- 75.Bard RL, editor. Image guided dermatologic treatments. Switzerland: Springer; 2019. [Google Scholar]
- 76.Lacarrubba F, Dini V, Napolitano M, Venturini M, Caposiena Caro DR, Molinelli E, et al. Ultrasonography in the pathway to an optimal standard of care of hidradenitis suppurativa: the Italian Ultrasound Working Group experience. J Eur Acad Dermatol Venereol. 2019;33(Suppl 6):10–14. doi: 10.1111/jdv.15847. [DOI] [PubMed] [Google Scholar]
- 77.Nazzaro G, Passoni E, Muratori S, Moltrasio C, Guanziroli E, Barbareschi M, et al. Comparison of clinical and sonographic scores in hidradenitis suppurativa and proposal of a novel ultrasound scoring system. G Ital Dermatol Venereol. 2018 doi: 10.23736/S0392-0488.18.06196-5. [DOI] [PubMed] [Google Scholar]
- 78.Wortsman X, Moreno C, Soto R, Arellano J, Pezo C, Wortsman J. Ultrasound in-depth characterization and staging of hidradenitis suppurativa. Dermatol Surg. 2013;39(12):1835–1842. doi: 10.1111/dsu.12329. [DOI] [PubMed] [Google Scholar]
- 79.Loo CH, Tan WC, Tang JJ, Khor YH, Manikam MT, Low DE, et al. The clinical, biochemical, and ultrasonographic characteristics of patients with hidradenitis suppurativa in Northern Peninsular Malaysia: a multicenter study. Int J Dermatol. 2018;57(12):1454–1463. doi: 10.1111/ijd.14210. [DOI] [PubMed] [Google Scholar]
- 80.Zarchi K, Yazdanyar N, Yazdanyar S, Wortsman X, Jemec GB. Pain and inflammation in hidradenitis suppurativa correspond to morphological changes identified by high-frequency ultrasound. J Eur Acad Dermatol Venereol. 2015;29(3):527–532. doi: 10.1111/jdv.12610. [DOI] [PubMed] [Google Scholar]
- 81.Sabau M, Boca AN, Ilies RF, Tataru A. Potential of high-frequency ultrasonography in the management of atopic dermatitis. Exp Ther Med. 2019;17(2):1073–1077. doi: 10.3892/etm.2018.6984. [DOI] [PMC free article] [PubMed] [Google Scholar]
- 82.Grinich EE, Schmitt J, Kuster D, Spuls PI, Williams HC, Chalmers JR, et al. Standardized reporting of the Eczema Area and Severity Index (EASI) and the Patient-Oriented Eczema Measure (POEM): a recommendation by the Harmonising Outcome Measures for Eczema (HOME) Initiative. Br J Dermatol. 2018;179(2):540–541. doi: 10.1111/bjd.16732. [DOI] [PubMed] [Google Scholar]
- 83.Schmitt J, Spuls PI, Thomas KS, Simpson E, Furue M, Deckert S, et al. The Harmonising Outcome Measures for Eczema (HOME) statement to assess clinical signs of atopic eczema in trials. J Allergy Clin Immunol. 2014;134(4):800–807. doi: 10.1016/j.jaci.2014.07.043. [DOI] [PubMed] [Google Scholar]
- 84.Polanska A, Danczak-Pazdrowska A, Silny W, Wozniak A, Maksin K, Jenerowicz D, et al. Comparison between high-frequency ultrasonography (Dermascan C, version 3) and histopathology in atopic dermatitis. Skin Res Technol. 2013;19(4):432–437. doi: 10.1111/srt.12064. [DOI] [PubMed] [Google Scholar]
- 85.Charman CR, Venn AJ, Williams HC. Measurement of body surface area involvement in atopic eczema: an impossible task? Br J Dermatol. 1999;140(1):109–111. doi: 10.1046/j.1365-2133.1999.02617.x. [DOI] [PubMed] [Google Scholar]
- 86.Polanska A, Silny W, Jenerowicz D, Kniola K, Molinska-Glura M, Danczak-Pazdrowska A. Monitoring of therapy in atopic dermatitis–observations with the use of high-frequency ultrasonography. Skin Res Technol. 2015;21(1):35–40. doi: 10.1111/srt.12153. [DOI] [PubMed] [Google Scholar]
- 87.Osmola-Mankowska A, Polanska A, Silny W, Zaba R, Adamski Z, Danczak-Pazdrowska A. Topical tacrolimus vs medium-dose ultraviolet al phototherapy in the treatment of atopic dermatitis-a preliminary study in relation to parameters of the epidermal barrier function and high-frequency ultrasonography. Eur Rev Med Pharmacol Sci. 2014;18(24):3927–3934. [PubMed] [Google Scholar]
- 88.Noe MH, Rodriguez O, Taylor L, Sultan L, Sehgal C, Schultz S, et al. High frequency ultrasound: a novel instrument to quantify granuloma burden in cutaneous sarcoidosis. Sarcoidosis Vasc Diffuse Lung Dis. 2017;34(2):136–141. doi: 10.36141/svdld.v34i2.5720. [DOI] [PMC free article] [PubMed] [Google Scholar]
- 89.Chen KC, Lin AC, Chong CF, Wang TL. An overview of point-of-care ultrasound for soft tissue and musculoskeletal applications in the emergency department. J Intensive Care. 2016;4:55. doi: 10.1186/s40560-016-0173-0. [DOI] [PMC free article] [PubMed] [Google Scholar]
- 90.Gong X, Yu W, Li J, Ding A, Xiong P, Lin X. High-Frequency Ultrasound investigation of port-wine stains: hemodynamic features revealed by 10- and 22-MHz transducers. J Ultrasound Med. 2019;38(3):641–648. doi: 10.1002/jum.14732. [DOI] [PubMed] [Google Scholar]
- 91.Alegre-Sanchez A, Bernardez C, Fonda-Pascual P, Moreno-Arrones OM, Lopez-Gutierrez JC, Jaen-Olasolo P, et al. Videodermoscopy and doppler-ultrasound in spider naevi: towards a new classification? J Eur Acad Dermatol Venereol. 2018;32(1):156–159. doi: 10.1111/jdv.14602. [DOI] [PubMed] [Google Scholar]
- 92.Wassef M, Blei F, Adams D, Alomari A, Baselga E, Berenstein A, et al. Vascular anomalies classification: recommendations from the International Society for the Study of Vascular Anomalies. Pediatrics. 2015;136(1):e203–e214. doi: 10.1542/peds.2014-3673. [DOI] [PubMed] [Google Scholar]
- 93.Lloret P, Redondo P, Cabrera J, Sierra A. Treatment of venous leg ulcers with ultrasound-guided foam sclerotherapy: healing, long-term recurrence and quality of life evaluation. Wound Repair Regen. 2015;23(3):369–378. doi: 10.1111/wrr.12288. [DOI] [PubMed] [Google Scholar]
- 94.Wortsman X, Wortsman J. Sonographic outcomes of cosmetic procedures. AJR Am J Roentgenol. 2011;197(5):W910–W918. doi: 10.2214/AJR.11.6719. [DOI] [PubMed] [Google Scholar]
- 95.Giovagnorio F, Drudi FM, Valentini C, Paonessa A. Ultrasonography in follow-up of soft tissue augmentation of the face with synthetic materials: a pilot study. Acta Radiol. 2004;45(7):746–750. doi: 10.1080/02841850410008207. [DOI] [PubMed] [Google Scholar]
- 96.Schelke LW, Van Den Elzen HJ, Erkamp PP, Neumann HA. Use of ultrasound to provide overall information on facial fillers and surrounding tissue. Dermatol Surg. 2010;36(Suppl 3):1843–1851. doi: 10.1111/j.1524-4725.2010.01740.x. [DOI] [PubMed] [Google Scholar]
- 97.Wortsman X, Wortsman J, Orlandi C, Cardenas G, Sazunic I, Jemec GB. Ultrasound detection and identification of cosmetic fillers in the skin. J Eur Acad Dermatol Venereol. 2012;26(3):292–301. doi: 10.1111/j.1468-3083.2011.04047.x. [DOI] [PubMed] [Google Scholar]
- 98.Crisan D, Roman I, Crisan M, Scharffetter-Kochanek K, Badea R. The role of vitamin C in pushing back the boundaries of skin aging: an ultrasonographic approach. Clin Cosmet Investig Dermatol. 2015;8:463–470. doi: 10.2147/CCID.S84903. [DOI] [PMC free article] [PubMed] [Google Scholar]
- 99.Addor FAS, Cotta Vieira J, Abreu Melo CS. Improvement of dermal parameters in aged skin after oral use of a nutrient supplement. Clin Cosmet Investig Dermatol. 2018;11:195–201. doi: 10.2147/CCID.S150269. [DOI] [PMC free article] [PubMed] [Google Scholar]
- 100.Fanian F, Mac-Mary S, Jeudy A, Lihoreau T, Messikh R, Ortonne JP, et al. Efficacy of micronutrient supplementation on skin aging and seasonal variation: a randomized, placebo-controlled, double-blind study. Clin Interv Aging. 2013;8:1527–1537. doi: 10.2147/CIA.S43976. [DOI] [PMC free article] [PubMed] [Google Scholar]
- 101.Rodriguez Bandera AI, Moreno Bonilla G, Feito Rodriguez M, Beato Merino MJ, de Lucas LR. Jellyfish-like sonographic pattern can help recognition of dermatofibrosarcoma protuberans. Report of 3 new cases and review of the literature. Australas J Dermatol. 2019;60(2):e148–e150. doi: 10.1111/ajd.12922. [DOI] [PubMed] [Google Scholar]
- 102.Bousquet-Rouaud R, Bazan M, Chaintreuil J, Echague A. High-frequency ultrasound evaluation of cellulite treated with the 1064 nm Nd:YAG laser. J Cosmet Laser Ther. 2009;11(1):34–44. doi: 10.1080/14764170802612968. [DOI] [PubMed] [Google Scholar]
- 103.Lucassen GW, van der Sluys WL, van Herk JJ, Nuijs AM, Wierenga PE, Barel AO, et al. The effectiveness of massage treatment on cellulite as monitored by ultrasound imaging. Skin Res Technol. 1997;3(3):154–160. doi: 10.1111/j.1600-0846.1997.tb00180.x. [DOI] [PubMed] [Google Scholar]
- 104.Rosenbaum M, Prieto V, Hellmer J, Boschmann M, Krueger J, Leibel RL, et al. An exploratory investigation of the morphology and biochemistry of cellulite. Plast Reconstr Surg. 1998;101(7):1934–1939. doi: 10.1097/00006534-199806000-00025. [DOI] [PubMed] [Google Scholar]
Associated Data
This section collects any data citations, data availability statements, or supplementary materials included in this article.
Data Availability Statement
Not applicable.