

Abstract
Purpose:
The correlations between enlargement rates (ERs) of geographic atrophy (GA) and choriocapillaris (CC) flow deficits (FDs), mean choroidal thickness (MCT), and choroidal vascularity index (CVI) were investigated using swept source optical coherence tomography (SS-OCT) in age-related macular degeneration (AMD).
Design:
Retrospective review of prospective, observational case series.
Methods:
Eyes with GA from AMD were imaged with SS-OCT (PLEX® Elite 9000; Carl Zeiss Meditec, Inc, Dublin, CA) using 6×6 mm scan pattern. GA lesions were identified and measured using custom en face structural images and annual square root ERs of GA were calculated. At baseline, CC FDs from different regions outside of the GA were measured, and MCT and CVI from the entire scan area were measured. All the measurements were performed using previously published and validated algorithms.
Results:
Thirty-eight eyes from 27 patients were included. The CC FDs within each region around GA lesions were all highly correlated with ERs of GA (All P < 0.005). CVI inside GA region was correlated with the ERs (P = 0.03), while other choroidal measurements had no significant correlation with the ERs of GA (P > 0.06).
Conclusion:
Statistically significant correlations were found between the ERs of GA and CC FD% from the entire scan region outside the GA and not just the region immediately adjacent to the GA. These results suggest that abnormal CC perfusion throughout the macula contributes to disease progression in eyes with GA. CVI inside GA region could also be a potential indicator for the growth of GA.
INTRODUCTION
Geographic atrophy (GA) is the late stage of non-exudative age-related macular degeneration (AMD) and a major cause of irreversible vision loss among the elderly worldwide.1, 2 GA in AMD is characterized by the loss of photoreceptors, retinal pigment epithelium (RPE), and choriocapillaris (CC) in the area where GA appears.3, 4 While the underlying pathophysiological mechanisms responsible for the onset, the enlargement rates (ERs), and the directionality of GA growth are unknown and most likely result from the interplay between genetic and environmental influences,5 multimodal imaging of eyes with AMD have identified numerous structural changes that appear to serve as harbingers of GA onset and progression. These clinical signs include the size and appearance of drusen, such as the drusen area, volume, and both hyporeflective foci and calcific inclusions within drusen, the presence of hyper-reflective foci, the presence of reticular pseudodrusen (RPD), also known as subretinal drusenoid deposits, thickening of the RPE/Bruch’s membrane (BM) complex, hyper-autofluorescence, hyper-transmission defects, retinal subsidence, focal loss of photoreceptors, and choroidal thinning.6–14 However, with the development of optical coherence tomography angiography (OCTA), the predictive importance of CC perfusion abnormalities under and around drusen and around GA has been investigated and associated with disease progression.15–20
Several groups have investigated the correlation between the ERs of GA and CC flow impairment.17–20 Using spectral domain OCTA (SD-OCTA), Nassisi et al.20 and Alagorie et al.17 found that CC flow impairment within a 500 μm rim region around GA correlated with the annual growth rate of GA. However, using swept source OCTA (SS-OCTA), Thulliez et al.19 and Moult et al.18 found that the annual ERs of GA were correlated with CC flow deficits (FDs) not only within the 500 μm rim region around GA, but also in regions further away from the margins of GA within the 6×6 mm scan area. These studies suggested an important role for CC flow impairment in the ERs of GA. The major difference between these studies was whether this influence of CC flow impairment was mostly a local effect along the margins of GA or whether the influence was indicative of a more widespread abnormality involving CC flow impairment that could be detected further away from the margins of GA. Interestingly, this localized impairment of CC perfusion around the margins of GA has not yet been associated with the directionality of GA growth.
There are several possibilities why these groups have reached different conclusions about the impact of localized versus global correlations between CC FDs and their influence on GA progression. These groups used different OCTA instruments for image acquisition, different anatomic slabs under the RPE/BM complex to segment and represent the CC layer, and different algorithms and thresholding methods to process the images prior to quantifying the CC FDs.17–20 For example, while SD-OCTA uses a light source with a wavelength of 840 nm, SS-OCTA uses a light source with a longer wavelength (1060 nm) that reduces light scattering by the RPE resulting in better choroidal imaging. In addition, the longer wavelength allows for the use of a higher laser power, which leads to a better signal-to-noise ratio. These factors, together with the denser scan patterns afforded by SS-OCTA instrument, resulted in improved image quality below the RPE and provided better visualization and quantification of the CC FDs than SD-OCTA imaging.21–25
Due to the longer wavelength used in SS-OCTA imaging, it is also possible to obtain full thickness structural images of the choroid using the same scan patterns that were used to obtain angiographic images.26 Unlike other studies that used central B-scans to investigate macular choroidal thickness and vascularity in eyes with GA,20, 27–30 Zhou et.al.26 developed an algorithm that segmented the choroid layer from the entire SS-OCTA volume scans. They used an attenuation correction algorithm to better visualize the choroidal-scleral interface, and their automated algorithms detected the choroidal boundaries and segmented the major choroidal vessels based on the structural information alone. These algorithms measured the mean choroidal thickness (MCT) over the entire scan region and the choroidal vascular volume based on a generated three-dimensional representation of the choroidal vessels. Knowing the entire choroidal volume and choroidal vessel volume from a given scan region, it was possible to evaluate the choroidal vascular volume density, also known as choroidal vascularity index (CVI). By scanning and analyzing 144 normal eyes from subjects in their 20s through their 80s, Zhou et al. reported on the age-dependent changes in the MCT and CVI throughout the 12×12mm scan region and showed that MCT decreases with age while the CVI remained fairly constant.31
In this current study, we imaged eyes with GA secondary to non-exudative AMD using SS-OCTA and analyzed the CC FDs outside of the GA and measured the MCT and CVI throughout the scan region in these eyes. We analyzed the possible correlations of these measurements with the annual square root ERs of GA to determine if the changes in CC perfusion and choroidal parameters could serve as biomarkers to predict disease progression.
MATERIALS AND METHODS
This prospective OCTA imaging study was approved by the institutional review board of the University of Miami Miller School of Medicine. Informed consent was obtained from each subject. This study was performed in accordance with the tenets of the Declaration of Helsinki and complied with the Health Insurance Portability and Accountability Act of 1996.
Patients diagnosed with GA secondary to non-exudative AMD were enrolled into this study and followed from June 2016 through November 2019 using SS-OCTA imaging (PLEX Elite 9000; Carl Zeiss Meditec, Dublin, CA) as previously described.19 GA was identified as a bright area on the en face structural OCT images, which represented axial projections of the volume data within a given depth, and the use of corresponding B-scans confirmed the loss of the RPE and the outer retina (Figure 1).32 To be included in the study, the total area of GA had to be measured at least 2.54 mm2 (one disc area), and for multifocal lesions, the area of at least one focus of GA had to be > 1.25 mm2. Eyes with GA contiguous with parapapillary atrophy were excluded from the study. The atrophic lesions also had to be fully contained within the 6×6 mm scan pattern at baseline and at the one year follow up visit. Exclusion criteria included patients with macular atrophy due to a diagnosis other than non-exudative AMD, any history of exudative macular neovascularization (MNV), and any history of treatment naïve, non-exudative MNV as determined using SS-OCTA.33
Figure 1:

Two eyes with geographic atrophy (GA) secondary to non-exudative age-related macular degeneration imaged using swept source OCTA at the baseline visit and 1 year follow up visit using 6×6 mm scan patterns. A and G: GA from one eye identified as a bright area on en face structure image using a custom slab from 64 μm to 400 μm under Bruch’s membrane (BM) at the baseline and 1 year follow up visits, respectively. B and H: B scans through the GA lesions showing corresponding hyper-transmission defects, loss of RPE and outer retinal layer. C and I: Manually outlined GA boundaries in red at the baseline and 1 year follow up visits, respectively. D and J: GA from a second eye identified as a bright area on en face structure image using a custom slab from 64 μm to 400 μm under BM at the baseline and 1 year follow up visits, respectively. E and K: B scans through GA showing corresponding hyper-transmission defects, loss of RPE and outer retinal layer. F and L: Manually outlined GA boundaries in red at the baseline and 1 year follow up visits, respectively.
SS-OCTA imaging was acquired at the baseline and one-year follow up visits. All subjects were imaged using the 6×6 mm scan pattern centered on the fovea. The SS-OCTA instrument has a laser light source with a central wavelength of 1060 nm, a bandwidth of 100 nm, and a full width at half-maximum axial resolution in tissue of approximately 5 μm with a transverse resolution at the retinal surface of appropriately 20 μm. The instrument operated at a scanning speed of 100,000 A-scans per second. The 6×6 mm scan pattern consisted of 500 A-scans per B-scan, with each B-scan repeated twice at each position to generate the angiography signal, and there were 500 B-scan positions along the 6 mm y-axis that resulted in a uniform spacing of 12 μm between both A-scans and B-scans. Each A-scan had a depth of 3 mm consisting of 1536 pixels per A-scan. Images with a signal strength of less than 7 and images with evident motion artifacts were excluded from the data analysis.
The GA lesions were identified at baseline and at the one year follow up visit using OCTA en face structure images generated using a custom slab that was located from 64 μm to 400 μm below BM as described in previous studies.19, 34 The hyper-transmission signal corresponding to GA on the en face image was confirmed by reviewing the corresponding B-scans. Once an eye qualified for enrollment based on the minimum size requirements for unifocal and multifocal lesions, all additional areas of hyper-transmission having a greatest linear dimension of at least 250 μm were included in the overall measurements. The boundaries of GA were manually outlined by two independent graders (YS and LW) using an image analysis software (Adobe Photoshop CC; Adobe Systems, San Jose, CA) (Figures 1–3, red outlines) and a consensus of drawing boundaries was reached between both graders. If a consensus could not be reached, then a senior grader (PJR) served as the adjudicator. The areas of GA were calculated using the same image analysis software (Adobe Photoshop CC; Adobe Systems, San Jose, CA). After obtaining the areas of the GA lesions from the baseline and one year follow up visits, a square root transformation was applied to calculate the ERs of GA since this strategy decreases the influence of baseline lesion size on the test-retest variability and on the ERs of GA.19, 34 The annualized ERs of GA were defined as the normalized difference in the square root of the area measurements from baseline and one year as described in our previous studies.34
Figure 3:
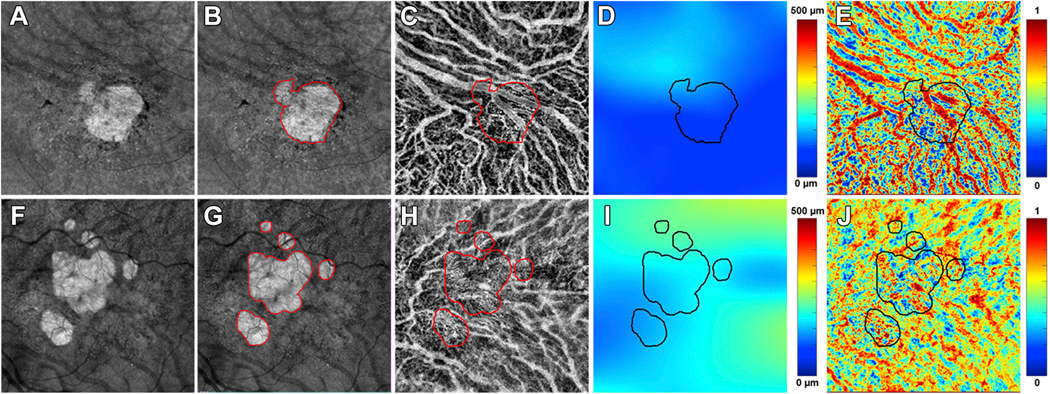
Choroidal analysis of two eyes with geographic atrophy (GA) secondary to non-exudative age-related macular degeneration imaged using swept source OCTA at the baseline visit using 6×6 mm scan patterns. A and F: GA lesions identified at the baseline visit from two eyes on en face structure images using a custom slab from 64 μm to 400 μm under Bruch’s membrane (BM). B and G: Manually outlined GA lesions at baseline visit from two eyes (red outlines). C and H: Choroidal vascular maps generated after applying an algorithm to segment the choroid layer by automatically detecting the choroidal boundary layers. Superimposed red outlines represent the boundaries of the GA lesions. D and I: Choroidal thickness maps with superimposed black outlines representing the boundaries of the GA lesions. The mean choroidal thickness (MCT) was analyzed inside of GA region, outside of GA and the total scan region. D represents one case and the MCT inside of GA region, outside of GA region and in the total scan area were 103.26 μm, 112.88 μm and 111.34 μm, respectively. I represents the other case and the MCT inside of GA region, outside of GA region and in the total scan area were 175.06 μm, 191.89 μm and 189.42 μm, respectively. E and J: choroid vascularity index (CVI) maps generated based on the ratio of choroidal vascular volume to the total choroidal volume. Black outlines represent the boundaries of the GA lesions. CVI was analyzed inside of GA, outside of GA and the total scan region. E represents the same case as showing in D and CVI inside of GA, outside of GA, the total scan area were 0.56, 0.58 and 0.58, respectively. J represents the same case showing in I and CVI inside of GA, outside of GA, the total scan area were 0.56, 0.58 and 0.58, respectively.
The baseline images were used for the quantification of CC FDs around the GA. A detailed description of methods used to process and quantify CC FDs were published in our previous studies.19, 35 Briefly, the detection of angiographic flow information was achieved using the complex optical microangiography (OMAGc) algorithm.21, 36, 37 CC en face flow images were generated by applying a 15 μm thick slab with the inner boundary located 4 μm under BM and then resized to 1024×1024 pixels to be consistent with its original machine output. The retinal projection artifacts were removed prior to compensating the CC en face flow images for signal attenuation caused by overlying structures such as RPE abnormalities (drusen, hyperreflective foci, or RPE migration). Compensation was achieved by using the inverted images that corresponded to the CC en face structural images. CC images then underwent thresholding to generate the CC FD binary maps. In this current study, we used both a global thresholding method and a local thresholding method (the Phansalkar method) to process CC flow images in order to compare our results with publications using different thresholding methods.38–41 Of note, recent papers have addressed the confusion surrounding the appropriate window radius to apply when the Phansalkar local threshold method is chosen. As recommended, we chose a window radius of 3 pixels (18 μm) which provided a more physiological visualization of the CC compared with a fixed window radius of 15 pixels (88 μm), which has been used erroneously in the literature.17, 42 After both methods were used to threshold the images, any CC FDs with a diameter smaller than 24 μm, which represented physiological FDs and speckle noise, were removed from CC FD binary maps before the final CC FD calculations.43
Two different CC FDs parameters were used for the CC quantitation: the percentage of FDs (FD%) and the mean or averaged FD size (MFDS). The CC FD% was defined as the ratio of the number of all pixels representing FDs divided by all the pixels within a given region of analysis, and the CC MFDS was defined as the average area of all isolated regions representing CC FDs within a given region of analysis. Both CC FD% and CC MFDS were analyzed in five different regions outside of the border of GA (Figure 2). The Rim 1 region (R1) is a 1-degree rim region that extends from 0 μm to 300 μm outside of the GA margin (between red outline and purple outline) and CC FDs were color coded as red in R1. The Rim 2 region (R2) is a 1-degree rim region that is located between 300 μm and 600 μm outside of the GA margin (between purple outline and yellow outline) and CC FDs were color coded as purple in R2. The Rim 1+2 region (R1+2) is a 2-degree rim region that combines R1 and R2 and extends from 0 μm to 600 μm outside of GA margin (between red outline and yellow outline). The Rim 3 (R3) region is the region of the total scan area minus the region of the GA, R1, and R2 (outside of the yellow outlines) and CC FDs were color-coded as green in R3. The final region used for CC quantification in this study is the total scan area minus the GA region (outside of the red outline), including the CC FDs color-coded as red, purple and green.
Figure 2:
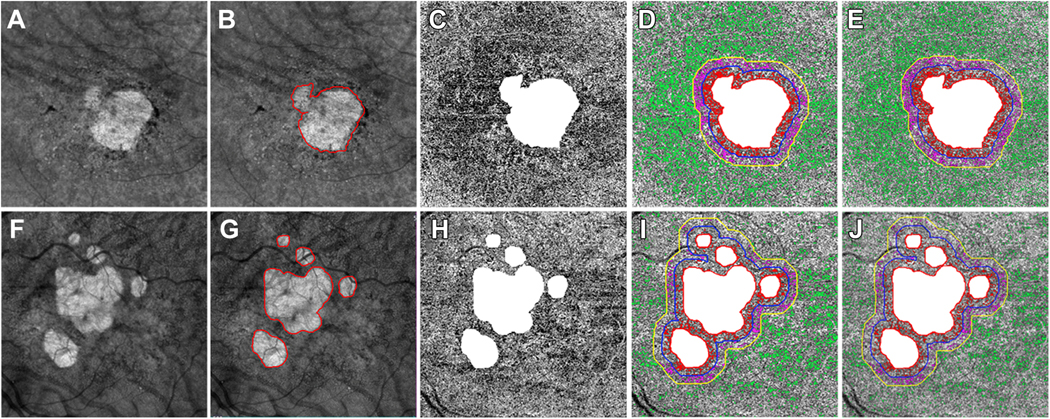
Choriocapillaris (CC) analysis in two eyes with geographic atrophy (GA) secondary to non-exudative age-related macular degeneration imaged using swept source OCTA at the baseline visit using 6×6 mm scan patterns. A and F: GA lesions identified as a bright area on en face structure images using a custom slab from 64 μm to 400 μm under Bruch’s membrane (BM) at the baseline visit from two eyes. B and G: Manually outlined GA lesions at the baseline visits for the two eyes (red outlines). C and H: CC en face flow images using a 15 μm thick slab with inner boundary located 4 μm under BM. The area of GA was masked as white and excluded from CC analysis. D and I: CC flow deficits (FDs) analyzed in different regions when using a global threshold method. White: The area of GA lesions which was excluded from CC FDs analysis. R1: CC FDs were colored coded as red in R1 region extending from 0 μm to 300 μm outside of GA border. R2: CC FDs were colored coded as purple in R2 region extending from >300 μm - 600 μm outside of GA border. R3: CC FDs were colored coded as green in the R3 region correspond to the total scan region minus the GA region, R1 and R2. E and J: CC FDs analyzed in different regions when using a local threshold method (Phansalkar method with a window radius of 3 pixels = 18 μm). White: The area of GA lesions which was excluded from CC FDs analysis. R1: CC FDs were colored coded as red CC FDs in R1 region extending from 0 μm to 300 μm outside of GA border. R2: CC FDs were colored coded as purple in R2 region extending from >300 μm to 600 μm outside of GA border. R3: CC FDs were colored coded as green in the R3 region corresponds to the total scan region minus the GA region, R1 and R2.
SS-OCT scans at the baseline visit were used for choroidal measurements. The choroidal layer was segmented using a previously published automated algorithm that detects the boundaries of both BM and the bottom of the choroidal vessels, which is defined as choroidal-scleral interface.26 As described in our previous studies, the algorithm corrects for OCT signal attenuation, which enhances the contrast of the choroidal vessels and the choroidal-scleral interface and achieves more accurate choroidal layer segmentation. After segmenting the choroidal layer, a color-coded en face choroidal thickness map was generated based on the distance between BM and the choroidal-scleral interface. The MCT was calculated as the mean value of the choroidal thickness measurements over the analyzed region. In this current study, MCT was calculated in three regions: inside of the GA, outside of the GA, and within the total scan (Figure 3). In addition to measuring MCT using this algorithm, a three-dimensional representation of the choroidal vessels was generated by segmenting the vessels from the choroidal slab after attenuation compensation. Otsu’s global threshold method was applied to segment the dark choroidal vessel lumen in the choroid and the brightness was inverted to represent the choroidal vessels in the images.26 CVI was calculated as the ratio of the choroidal vessel volume to the total choroidal volume within a given region. Similar to MCT, the CVI was also analyzed in three regions: inside of the GA, outside of the GA, and within the total scan.
To detect RPD in these eyes with GA, the graders generated a custom en face structure image for each eye using a 20 μm thick slab that followed the RPE contour and was positioned 20 μm above the RPE on the 12×12 mm scan using baseline images, and the graders reached a consensus diagnosis of whether RPD were present as previously described.19
The Pearson’s correlation coefficient was used to evaluate the relationship between the square root ERs of GA with the CC FD% and CC MFDS measurements generated using both thresholding methods and the MCT and CVI measurements. In addition, the Pearson’s correlation coefficient was used to evaluate relationships between CC FD measurements and choroidal measurements and for the comparison of correlations between MCT and CVI in normal eyes and in eyes with GA. The 2-sample t test was used to compare the annual square root ERs of GA with the CC FDs, the choroidal measurements, and in eyes with RPD and without RPD. Statistical analyses were performed with IBM SPSS Statistics for Windows, Version 25.0 (IBM Corporation, Armonk, NY) with a P value of < 0.05 considered to be statistically significant.
RESULTS
A total of 38 eyes from 27 patients with GA secondary to non-exudative AMD were enrolled in this study. Of these 38 eyes, 22 eyes were reported previously, and the areas of GA were confirmed for this current report.19 The average age of these patients was 81.4 years old (SD: 7.54; Range: 62.9 – 93.1), and 52% of these patients were women. The average follow-up time was 12.0 months (SD: 0.06; Range: 10.4 – 13.2). The average area of GA at baseline was 4.98 mm2 (SD: 1.76), the average area of GA at the one-year follow up visit was 6.52 mm2 (SD: 2.16), and the average square root ER of GA was 0.31 mm/year (SD: 0.15; Median: 0.28; Range: 0.11 – 0.78). Out of these 38 eyes, 35 eyes from 25 patients were diagnosed with RPD. Out of these 38 eyes diagnosed with GA, there are 31 eyes with subfoveal GA involvement and 7 eyes with GA that did not involve the subfoveal region based on OCT images. The annual square root ER of eyes with central GA involving the fovea was 0.30 mm/year (SD: 0.14) and the annual square root ER of eyes with non-central GA was 0.39 mm/year (SD: 0.14). There was no significant difference in the ER of GA based on foveal involvement (P = 0.13, t-test). Out of these 38 eyes, there were 26 eyes with multifocal GA lesions and 12 eyes with unifocal GA lesions. The annual square root ER of eyes with unifocal GA lesions was 0.31 mm/year (SD: 0.16) and the annual square root ER of eyes with multifocal GA lesions was 0.33 mm/year (SD: 0.11). There was no significant difference in GA ERs between multifocal and unifocal GA lesions (P = 0.662, t-test).
The CC FD% measurements were analyzed in five different regions for each eye. When using the global threshold method, the CC FD% in R1, R2, R1+2, R3, and the total scan area minus GA region were 27.57% (SD: 9.29), 22.30% (SD: 8.45), 25.01% (SD: 8.35), 12.77% (SD: 3.73), and 15.59% (SD: 3.67), respectively, as shown in Table 1. CC FD% processed using the global threshold method in each region were all highly correlated with the annual square root ERs of GA, with r = 0.450 (P < 0.005), r = 0.524 (P < 0.005), r = 0.515 (P < 0.005), r = 0.459 (P < 0.005), r = 0.626 (P < 0.001), respectively, as shown in Table 1. There was no one region that was superior for predicting the ERs of GA (P = 0.354). When using the Phansalkar local threshold method with a window radius of 3 pixels (18 μm), the CC FD% in R1, R2, R1+2, R3, and total scan area minus GA region were 25.15% (SD: 10.44), 21.55% (SD: 9.70), 23.42% (SD: 9.81), 14.26% (SD: 5.64), and 16.52% (SD: 6.44), respectively, as shown in Table 1. CC FD% processed using this local threshold in each region were all highly correlated with the annual square root ERs of GA growth, with r = 0.624 (P < 0.001), r = 0.650 (P < 0.001), r = 0.653 (P < 0.001), r = 0.568 (P < 0.001), r = 0.608 (P < 0.001), respectively, as shown in Table 1. Once again, there was no one region that was superior for predicting the ERs of GA (P = 0.588). Similarly, CC MFDS measurements from each region were also highly correlated with annual square root ERs of GA when using both the global and local threshold methods. No one region was superior for predicting GA growth (P = 0.167 and P = 0.431, respectively). Table 1 shows the values of CC FDs in each analyzed region and their correlations with annual square root ERs of GA.
Table 1:
Correlations between choriocapillaris flow deficits at baseline and the annual square root enlargement rates of geographic atrophy in different regions
| CC FDs Parameters | Regions of Interest | CC FDs: Global Threshold Method Mean (SD) | Pearson r, P value* | CC FDs: Local Threshold Method Mean (SD) | Pearson r, P value* |
|---|---|---|---|---|---|
| CC FD% | Rim1 (0–300 μm) | 27.57 (9.29) | r = 0.450, P < 0.005 | 25.15 (10.44) | r = 0.624, P < 0.001 |
| Rim2 (>300–600 μm) | 22.30 (8.45) | r = 0.524, P < 0.005 | 21.55 (9.70) | r = 0.650, P < 0.001 | |
| Rim1+2 (0– 600 μm) | 25.01 (8.35) | r = 0.515, P < 0.005 | 23.42 (9.81) | r = 0.653, P < 0.001 | |
| Rim3 (Total scan area minus GA + R1+2) | 12.77 (3.73) | r = 0.459, P < 0.005 | 14.26 (5.64) | r = 0.568, P < 0.001 | |
| Total scan area minus GA | 15.59 (3.67) | r = 0.626, P < 0.001 | 16.52 (6.44) | r = 0.608, P < 0.001 | |
|
CC MFDS
(Unit: mm2) |
Rim1 (0–300 μm) | 0.0047 (0.0025) | r = 0.497, P < 0.005 | 0.0023 (0.0018) | r = 0.553, P < 0.001 |
| Rim2 (>300–600 μm) | 0.0032 (0.0014) | r = 0.645, P < 0.001 | 0.0017 (0.0009) | r = 0.666, P < 0.001 | |
| Rim1+2 (0– 600 μm) | 0.0046 (0.0024) | r = 0.640, P < 0.001 | 0.0022 (0.0015) | r = 0.643, P < 0.001 | |
| Rim3 (Total scan area minus GA + R1+2) | 0.0026 (0.0006) | r = 0.526, P < 0.005 | 0.0013 (0.0004) | r = 0.568, P < 0.001 | |
| Total scan area minus GA | 0.0032 (0.0008) | r = 0.679, P < 0.001 | 0.0015 (0.0006) | r = 0.614, P < 0.001 |
CC: choriocapillaris; FDs: flow deficits; FD%: flow deficits percentage; MFDS: mean or averaged flow deficits size, unit: mm2 SD: standard deviation; Global threshold method: standard deviation (SD) method; Local threshold method: Phansalkar method with window radius of 3 pixels (18 μm).
No statistically significance differences were found between different regions when comparing the correlation of CC FDs and GA ERs in different regions: All P ≥ 0.167.
The MCT measurements inside the GA region, outside the GA region, and in the total scan area were 155.75 μm (SD: 88.33), 151.83 μm (SD: 77.51) and 151.42 μm (SD: 77.86), respectively. The CVI measurements inside the area of GA, outside the area of GA, and in the total scan area were 0.57 (SD: 0.04), 0.59 (SD: 0.03) and 0.59 (SD: 0.03), respectively. The only choroidal parameter that appeared to have a significant relationship with the annual square root ERs of GA was the CVI measurements inside the GA region (Table 2; r = −0.35, P = 0.03). None of the other measurements correlated with annual square root ERs of GA, as shown in Table 2.
Table 2:
Correlations between choroid measurements at baseline and the annual square root enlargement rates of geographic atrophy in different regions
| Choroidal Parameters | Regions of Interest | Mean (SD) | Pearson r | P value |
|---|---|---|---|---|
| MCT (Unit: μm) | Inside of GA | 155.75 (88.33) | −0.21 | 0.22 |
| Outside of GA | 151.83 (77.51) | −0.24 | 0.15 | |
| Total scan area | 151.42 (77.86) | −0.23 | 0.16 | |
| CVI | Inside of GA | 0.57 (0.04) | −0.35 | 0.03 |
| Outside of GA | 0.59 (0.03) | −0.29 | 0.07 | |
| Total scan area | 0.59 (0.03) | −0.30 | 0.07 |
MCT: mean choroid thickness, unit: μm; CVI: choroidal vasculature index; GA: geographic atrophy; SD: standard deviation
When correlating CC FDs and choroidal measurements that were analyzed in the same region (the total scan minus GA region), we found none of the CC FD% or CC MFDS measurements using either global thresholding or local thresholding methods had any significant correlations with the MCT measurements from that region. Similarly, no significant correlations were found between CC FD% or CC MFDS and CVI measurements from the same region.
While there were no correlations between the CC FD measurements and MCT or CVI measurements when analyzed separately, we did find an unusual relationship between the MCT and CVI when examined in eyes with GA compared with normal eyes that has been reported in our previous study.39 When compared with our reference database of 144 normal eyes with an average age: 55.1 years old (SD: 19.6; Range: 19 – 88),39 we found that the CVI was lower in eyes with GA compared with normal eyes for a given MCT (Figure 4). In normal eyes, we found the CVI to be fairly constant over a wide range of MCT measurements in different regions of the posterior pole, and across different ages.39 However, in eyes with GA, we found a significant correlation between MCT and CVI in regions inside the GA, outside the GA, and throughout the total scan area (r = 0.48, P = 0.002; r = 0.65, P < 0.001; r = 0.65, P < 0.001, respectively), while in the normal eyes, there was no significant correlation between MCT and CVI in the total scan area (P > 0.08). After adjusting for age, there were significant differences between the MCT and CVI measurements in eyes with GA compared with normal eyes as shown in Figure 4 (all P < 0.001).
Figure 4:

Correlations between mean choroid thickness (MCT) and choroidal vascular index (CVI) in eyes with geographic atrophy (GA) and normal eyes. A, B, C: In the total scan area, no significant correlation was observed between MCT and CVI in normal eyes (r = −0.15, P = 0.081). A. In the total scan area, a significant correlation was observed between the MCT and CVI in eyes with GA (r = 0.65, P < 0.001). B: Inside the areas of GA, a significant correlation between MCT and CVI was observed in eyes with GA (r = 0.48, P = 0.002). C: Outside the areas of GA, a significant correlation between MCT and CVI was observed in eyes with GA (r = 0.65, P < 0.001). MCT and CVI had significant differences in eyes with GA compared with normal eyes after adjusting for age (all P < 0.001).
When analyzing eyes with RPD, we found no significant difference in annual square root ERs of GA in eyes with RPD at baseline compared with eyes without RPD (P = 0.08). Similarly, the presence of RPD was not correlated with CC FDs in any analyzed regions. Moreover, the presence of RPD was not correlated with MCT and CVI measured inside of the GA, outside of the GA, or in the total scan area.
DISCUSSION
In this study, we confirmed our previous report that CC FDs measurements in the surrounding regions outside of the GA correlated with the annual ERs of GA.19 However, in our previous report, it appeared that the relationship was strongest when we excluded the area of GA and correlated the ER with CC FD% throughout the remaining scan area even though all the surrounding regions had some degree of significant correlation with the ERs.19 As in our previous report, we continued to find the highest CC FD% and MFDS measurements within 600 μm of the GA margins, which corresponded to the R1 + R2 regions closest to the margin of GA. Now that we’ve added more patients with GA to our cohort in this current study, we confirmed that the R1 + R2 regions still had the highest FD% and MFDS measurements, but the correlations between CC FDS and the ERs of GA are now similar in all the regions, regardless of whether they are close to the margin or further away (Table 1). These findings were consistent when we used both thresholding methods to calculate CC FD% and CC MFDS. Our results are now consistent with the GA ER correlations reported by Moult et al.18 However, these findings differ from other reports showing that the region within 500 μm around the margin of GA correlates best with the ERs of GA.17, 42 Why do different studies report different regional correlations with growth rates? The most likely explanation is that our studies and the study from Moult et al. that show the more extensive correlations between ERs of GA and CC FDs were performed using SS-OCTA imaging,18, 19 while the other studies were performed using SD-OCTA imaging.17, 20 Other possible explanations include differences in the position of the CC slab used to generate the CC en face flow images, differences in image processing, including different thresholding parameters, and differences in the population of patients with GA. Regardless of any explanation, we are now assured that the differences cannot be explained based on the thresholding methods used for image processing because we used the recommended settings for both the global and local thresholding techniques and the results were the same. We now know that when properly applied, both methods yield similar outcomes.
The current study also analyzed the relationship between the ERs of GA and two different choroidal parameters, the MCT and CVI measurements. Interestingly, when using the Pearson correlation, we found a significant correlation between the ERs of GA and the CVI measurement within the area of GA (r = −0.35, P = 0.03). Of note, no other MCT and CVI measurements were correlated with the annual square root ERs of GA; however, the relationship between the GA ERs and the CVI outside the GA and throughout the scan area may become significant as additional cases are studied (Table 2, P = 0.07). Moreover, we did find an unusual relationship between the CVI and MCT measurements in eyes with GA in all the analyzed areas (within the GA, outside the GA, and throughout the scan area) as shown in Figure 4. These results show that for a given choroidal thickness, the CVI is lower than expected when compared with the normal control population. A low CVI means that the choroidal vessels occupy a lower volume than expected for a given choroidal volume. This implies that there’s less blood in the choroidal vessels for a given choroidal volume in eyes with GA secondary to non-exudative AMD compared with age-matched normal eyes. When this is considered along with the increase in CC FD measurements outside of the GA and the correlations that exist between these CC FDs and the ERs of GA, the possibility exists that a decrease in choroidal perfusion is driving this decrease in the CVI, and this decrease in choroidal perfusion may contribute to the decrease in CC perfusion represented by the increase in CC FDs. If this is the case, then we might expect a significant relationship between the CVI and the CC FDs measurements, however, this relationship was not observed in this study (Figure 4). One explanation might be that the CVI is less sensitive to changes in choroidal perfusion when compared with our ability to detect CC FDs as a measurement of perfusion changes. Interestingly, we did observe a correlation between the CVI within GA and the ERs of GA that was statistically significant, but it was not possible to segment and reliably quantify any remaining CC within the region of GA due to the difficulties in distinguishing between the CC and the anteriorly displaced Sattler’s layer.44 Another possibility to explain the decrease in the choroidal vascular volume would be to invoke a feedback mechanism that decreases choroidal perfusion when there is a loss of macular CC perfusion or it may be the result of direct complement-mediated damage to the choroidal vessels as AMD progresses. All these possibilities are areas of ongoing investigation.
Consistent without our previous study, the presence of RPD at baseline did not correlate with the annual ERs of GA nor the CC FDs at baseline in any region. This study also showed that the presence of RPD at baseline did not correlate with MCT and CVI measurements at baseline in any region analyzed. While RPD may be associated with increased CC FDs in eyes without GA, we were unable to show any difference in eyes with GA.19 However, it is well known that quantifying RPD is a difficult task in eyes with GA since RPD can be transient in late AMD and different studies use different detection thresholds for diagnosing RPD.12, 45–48 Nevertheless, we were unable to correlate the severity of GA progression or the choroidal measurements with the presence of RPD in eyes with GA.
Limitations of this current study include a small sample size of 38 eyes; however, given the fact that we established statistically significant correlations that only improved with our increased sample size compared with our previous study, we fully expect these correlations to persist even as our sample size increases. However, with a larger sample size, it may be possible to uncover correlations between CVI measurements and GA ERs and CC FDs. Another limitation is the lack of ground truth about CC visualization using OCTA in vivo. However, with the evolution of OCTA technology and algorithms, the visualization and quantitation of CC FDs will improve. Lastly, we have a small sample size of eyes without RPD, thus the association between GA ERs, CC FDs and choroidal measurements with presence of RPD will continue to be explored. However, as mentioned previously, there needs to be a consensus on the diagnosis and quantitation of RPD for future studies.
In conclusion, we investigated CC FDs, MCT, and CVI in eyes with GA. We found that CC FD measurements within the entire scan area outside of the GA were highly correlated with the annual square root ERs of GA. While the MCT measurements were not correlated with the ER of GA, the CVI measurements inside GA region appeared to be correlated with the ERs of GA while the CVI measurements outside the GA were not correlated. We also found that the CVI measurements were unusually low for a given MCT in these eyes. This observation suggests that the decreased CVI is the result of a decrease in the choroidal vascular volume that is greater than expected for a given MCT, which may reflect a decrease in choroidal perfusion, and this decreased perfusion may contribute to the increase in CC flow impairment that appears to correlate with the ERs of GA.
ACKNOWLEDGMENTS/DISCLOSURES:
a. Funding/Support: Research supported by grants from the National Eye Institute (R01EY028753), Carl Zeiss Meditec, Inc. (Dublin, CA), the Salah Foundation, an unrestricted grant from the Research to Prevent Blindness, Inc., New York, NY, and the National Eye Institute Center Core Grant (P30EY014801) to the Department of Ophthalmology, University of Miami Miller School of Medicine. The funding organizations had no role in the design or conduct of this research.
b. Financial Disclosures: Dr. Gregori, Dr. Wang and Dr. Rosenfeld received research support from Carl Zeiss Meditec, Inc. Dr. Gregori and the University of Miami co-own a patent that is licensed to Carl Zeiss Meditec, Inc.
Dr. Rosenfeld also receives additional research funding from Stealth BioTherapeutics. He is also a consultant for Apellis, Biogen, Boehringer-Ingelheim, Carl Zeiss Meditec, Chengdu Kanghong Biotech, EyePoint, Ocunexus Therapeutics, Ocudyne, and Unity Biotechnology. He also has equity interest in Apellis, Valitor, Verana Health, and Ocudyne.
Dr. Wang discloses intellectual property owned by the Oregon Health and Science University and the University of Washington. Dr. Wang also receives research support from Moptim Inc, Colgate Palmolive Company and Facebook technologies LLC. He is a consultant to Insight Photonic Solutions, Kowa, and Carl Zeiss Meditec.
The remaining authors have no disclosures.
c. Other Acknowledgments: None.
Footnotes
Publisher's Disclaimer: This is a PDF file of an unedited manuscript that has been accepted for publication. As a service to our customers we are providing this early version of the manuscript. The manuscript will undergo copyediting, typesetting, and review of the resulting proof before it is published in its final form. Please note that during the production process errors may be discovered which could affect the content, and all legal disclaimers that apply to the journal pertain.
REFERENCES
- 1.Ferris FL 3rd, Wilkinson CP, Bird A, et al. Clinical classification of age-related macular degeneration. Ophthalmology 2013;120:844–51. [DOI] [PMC free article] [PubMed] [Google Scholar]
- 2.Sadda SR, Guymer R, Holz FG, et al. Consensus Definition for Atrophy Associated with Age-Related Macular Degeneration on OCT: Classification of Atrophy Report 3. Ophthalmology 2018;125:537–548. [DOI] [PMC free article] [PubMed] [Google Scholar]
- 3.Bird AC, Phillips RL, Hageman GS. Geographic atrophy: a histopathological assessment. JAMA Ophthalmol 2014;132:338–45. [DOI] [PMC free article] [PubMed] [Google Scholar]
- 4.Sarks J, Arnold J, Ho IV, Sarks S, Killingsworth M. Evolution of reticular pseudodrusen. Br J Ophthalmol 2011;95:979–85. [DOI] [PubMed] [Google Scholar]
- 5.Clemons TE, Milton RC, Klein R, Seddon JM, Ferris FL 3rd, Age-Related Eye Disease Study Research G. Risk factors for the incidence of Advanced Age-Related Macular Degeneration in the Age-Related Eye Disease Study (AREDS) AREDS report no. 19. Ophthalmology 2005;112:533–9. [DOI] [PMC free article] [PubMed] [Google Scholar]
- 6.Arnold JJ, Sarks SH, Killingsworth MC, Sarks JP. Reticular pseudodrusen. A risk factor in age-related maculopathy. Retina 1995;15:183–91. [PubMed] [Google Scholar]
- 7.Bhutto I, Lutty G. Understanding age-related macular degeneration (AMD): relationships between the photoreceptor/retinal pigment epithelium/Bruch’s membrane/choriocapillaris complex. Mol Aspects Med 2012;33:295–317. [DOI] [PMC free article] [PubMed] [Google Scholar]
- 8.Christenbury JG, Folgar FA, O’Connell RV, et al. Progression of intermediate age-related macular degeneration with proliferation and inner retinal migration of hyperreflective foci. Ophthalmology 2013;120:1038–45. [DOI] [PMC free article] [PubMed] [Google Scholar]
- 9.Marsiglia M, Boddu S, Bearelly S, et al. Association between geographic atrophy progression and reticular pseudodrusen in eyes with dry age-related macular degeneration. Invest Ophthalmol Vis Sci 2013;54:7362–9. [DOI] [PMC free article] [PubMed] [Google Scholar]
- 10.McLeod DS, Grebe R, Bhutto I, Merges C, Baba T, Lutty GA. Relationship between RPE and choriocapillaris in age-related macular degeneration. Invest Ophthalmol Vis Sci 2009;50:4982–91. [DOI] [PMC free article] [PubMed] [Google Scholar]
- 11.Niu S, de Sisternes L, Chen Q, Rubin DL, Leng T. Fully Automated Prediction of Geographic Atrophy Growth Using Quantitative Spectral-Domain Optical Coherence Tomography Biomarkers. Ophthalmology 2016;123:1737–1750. [DOI] [PubMed] [Google Scholar]
- 12.Veerappan M, El-Hage-Sleiman AM, Tai V, et al. Optical Coherence Tomography Reflective Drusen Substructures Predict Progression to Geographic Atrophy in Age-related Macular Degeneration. Ophthalmology 2016;123:2554–2570. [DOI] [PMC free article] [PubMed] [Google Scholar]
- 13.Wightman AJ, Guymer RH. Reticular pseudodrusen: current understanding. Clin Exp Optom 2019;102:455–462. [DOI] [PubMed] [Google Scholar]
- 14.Lei J, Balasubramanian S, Abdelfattah NS, Nittala MG, Sadda SR. Proposal of a simple optical coherence tomography-based scoring system for progression of age-related macular degeneration. Graefes Arch Clin Exp Ophthalmol 2017;255:1551–1558. [DOI] [PubMed] [Google Scholar]
- 15.Waheed NK, Moult EM, Fujimoto JG, Rosenfeld PJ. Optical Coherence Tomography Angiography of Dry Age-Related Macular Degeneration. Dev Ophthalmol 2016;56:91–100. [DOI] [PMC free article] [PubMed] [Google Scholar]
- 16.Choi W, Moult EM, Waheed NK, et al. Ultrahigh-Speed, Swept-Source Optical Coherence Tomography Angiography in Nonexudative Age-Related Macular Degeneration with Geographic Atrophy. Ophthalmology 2015;122:2532–44. [DOI] [PMC free article] [PubMed] [Google Scholar]
- 17.Alagorie AR, Nassisi M, Verma A, et al. Relationship between proximity of choriocapillaris flow deficits and enlargement rate of geographic atrophy. Graefes Arch Clin Exp Ophthalmol 2020;258:995–1003. [DOI] [PubMed] [Google Scholar]
- 18.Moult EM, Waheed NK, Novais EA, et al. Swept-Source Optical Coherence Tomography Angiography Reveals Choriocapillaris Alterations in Eyes with Nascent Geographic Atrophy and Drusen-Associated Geographic Atrophy. Retina 2016;36 Suppl 1:S2–S11. [DOI] [PMC free article] [PubMed] [Google Scholar]
- 19.Thulliez M, Zhang Q, Shi Y, et al. Correlations between Choriocapillaris Flow Deficits around Geographic Atrophy and Enlargement Rates Based on Swept-Source OCT Imaging. Ophthalmol Retina 2019;3:478–488. [DOI] [PMC free article] [PubMed] [Google Scholar]
- 20.Nassisi M, Shi Y, Fan W, et al. Choriocapillaris impairment around the atrophic lesions in patients with geographic atrophy: a swept-source optical coherence tomography angiography study. Br J Ophthalmol 2019;103:911–917. [DOI] [PubMed] [Google Scholar]
- 21.An L, Wang RK. In vivo volumetric imaging of vascular perfusion within human retina and choroids with optical micro-angiography. Opt Express 2008;16:11438–52. [DOI] [PubMed] [Google Scholar]
- 22.Fingler J, Schwartz D, Yang C, Fraser SE. Mobility and transverse flow visualization using phase variance contrast with spectral domain optical coherence tomography. Opt Express 2007;15:12636–53. [DOI] [PubMed] [Google Scholar]
- 23.Jonathan E, Enfield J, Leahy MJ. Correlation mapping method for generating microcirculation morphology from optical coherence tomography (OCT) intensity images. J Biophotonics 2011;4:583–7. [DOI] [PubMed] [Google Scholar]
- 24.Ferrara D, Waheed NK, Duker JS. Investigating the choriocapillaris and choroidal vasculature with new optical coherence tomography technologies. Prog Retin Eye Res 2016;52:130–55. [DOI] [PubMed] [Google Scholar]
- 25.Mariampillai A, Standish BA, Moriyama EH, et al. Speckle variance detection of microvasculature using swept-source optical coherence tomography. Opt Lett 2008;33:1530–2. [DOI] [PubMed] [Google Scholar]
- 26.Zhou H, Chu Z, Zhang Q, et al. Attenuation correction assisted automatic segmentation for assessing choroidal thickness and vasculature with swept-source OCT. Biomed Opt Express 2018;9:6067–6080. [DOI] [PMC free article] [PubMed] [Google Scholar]
- 27.Giannaccare G, Pellegrini M, Sebastiani S, et al. Choroidal Vascularity Index Quantification in Geographic Atrophy Using Binarization of Enhanced-Depth Imaging Optical Coherence Tomographic Scans. Retina 2020;40:960–965. [DOI] [PubMed] [Google Scholar]
- 28.Iovino C, Pellegrini M, Bernabei F, et al. Choroidal Vascularity Index: An In-Depth Analysis of This Novel Optical Coherence Tomography Parameter. J Clin Med 2020;9. [DOI] [PMC free article] [PubMed] [Google Scholar]
- 29.Lindner M, Bezatis A, Czauderna J, et al. Choroidal thickness in geographic atrophy secondary to age-related macular degeneration. Invest Ophthalmol Vis Sci 2015;56:875–82. [DOI] [PubMed] [Google Scholar]
- 30.Thorell MR, Goldhardt R, Nunes RP, et al. Association Between Subfoveal Choroidal Thickness, Reticular Pseudodrusen, and Geographic Atrophy in Age-Related Macular Degeneration. Ophthalmic Surg Lasers Imaging Retina 2015;46:513–21. [DOI] [PubMed] [Google Scholar]
- 31.Zhou H, Dai Y, Shi Y, et al. Age-Related Changes in Choroidal Thickness and the Volume of Vessels and Stroma Using Swept-Source OCT and Fully Automated Algorithms. Ophthalmol Retina 2020;4:204–215. [DOI] [PMC free article] [PubMed] [Google Scholar]
- 32.Wu Z, Luu CD, Ayton LN, et al. Optical coherence tomography-defined changes preceding the development of drusen-associated atrophy in age-related macular degeneration. Ophthalmology 2014;121:2415–22. [DOI] [PubMed] [Google Scholar]
- 33.Roisman L, Zhang Q, Wang RK, et al. Optical Coherence Tomography Angiography of Asymptomatic Neovascularization in Intermediate Age-Related Macular Degeneration. Ophthalmology 2016;123:1309–19. [DOI] [PMC free article] [PubMed] [Google Scholar]
- 34.Yehoshua Z, Rosenfeld PJ, Gregori G, et al. Progression of geographic atrophy in age-related macular degeneration imaged with spectral domain optical coherence tomography. Ophthalmology 2011;118:679–86. [DOI] [PMC free article] [PubMed] [Google Scholar]
- 35.Zheng F, Zhang Q, Shi Y, et al. Age-dependent Changes in the Macular Choriocapillaris of Normal Eyes Imaged With Swept-Source Optical Coherence Tomography Angiography. Am J Ophthalmol 2019;200:110–122. [DOI] [PMC free article] [PubMed] [Google Scholar]
- 36.Wang RK. Directional blood flow imaging in volumetric optical microangiography achieved by digital frequency modulation. Opt Lett 2008;33:1878–80. [DOI] [PMC free article] [PubMed] [Google Scholar]
- 37.Wang RK. Three-dimensional optical micro-angiography maps directional blood perfusion deep within microcirculation tissue beds in vivo. Phys Med Biol 2007;52:N531–7. [DOI] [PubMed] [Google Scholar]
- 38.Zhang Q, Zheng F, Motulsky EH, et al. A Novel Strategy for Quantifying Choriocapillaris Flow Voids Using Swept-Source OCT Angiography. Invest Ophthalmol Vis Sci 2018;59:203–211. [DOI] [PMC free article] [PubMed] [Google Scholar]
- 39.Chu Z, Cheng Y, Zhang Q, et al. Quantification of Choriocapillaris with Phansalkar Local Thresholding: Pitfalls to Avoid. Am J Ophthalmol 2020;213:161–176. [DOI] [PMC free article] [PubMed] [Google Scholar]
- 40.Chu Z, Gregori G, Rosenfeld PJ, Wang RK. Quantification of Choriocapillaris with Optical Coherence Tomography Angiography: A Comparison Study. Am J Ophthalmol 2019;208:111–123. [DOI] [PMC free article] [PubMed] [Google Scholar]
- 41.Chu Z, Zhang Q, Zhou H, et al. Quantifying choriocapillaris flow deficits using global and localized thresholding methods: a correlation study. Quant Imaging Med Surg 2018;8:1102–1112. [DOI] [PMC free article] [PubMed] [Google Scholar]
- 42.Nassisi M, Baghdasaryan E, Borrelli E, Ip M, Sadda SR. Choriocapillaris flow impairment surrounding geographic atrophy correlates with disease progression. PLoS One 2019;14:e0212563. [DOI] [PMC free article] [PubMed] [Google Scholar]
- 43.Zhang Q, Shi Y, Zhou H, et al. Accurate estimation of choriocapillaris flow deficits beyond normal intercapillary spacing with swept source OCT angiography. Quant Imaging Med Surg 2018;8:658–666. [DOI] [PMC free article] [PubMed] [Google Scholar]
- 44.Nesper PL, Lutty GA, Fawzi AA. Residual choroidal vessels in atrophy can masquerade as choroidal neovascularization on optical coherence tomography angiography: Introducing a Clinical and Software Approach. Retina 2018;38:1289–1300. [DOI] [PMC free article] [PubMed] [Google Scholar]
- 45.Cohen SY, Dubois L, Tadayoni R, Delahaye-Mazza C, Debibie C, Quentel G. Prevalence of reticular pseudodrusen in age-related macular degeneration with newly diagnosed choroidal neovascularisation. Br J Ophthalmol 2007;91:354–9. [DOI] [PMC free article] [PubMed] [Google Scholar]
- 46.Schaal KB, Legarreta AD, Feuer WJ, et al. Comparison between Widefield En Face Swept-Source OCT and Conventional Multimodal Imaging for the Detection of Reticular Pseudodrusen. Ophthalmology 2017;124:205–214. [DOI] [PubMed] [Google Scholar]
- 47.Zarubina AV, Neely DC, Clark ME, et al. Prevalence of Subretinal Drusenoid Deposits in Older Persons with and without Age-Related Macular Degeneration, by Multimodal Imaging. Ophthalmology 2016;123:1090–100. [DOI] [PMC free article] [PubMed] [Google Scholar]
- 48.Zweifel SA, Imamura Y, Spaide TC, Fujiwara T, Spaide RF. Prevalence and significance of subretinal drusenoid deposits (reticular pseudodrusen) in age-related macular degeneration. Ophthalmology 2010;117:1775–81. [DOI] [PubMed] [Google Scholar]